Social Media and E-mail Marketing Campaigns: Symmetry versus Convergence


1
Department of Accounting, Business Information Systems and Statistics, Faculty of Economics and Business Administration, Alexandru Ioan Cuza University of Iasi, 700506 Iaşi, Romania
2
Doctoral School of Economics and Business Administration (DSEBA), Alexandru Ioan Cuza University of Iasi, 700057 Iaşi, Romania
*
Author to whom correspondence should be addressed.
Symmetry 2020, 12(12), 1940; https://doi.org/10.3390/sym12121940
Submission received: 26 October 2020
/
Revised: 18 November 2020
/
Accepted: 23 November 2020
/
Published: 25 November 2020
(This article belongs to the Special Issue Multi-Criteria Decision-Making Techniques for Improvement Sustainability Engineering Processes II)
Abstract
:Companies use social business intelligence (SBI) to identify and collect strategically significant information from a wide range of publicly available data sources, such as social media (SM). This study is an SBI-driven analysis of a company operating in the insurance sector. It underlines the contribution of SBI technology to sustainable profitability of a company by using an optimized marketing campaign on Facebook, in symmetry with a traditional e-mail campaign. Starting from a campaign on SM, the study identified a client portfolio, processed data, and applied a set of statistical methods, such as the index and the statistical significance (T-test), which later enabled the authors to validate research hypotheses (RH), and led to relevant business decisions. The study outlines the preferences of the selected group of companies for the manner in which they run a marketing campaign on SM in symmetry with an e-mail-run campaign. Although the study focused on the practical field of insurance, the suggested model can be used by any company of any industry proving that BI technologies is the nexus of collecting and interpreting results that are essential, globally applicable, and lead to sustainable development of companies operating in the age of globalization. The results of the study prove that symmetrical unfolding (time and opportunity symmetry) of SM marketing campaigns, and using email, could lead to better results compared to two separate marketing campaigns. Moreover, the outcomes of both campaigns showed convergence on SBI platforms, which led to higher efficiency of management of preferences of campaign beneficiaries in the insurance sector.
1. Introduction
The opportunities provided by social business intelligence (SBI) and high-impact applications for sustainable business development have generated great enthusiasm in academic research, with a focus on data analytics and industry-driven research and development, centered on big data analytics of semi-structured content. Nowadays, companies collect a high volume of unstructured content in textual format, such as e-mails, company documents, websites, and social media (SM) content [1]. Marketing communication is special due to its reliance on sentiments, moods, and individual preferences, so the development of SBI, in terms of processes, products, and services in creating marketing campaigns, has been a challenge for business intelligence (BI) and SM professionals alike. A search of the literature returned a paucity of studies reporting data on the insurance sector and the impact of SBI on marketing campaigns in this sector. As such, this study aims to streamline the contribution of SBI to interpret user behavior, without having to interpret user feelings, based directly on data, and such online interactions as clicks, links, online campaigns, and other traditional metrics. Moreover, the manuscript brings an original contribution due to the particular focus on the symmetry versus convergence of the two marketing campaigns (SM vs. e-mail). The research blends the traditional metrics used in evaluating a digital marketing campaign with the robustness of the statistical T-test and index for an increased relevance of the analysis. The lessons learned and the scenarios depicted from the study, as well as the results, can be successfully applied, not only in the insurance industry, but also in any other sector. The field of BI helps social media analysis (SMA), and uses extract, transform, load (ETL) technologies to process and transform social data into clear and concise data that support the decision-making process in the business environment.
For this study, the concept of sustainable business development is seen in terms of full integration [2] of company operations and provision of high-quality services to its beneficiaries. This is in line with any company’s declared goals, such as creation of added value, and multiplication of the value of investments, contributions, and long-term achievements of business partners (customers and suppliers), shareholders, and employees. More specifically, sustainable development in the insurance industry [3] should put emphasis on the creation and maximization of long-term economic, social, and environmental value of insurance policies. A sustainable marketing campaign incites beneficiaries to choose a product, not only based on its description and quality, but also considering product association with the company’s global image [4]. We consider the association between SM and an e-mail marketing campaign through SBI results in stronger effects to the beneficiary, and therefore, to the stability and sustainability of the company operating in the insurance sector. In terms of sustainability, SBI support could be effective and efficient, considering the inclusion of minimum guaranteed interest rates or low financial risks for policyholders. Therefore, we believe that the use of SBI, in association with the two marketing campaigns included in the study, leads to higher efficiency of marketing campaigns in the insurance sector and through higher profitability of the main operations (sale of insurance policies) to sustainable development of a company operating in this sector.
This study is divided into five sections. Section 1 reviews the relevant literature on social data and social media analytics, e-mail marketing campaigns, and social business intelligence, to identify gaps in the literature related to the key terms of this study and to formulate the research hypotheses. Section 2 presents the materials and methods outlining the research objective and methodology, data collection, and the design instrument. Finally, Section 4 and Section 5 comprise the study discussion and its contributions, as well as its conclusions and future lines of research.
1.1. Social Data and Social Media Analytics
In today’s context, the identification of the place where clients spend most of their time on social media has become the determining factor for attracting potential clients. Once a marketer has developed an understanding of its potential client (age, residence, gender, hobbies, etc.), a portfolio should be created to be used as a method for market prospecting. All of these data could be viewed as social data.
Still, social data is imperfect for several reasons, such as the fact that it is limited as long as a user refuses to make its data public (in most cases preferring to remain anonymous). Moreover, there are many fake accounts on SM distributing content, which is useless for companies. Over the last year, Facebook focused on solving this problem by developing a series of artificial intelligence (AI) algorithms identifying and removing fake accounts. Thus, in March 2020, Facebook representatives reported having detected and removed 2 billion fake accounts in the previous year. For this purpose, with the help of a machine learning system, called deep entity classification (DEC), they managed to maintain fake accounts at 5% of total Facebook accounts (Facebook stated that after putting into practice DEC, the amount of fake accounts had been sealed at 5% of monthly active users).
Client-related data interpretation using comments on social networks is still a big challenge. These comments may often prove to be difficult to interpret as the used algorithms could be misled by specific word or groups of words. Due to advances made in the area of AI, especially in natural language processing (NLP), there have been available various techniques analyzing user sentiments and opinions expressed in SM interactions [5].
SMA are computerized tools that collect, monitor, analyze, summarize, and display social data. Moreover, they assist in collecting and interpreting unstructured data to ease interactions and extraction of needed patterns [6,7]. To perform SMA customer feedback, researchers often utilize techniques that analyze sentiments and texts [8,9].
Lately, sentiment analysis has been extensively applied to SM users [10]. A much higher use, of AI tools has been observed, such as machine and deep learning specific algorithms, Naïve Bayes [11], support vector machine, K-nearest neighbor (KNN), random forest, etc. These could be successfully applied to data from social platforms, or other web-based data, for purposes related to sentiment analysis of users [12]. Therefore, [13] implemented a multi-level sentiment network providing a heatmap visualization, a map of semantic word data, and asterism graphic with emotions aimed to understand better the feelings, reactions, and sentiments of users of social networks. The studies have also provided a classification of sentiments and emotions. Authors [14] developed a network (of Convolutional Neural Network type) to classify feelings (positive, negative, and neutral) using three sets of data and a series of algorithms specific to deep learning, such as random forest and decision trees. Reference [15] classifies feelings using a hybrid construction between emotional word vector and traditional word embedding, while [16] designs and develops an innovative system of deep learning types by applying a multiple emotion classification predicament, similar to Twitter.
Recently, a range of analytical tools that develop product recommendation systems have become available, including database segmentation and clustering, AI techniques (deep learning [17,18] and random forest algorithms [19]), advanced human-website monitoring [20], association rule mining [21,22], graphs, as well as anomaly detection [23]. Moreover, the most important procedures went past text analytics comprising sentiment analysis, trend analysis, opinion mining, social network analysis, topic modeling, and visual analytics [24]. In addition, a tremendous number of niche markets has been reached at the shallow end of the product bitstream via heavily targeted searches and individualized recommendations. References [25,26] conducted a review of several domains, such as industrial domains, data-mining objectives, applications, and use cases, discussing the implications arising for decision sciences, while [27] developed a social-awareness recommendation system for users of smart devices. Further, [1] overviews, in a table, the main BI features, as well as 1.0, 2.0, and 3.0 analytics for core capabilities and the hype cycle of Gartner BI platforms.
SMA and social network analysis have been viewed as web-based, unstructured content key characteristics, being correlated in semantic services with the Gartner Hype Cycle, natural language question responding, and content and text analytics. Finally, SMA and social network analysis have been extensively employed, and make use of opportunities of rich data, and domain-specific analytics that could be of use in mail marketing campaigns to improve marketing analysis.
In comparison with e-mails, the enhanced role of SM in market prospecting and attraction of potential clients is known, especially when combined with advanced technologies and platforms. Thus, [28] consider, in their study about big data (seen as an artifact novelty), the features of data processing technologies in collecting data about potential clients. In their research, [29] develop a conceptual framework for analyzing how social media tools improve business value in firms, using the network effects, discovering knowledge flows, and increasing innovative capability, while [30] analyzes the link between SM and business performance. They argue the importance of social corporate networking and online social connectivity, i.e., association through SM. Reference [31], in their study, aim to help IT service companies narrow the gaps of their social media marketing strategies, between the companies and the customers, by identifying and comparing the key concepts of their posts, as well as the posts from social media users. This model could also be useful for companies in the insurance sector, as the literature is very scarce with respect to the use of SM in the insurance sector. Concerning this industry, [32] considers social channels could be the best way to gauge for insurers. Thus, through SM, the insurers can formulate service policies appropriate for the customer’s behavior, can detect fraudulent claims, and provide claim-related information for their customers, primarily in times of natural disasters.
1.2. E-mail Marketing Campaigns
E-mail marketing has been widely utilized in direct online marketing, especially in strengthening customer loyalty for leveraging cross- and up-selling potential. Although this instrument is based on the initial form of online communication (e-mail), it is still one of the most widely used instruments in online marketing [33] as customers can be reached in the most effective [34] and inexpensive way. The reaction to e-mails can, in turn, be measured and analyzed in the optimization of campaigns.
Efficiency of e-mail campaigns is a big challenge for any e-commerce venture in terms of response rate to e-mail campaigns and loyalty-based customer segmentation. In this sense, decision tree analyses are useful tools for extracting customer information related to response rate from e-mail campaign data. The study by [35] aims to predict customer loyalty and improve the response rate of e-mail campaigns, specifically by using open and click-through rates by means of decision tree analysis. Mouro [36] identifies the most influential factors for email opening, generally used in promotions and campaigns. Sandage [37] states that the success of increasing the opening rate of emails stands on three main elements: a friendly “from” line, pre-header, and subject line.
In order to stress e-mail marketing significance, we rely on Radicati Group’s 2016–2020 and 2020–2024 reports [38] stating that there would be about 7.7 billion worldwide e-mail users by year-end of 2020, while overall global e-mail traffic, in the same period, could reach 257 billion daily mails. Moreover, emails are still the main core of everyday business and client-related communication. It is also highly needed, considering that it is mandatory for any type of online activity. This online activity may comprise instant messages, social networks, or other required online accounts. It is expected that the overall daily sent and received business and client-related emails could go beyond 293 billion in 2020. By 2023, the figure will reach 347 billion emails. Email marketing effectiveness and reach can be greatly improved by using social media tools and various analytical techniques. For each dollar that brands invest in email marketing, companies receive $42 in return, as shown by the Litmus 2019 State of Email Survey. Thus, the question raised by researchers is whether email marketing is dead. In 2020, statistics by Radicati—a market research firm—have proven (using figures) that there is no chance for that to happen. Email marketing remains an essential tool for attracting and retaining customers with a potential return on investment of up to 4400%.
1.3. Social Business Intelligence
SBI enables businesses to identify and collect strategically significant information, available publicly, using social networks, by accessing various channels. SBI has been viewed as an innovative discipline [46], developed by academics and business sectors through convergence of BI and SM. In addition to traditional BI, SBI has been challenged by the increased dynamics of both SM content and analytical requests of companies, as well as by enormous amounts of scattered data [47].
The combination of SM and BI appeared with the establishment of the target market, where companies wanted to sell their products and services. Market identification is a key step for developing marketing plans as it enables market segmentation by demographics, purchasing power, and psychological factors [48]. All of these data have been gathered under the umbrella of social data comprising information, by means of which any individual is able to create and distribute voluntarily and deliberately personal content on social media.
In the literature (in the field), there are few approaches on the newly emerged field of SBI. In this respect, we identified several studies dealing with this topic, and the key terms used in our study, the contribution of which we will present below. In one of the most comprehensive studies, the authors [49] wonder whether SBI actually works in real life, and if so, what have been its practical applications in real life. We could identify two waves of studies. The first wave underlined industry-specific applications, discussing how SBI provides valuable services for industries and businesses. These explore successful applications of SBI in real business cases, showing the cross-industrial nature of SBI and its potential effect in different business sectors and public institutions. Moreover, the studies also focus on the impact of SBI on traditional business models and processes, and its operational fit in supporting specific industry requirements. The second wave contains studies focused on specific cases of SM use, with Twitter and Facebook being the platforms most widely used as data providers and application test beds. Furthermore, these studies show that, we can find among the most preferred research subjects, instruments, and procedures capable of extracting value added data from popular social network platforms, blogs, or websites containing customer review content.
The authors [50,51] come up with frameworks employing business intelligence through social data integration. Furthermore, the authors [51] suggested an Online Analytical Processing (OLAP) architecture to be used in the analysis of SM, others [50] provide a semantic-based Linked Open Data (LOD) infrastructure to capture, process, analyze, as well as publish social data in the Resource Description Framework (RDF), making it possible for the current BI systems in place to use them. The two studies have a conventional approach, considering the fact that the applied architectures contain no data in streaming. However, they utilize stored information, with a focus on high latency use cases.
A modern approach was identified in the study [51,52] showing a multidimensional formalism displaying and assessing social indicators directly obtained from fact streams and derived from social media data. It stands on two main things—fact semantic representation through LOD and assistance of multidimensional analysis models of the OLAP-type. In contract with conventional BI formalisms, the authors start by modeling the requested social indicators in line with the company’s strategic objectives. This is a new approach, bringing the advantage of easiness in defining the requested social indicators, and changing dimensions and metrics using streamed facts. In the same trend of modernity, some authors [53] combine the multivariate Gaussian model and joint probability density to discover anomalies on SM. The combination of BI with sentiment analysis offers a complete approach for modeling the user and group emotions. The resulting model can be used to detect abnormal emotion, monitor public security, and finally help businesses take the desired decision.
Data quality is seen by some authors [52] as a general matter in the field of SBI. Consequently, we studied the literature and identified that few approaches aimed to assess data collection. Therefore, in their study, the authors developed an indicator of quality to be used as a metric, assessing the overall quality of collection, which integrates measures resulting from the application of various quality criteria filtering posts that are relevant for a specific SBI-based project. To reach its aim, the study suggested a novel methodology aimed to draw up quality indicators for such projects, the quality criteria of which could comprise both coherence and data origin. Therefore, this methodology assists users, identifies quality criteria suitable for both the users and the data that are available, enabling their later integration in a useful quality indicator.
The literature review of the key terms used in this study proves that there are many researches suggesting a trend for adopting AI, and combining traditional instruments (for example, email) and modern methods for interacting with users online (sentiment and emotion analysis, recommender systems, advanced human-website monitoring, etc.). Moreover, there are few studies reporting how these instruments could be applied in the insurance industry. We managed to find only one study [3] (seen by its authors as the first of this kind) looking at the insurance sector in terms of its sustainability. The search, using key words used in our study for the insurance sector, returned no relevant results.
Therefore, we believe that this research is original as it analyses convergence versus symmetry in using two different sales campaigns in the insurance sector. To add more, the suggested SBI methodology (combination of Alteryx, Tableau, and Oracle platforms), the use of statistical significance and index, in combination with the traditional metrics, bring a valuable contribution to the practice of the insurance sector.
2. Materials and Methods
Any company’s growth and sustainable development heavily rely on sales. Sales processes are divided into several practices, although just one of them has as its main aim getting to know the clients and starting a long-term relationship between the client and the company. SM, as we know it today, facilitates human interaction, and helps companies grow and shape the portfolio of their clients. It helps companies understand what clients think of them, and more importantly, what they think about their competitors, facilitating the adaptation of products and services to the needs of clients. The most important role of SM is that of market prospecting and attraction of potential clients.
Companies have always given high importance to the attraction of potential clients. This has triggered the appearance of the concept of BI. Practically, in a world dominated by highly competitive businesses, data on sales are essential for taking business decisions on a market where several competitors fight for the market share. A company that wishes to keep pace with technology needs to develop the ability to monitor what clients prefer and buy, and what needs to be improved.
2.1. Research Objective
In this study, we aim to carry out an analysis, which stemmed from the launch of a campaign on Facebook by a company selling insurance policies. According to the study published by the Statista research company [54], only in the United States, in 2019, over $32.18 billion was spent on social media promotion, the estimation for the end of 2020 amounting to $37.71 billion. Still, for a marketing campaign to be seen as useful for a company, it should have a positive impact on a company’s turnover, which is defined as a benefit brought to return on investment. In this sense, a study published by HubSpot [55], which investigated the eight most popular social networks, reports that Facebook provides the biggest return on investment. The same platform proves by using figures [56] that e-mail marketing remains one of the most important and effective ways for a business to connect with its customers and build a long-lasting relationship. Based on email marketing statistics, a company can find out how other businesses use email to maximize their Return on Investment (ROI) and connect with their customers.
Therefore, the study will include e-mail and SM-based marketing campaigns in order to stress symmetry versus convergence in the manner of conducting a marketing campaign for sustainable business development in a company operating in the insurance sector.
On SBI platforms, all data (seen as inputs) of Facebook and email campaigns show convergence. This convergence indicates that the results of the interaction analysis of the two types of campaigns are valuable for shaping the predictable behavior of insurance sector clients. Thus, we investigated in this paper whether the symmetrical unfolding of the two campaigns (time and opportunity symmetry) produced better results compared to running two separate campaigns. A successful marketing campaign, tailored for the particularities of a company whose financial state depends on insurance policy sales, indirectly conducts to a sustainable development of the company.
In a future study, the study could be continued by configuring a machine learning type of algorithm that would be used to configure a customized campaign for each category of insurance sector beneficiaries.
2.2. Research Methodology
The research methodology has been built on the analysis conducted from the perspective of a business analyst using both BI tools and statistical methods in processing social data of marketing campaigns run on social networks. Figure 1 describes the main architecture proposed by this study, for the implementation of SBI by means of all BI tools to access and process social data helping businesses take decisions that affect current and/or potential clients.
As it is shown in Figure 1, this research started from the interaction of users with a campaign run on Facebook. The study aims to underline the symmetry of electronic marketing SM and email campaigns. Based on the SM campaign, we developed a client portfolio, processed its data using ETL software, and analyzed the results statistically, which led to the adoption of specific business decisions.
The following tools were used to collect, process, and provide assistance:
- Facebook Manager—to develop client portfolio and launch the online campaign;
- Oracle 12c—to develop the database comprising all information stored by clients on SM (social data);
- Alteryx 10.5—to transform and calculate each indicator needed for the analysis;
- Tableau 10—to view real time data in the database.
In the context of SBI, we conducted the analysis of specific metrics, which required the collection of all specific data in order to check whether the indicators matched company expectations.
Therefore, the following methods were used to define the main reference channels:
- Direct: potential clients who found the campaign directly without being redirected by other web sites;
- Recommendation: potential clients who found the campaign through a website or application, not by using any websites or search engine;
- Organic: potential clients found the campaign through such search engines as Google;
- E-mail: potential clients found the campaign through a contact email on any communication channel;
- Social: potential clients found the campaign website by searching social media information about the company.
The following marketing metrics were used:
- Web content: the study used to see how efficient the layout of the campaign’s web page is, and which actions visitors made on specific sections of the web page;
- Individual visitors: this metrics measuring if a new visitor visits the page, the amount of time spent, and whether it ever returns on page;
- Click rate: mostly it includes the page accessing clicks;
- Rejection rate: this metrics includes data compilation related to leaving the campaign page by the visitor without doing any other action;
- Mail opening rate: the rate calculates mail openings compared to all sent emails;
- Opting rate: it shows the success of the campaign in attracting people interested in the promotion campaign;
- Number of visitors on the campaign page.
Once all channels were established, and the metrics provided a clear idea on the success or failure of the campaign, we used an easy way to get the sources of data to be analyzed in Alteryx, a highly used platform for similar purposes in other similar studies [57,58,59]. Alteryx software has been extensively used in self-service data analytics, enabling researchers to prepare, mix, and analyze data with a repeatable workflow, deploying and sharing analytics at scale to get a more insightful understanding of hours, and not weeks. After running the ETL in Alteryx, we applied T-test on data referring to campaign efficiency in the online environment.
The statistical significance was performed using T-test that is generally applied to normal data distribution. As such, data were first tested for a normal distribution, turning to positive, and then the T-test was applied on the dataset to test SH1-SH4 hypotheses and validate the results.
The main hypothesis of this study (RH) is that SM impacts significantly any marketing campaign promotion, much higher compared to email campaigns. This hypothesis was, in turn, divided into four secondary hypotheses (SH), as follows:
SH1: There are significant differences between Facebook and e-mail campaigns by number of corporate employees.
SH2: There are significant differences between the impact of Facebook and email campaigns by the number of company years opened.
SH3: There are significant differences between the impact of Facebook and email campaigns by companies’ total sales buckets.
SH4: There are significant differences between the impact of Facebook and email campaigns by the Standard Industrial Classification (SIC) industry.
To validate the hypotheses, T-test was mainly used to prove the relevance of data collection and contact segmentation by the results. So, the results appear as accepted or rejected, and have as the acceptance score an index calculated based on Formula (1), the statistical significance resulting from applying the T-test.
2.2.1. Data Collection
To collect data during the campaign run on SM, we used case studies as a research method. The stage before data collection included the development of the campaign itself on the SM, aimed at creating an audience of a campaign’s already existent clientele, to discover the purchases they made during the campaign. A campaign was simulated to create a database in Oracle, comprising tables of clients, company products, and purchases made by clients during the online campaign.
The company, for which this research was conducted, sells insurance policies to legal entities in the United States, and its name has been kept anonymous for security reasons. To identify the problem, we first launched a Facebook information campaign oriented at the target market in the United States, which resulted from the insurance company portfolio of clients. Facebook was chosen for this research as it enables the company to extract its contacts using the Facebook Business Manager package (which cannot be done by other socializing networks). Although the client portfolio was quite small, it could be shaped [60] by using Facebook Business Manager, namely, through a facility [61,62] available on this socializing network, client portfolio having been grown from 4000 to 2.6 million contacts (see Figure 2), with a similarity score (99%). It was done by creating a potential audience by selecting active clients by means of Facebook Business Manager.
Using a simple analysis performed by only applying audience analysis methods, without interpreting the results of interaction, it was found that it would be difficult for a company to know whether a Facebook information campaign was successful or not, without collecting and classifying information about the actions of potential clients from their interaction form. In this sense, the information campaign had to be divided into several time periods, also adding a direct interaction with the contact, via the click from a potential client on the paid post on Facebook, redirecting the client to the marketing campaign page on the insurer’s web site (insurance policy seller). Moreover, along with the final goal of the insurance company (of selling as many policies), another indirect goal was added—target market configuration for future marketing campaigns on SM through statistically calculated confidence scores.
2.2.2. Design Instrument
To enable the insurance company to understand better the behavior of clients on SM regarding the information campaign it was running, we analyzed client behavior using two methods: Facebook and email-based information campaigns.
Therefore, this study aims to conduct a comparative analysis of the indicators related to the two interaction methods (SM and email marketing campaigns) to present the symmetry versus convergence in the use of SBI in marketing campaigns.
For this purpose, as suggested by this model, the collected data have been exported from the Oracle database, and then stored in two files to differentiate between contacts and the interactions with them. The first file contains approximately 2.6 million contacts and the second 12 million records, referring to Facebook and email campaigns. These data were the main sources for data processing in the statistical analysis of information campaign relevance, and in setting the target group.
The most difficult and complex ETL process of raw data processing was to prepare statistical data. The process is explained in Figure 3, which stresses that the model could be utilized to do analyses using BI.
After running the ETL process in Alteryx software, the statistical T-test was applied on the dataset in order to compare the efficiency of online and email campaigns. For this purpose, the main element of the study was calculated, the statistical index (i), and the T-test calculating the statistical significance(s). The statistical index (i) was calculated using Formula (1). To calculate statistical significance (obtained by applying T-test), we used the minimum accepted statistical significance threshold of 10%.
where:
a = (number of opt-ins)—the number of interactions by analyzed metrics;
b = (number of contacted)—total number of contacts by analyzed metrics;
∑a = (number of total opt-ins)—total sum of the number of interactions;
∑b = (number of total contacted)—total sum of the number of contacts.
Therefore, in order to validate the results, the following two conditions must be cumulatively met: statistical index (i) must be greater than or equal to 100, and statistical significance (s), resulted after applying the T-test, must be greater than or equal to 90%.
In Figure 4, we can see the model used to automate reporting, implemented through spreadsheet application. This automation was applied to the whole dataset of each segment of analysis, in line with the hypotheses (SH1–SH4) for the two campaigns. For example, Figure 4 shows such multiple information as the number of interactions that the information campaign had on Facebook (opt-ins, column B) by industry of contacts (column A), and especially, by type of analysis.
3. Results
According to our research design (Figure 1), the study analysis measured, in real time, the promotion campaigns using SM (Facebook) and e-mail.
Figure 5 shows the four time periods of the SM (Facebook) marketing campaigns. Moreover, the second column contains the total number of contacted Facebook (FB) accounts. The last columns comprise the total number of successful interactions and the percentage of engagements by companies, which had been the recipients of the Facebook campaign.
After attracting potential clients to the insurance company’s website, to get more detailed information, we were able to use the information provided by the Pingdom platform [63], reported by other studies to be among the most comprehensive datasets related to the Internet [64]. Visits to a campaign’s website, for example, was used by the insurance company. So, the clients were directed to the insurance company’s website through the marketing campaign, the above-mentioned platform enabling us to obtain comprehensive user monitoring. Visitor experience on the web page may vary as they could use different browsers, devices, or platforms. Moreover, this tool underlines improvements by comparing yearly data, and assists marketing decisions by providing such usage metrics as top visited pages, platforms, browsers, active sessions, as well as bounce rates.
The bounce rate is significant in analyzing web traffic, showing the number of visitors [65] accessing the website and then leaving it, instead of continuing browsing and, eventually making a purchase (an insurance policy, in our case). The bounce rate measures web site efficiency, being a proportion of visits ending on the first page (check Formula (2)).
where:
Tv total number of visitors;
Ti total number of entries on a page;
Rr bounce rate.
The results in Figure 6 display periods of time divided into several weeks of the campaign when visits were made to the company website. It should be mentioned that these metrics are valid only for the campaign’s landing page, not for other pages of the website under analysis. Other pages are considered in Figure 7. Thus, over 70% of visitors spent approximately two minutes on the campaign’s landing page before leaving the website, or continued website browsing by visiting other pages of the campaign.
Figure 7 shows the success of the part related to viewing the campaign website by classifying the reference channels (traffic originated from referral, organic, none/direct, e-mail, and SM). As can be seen, the results mostly come from SM, followed by direct visits of the campaign website. We may also note the contacts from the email campaign, followed by the organic and referral results. As expected, the information campaign on SM brought a plus of almost 50% in interactions. A detailed analysis of results in Figure 7 provides a better understanding of user behavior and could help in taking measures for improving the pages with the lowest results.
To prove the need for using SBI, this study also included an email-based information campaign using BI. For the same contacts, it was also decided that emails should be sent, to test which of the two campaigns (Facebook vs. e-mail) was more efficient.
So, Figure 8 presents general information on the email campaign, for which, we calculated the email open rate and the click rate. Equation (3) shows calculation formulas for open and click rates, based on which Figure 8 was made.
where:
Td total number of opened emails;
Tt total number of sent emails;
Tc total number of clicked emails;
Rde e-mail open rate;
Rc e-mail click rate.
3.1. Metrics Analysis for the Facebook Campaign
The analysis design presented in Figure 4, imported in Tableau [58], was applied in each case/field (according to research hypotheses SH1–SH4) using data from the database.
The next step of this methodology included calculation and display in Tableau of values for index (i) and statistical significance (s) indicators, and also the calculation of acceptance/rejection of results, considering their value. Therefore, a test (one line in the Figure 9) is considered accepted only if the index (i) is higher or equals 100, and the statistical significance of T-test (s) is, at least, 90%.
Figure 9 shows the total number of contacts (number of opt-ins) that engaged in the Facebook campaign (5661) by number of Corporate employees in the business (Corp Emp Buss). We can observe that the highest number of contacts was in companies with 40–49, and 50–100 employees, respectively. Still, cases with an acceptable value of index (i), and with a statistically significant value of (s) were i = 107 and i = 108 (for both, s = 99%). Acceptance of these results enables the company to take an important decision to concentrate only on contacts belonging to these groups/categories. In this case, it is profitable for a company to contact companies with 40–49 and 50–100 employees due to the highest chances of selling insurance policies successfully. This information is also useful for future campaigns, as it has already been proven that this category of companies brings financial advantages to the insurance company.
Figure 10 shows that four statistical tests could be considered, but based on the accepted value of the index, only three cases have been accepted where the index value is higher or equals to 100, and the statistical significance is higher or equals to 90%. Consequently, the analysis by years of operation shows that this marketing campaign is relevant for “younger” companies operating for 4–5 years (i = 109, s = 95%), 6–10 years (i = 101, s = 90%), and 11–20 years (i = 100, s = 95%).
Although most contacts were in group E (USD $100,000–$250,000), this category has not proven to be statistically significant for our study (see Figure 11). Therefore, out of four cases with statistically significant values of (s) (index 87, 100, 108, and 105) for the performed tests, only three could be taken into account for this information campaign, i = 100, i = 108, and i = 105, respectively. As a result, we can state with an error margin of 10% that this marketing campaign stirred the interest of companies with a turnover, falling into the following categories: USD $50,000–$100,000 (s = 95%), USD $250,000–$500,000 (s = 99%), and USD $500,000–$1,000,000 (s = 90%).
Figure 12 presents the results of analysis of contacts grouped by industry (standard industrial classification (SIC) Industry).
Figure 12 shows that services industry was most interested/receptive to the information campaign, with over 55% out of total contacts. Moreover, this industry displays statistical significance and an index with an accepted value. Therefore, SIC Industry analysis was validated as significant manufacturing (i = 128, s = 99%), wholesale trade (i = 125, s = 99%), and services (i = 105, s = 99%).
3.2. Metrics Analysis for the Email Campaign
The e-mail campaign was run using the Eloqua platform, a software (SaaS) platform designed for marketing automation that has been used in several recent studies [66,67]. Eloqua was developed by Oracle and aims to help business-to-business (B2B) marketers and organizations to manage their marketing campaigns. Among the main features of the platform, we should mention the track of opened emails, customer activity and visitor behavior of potential clients through the website of the insurance company (in our case).
Irrespective of the email open rate, the insurance company, by calculating statistical significance can choose the scenario that it will use in the future to gain such financial advantages as reduction of expenses by over 75% and gain notoriety by providing information by email.
The results in Figure 13 show that companies with the number of employees varying between 10 and 19 (i = 100, s = 90%) had a high response rate to emails and were receptive to the email information campaign. It also applies to companies with 50–100 employees that display a statistical relevance (i = 137, s = 95%) for this study.
After sending emails to contacts grouped by the metrics total sales bucket (Figure 14), conclusive results were noted for companies with total sales bucket situated between USD $5000 and $50,000 (i = 100, s = 90%) and USD $250,000 and $500,000 (i = 139, s = 95%).
As shown in Figure 15, the most relevant results of the email campaign were found in case of companies operating in their industry for a longer period of time, between 21 and 50 (i = 141, s = 95%) and 51 and 100 years (i = 121, s = 90%). In contrast with the Facebook campaign, we note that companies operating for longer time are more receptive to email interaction, at least, in case of marketing campaigns.
Although the services industry showed over half of the results for the email campaign, we observe that these results are not statistically significant. Construction (i = 112, s = 90%) and Retail trade (i = 100, s = 95%) are the industries for which the email marketing campaign has been validated, as shown by Figure 16.
As displayed in Figure 9, Figure 10, Figure 11, Figure 12, Figure 13, Figure 14, Figure 15 and Figure 16, the study reports that the results for the marketing campaign run on Facebook were much higher than the results of the email marketing campaign, validating the secondary hypotheses (SH1–SH4) and, indirectly, the main research hypothesis (RH). This is based not only on the number of companies that visited the campaign’s website, but also on the number of accepted tested cases: eleven versus eight for social media, as shown in Table 1. It displays only the summary of results for the two campaigns (Facebook and e-mail), statistically significant for this study.
The results, centralized in Table 1 show that SM had a significant impact on marketing campaigns promotion, much higher compared to email campaigns in all four analyzed cases (Corp Emp Buss, years opened, total sales bucket, SIC Industry). In this way, the validation of all secondary hypotheses (SH1–SH4) led to the validation of the main RH. Therefore, the study proves that SM (in this case Facebook) impacted significantly the promotion of marketing campaigns, much more than email marketing. As such, we may conclude that the two types of marketing campaigns are not fully in symmetry, but rather they complete each other.
4. Discussion
The research highlights that BI tools, together with performance indicators and contacts from SM, should be used to achieve the business objectives of any company. The metrics, such as the number of clicks, campaign visits, or views, are not enough to confirm or invalidate the success of any campaign. In this case, statistical significance is useful, which could make a difference between really significant data for a marketing campaign and data that require corrections to be used later.
The two marketing campaigns investigated in the study, the Facebook and email campaigns, have different approaches to market prospecting and the attraction of new clients. Facebook uses an indirect approach through advertisements, while the email campaign is based on a direct approach, in the email inbox.
In this study, we started from developing the insurance company database for the campaigns, and collecting data by four market segments (Corp Emp Buss, total sales buckets, years opened, SIC industry) to be able to monitor the activity of contacts on company’s website, the results of which are summarized below as result x (Rx), secondary hypothesis x (SHx), and decision x (Dx):
- R1: in case of Corp Emp Buss metrics for the SM campaign, two of the tested cases have been accepted for companies with 40–49 and 50–100 employees. As for the email campaign, two of the tested cases have been validated for companies with 10–19 and 50–100 employees.
- SH1: both campaigns had statistically significant results, and in case of the Facebook campaign, companies with higher number of employees (40–49 and 50–100 employees) were the most receptive to marketing campaigns. The companies that responded to the email campaign are quite close to the extremes, with an average number of (10–19) and (50–100) employees (included in the sample). An analysis of statistical significance shows us that SM compared to email resulted in the highest degree of confidence. The results show that the two campaigns are different, the companies behaving differently in SM versus email campaigns, therefore, it could be stated that the SH1 hypothesis has been validated.
- D1: business decision is based on the fact that both campaigns (SM and email) had a good score for companies with 50–100 employees, that is why, to optimize the results of a future campaign, the following should be applied:
- Combined (SM + e-mail), the target group should include companies with 50–100 employee;
- Only on Facebook, the target group should include companies with 40–49 and 50–100 employee;
- Only by email, the target group should include companies with 10–19 and 50–100 employee.
- R2: for the segment of analyzed contacts by total sales bucket, there were three statistically validated cases for the Facebook campaign and two cases for the email campaign. Thus, the SM campaign attracted the attention of companies with values of total sales bucket situated between USD $50,000 and $100,000; $250,000 and $500,000; and $500,000 and $1,000,000, at the most valuable extreme of the category. The email campaign was more attractive for companies with lower (USD $5000–$50,000) and medium (USD $250,000–$500,000) total sales bucket.
- SH2: both campaigns produced valuable results for future campaigns and we observe different behavior of companies grouped by total sales bucket. Therefore, companies interested in the SM campaign have high values of total sales bucket metrics, while companies attracted by the email campaign display low and medium value of this metrics. It could be stated that the hypothesis SH2 has been validated as the companies analyzed using the total sales bucket metrics reacted differently to the two analyzed campaigns.
- D2: target market configuration should take into account the following scenarios for a future marketing campaign:
- Combined campaign (SM + e-mail), the target group should include companies with total sales bucket of USD $250,000–$500,000;
- SM campaign, the target group should include companies with total sales bucket of USD $50,000–$100,000; $250,000–$500,000; and $500,000–$1,000,000;
- Email campaign, the target group should include companies with total sales bucket of USD $5000–$50,000 and $250,000–$500,000.
- R3: for the contacts segmented by SIC Industry, the results of SM campaign have validated three totally different industries for the two marketing campaigns. Therefore, the SM campaign attracted companies from services, wholesale trade and manufacturing, while the e-mail marketing campaign was fruitful for the companies from construction and retail trade industries.
- SH3: the results show that companies targeted by these two types of marketing campaigns (grouped by SIC industry) have different preferences and behavior. So, the SH3 hypothesis has been validated.
- D3: for a future marketing campaign scenario, the ideal client could be found in these SIC Industry categories:
- Construction, services, retail trade, wholesale trade, and manufacturing for a combined campaign (SM and e-mail);
- Services, wholesale trade and manufacturing for a SM campaign;
- Construction and retail trade for an email campaign.
- R4: the segment of contacts grouped by years opened resulted in a very good segmentation: relatively newly opened companies respond mainly to SM campaigns, while older companies are more attracted to email campaigns.
- SH4: the results enable us to validate the hypothesis stating that companies grouped by years opened responded differently to the two market campaigns (SM vs. e-mail). Therefore, we note that newly opened companies (4–5 years, 6–10 years, and 11–20 years) prefer Facebook campaigns, while significantly older companies (21–49 years and 50–100 years) prefer email-marketing campaigns.
- D4: For a future marketing campaign, to get optimal results, the group of targeted companies grouped by years opened should apply the following scenarios:
- Combined campaign (SM + e-mail) should address companies with years opened of 4–5, 6–10, 11–20, 21–49, and 50–100 years;
- SM campaign should address companies with years opened of 4–5, 6–10, and 11–20 years;
- Email campaign should address companies with years opened of 21–49 and 50–100 years.
In a wider research, a contact’s reactions to a campaign can also be measured by an extensive analysis across other social networks, not just on Facebook. In this research, only the initial campaign phase and target group setting were considered. Moreover, the campaign’s feasibility score was calculated. However, at a later stage, a new campaign can be performed, applied only to contacts that have managed to get a better score in line with statistical significance.
Another perspective could be that of gathering information about market segments whose results were good, while the index and the result of statistical significance were rejected. There is a contradiction between the two, so one can thoroughly investigate what was wrong in order to attract other potential customers.
At the same time, in the future, user responses collected on all social networks, should be included, as well as the number of likes, comments, or distributions of the campaign. Such action can provide to the company a broader view of the social environment.
5. Conclusions
The conclusion of this study is that BI platforms can collect and interpret data from SM and provide support in decision-making that could generate multiple opportunities for companies. Although this study was applied to the insurance sector, the model suggested in this study could be put into practice by any company, irrespective of the field in which it operates. In this sense, the support of BI technology is essential for collecting and interpreting data. Moreover, the study proves that SM significantly impacted the promotion of marketing campaigns, much more than emails.
The lessons learned from this study, which could be put into practice by a company operating in the field of insurance, in accordance with the four analyzed and validated hypotheses (SH1, SH2, SH3, SH4), and decisions (D1, D2, D3, D4) are presented below. So, according to the four considered metrics (Corp Emp Buss, total sales bucket, SIC industry, years opened), the research stresses the following scenarios as being useful in the future for two types of marketing campaigns. The scenarios below display SM campaign particularities, in symmetry with the e-mail campaign, for a company operating in the insurance sector.
Scenario 1. For the marketing campaigns conducted through SM (Facebook), the target group should consist of companies with a number of employees between 40 and 49 and 50 and 100, holding a total sales bucket of USD $50,000–$100,000; $250,000–$500,000; and $500,000–$1,000,000, operating in services, wholesale trade, and manufacturing industries, and with a presence on the market of 4–5, 6–10, or 11–20 years since company opening.
Scenario 2. In the case of e-mail-based marketing campaigns, the target group should be composed of companies with a number of employees between 10 and 19 or 50 and 100, with a total sales bucket of USD $5000–$50,000 or $250,000–$500,000, operating in the construction or retail trade sectors, and with 21–49 or 50–100 years since opening.
We notice, from the perspective of the years opened metric, that the companies from the target group having a long tradition in business, ranging between 21 and 49 and 50 and 100 years, respond to regulation procedures in business communication, their preference being clearly inclined towards the e-mail campaign. In contrast, newly emerged companies, with the metric years opened of 4–5, 6–10, or 11–20 years in business, have a very good response to SM (Facebook) campaigns. In this sense, we could relate them to the internet user’s generation [68,69,70,71], such as Generation X, xennials, millennials, etc. We notice that the targeted companies (their employees) behave similarly to the user’s generation regarding preference for SM versus email-based marketing campaigns investigated in our study. Moreover, noteworthy is the clearly outlined preference of companies in the construction and retail trade sector for e-mail, while the companies in services, wholesale trade, and manufacturing industries prefer SM communication.
The results of the study prove that SBI platforms show convergence of data extracted from the two marketing campaigns (SM and e-mail). This convergence enabled us to use the results of the interaction analysis of the campaigns to shape predictable behavior of the insurance industry beneficiaries. Being able to predict the preferences of clients based on a customizable marketing campaigns, for niched sectors, such as the insurance industry, which mainly relies on selling insurance policies, could lead to an long-term development of the company and, therefore, to sustainable development. The scenarios presented above show that a symmetrical running of the two marketing campaigns (time and opportunity symmetry) could generate better results compared to using two separate campaigns. This way, based on the lesson learned in this study, it was proved that it is possible to configure a symmetrical campaign, time, and opportunity wise, on SM and email, and its data would converge on the SBI platform. Authors believe that this is how symmetry versus convergence should be approached in a marketing campaign run on SM and e-mail. We conclude that the suggested model of analysis (the combination of Alteryx, Tableau, and Oracle platforms), the chosen methodology (the traditional metrics enhanced by index and statistical significance), and the study results (the specific features of campaigns and the validated results comprised in Table 1 and Discussion), bring a novel contribution to the practice of marketing campaigns in the insurance sector.
Author Contributions
Conceptualization, D.F. and I.-D.A.; methodology, D.F., V.-D.P. and I.-D.A.; software, I.-D.A.; validation, I.-D.A. and V.-D.P.; formal analysis, I.-D.A.; investigation, I.-D.A.; resources, D.F. and I.-D.A.; data curation, I.-D.A.; writing—original draft preparation, D.F. and I.-D.A.; writing—review and editing, V.-D.P.; visualization, V.-D.P.; supervision, D.F. All authors have read and agreed to the published version of the manuscript.
Funding
This research received no external funding.
Conflicts of Interest
The authors declare no conflict of interest.
References
- Chen, H.; Chiang, R.H.L.; Storey, V.C. Business intelligence and analytics: From big data to big impact. MIS Q. 2012, 36, 1165–1188. [Google Scholar] [CrossRef]
- Rainey, D.L.; Robert, J.A. The Pursuit of Sustainability: Creating Business Value through Strategic Leadership, Holistic Perspectives, and Exceptional Performance; Information Age Publishing—IAP: Charlotte, NC, USA, 2015. [Google Scholar]
- Chiaramonte, L.; Dreassi, A.; Paltrinieri, A.; Piserà, S. Sustainability Practices and Stability in the Insurance Industry. Sustainability 2020, 12, 5530. [Google Scholar] [CrossRef]
- Sustainable Marketing Lessons, Sustainability Management School (SUMAS), October 2018. Available online: https://sumas.ch/4-sustainable-marketing-lessons/ (accessed on 8 June 2020).
- Farzindar, A.A.; Inkpen, D. Natural Language Processing for Social Media. Synth. Lect. Hum. Lang. Technol. 2020, 13, 1–219. [Google Scholar] [CrossRef]
- Zeng, D.; Chen, H.; Lusch, R.; Li, S.-H. Social media analytics and intelligence. IEEE Intell. Syst. 2010, 25, 13–16. [Google Scholar] [CrossRef]
- Liere-Netheler, K.; Gilhaus, L.; Vogelsang, K.; Hoppe, U. A Literature Review on Application Areas of Social Media Analytics. In BIS 2019: Business Information Systems; Lecture Notes in Business Information Processing; Abramowicz, W., Corchuelo, R., Eds.; Springer: Berlin/Heidelberg, Germany, 2019; Volume 354. [Google Scholar]
- Georgescu, M.R.; Bogoslov, I.A. Importance and Opportunities of Sentiment Analysis in Developing E-Learning Systems through Social Media. In DIEM: Dubrovnik International Economic Meeting; Sveučilište u Dubrovniku: Dubrovnik, Croatia, 2019; Volume 4, pp. 83–93. [Google Scholar]
- Pang, B.; Lee, L. Opinion mining and sentiment analysis. Comput. Linguist. 2009, 35, 311–312. [Google Scholar]
- Iglesias, C.A.; Moreno, A. Sentiment Analysis for Social Media. Appl. Sci. 2019, 9, 5037. [Google Scholar] [CrossRef] [Green Version]
- Patel, R.; Passi, K. Sentiment Analysis on Twitter Data of World Cup Soccer Tournament Using Machine Learning. IoT 2020, 1, 14. [Google Scholar] [CrossRef]
- Sánchez-Rada, J.F.; Iglesias, C.A. Social context in sentiment analysis: Formal definition, overview of current trends and framework for comparison. Inf. Fusion 2019, 52, 344–356. [Google Scholar] [CrossRef]
- Ha, H.; Han, H.; Mun, S.; Bae, S.; Lee, J.; Lee, K. An Improved Study of Multilevel Semantic Network Visualization for Analyzing Sentiment Word of Movie Review Data. Appl. Sci. 2019, 9, 2419. [Google Scholar] [CrossRef] [Green Version]
- Kim, H.; Jeong, Y.-S. Sentiment Classification Using Convolutional Neural Networks. Appl. Sci. 2019, 9, 2347. [Google Scholar] [CrossRef] [Green Version]
- Mao, X.; Chang, S.; Shi, J.; Li, F.; Shi, R. Sentiment-Aware Word Embedding for Emotion Classification. Appl. Sci. 2019, 9, 1334. [Google Scholar] [CrossRef] [Green Version]
- Jabreel, M.; Moreno, A. A Deep Learning-Based Approach for Multi-Label Emotion Classification in Tweets. Appl. Sci. 2019, 9, 1123. [Google Scholar] [CrossRef] [Green Version]
- Sulikowski, P.; Zdziebko, T. Deep Learning-Enhanced Framework for Performance Evaluation of a Recommending Interface with Varied Recommendation Position and Intensity Based on Eye-Tracking Equipment Data Processing. Electronics 2020, 9, 266. [Google Scholar] [CrossRef] [Green Version]
- Bock, J.R.; Maewal, A. Adversarial Learning for Product Recommendation. AI 2020, 1, 25. [Google Scholar] [CrossRef]
- Sulikowski, P.; Zdziebko, T.; Turzyński, D. Modeling online user product interest for recommender systems and ergonomics studies. Concurr. Comput. Pract. Exp. 2019, 31, e4301. [Google Scholar] [CrossRef]
- Sulikowski, P.; Zdziebko, T.; Turzyński, D.; Kańtoch, E. Human-website interaction monitoring in recommender systems. Procedia Comput. Sci. 2018, 126, 1587–1596. [Google Scholar] [CrossRef]
- Mattiev, J.; Kavsek, B. Coverage-Based Classification Using Association Rule Mining. Appl. Sci. 2020, 10, 7013. [Google Scholar] [CrossRef]
- Ampornphan, P.; Tongngam, S. Exploring Technology Influencers from Patent Data Using Association Rule Mining and Social Network Analysis. Information 2020, 11, 333. [Google Scholar] [CrossRef]
- Adomavicius, G.; Tuzhilin, A. Toward the next generation of recommender systems: A survey of the state-of-the-art and possible extensions. IEEE Trans. Knowl. Data Eng. 2005, 17, 734–749. [Google Scholar] [CrossRef]
- Fan, W.; Gordon, M.D. The power of social media analytics. Commun. ACM 2014, 57, 74–81. [Google Scholar] [CrossRef]
- Anderson, J.C.; Narus, J.A.; Narayandas, D. Business Market Management: Understanding, Creating and Delivering Value; Pearson Education: London, UK, 2004. [Google Scholar]
- Rathore, A.; Kar, A.; Ilavarasan, V. Social Media Analytics: Literature Review and Directions for Future Research. Decis. Anal. 2017, 14, 229–249. [Google Scholar] [CrossRef]
- Ojagh, S.; Malek, M.R.; Saeedi, S. A Social–Aware Recommender System Based on User’s Personal Smart Devices. ISPRS Int. J. Geo Inf. 2020, 9, 519. [Google Scholar] [CrossRef]
- Chen, H.; Chiang, R.H.; Storey, V.C. Business intelligence research. MIS Q. 2010, 34, 201–203. [Google Scholar]
- Garcia-Morales, V.J.; Martín-Rojas, R.; Lardón-López, M.E. Influence of social media technologies on organizational performance through knowledge and innovation. Balt. J. Manag. 2018, 13, 345–367. [Google Scholar] [CrossRef]
- Martín-Rojas, R.; García-Morales, V.J.; Garrido-Moreno, A.; Salmador-Sanchez, M.P. Social Media Use and the Challenge of Complexity: Evidence from the Technology Sector. J. Bus. Res. 2020, in press. [Google Scholar] [CrossRef]
- Shen, C.W.; Luong, T.H.; Ho, J.T.; Djailani, I. Social media marketing of IT service companies: Analysis using a concept-linking mining approach. Ind. Market. Manag. 2020, 90, 593–604. [Google Scholar] [CrossRef]
- Kopanakis, Significance of Social Media Analytics for Insurance Businesses. 2020. Available online: https://www.mentionlytics.com/blog/social-media-analytics-for-insurance-businesses/ (accessed on 12 August 2020).
- Ahrholdt, D.; Greve, G.; Hopf, G. Online-Marketing-Intelligence; Springer Books: New York, NY, USA, 2019; p. 145. [Google Scholar] [CrossRef]
- Hudák, M.; Kianičková, E.; Madleňák, R. The Importance of E-mail Marketing in E-commerce. Procedia Eng. 2017, 192, 342–347. [Google Scholar] [CrossRef]
- Qabbaah, H.; Sammour, G.; Vanhoof, K.; Voronin, A.; Ziatdinov, Y.; Aslanyan, L.; Sahakyan, H.; Rayan, Z.; Alfonse, M.; Salem, A.B.M.; et al. Decision Tree Analysis to Improve e-mail Marketing Campaigns. Int. J. Inf. Theor. Appl. 2019, 26, 3–36. [Google Scholar]
- Mouro, C.; Alturas, B. Factors influencing the consumer to accept advertising by e-mail. In Proceedings of the 11th Iberian Conference on Information Systems and Technologies (CISTI), Las Palmas, Spain, 15–18 June 2016; pp. 1–6. [Google Scholar] [CrossRef]
- Sandage, E. Best Practices in E-Mail Marketing. Membersh. Manag. Rep. 2017, 13, 6. [Google Scholar] [CrossRef]
- The Radicati Group, Inc. (Technology Market Research Firm), Email Market, 2020–2024 Executive Summary, 27 April 2020. Available online: https://www.radicati.com/?p=16885 (accessed on 10 August 2020).
- Floričić, T. Digital Tourism Promotion and E-mail Marketing. In Innovation Management, Entrepreneurship and Sustainability; IMES 2018; Vysoká škola ekonomická v Praze: Prague, Czech Republic, 2018; pp. 317–331. [Google Scholar]
- Fotache, M.; Dumitriu, F.; Greavu-Serban, V. Differences in Information System Skills of Offshoring Source Markets and Destination Markets. Transform. Bus. Econ. 2016, 15, 478–799. [Google Scholar]
- Wadia, R. Effectiveness of health marketing campaigns. Br. Dent. J. 2020, 228, 595. [Google Scholar] [CrossRef] [PubMed]
- Bradley, J.; Gardner, G.; Rowland, M.K.; Fay, M.; Mann, K.; Holmes, R.; Foster, E.; Exley, C.; Don Bosco, A.; Hugueniot, O.; et al. Impact of a health marketing campaign on sugars intake by children aged 5–11 years and parental views on reducing children’s consumption. BMC Public Health 2020, 20, 1–11. [Google Scholar] [CrossRef] [PubMed] [Green Version]
- Mathews, R.; Buys, D. Healthy Eating Social Marketing Campaigns: A Systematic Review of the Literature. J. Acad. Nutr. Diet. 2020, 120, A81. [Google Scholar] [CrossRef]
- Tarczydło, B.; Miłoń, J. E-Marketing Campaign for a University. Case Study. Mark. Sci. Res. Organ. 2019, 31, 151–172. [Google Scholar] [CrossRef] [Green Version]
- Grubor, A.; Đokić, N.; Milićević, N. The use of e-mail marketing in accordance with permission marketing approach in promotion of a study program. Strateg. Manag. 2018, 23, 26–31. [Google Scholar] [CrossRef]
- Belgiu (Curea), C.-G.; Constantin, I. Political Marketing Campaign. Logos Universality Mentality Education Novelty; Section: Political Sciences and European Studies; Editura Lumen: Iasi, Romania, 2017; Volume IV, pp. 25–32. [Google Scholar] [CrossRef]
- Lanza-Cruz, I.; Berlanga, R.; Aramburu, M.J. Modeling Analytical Streams for Social Business Intelligence. Informatics 2018, 5, 33. [Google Scholar] [CrossRef] [Green Version]
- Target Market. Available online: https://www.investopedia.com/terms/t/target-market.asp (accessed on 11 August 2020).
- Gioti, H.; Stavros, T.P.; Panayiotou, N. Social business intelligence: Review and research directions. J. Intell. Stud. Bus. 2018, 8, 23–42. [Google Scholar] [CrossRef] [Green Version]
- Berlanga, R.; García-Moya, L.; Nebot, V.; Aramburu, M.; Sanz, I.; Llidó, D. SLOD-BI: An Open Data Infrastructure for Enabling Social Business Intelligence. Int. J. Data Wareh. Data Min. 2015, 11, 1–28. [Google Scholar] [CrossRef] [Green Version]
- Francia, M.; Gallinucci, E.; Golfarelli, M.; Rizzi, S. Social Business Intelligence in Action. In Proceedings of the Advanced Information Systems Engineering: 28th International Conference CAiSE, Ljubljana, Slovenia, 13–17 June 2016; pp. 33–48. [Google Scholar]
- Berlanga, R.; Lanza-Cruz, I.; Aramburu, M.J. Quality Indicators for Social Business Intelligence. In Proceedings of the Sixth International Conference on Social Networks Analysis, Management and Security (SNAMS) 2019, Granada, Spain, 22–25 October 2019; pp. 229–236. [Google Scholar] [CrossRef]
- Sun, X.; Zhang, C.; Li, G.; Sun, D.; Ren, F.; Zomaya, A.; Ranjan, R. Detecting users’ anomalous emotion using social media for business intelligence. J. Comput. Sci. 2018, 25, 193–200. [Google Scholar] [CrossRef]
- Statista, Social Network Advertising Spending in the United States from 2016 to 2020 Report. 2019, USA. Available online: https://www.statista.com/statistics/736971/social-media-ad-spend-usa/ (accessed on 11 June 2020).
- King, C. Social Media Marketing Strategy in 2020, HubSpot Academy 2020. Available online: https://bit.ly/33B8CUB (accessed on 10 August 2020).
- HubSpot. Available online: https://www.hubspot.com/marketing-statistics (accessed on 8 August 2020).
- Jewell, N. The analytics lifecycle and the age of innovation. Netw. Secur. 2019, 2019, 8–11. [Google Scholar] [CrossRef]
- Khirfan, L.; Mohtat, N.; Peck, M. A systematic literature review and content analysis combination to “shed some light” on stream daylighting (Deculverting). Water Secur. 2020, 10, 100067. [Google Scholar] [CrossRef]
- Lee-Post, A.; Pakath, R. Numerical, secondary Big Data quality issues, quality threshold establishment, & guidelines for journal policy development. Decis. Support Syst. 2019, 126, 113135. [Google Scholar] [CrossRef]
- Loft, L.H.; Pedersen, E.A.; Jacobsen, S.U.; Søborg, B.; Bigaard, J. Using Facebook to increase coverage of HPV vaccination among Danish girls: An assessment of a Danish social media campaign. Vaccine 2020, 38, 4901–4908. [Google Scholar] [CrossRef] [PubMed]
- Dalenberg, D.J. Preventing discrimination in the automated targeting of job advertisements. Comput. Law Secur. Rev. 2018, 34, 615–627. [Google Scholar] [CrossRef]
- Pedersen, E.A.; Loft, L.H.; Jacobsen, S.U.; Søborg, B.; Bigaard, J. Strategic health communication on social media: Insights from a Danish social media campaign to address HPV vaccination hesitancy. Vaccine 2020, 38, 4909–4915. [Google Scholar] [CrossRef]
- Presthus, W.; Vatne, D.M. A Survey on Facebook Users and Information Privacy. Procedia Comput. Sci. 2019, 164, 39–47. [Google Scholar] [CrossRef]
- Nadhom, M.; Loskot, P. Survey of Public data sources on the Internet usage and other Internet statistics. Data Brief 2018, 18, 1914–1929. [Google Scholar] [CrossRef]
- Farris, P.W.; Bendle, N.T.; Pfeifer, P.E.; Reibstein, D.J. Marketing Metrics: The Definitive Guide to Measuring Marketing Performance; Pearson Education, Inc.: Upper Saddle River, NJ, USA, 2010; ISBN 0-13-705829-2. [Google Scholar]
- Mero, J.; Tarkiainen, A.; Tobon, J. Effectual and causal reasoning in the adoption of marketing automation. Ind. Market. Manag. 2020, 86, 212–222. [Google Scholar] [CrossRef]
- Ancillai, C.; Terho, H.; Cardinali, S.; Pascucci, F. Advancing social media driven sales research: Establishing conceptual foundations for B-to-B social selling. Ind. Market. Manag. 2019, 82, 293–308. [Google Scholar] [CrossRef]
- Dospinescu, O.; Anastasiei, B.; Dospinescu, N. Key factors determining the expected benefit of customers when using bank cards: An analysis on millennials and generation Z in Romania. Symmetry 2019, 11, 1449. [Google Scholar] [CrossRef] [Green Version]
- Carp, M.; Păvăloaia, L.; Afrăsinei, M.-B.; Georgescu, I.E. Is Sustainability Reporting a Business Strategy for Firm’s Growth? Empirical Study on the Romanian Capital Market. Sustainability 2019, 11, 658. [Google Scholar] [CrossRef] [Green Version]
- Necula, S.C.; Strîmbei, C. People Analytics of Semantic Web Human Resource Résumés for Sustainable Talent Acquisition. Sustainability 2019, 11, 3520. [Google Scholar] [CrossRef] [Green Version]
- Munteanu, A. Running the risk IT–more perception and less probabilities in uncertain systems. Inf. Comput. Secur. 2017, 25, 345–354. [Google Scholar] [CrossRef]
Figure 1.
Research design.
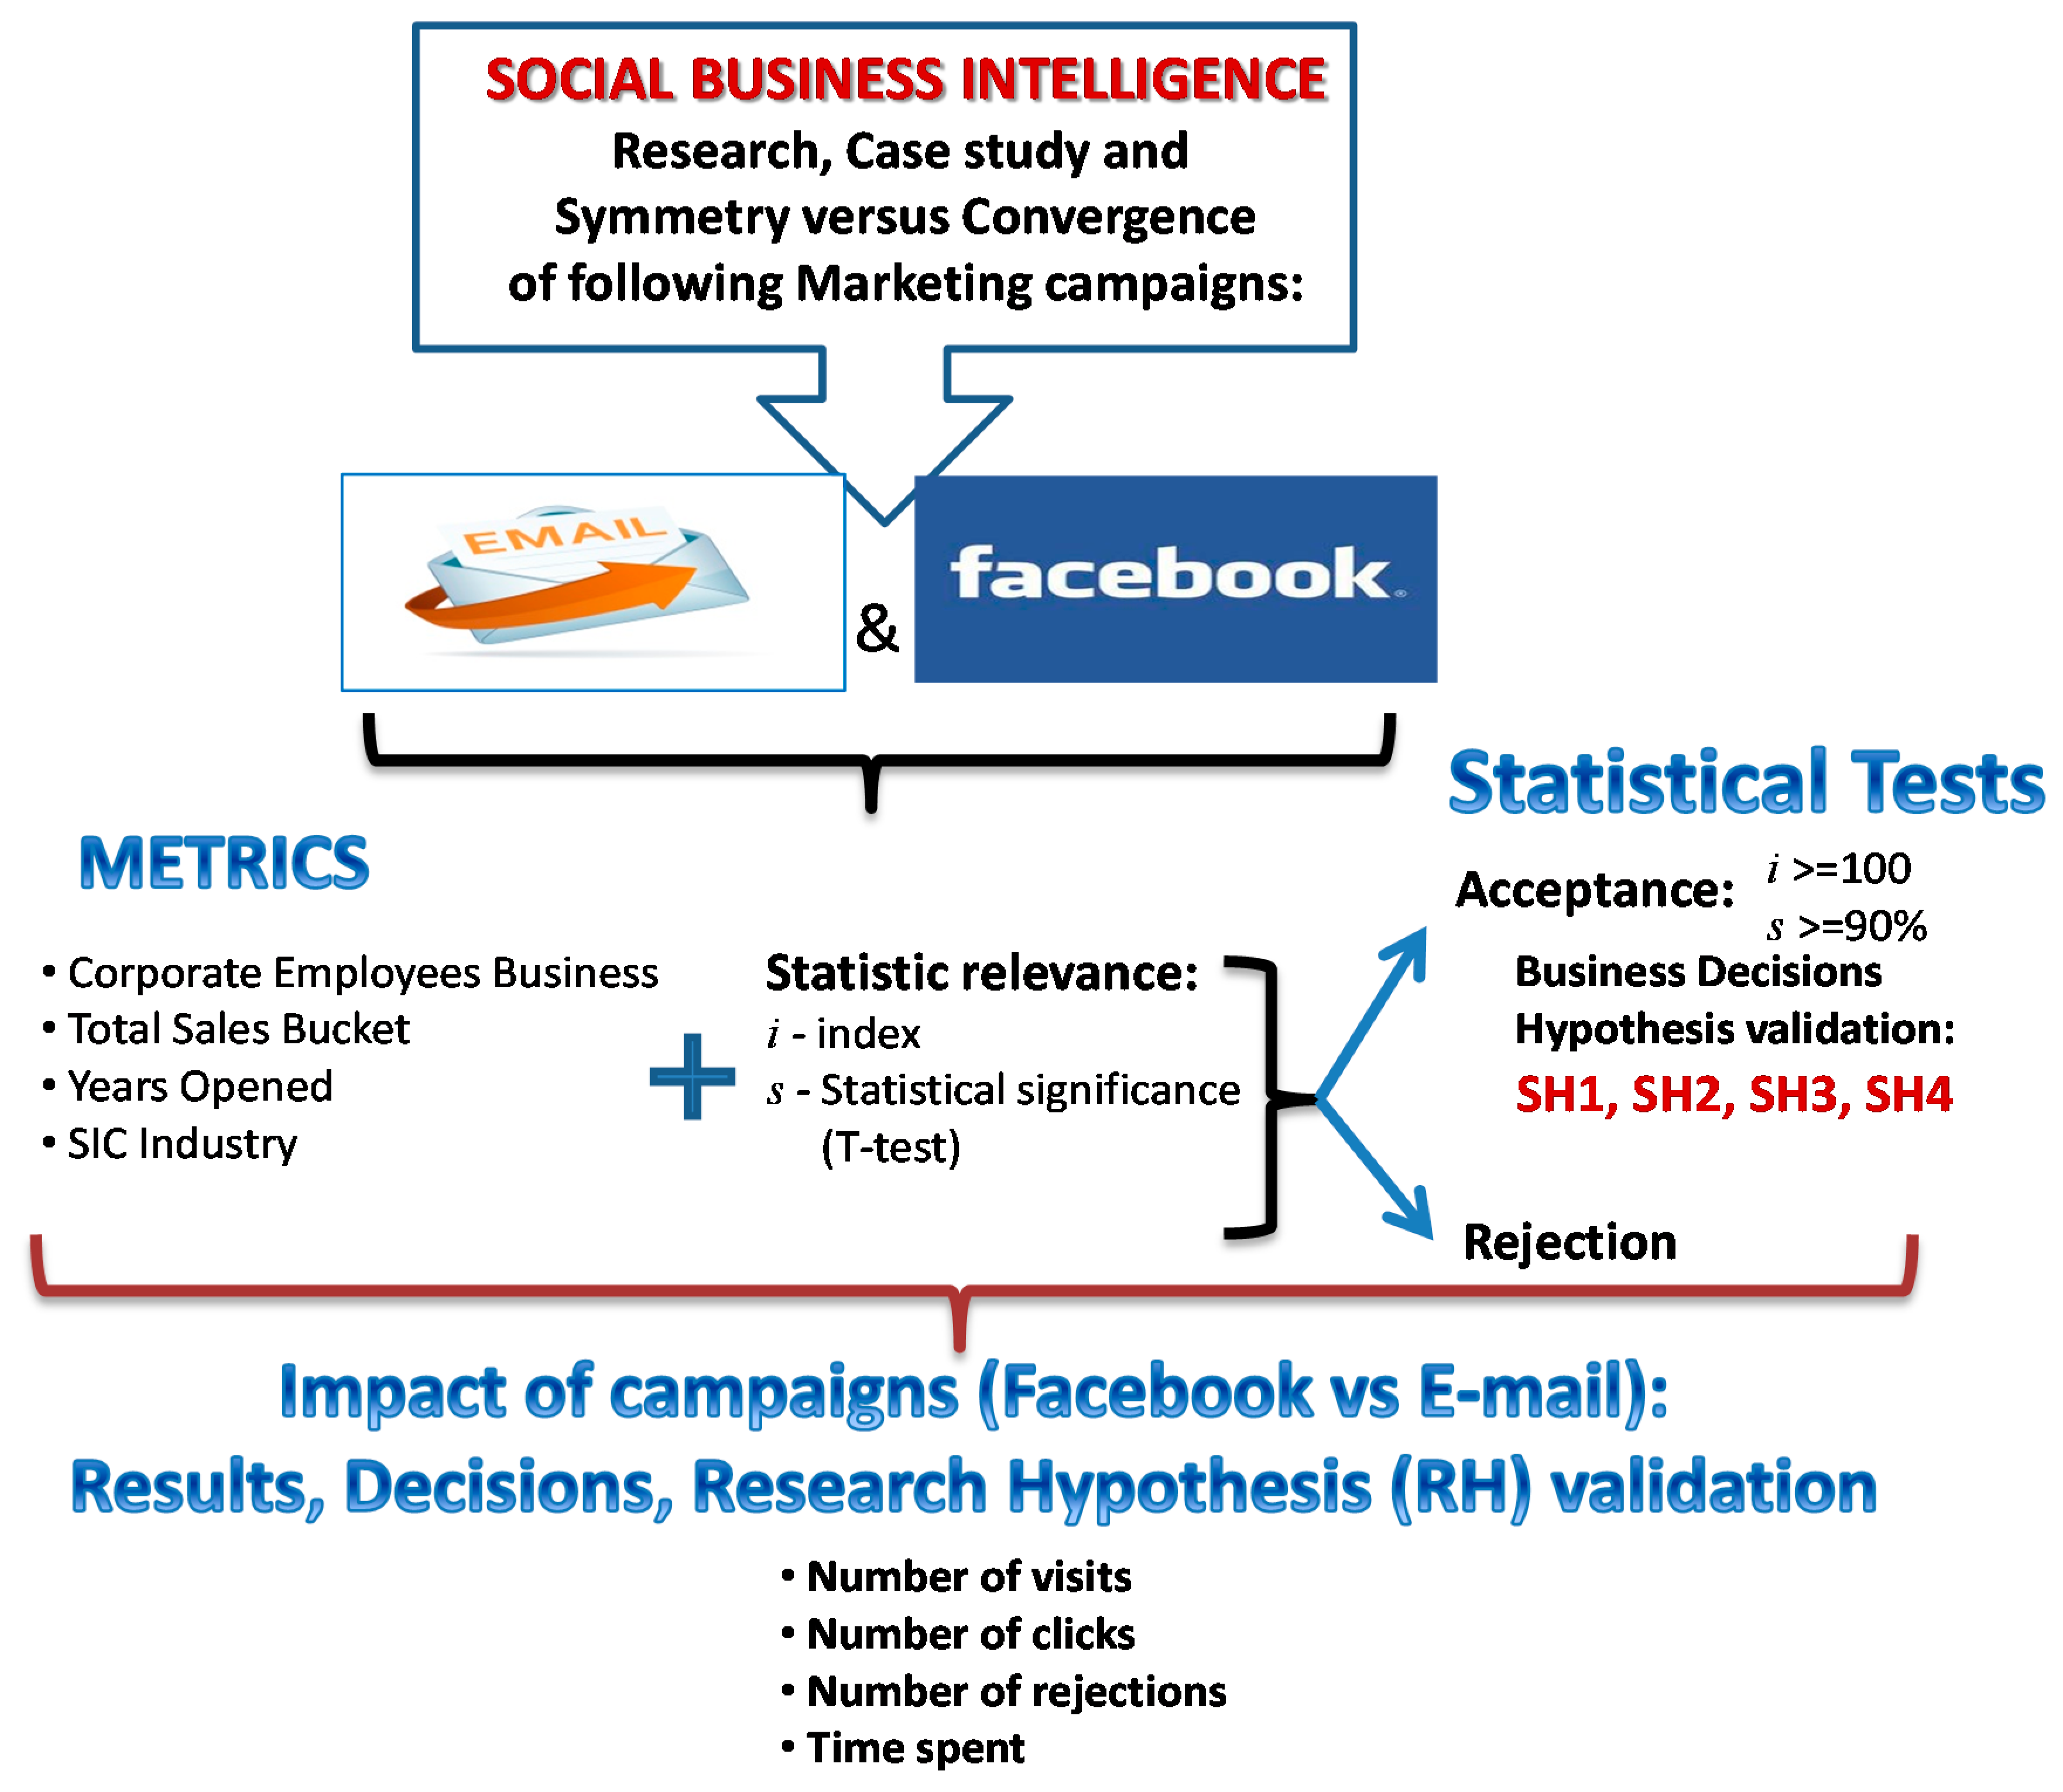
Figure 2.
Potential target market configuration by active clients using Facebook Business Manager.
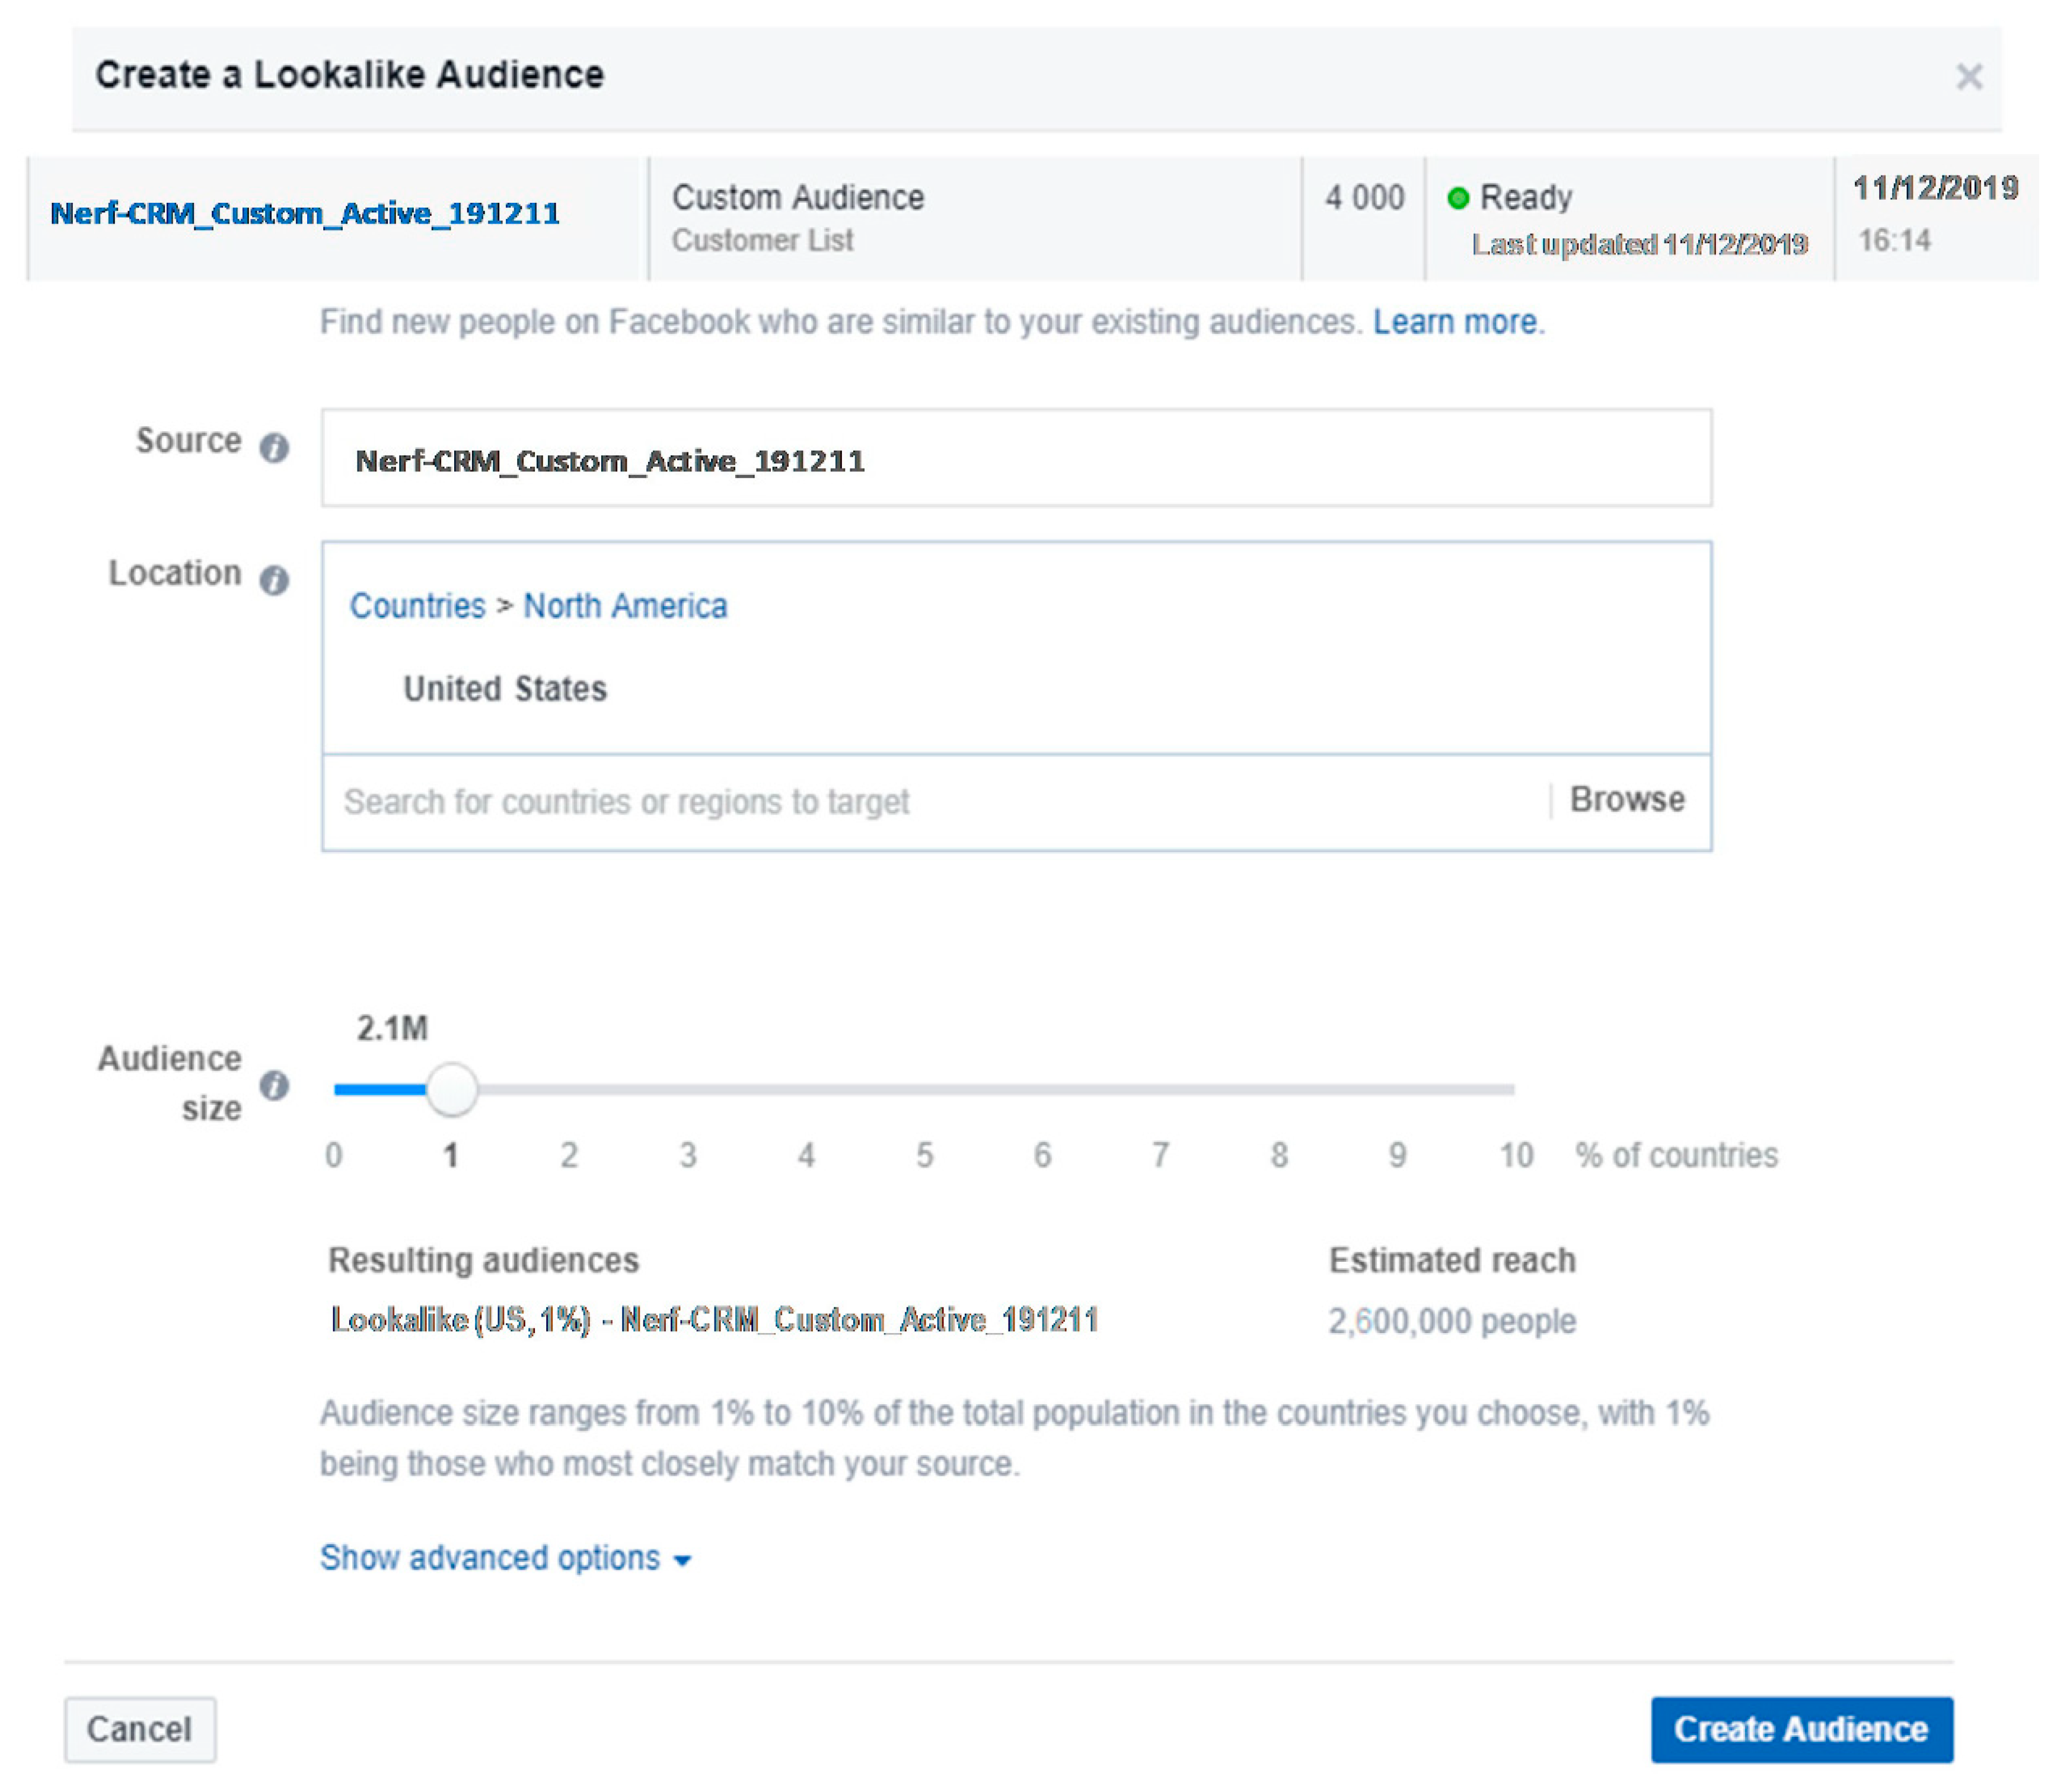
Figure 3.
Extract, transform, load (ETL) workflow in Alteryx made to prepare data sources for the Tableau report.
Figure 3.
Extract, transform, load (ETL) workflow in Alteryx made to prepare data sources for the Tableau report.
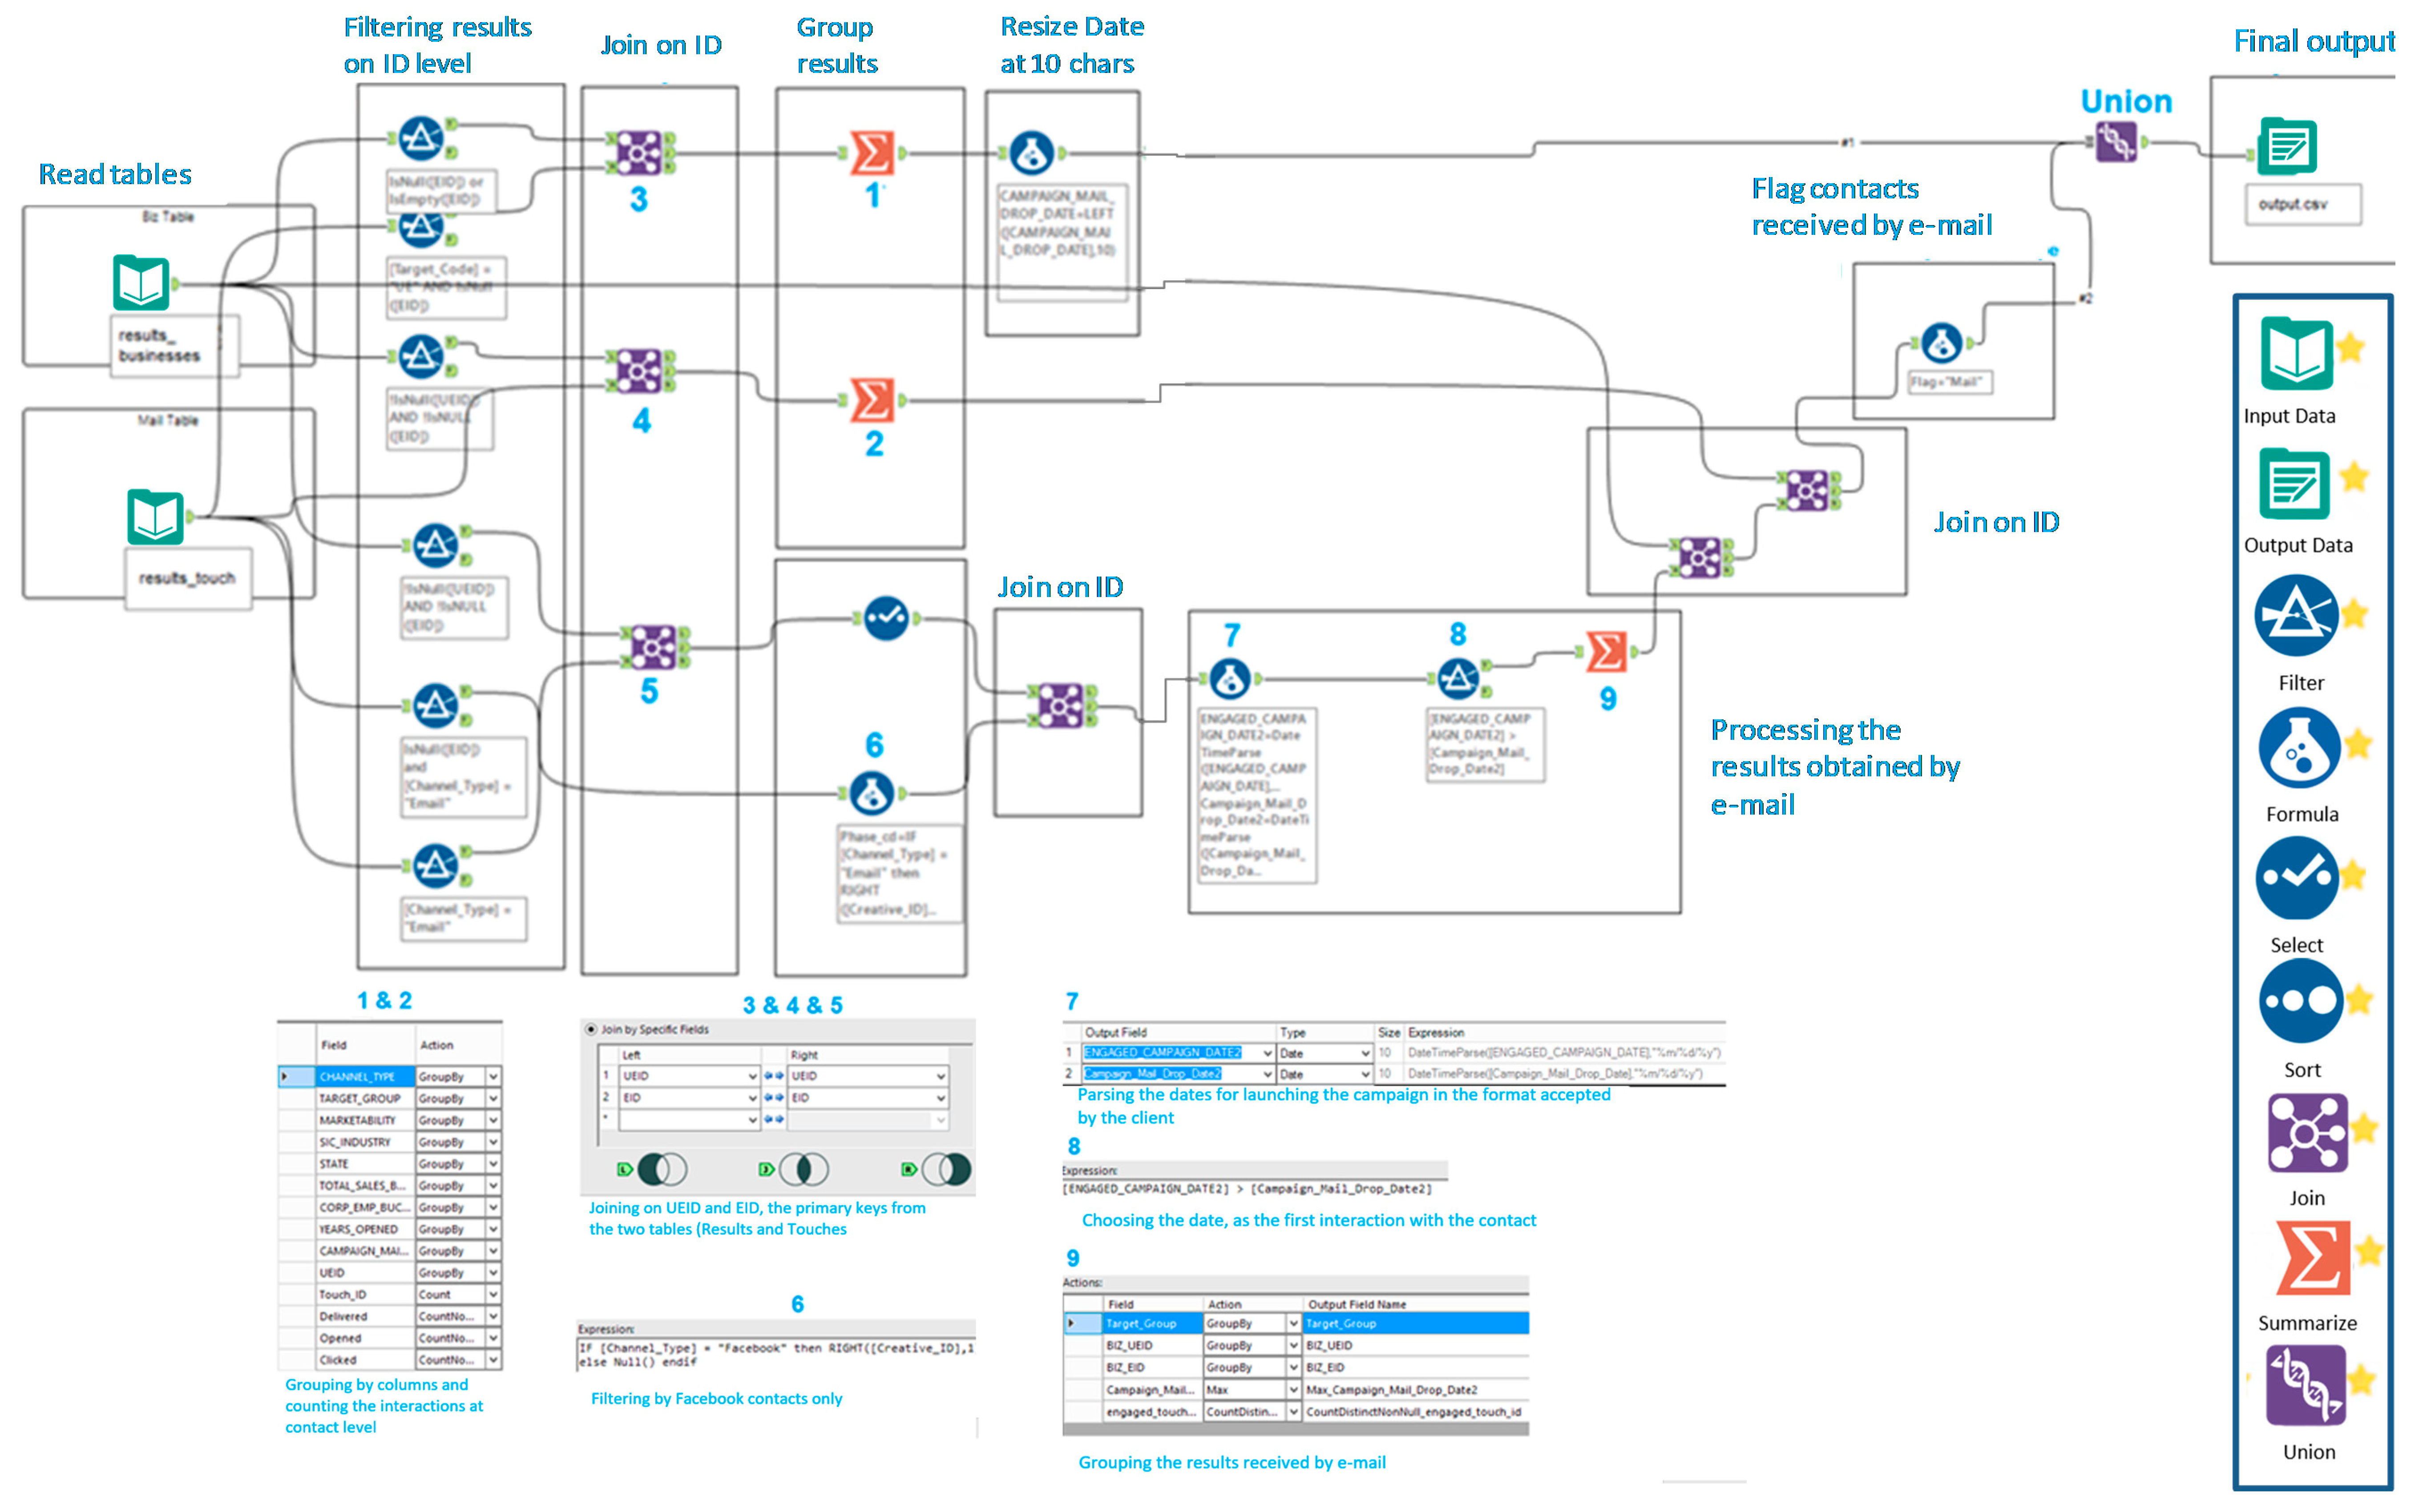
Figure 4.
Graphic representation of index formula/statistical significance in Excel.

Figure 5.
Social Media (SM) campaign drop date and the number of successful interactions (# of opt-ins) on Facebook.
Figure 5.
Social Media (SM) campaign drop date and the number of successful interactions (# of opt-ins) on Facebook.
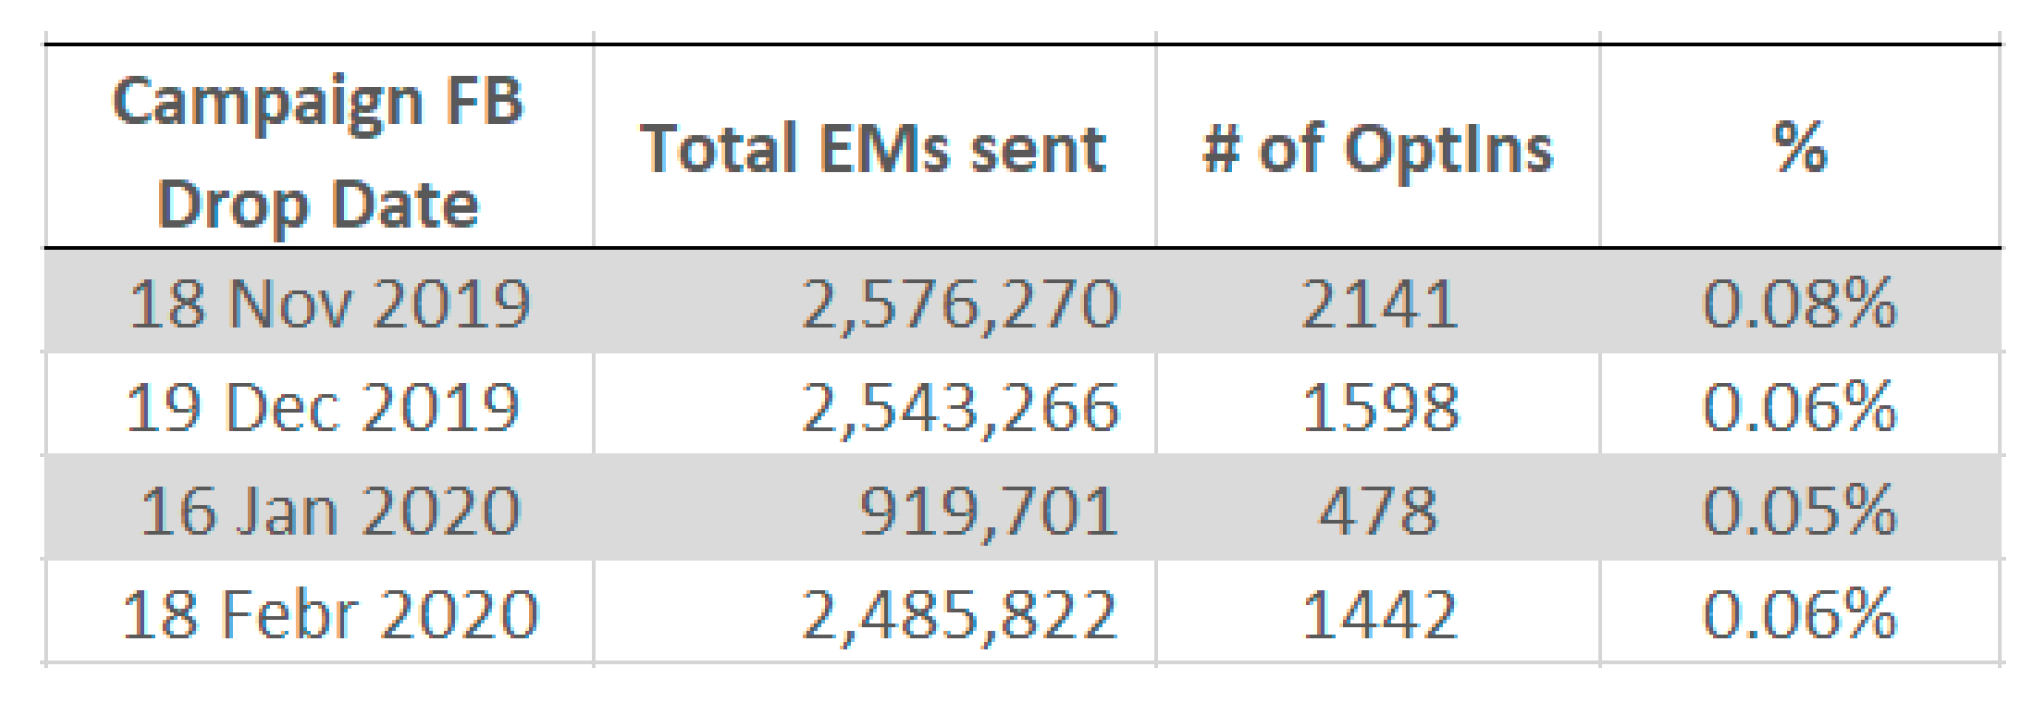
Figure 6.
Bounce rate and the average time on page for visitors of the insurance company’s website.
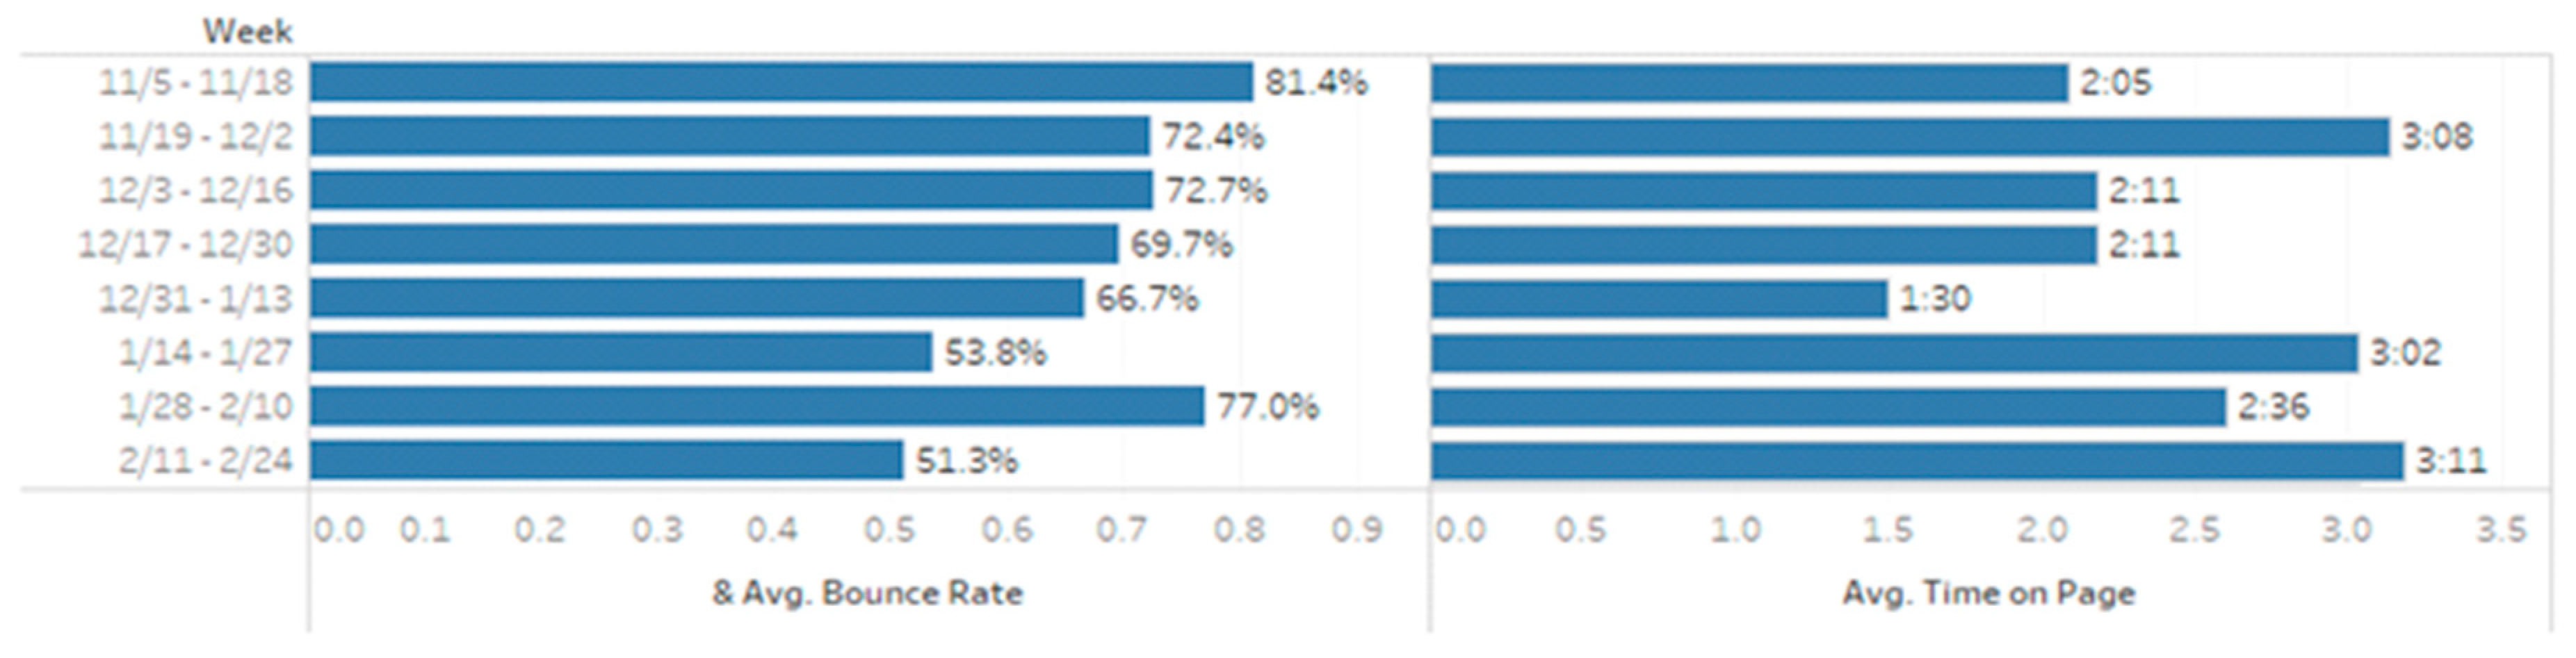
Figure 7.
Actions on reference channels.
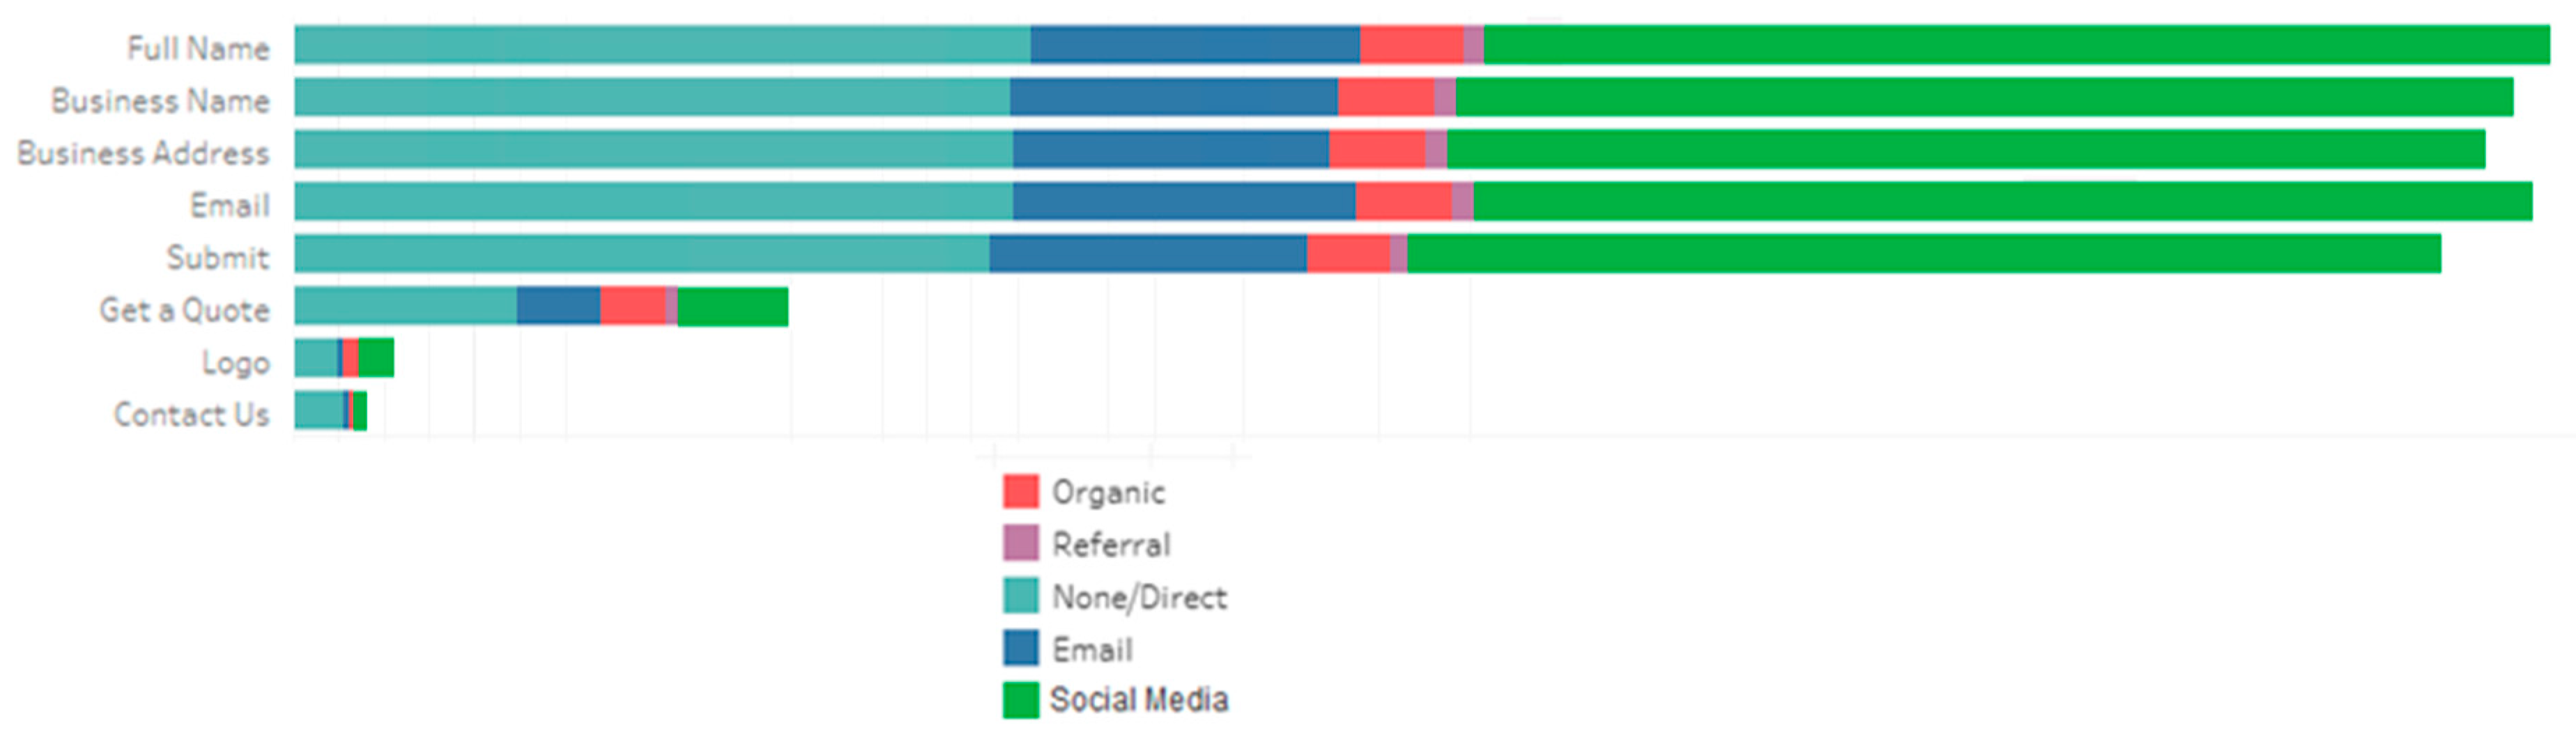
Figure 8.
General information on email campaign.

Figure 9.
Statistical significance of FB campaign based on Corporate Employee.
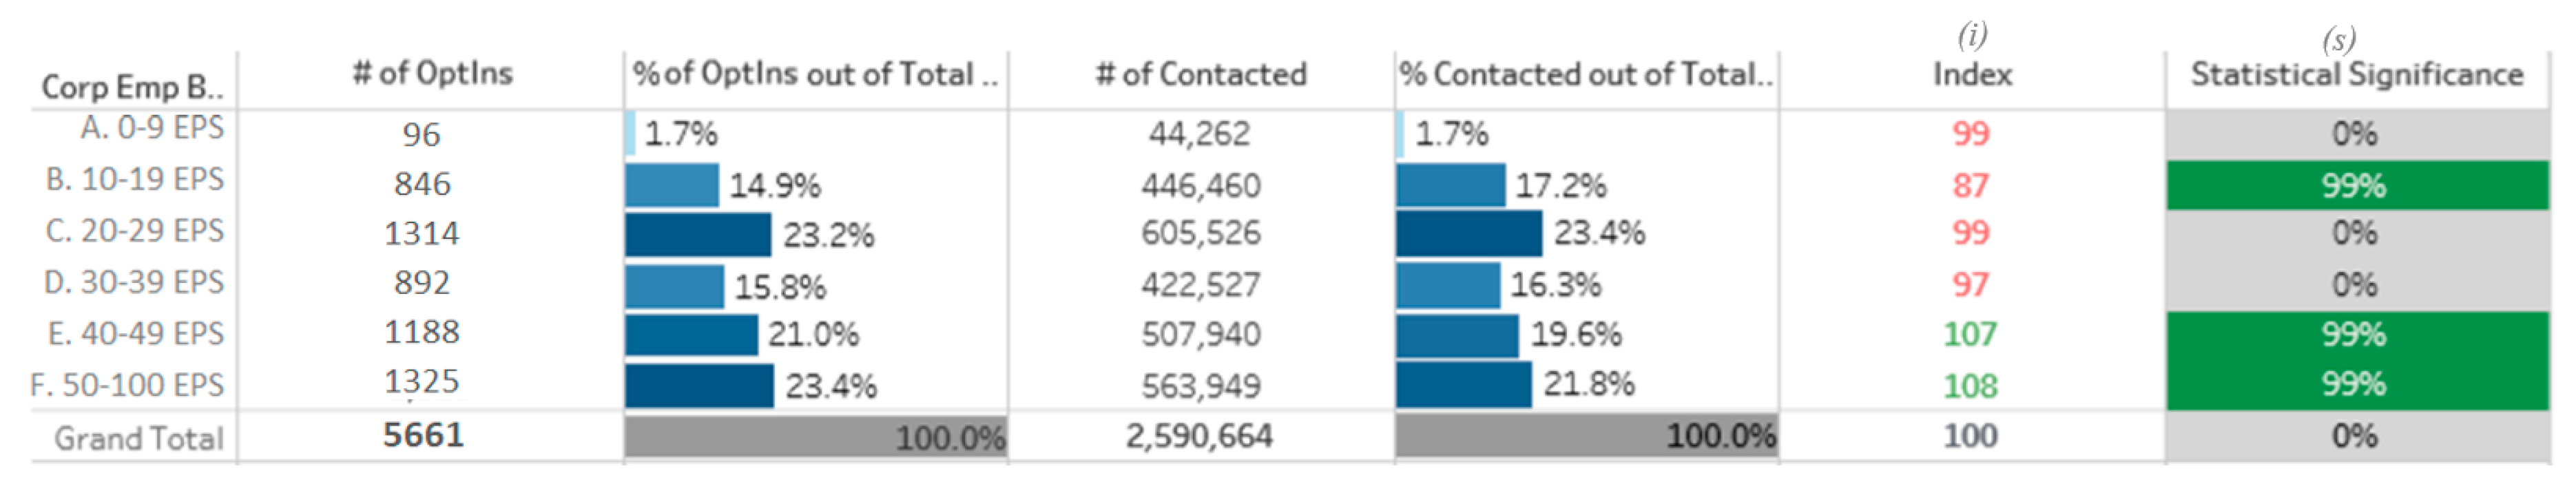
Figure 10.
Statistical importance of FB campaign based on years opened.
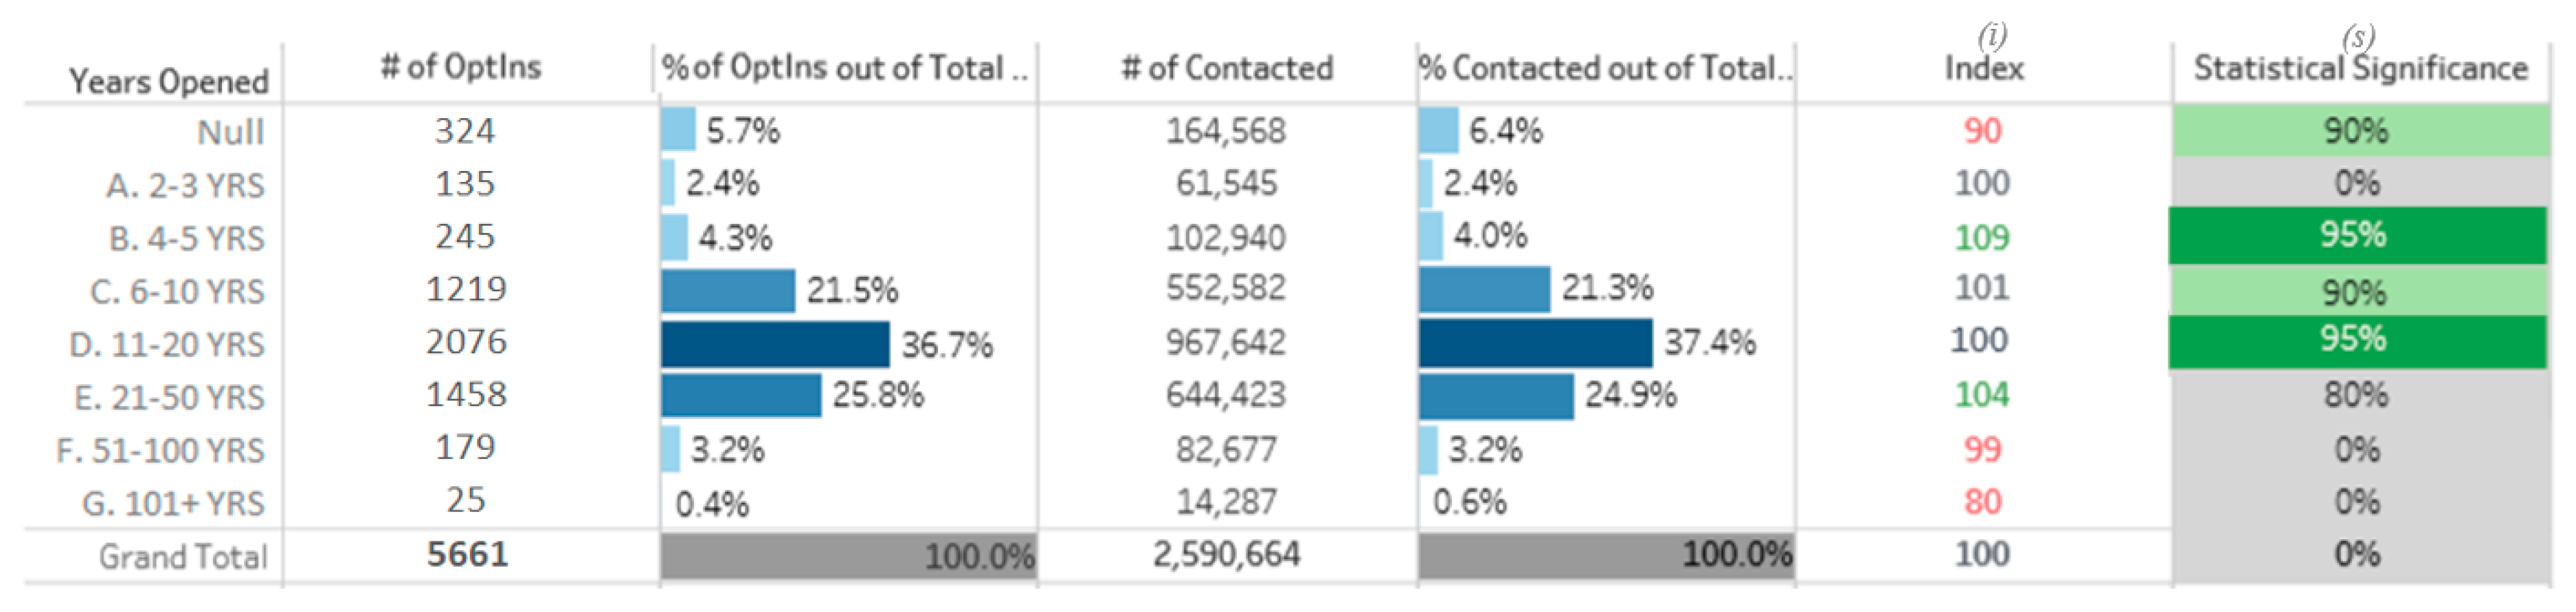
Figure 11.
Statistical significance of FB campaign based on total sales bucket.
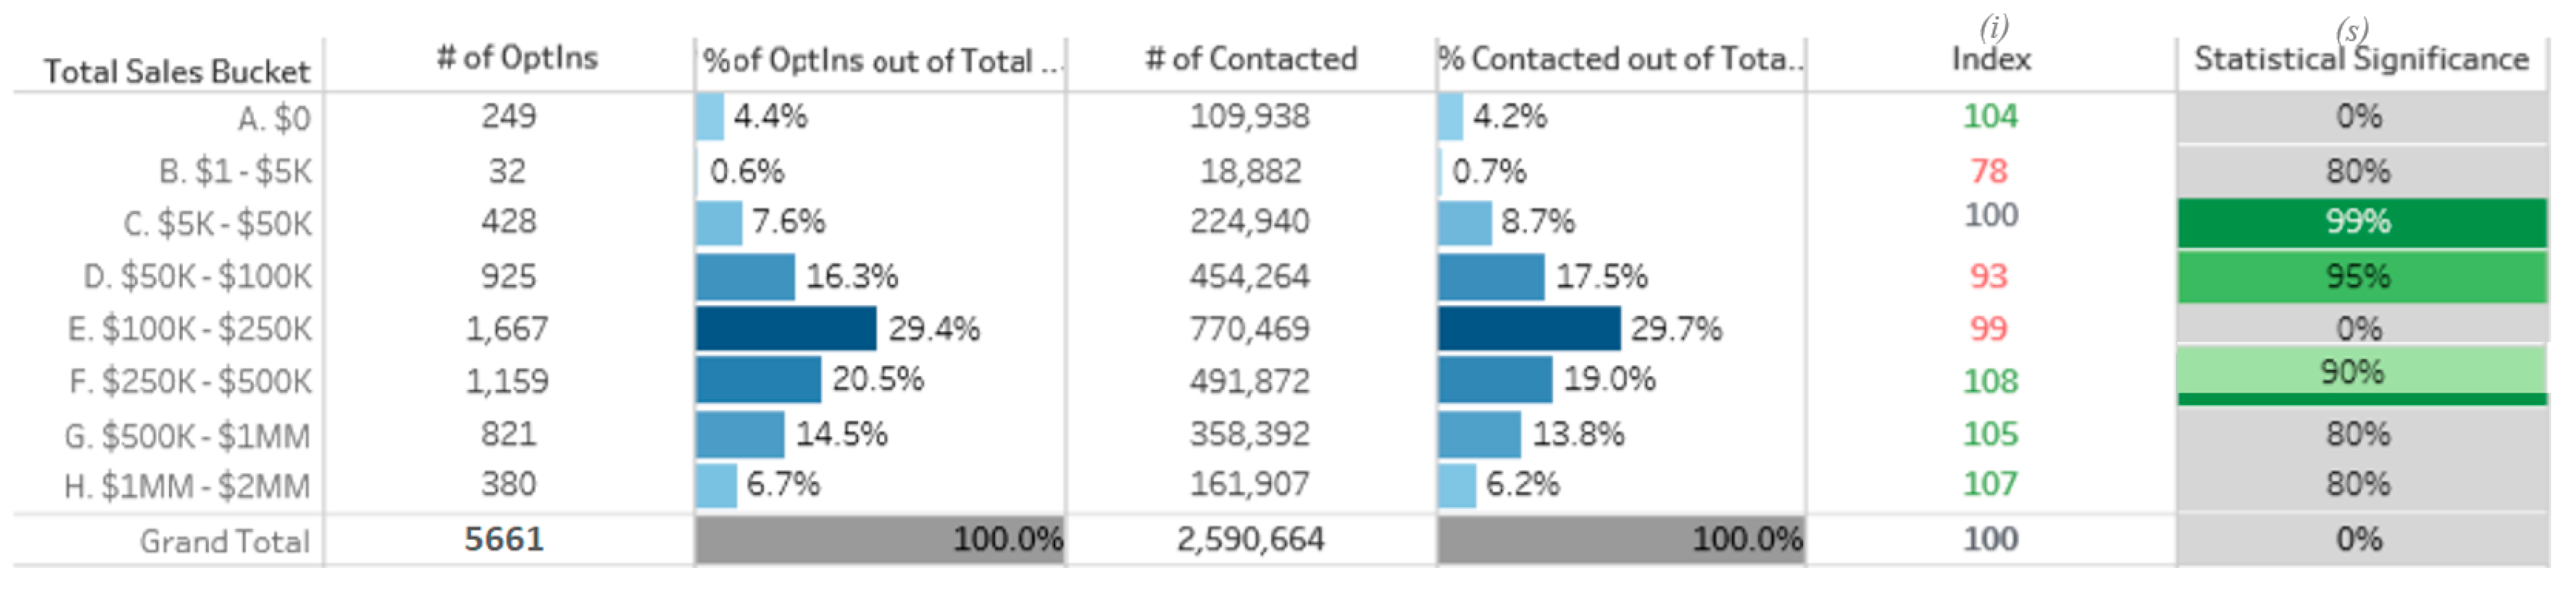
Figure 12.
Statistical significance of FB campaign by Standard Industrial Classification (SIC) Industry.
Figure 12.
Statistical significance of FB campaign by Standard Industrial Classification (SIC) Industry.
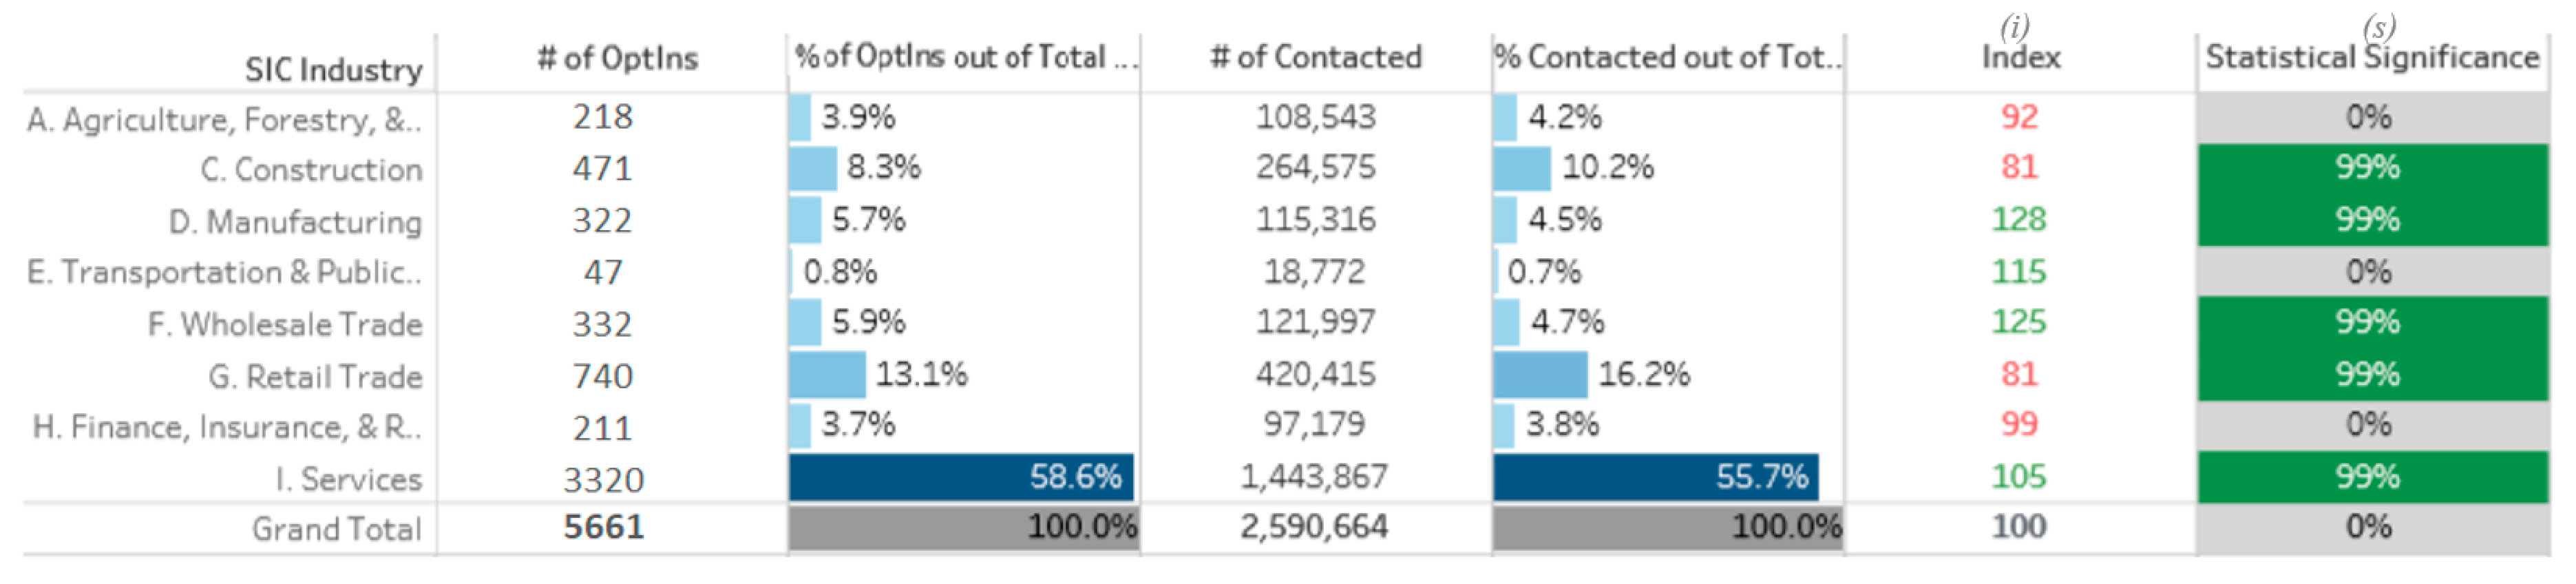
Figure 13.
Statistical significance of e-mail campaign based on corporate employee.

Figure 14.
Statistical significance of e-mail campaign based on total sales bucket.

Figure 15.
Statistical significance of e-mail campaign based on company’s years opened.
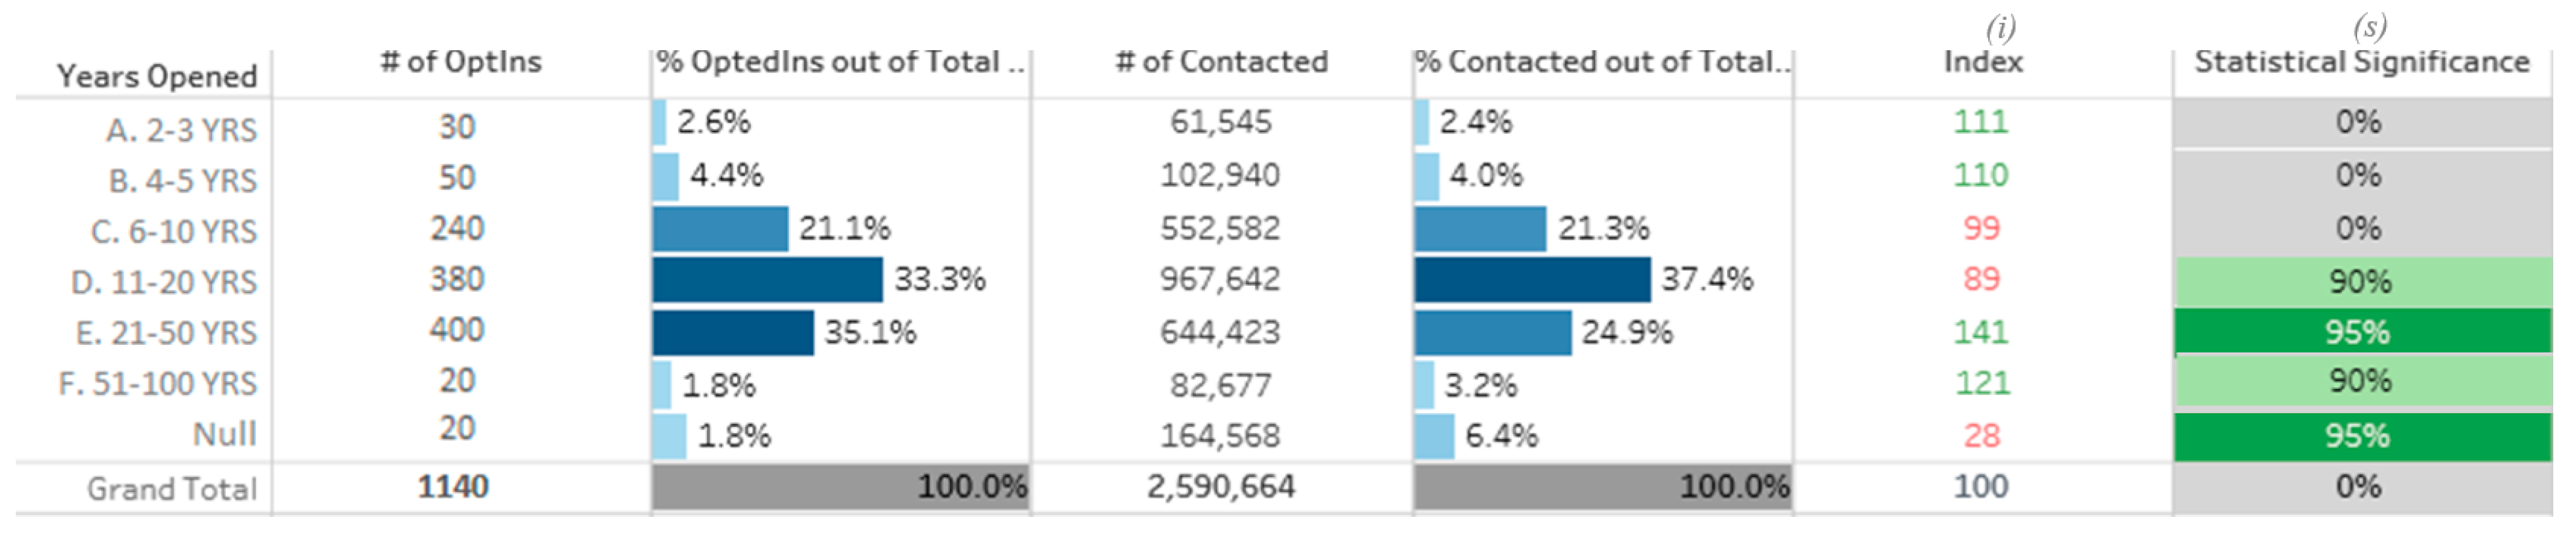
Figure 16.
Statistical significance of e-mail campaign based on SIC Industry.


Table 1.
Summary of validated results (decision = accept) for the marketing campaigns run on Facebook and through e-mail.
Table 1.
Summary of validated results (decision = accept) for the marketing campaigns run on Facebook and through e-mail.
| Metrics Included in the Analysis | Index (i) | Statistical Significance (s) | Decision | Index (i) | Statistical Significance (s) | Decision | |
|---|---|---|---|---|---|---|---|
| Facebook Marketing Campaign | E-mail Marketing Campaign | ||||||
| Corp Emp Buss | 10–19 EPS | - | - | - | 100 | 90% | Accept |
| 40–49 EPS | 107 | 99% | Accept | - | - | - | |
| 50–100 EPS | 108 | 99% | Accept | 137 | 95% | Accept | |
| $5 k–$50 k | - | - | - | 100 | 90% | Accept | |
| Total sales bucket | $50 k–$100 k | 100 | 95% | Accept | - | - | - |
| $250 k–500 k | 108 | 99% | Accept | 139 | 95% | Accept | |
| $500 k–$1 mm | 105 | 90% | Accept | - | - | - | |
| SIC Industry | Construction | - | - | - | 112 | 90% | Accept |
| Services | 105 | 99% | Accept | - | - | - | |
| Retail trade | - | - | - | 100 | 95% | Accept | |
| Wholesale trade | 125 | 99% | Accept | - | - | - | |
| Manufacturing | 128 | 99% | Accept | - | - | - | |
| Years opened | 4–5 years | 109 | 95% | Accept | - | - | - |
| 6–10 years | 101 | 90% | Accept | - | - | - | |
| 11–20 years | 100 | 95% | Accept | - | - | - | |
| 21–49 years | - | - | - | 141 | 95% | Accept | |
| 50–100 years | - | - | - | 121 | 90% | Accept | |
Publisher’s Note: MDPI stays neutral with regard to jurisdictional claims in published maps and institutional affiliations. |
© 2020 by the authors. Licensee MDPI, Basel, Switzerland. This article is an open access article distributed under the terms and conditions of the Creative Commons Attribution (CC BY) license (http://creativecommons.org/licenses/by/4.0/).
Share and Cite
MDPI and ACS Style
Păvăloaia, V.-D.; Anastasiei, I.-D.; Fotache, D. Social Media and E-mail Marketing Campaigns: Symmetry versus Convergence. Symmetry 2020, 12, 1940. https://doi.org/10.3390/sym12121940
AMA Style
Păvăloaia V-D, Anastasiei I-D, Fotache D. Social Media and E-mail Marketing Campaigns: Symmetry versus Convergence. Symmetry. 2020; 12(12):1940. https://doi.org/10.3390/sym12121940
Chicago/Turabian StylePăvăloaia, Vasile-Daniel, Ionuț-Daniel Anastasiei, and Doina Fotache. 2020. "Social Media and E-mail Marketing Campaigns: Symmetry versus Convergence" Symmetry 12, no. 12: 1940. https://doi.org/10.3390/sym12121940
Note that from the first issue of 2016, this journal uses article numbers instead of page numbers. See further details here.