Symmetric Networks with Geometric Constraints as Models of Visual Illusions

1
Mathematics Institute, University of Warwick, Coventry CV4 7AL, UK
2
Department of Mathematics, Ohio State University, Columbus, OH 43210, USA
*
Author to whom correspondence should be addressed.
†
These authors contributed equally to this work.
Symmetry 2019, 11(6), 799; https://doi.org/10.3390/sym11060799
Submission received: 17 May 2019
/
Revised: 11 June 2019
/
Accepted: 13 June 2019
/
Published: 16 June 2019
(This article belongs to the Special Issue Symmetry and Dynamical Systems)
Abstract
:Multistable illusions occur when the visual system interprets the same image in two different ways. We model illusions using dynamic systems based on Wilson networks, which detect combinations of levels of attributes of the image. In most examples presented here, the network has symmetry, which is vital to the analysis of the dynamics. We assume that the visual system has previously learned that certain combinations are geometrically consistent or inconsistent, and model this knowledge by adding suitable excitatory and inhibitory connections between attribute levels. We first discuss 4-node networks for the Necker cube and the rabbit/duck illusion. The main results analyze a more elaborate model for the Necker cube, a 16-node Wilson network whose nodes represent alternative orientations of specific segments of the image. Symmetric Hopf bifurcation is used to show that a small list of natural local geometric consistency conditions leads to alternation between two global percepts: cubes in two different orientations. The model also predicts brief transitional states in which the percept involves impossible rectangles analogous to the Penrose triangle. A tristable illusion generalizing the Necker cube is modelled in a similar manner.
1. Introduction
Visual perception involves puzzling phenomena when ambiguous or incomplete information is presented to one or both eyes, Blake and Logothetis [1]. (Binocular) rivalry occurs when two different images, presented one to each eye, lead to alternating percepts, possibly of neither image separately, see for example Breese [2], Wilson [3,4]. Illusions, or multistable figures, occur when a single image, either static or moving, can be perceived in several ways, see for example Eagleman [5], Leopold and Logothetis [6]. Impossible objects occur when a single image has locally consistent but globally inconsistent geometry. A famous example is the Penrose triangle, Penrose and Penrose [7], Wikipedia [8]. A selection of illusions and impossible objects can be found at Sherman [9], with links to other sources.
The main mathematical objectives of this paper are to apply existing models of rivalry, based on so-called Wilson networks, Section 2, to the closely related phenomena of illusions; to develop more elaborate models that implement the concept of geometric consistency, to be described in a moment; to use symmetry methods to provide rigorous analytic results about such models; and to confirm the symmetry analysis using numerical simulations. The power of symmetry-based methods is demonstrated by the analysis of a system of differential equations in 32 variables and 5 parameters, the 16-node model for the Necker cube. Without symmetry and the general organizing principles of symmetric dynamics it would be impossible to investigate a model of that dimensionality by analytic methods. The only recourse would be to numerical simulations, and even then it would be difficult to survey a 5-dimensional parameter space. Instead, we use the analytic results as a guide for illustrative simulations.
The models we use are adapted from similar models of decision-making in the brain, based on ideas of Wilson [3,4,10], which in turn derive from neurological models of Wilson and Cowan [11]. The phenomenon of rivalry is analogous to illusion, but with an important additional feature. The structure of rivalry models based on Wilson networks is largely determined by pairs of learned images, presented one to each eye. In contrast, for an illusion only one image is presented. Our illusion models are constructed using a substitute for learned patterns: the hypothesis that the brain has already pre-learned a catalogue of real-world forms, and that these geometric consistency conditions can be represented in the network by excitatory and inhibitory connections. Excitatory connections reinforce associations between features that are consistent with known geometry; inhibitory ones repress such associations between features that, in conjunction, are geometrically implausible or impossible. Our aim is to examine whether connections of this kind in a Wilson network can produce coherent global percepts from fragmentary local information. Our results suggest that this is not only possible, but natural.
As is standard with this kind of modelling, the models discussed here are not direct representations of known neural correlates of visual perception, or ‘wiring diagrams’ of known networks of neurons (although they have some features in common with real networks, such as the V1 layer of the visual cortex, see Section 2.1). Instead, our intention is to analyze schematic aspects of simple neuronal networks, showing how their structure proves a natural way to enable the recognition of images from incoming optical stimuli, based on geometric consistency. Illusions occur when this system ‘recognizes’ two or more alternatives in the same image, and this phenomenon provides insights into the underlying dynamics in normal image-recognition processes, Yoon and Shen [12].
Here we initially focus on bistable illusions, where the same image alternates between two distinct percepts, both static. The same approach can be used for illusions with more than two percepts, such as the tristable grating of Naber et al. [13] and a tristable variant of the Necker cube (Poston and Stewart [14], Wallis and Ringelhan [15]). We model the latter in Section 9. We show that Wilson networks, modified by connections that reinforce geometric consistency, can recognize global objects from collections of linked local data. To set up the mathematical equations in a simple context, we begin with very simple models already found in the literature. We then analyze more complex models in which global features (such as the orientation of a cube) are replaced by a larger set of local features (which lines in the image point in which direction). The analysis shows that simple networks with geometric insistency conditions can synthesize the local data to obtain a coherent global percept.
Our approach might in principle be adapted to moving images, but we do not discuss such extensions here. Figure 1 shows two of the three illusions we consider: the Necker cube, Necker [16], which alternates between two apparent orientations, and the rabbit/duck illusion of Jastrow [17]. The third is Figure 16 in Section 9, which has at least three interpretations.
For numerical (and some analytic) results using specific equations, we work with a widely used class of network models of the perceptual process, namely rate models (Ermentrout and Terman [18], Wilson and Cowan [11]). (The ‘model-independent’ results on symmetric Hopf bifurcation also apply to more general models with the same symmetry.) In a rate model each node has two variables, activity and fatigue. Nodes are coupled by a gain function that depends on the strengths of input connections, and percepts correspond to the most active level of each attribute. Rate models have been used to model rivalry, Diekman et al. [19,20,21]. We derive similar but significantly different models for these two illusions. In some cases we predict brief transitional percepts corresponding to impossible objects. Thus, the same type of model applies to all three types of visual effect.
Diekman and Golubitsky [19] provide an algorithmic construction for networks modelling rivalry, based on the combinations of attribute levels in the two images. This approach is not applicable to illusions because there is only one image. Instead, we assume that attribute levels satisfy ‘pre-learned’ geometric consistency conditions, and employ plausible constraints of this kind.
1.1. Neuroscientific and Image-Recognition Context
Illusions and rivalry have attracted considerable attention, both in neuroscience and in computer image recognition, because they are interesting in their own right, and because they also offer clues about how the visual system might function. Often the best way to find out how a system works is to observe it when it malfunctions—or appears to malfunction, when its correct operation leads to surprising outcomes. The literature on illusions and rivalry is very large. To place our work in context, we briefly describe a representative sample of some of the research in this area, focusing on background information not otherwise discussed in this paper. This summary is by no means exhaustive. We follow common practice in treating rivalry and illusions as distinct but closely related phenomena, with many common features, and therefore cite literature for both; see Section 10.
General works on illusions include Gregory [22,23]. The latter includes a classification of illusions into distinct types. Changizi et al. [24] also propose a classification that organizes over 50 types of illusion into a matrix of 28 classes. They show how specific factors, such as smaller sizes or greater luminance contrast, often have similar perceptual effects. They propose that the visual system has mechanisms that compensate for delays in neural signaling that occur during motion.
Bach and Poloschek [25] discuss a variety of geometric illusions, beginning in 1860 with the discovery by Zöllner [26] (see also Wikipedia [27]) that when short lines meet parallel lines at an acute angle, the parallel lines appear to diverge. Similar illusions are Fraser’s Spiral (where concentric circles are perceived as spirals, Fraser [28], Wikipedia [29]) and the Poggendorff illusion, observed in the 19th century (if an oblique line is interrupted, the resulting segments can appear to shift vertically or horizontally, Wikipedia [30]). A common feature of these illusions is that the visual system overestimates small angles. The authors suggest an explanation based on the receptive field—the region in which a visual stimulus directly changes the firing pattern of a neuron. It is known (Maffei and Fiorentini [31], Allman et al. [32]) that neurons can also change as a result of stimuli outside the classical receptive field, showing that neurons can integrate information from larger areas of the visual cortex. Howe et al. [33] use a database of range images, which include distance data, to show that the probability distribution of possible locations of line segments, in natural environments, can account for the Poggendorff illusion.
Yoon and Shen [12] argue that mathematical modelling and computational simulations of illusions can provide useful insights for both biological and computer vision. They employ an energy-based model to analyze and simulate illusory contours. Their computations use the level-set method of Osher and Sethian [34].
There are also moving illusions, for example the spinning dancer illusion created in 2003 by Nobuyuki Kayahara, Wikipedia [35]. In this illusion the silhouette of a dancer (or other shapes, for example a cat) appears repeatedly to reverse its direction of spin. Bernal et al. [36] relate the timing of reversals to random fluctuations in the brain, while Troje and McAdam [37] discuss sources of perceptual bias. Other factors that can affect visual perception, and are demonstrated by illusions, are high-level grouping, Grossberg and Pinna [38], and figure/ground separation, perhaps caused by signals travelling at different speeds, Pinna and Gregory [39].
The development of fMRI has made it possible to study the neural correlates of rivalry and illusions in detail in experimental animals and humans. Bernal et al. [36] use this technique to investigate the spinning dancer illusion. Logothetis and Schal [40] have studied the physiology of changing percepts in awake, behaving monkeys at the single-cell level. Leopold and Logothetis [41] have made recordings from neurons in areas V1, V2, V4, and MT, finding that initially only a small proportion of cells responds to the perception of the dominant stimulus, while the remainder continue responding to low-level features. At higher levels of processing, increasingly many neurons respond to the dominant stimulus, and eventually most neurons in the visual areas of the temporal cortex fire in patterns that correlate with this stimulus, Sheinberg and Logothetis [42].
There are two main theories about the sources of competition in rivalry, Laing et al. [43]. Either rivalry arises from competition between the two eyes, or from competition between coherent perceptual representations. In the first case, rivalry is represented as time-periodic oscillations; in the latter, it occurs via noise-driven transitions between two stable equilibria, Moreno-Bote et al. [44]. The above observations lead Logothetis et al. [45] and Dayan [46] to conclude that the previously popular suggestion that rivalry arises from competition between the two eyes is incorrect; instead, it arises from competition between top-down cortical explanations for the inputs. However, some fMRI evidence supports competition between the eyes, suggesting that monocular visual cortex can resolve rivalry, Tong and Engel [47]. We return to this issue in Section 10. Other applications of fMRI show that perceptual changes involve specific brain areas such as the ventral visual pathway, parietal and frontal regions, and the parahippocampal place area, Lumer et al. [48]; also the fusiform face area, Tong et al. [49].
1.2. Overview of the Paper
Wilson networks are introduced in Section 2, beginning with an untrained network, and then introducing and motivating geometric consistency conditions.
Section 3 sets up the dynamics of the networks, which we model using rate equations. These represent the state of the network in terms of the rate at which its nodes are active. The state of each node has two variables: an activity variable and a fatigue variable. We review basic properties of symmetry-breaking Hopf bifurcations, required for the subsequent analysis.
Section 4 discusses two models that illustrate the main principles in a simple context. The first concerns the Necker cube. The model has four nodes: two attributes, each with two levels; its symmetry group is . The levels correspond to two alternative three-dimensional configurations where edges of the image cross. The second is the rabbit/duck illusion. The network here is similar, but now the two attributes are not treated symmetrically. This network has only symmetry, leading to extra transitional states between the two main percepts. We consider both model-independent and model-dependent features.
Section 5 sets up the main network of the paper, a 16-node network representing perception of the Necker cube. There are eight attributes, each with two levels, corresponding to the orientations of lines of the image interpreted as projections of an object in . The network has symmetry, derived from geometric symmetries of the image and its likely interpretations in . Symmetry-breaking Hopf bifurcation shows that in general there are eight spatiotemporal symmetry types of periodic state, corresponding to the eight non-isomorphic irreducible representations of . We argue on heuristic grounds that symmetry-breaking and the excitatory/inhibitory nature of the connections should select exactly one of these symmetry classes of periodic pattern, which matches the observed alternation between cubes in two different orientations, and offer numerical evidence in support. In Section 7 we give a proof of this assertion for a rate model.
Section 6 begins the detailed analysis of the 16-node rate model. We compute the eigenvalues of the adjacency matrix for the general model, tabulate the general form of the critical eigenvectors, and deduce the spatiotemporal symmetries of the corresponding states using symmetric Hopf bifurcation. For more detailed model-dependent analysis we adapt the methods of Stewart [50,51]. These papers assume that the network is homogeneous: all nodes have the same number of input arrows of each arrow-type. This condition implies that the space in which all nodes are synchronous (fully fused states) is dynamically invariant, so fully fused states can sensibly be assumed to exist. However, the 16-node network is not homogenous, because of the extra connections for geometric consistency.
Despite this, we can make further progress analytically by restricting to the ‘special model’. This obeys natural extra conditions on connection strengths, which permit the existence of a fully fused equilibrium. The special model is analyzed in Section 7. We define gain-homogeneous rate models, which have fully synchronous states without necessarily being homogeneous. We then summarize the main results of Stewart [50,51] needed for the analysis, namely: the relation between eigenvalues and eigenvectors of the adjacency matrix and those of the Jacobian of the rate model; preservation of spatiotemporal symmetry; relation between the first symmetry-breaking Hopf bifurcation and the largest eigenvalue of the adjacency matrix. (The first bifurcation from equilibrium has the possibility of creating a stable symmetry-breaking branch. In subsequent bifurcations from equilibrium, the equilibrium itself is unstable, therefore so is the branch.) When applied to the special model, these results provide rigorous confirmation of the heuristics of Section 3.1. We prove that the ‘Necker cube’ state occurs precisely when signs of connection strengths correspond to the natural excitatory/inhibitory assumptions for geometric consistency.
Section 8 discusses short-lived transitional states, which correspond to impossible figures. Section 9 constructs a Wilson network model for an illusion analogous to the Necker cube that can be perceived in three ways. This model has trivial symmetry. Wallis and Ringelhan [15] ask why an apparently plausible fourth percept is never observed. We show that geometric consistency, in this case a form of structural stability, eliminates this fourth percept.
Section 10 adds some further speculative remarks on possible implications of our results for the visual process. We end with a short list of our main conclusions, which we also summarize here as a preview of the paper. We show how to model the perception of illusions using Wilson networks with natural geometric consistency conditions, and that such networks naturally generate global percepts such as a cube from local information. In some cases a subtler type of consistency condition comes into play: the percept should not depend on features of the image that can be destroyed by small changes, such as ‘accidental’ alignments of lines. An important mathematical feature is that the dynamics and bifurcations of sufficiently symmetric rate models can be derived analytically, even for quite complicated networks; in particular, the analytic results for the 16-node Necker cube model determine a unique spatiotemporal pattern of alternating cubes. Finally, the models sometimes predict the occurrence of very brief transitional states that fail to obey the relevant geometric consistency conditions, and these percepts correspond to impossible figures. Observing such transitional states in experimental subjects would be a challenge, however, because of their brevity, unless they can be detected using fMRI measurements or something similar.
2. Wilson Networks
Our approach is motivated by Wilson [3,4,10], who proposes a neural network model for high-level decision-making in the brain, motivated by binocular rivalry. Following Diekman and Golubitsky [19] and Diekman et al. [21] we call such a model a Wilson network. In its simplest form, an (untrained) Wilson network consists of a rectangular array of nodes. Nodes can be thought of as model neurons, or populations of neurons, Wilson and Cowan [11], but for modelling purposes they need not be given any specific physiological interpretation.
Each column of the array corresponds to an attribute of an image presented to the eye: a feature such as color or orientation. Each attribute has a range of alternatives: for example, color could be red, blue or green; orientation could be vertical, horizontal, or diagonal. These discrete possibilities are the levels of that attribute. Each level corresponds to a node in the attribute column concerned.
The architecture of a Wilson network is designed to detect patterns by responding more strongly to ‘learned’ combinations of specific levels, one for each attribute. In the original formulation, all columns have the same number of levels. This restriction can be removed, but is sufficient for this paper.
In each column, distinct nodes are connected to each other by inhibitory couplings (in both directions—reciprocal or bidirectional coupling). Without further input or modification, this structure creates a ‘winner-takes-all’ dynamic in the column, so that usually only one node is dynamically active. The column then ‘detects’ the corresponding level of its attribute. Figure 2 (left) shows five columns, corresponding to five separate attributes, each with three levels, and the inhibitory connections between them.
The image(s) presented to the eye(s) are modelled by adding all-to-all excitatory connections corresponding to the appropriate combination of levels. In a rivalry model, such connections are added for both images. In that case Diekman et al. [21] show that the model makes an unexpected prediction: the possible occurrence of derived patterns, which differ from the learned patterns. This prediction agrees with some experiments, Blake and Logothetis [1], Hong and Shevell [52], Kovács et al. [53], and Shevell et al. [54]. The same approach leads to new predictions for other pairs of images, which are currently being investigated experimentally.
A pattern in a Wilson network is a choice of one level in each column. To associate patterns with percepts, we assume the following Interpretation Rule: at any given time, the node that is most active in a given column determines the perceived level of that attribute. Ambiguity of perception arises when the same image leads to a dynamic state in which two or more distinct percepts occur at different times.
It is sometimes possible for the same maximum value to occur in several distinct nodes of the same column. If two or more nodes in the same column to have synchronous dynamics for an extended period of time we say that the state is fused. In such a fusion state the percept is ambiguous. We do not use fusion states to represent alternating percepts, as is sometimes done: instead, we explain alternating percepts as synchrony-breaking bifurcations from fusion states, as described in Section 4.1 and Section 6.2. In the symmetric networks considered here, synchrony-breaking is essentially the same as symmetry-breaking.
2.1. Geometric Consistency
Networks that model rivalry can often be constructed algorithmically using the learned patterns to determine excitatory connections, Diekman and Golubitsky [19]. A Wilson network modified by additional connections is said to be trained. For illusion models there is no explicit analogue of learned patterns—just a single image. Instead, when modelling an illusion, we add excitatory connections determined by applying conditions of geometric consistency to all relevant pairs of levels. The motivation here is the hypothesis that when a subject views an image, its interpretation must be a geometrically consistent projection of an identifiable object in 3-dimensional space. The percept is that object—or, when there is ambiguity, the set of possible percepts is the set of such objects.
We suggest that this geometric consistency condition, like the choices of attributes and levels in rivalry models, reflects pre-existing learning by the visual system. Viewing 3-dimensional objects in a variety of positions and orientations leads to the evolution of (probably very complex) networks of neurons in the brain that compare input images to a ‘catalogue’ of objects, which evolves as the brain gathers more experiences (see for example Wiesel and Hubel [55], Hirsch and Spinelli [56]). The flowchart of Figure 2 of Gregory [23] includes components for ‘top-down knowledge (perceptual)’ and ‘rules’; geometric consistency can be viewed as examples of these features. Geometric consistency is a natural feature of such a network, so it seems plausible that the standard illusions ‘work’ because in some sense the visual system ‘knows’ what kind of percept to expect. Indeed, it could not function without this kind of built-in ‘knowledge’ being present in some manner. For example, Iacuruso et al. [57] provide evidence for this kind of wired-in learned or evolved structure in the visual cortex: ‘neurons connect preferentially when their receptive fields are co-oriented and co-axially aligned’. The wiring of hypercolumns in the V1 layer of the visual cortex has similar features, Bressloff et al. [58], Golubitsky et al. [59]. More precisely, V1 consists of hypercolumns, groups of neurons that are internally all-to-all coupled (Blasdel [60]), by connections that are usually considered to be inhibitory, creating a ‘winner-takes-all’ dynamic. A second type of lateral coupling connects neurons in neighboring hypercolumns, Blasdel [60], Bressloff et al. [58]. The strongest lateral couplings are between neurons with the same orientation sensitivity, Blasdel [60] and Golubitsky et al. [59]. In effect, V1 resembles a Wilson network in which attributes are local line segments, levels are orientation, and pre-learned patterns are extended lines.
We do not propose to model in detail how geometric consistency is represented in the brain or analyzed by the visual system, although this is clearly an interesting issue. We also do not consider how previously learned geometric constraints determine excitatory connections in the decision-making network, or how the resulting percept is transmitted to other regions of the brain. Instead, we consider geometric consistency to be a background process that constrains the perception of images, just as rivalry models assume a background role for whatever provides the relevant attributes and levels.
3. Rate Equations for the Dynamics
We model the behavior of a trained Wilson network using a system of ordinary differential equations (ODEs), constructed according to the network structure. These are admissible ODEs for the network in the sense of Golubitsky and Stewart [61], Golubitsky et al. [62], and Stewart et al. [63]. Informally, an ODE is admissible if its structure respects the network architecture. The equation for any node depends only on the state of that node and those connected to it. Identical nodes or connections involve the same function of corresponding variables. Some features of the resulting dynamics are model-independent; that is, they depend only on the symmetries of the equations and the occurrence of suitable bifurcations, Diekman et al. [21]. The conditions under which these features actually occur are of course model-dependent. We find it helpful to distinguish these two types of information, because the model-independent features provide a general framework for the analysis, while the model-dependent features add detail and in principle make it possible to distinguish between different models.
For detailed analysis we employ a specific parametrized family of ODEs based on neurophysiology, known as a rate model (Diekman et al. [20,21], Ermentrout and Terman [18], Wilson and Cowan [11]). Such models are standard in this area. The nodes are numbered . The state of node i is described by a vector , where is the activity variable and is the fatigue variable. A key ingredient is the connection matrix
where is the strength of the connection from node j to node i (positive for excitation, negative for inhibition). This matrix encodes the network structure and the type of connection. The rate equations then have the form:
for . Here is the strength of reduction of the activity variable by the fatigue variable, is the timescale on which the variables evolve, and is an external signal strength to node i. For simplicity we usually let for all i. Sometimes (in some rivalry models, for instance) some nodes have instead (nodes not in any learned pattern).
Throughout the paper we make a standard choice of gain function
Please note that is very small for negative x, but is not identically zero. Thus, a ‘passive’ node might not have a state exactly equal to zero; instead, its value should be very close to zero. This assumption is convenient for simulations and is standard in the literature, so (2) is relaxed to
The value of determines how active node i is, and we use this value in the Interpretation Rule. So, the percept determined by a given state of the system is interpreted as the pattern formed by choosing, in each column, whichever node maximizes the activity variable.
When modelling rivalry and illusions in this manner, the deterministic model (1) typically generates time-periodic states for suitable parameters, representing periodic switching of percepts. In contrast, the switching of percepts in experiments typically has a random element. The usual explanation for this discrepancy is that external ‘noise’ from elsewhere in the brain disturbs the periodic state stochastically, Moreno-Bote et al. [44]. We do not discuss this modelling issue further, but alternative assumptions, such as heteroclinic switching between equilibria of saddle type, also deserve attention. An alternative approach to the Necker cube based on catastrophe theory, using equilibria to represent percepts and considering parametrized families of images, is in Ta’eed and Ta’eed [64]. See also Peregoy and Stewart [65] and Poston and Stewart [14].
Previous work usually assumes that all nodes have identical dynamics, all inhibitory couplings are identical, and all excitatory couplings are identical, in the sense of coupled cell systems (Golubitsky and Stewart [61], Golubitsky et al. [62], Stewart et al. [63]), so the relevant parameters are given equal values. In effect, this convention assumes that these attributes are of much the same type, and are analyzed by the brain in much the same way; also that for each attribute, all levels are treated similarly. One aim of this paper is to relax these assumptions by allowing different types of attribute, and connections with different strengths, which sometimes represent geometric consistency conditions better. For simplicity, however, we follow other authors by making features of the nodes and connections the same when there is no good reason to make them different. In particular, we use the same form of the gain function for all coupling terms and all nodes.
3.1. Symmetry-Breaking Hopf Bifurcation
The usual assumption when modelling rivalry, hence also illusions, is that oscillatory states bifurcate from fusion states, in which both percepts occur simultaneously, when such states become unstable. In experiments, fusion states are usually interpreted as a superposition of the two images; see Seely and Chow [66], Liu et al. [67], Shpiro et al. [68]. Similarly, for illusions, we can interpret a fusion state as a mental superposition of the alternative percepts, which normally corresponds to an unstable state of the model.
The standard bifurcation from a steady state to a periodic one when the steady state becomes unstable is Hopf bifurcation, Guckenheimer and Holmes [69], Hassard et al. [70]. The behavior of all our models is therefore governed by general results on Hopf bifurcation in symmetric ODEs. However, the symmetric case differs, in technical but crucial ways, from the standard Hopf bifurcation theorem. To set up the mathematical analyses of the models, we now summarize the Symmetric (or Equivariant) Hopf Theorem (Golubitsky and Stewart [71], Golubitsky et al. [72]) for the special case of finite symmetry groups.
Consider a parametrized family of ODEs
where x represents the state of the system and is a bifurcation parameter. The ODE is G-equivariant if
Suppose that in (4), as varies near there is a path of equilibria . Local bifurcations (either steady-state or Hopf) occur at points for which the Jacobian
has at least one eigenvalue on the imaginary axis, Guckenheimer and Holmes [69]. A zero eigenvalue corresponds to steady-state bifurcation, and a complex conjugate pair of purely imaginary eigenvalues corresponds to Hopf bifurcation to a time-periodic state, Hassard et al. [70].
Phase shifts on periodic states give rise to two related actions of the group , where is the circle group. With the period scaled to , there is action on time-periodic states given by
At a purely imaginary eigenvalue of the Jacobian J, where , there is also an action of on the real critical eigenspace , given by
For either action, the spatiotemporal isotropy group of v is the set of all for which . If is a subgroup of , the fixed-point space is the set of all periodic states fixed by every element of .
A representation W of G is G-simple if either
- (1)
- where V is absolutely irreducible.
- (2)
- W is irreducible of type or .
By Proposition 1.4 of Golubitsky et al. [72], the critical eigenspace is generically G-simple. Subject to some generically valid technical conditions that we omit for simplicity, the Equivariant Hopf Theorem, proved in Theorem 4.1 of Chapter XVI of Golubitsky et al. [72], states:
Theorem 1.
Consider a G-equivariant bifurcation problem(4)such that has a pair of purely imaginary eigenvalues for which is G-simple and the eigenvalues cross the imaginary axis with nonzero speed as λ increases. Let Σ be an isotropy subgroup of acting on for which
Then there exists a unique branch of small-amplitude time-periodic solutions to(4), bifurcating from , with period near , having spatiotemporal isotropy group Σ.
A subgroup satisfying (6) is said to be -axial. The amplitude and relative phase shift for each node can be derived from the critical eigenvector w using (5). The absolute values of the entries of w give the amplitudes, and their arguments give the relative phases. In general the isotropy subgroup where H is a subgroup of G and is a group homomorphism. We call such a subgroup a twisted subgroup, with twist map .
When G is abelian a G-simple critical eigenspace generically corresponds to a simple eigenvalue, so the classical Hopf bifurcation theorem applies and the bifurcating branch is locally unique. However, the Equivariant Hopf Theorem is a stronger result because the spatiotemporal isotropy subgroup determines the spatiotemporal symmetries of the state along the bifurcating branch.
Heuristic principles can provide educated guesses about phase shifts at Hopf bifurcation. In rate models, excitatory connections between two nodes tend to synchronize their dynamics, whereas inhibitory connections tend to make them antisynchronous (half a period out of phase). This heuristic must be interpreted in the context of the network as a whole and is not universally valid. However, it often works well for symmetries, as we see in Section 7.
4. Examples of Illusions
We begin with two warm-up examples: the Necker cube and the rabbit/duck illusion. We construct simple networks that capture several key features of the modelling process and the conclusions that such models can lead to. In Section 5 we apply the same methods to a more elaborate model for perception of the Necker cube, with more attributes and built-in geometric consistency, which may be slightly closer to how the brain perceives images.
4.1. Necker Cube
The simplest model for the Necker cube is a single two-node column: this is the model used in Wilson [10], Curtu [73], Curtu et al. [74], Kalarickal and Marshall [75], Laing and Chow [76], Lehky [77], Matsuoka [78], Mueller [79], Noest et al. [80], and Seely and Chow [66]. Here the attribute is ‘cube’ and the levels are the two choices of orientation. This model has symmetry. At a symmetry-breaking Hopf bifurcation the two levels oscillate with a half-period phase difference. By the Interpretation Rule, such a solution represents repeated switching between the two percepts. Curtu [73] has carried out an extensive analysis of the dynamics in this case. The neuronal competition models of Shpiro et al. [81] are similar, and include stochastic noise.
Two-node models are informative, but they assume from the start that the brain is deciding between exactly two percepts, and then models competition between them. In effect, it builds in the condition of geometric consistency on a global level, applying it to the entire image. We now take one step towards the more elaborate model analyzed in Section 5, by using a very small set of ambiguous local attributes to set up the modelling and mathematical issues in a simple example. This model is based on the two crossings, Figure 3. Each may be perceived with the horizontal line passing either over or under the vertical one. These are the two levels for each attribute.
Geometric consistency implies that if one crossing is over then the other is under. To incorporate this constraint in a Wilson network we add excitatory connections between geometrically consistent pairs of levels. As reinforcement, we can also add inhibitory connections between geometrically inconsistent pairs of levels. In Section 6 we show that doing this can have technical advantages for the mathematical analysis. Unless otherwise stated, all these extra connections are bidirectional, with equal strengths each way.
A Wilson network that has been pre-trained or has evolved to model geometric consistency at the two crossings then looks like Figure 4. Here we assume all four nodes have the same type because of geometric symmetry, and connections related by symmetry are assumed to have equal strengths. The network has symmetry, generated by left-right and top-bottom reflections.
This network is homogeneous, so it has a fully fused state in which all four nodes are synchronous. With symmetry, there are in general four distinct Hopf bifurcation types from the fully fused state, leading respectively to oscillations of the forms
where T is the period.
We claim that of these, only the fourth is likely to occur in a rate model for the network of Figure 4, at least for most parameter values (connection strengths). The reason is the heuristic principle of Section 3.1: excitatory connections between two nodes tend to synchronize them, whereas inhibitory connections tend to make them antisynchronous. This expectation agrees with numerical simulations using a rate model. It can be justified in that case by an analysis similar to that performed for the 16-node network in Section 7. Indeed, this system of ODEs is studied in detail in Stewart [50] to model biped gaits.
For Figure 4 this heuristic predicts that the pairs of nodes should synchronize, and the pairs of nodes should antisynchronize. These conditions are consistent with each other and imply that the state must be of the form . Thus three of the four types of Hopf bifurcation are excluded by the excitatory/inhibitory nature of the connections.
The rate equations are:
with as in (3). Here are connection strengths, and excitation/inhibition require and . Figure 5 shows typical time series for these equations with parameters satisfying these inequalities.
By the Interpretation Rule, this state corresponds to the percepts switching between cubes in two different orientations, as observed in experiments. The symmetry ensures that the two crossings switch exactly in phase.
4.2. Rabbit/Duck
In the 4-node Necker cube network we used symmetry to make some nodes identical and some connections identical. Symmetry within an attribute column is a standard modelling assumption for Wilson networks, loosely justified because the levels refer to the same attribute. Moreover, because the connections within an attribute column are all inhibitory, breaking this symmetry does not affect the behavior much, except for introducing small phase shifts. It does, however, disrupt the concept of fusion states. Symmetry between different attributes requires justification and is not automatically appropriate. In Figure 4 it was justified by the geometric symmetry of the image. In the absence of geometric symmetry, it makes sense not to assume identical node types for different attributes.
An example is the rabbit/duck illusion of Jastrow [17]. The key features involved in interpreting this image seem to be whether the left half represents ears or a beak, and whether the right half is a head facing right or a head facing left. Figure 6 shows two possible networks using these two attributes, each with two levels. The connections represent some of the geometric consistency conditions. If the left-hand part is ‘ears’ then the head faces to the right; but if it is ‘beak’ then the head faces to the left. A simple way to model this knowledge in the dynamics is to include unidirectional excitatory connections between nodes 1 and 3, and nodes 2 and 4; we also include inhibitory connections between nodes 1 and 4 and nodes 2 and 3, as in Figure 6 (left).
Alternatively, it is also reasonable to make these connections bidirectional, Figure 6 (right), modelling additional geometric consistency conditions: if the right-hand part is a head facing to the right then the left-hand part is ‘ears’; but if it is a head facing to the left then the left-hand part is ‘beak’. We briefly investigate both possibilities, which give very similar results. This shows that even if we incorporate just partial geometric consistency constraints, as in the left-hand model, they can generate similar percepts to those generated by more extensive lists of geometric constraints, as in the right-hand model.
We have drawn both figures assuming top-bottom symmetry: flip both columns. In these two networks we assume that the attributes are of different types, shown by different node symbols (circle, square). We make this network differ from the model for the Necker cube because there is no evident geometric symmetry between ears/beak and left/right orientation of the head.
4.3. Model-Independent Analysis
The symmetry is the permutation . The natural fusion state for both networks is given by the orbits of the symmetry group, and has the form . At a symmetry-breaking Hopf bifurcation from this fusion state we obtain linearized eigenfunctions of the forms
with small near bifurcation, Golubitsky and Stewart [71], Golubitsky et al. [72]. This model differs from that for the Necker cube, where because of the extra symmetry between the two attributes.
Figure 7 plots these functions for , with in blue and in red. Each color corresponds to an attribute column. By the Interpretation Rule, the blue curves depict an alternation in the perception of ‘ears’ and ‘beak’, and the red curves depict an alternation in the perception of the head direction. The phase shift leads to a prediction: for this model there should be four percepts, occurring in the following sequence:
- ears + head facing right = rabbit
- beak + head facing right = transitional percept
- beak + head facing left = duck
- ears + head facing left = transitional percept
Numerical solutions show that is small for this model, so the transitional periods are short.
Extra couplings between columns in the reverse direction, as in Figure 6 (right), can change , altering the sequence to (for example)
- ears + head facing right = rabbit
- ears + head facing left = transitional percept
- beak + head facing left = duck
- beak + head facing right = transitional percept
which corresponds to sufficiently small negative .
In either case the perceived state oscillates through a fixed cycle of four patterns. The transitional percepts are (not very convincing) impossible figures: a rabbit head with a beak attached to its back, and a duck head with ears attached to its front.
For a general -symmetric Hopf bifurcation the phase shift is arbitrary. Intuitively, the pairs (ears, right) = rabbit and (beak, left) = duck should be perceived most of the time, so the phase shift should be small. The excitatory/inhibitory nature of the connections might explain this.
Unlike the model for the Necker cube, these rate models do not eliminate transitional combinations that are geometrically inconsistent, such as ‘ears + head facing left’. In particular, the model does not merely predict what was put into its design.
4.4. Model-Dependent Analysis
We start with the rate model for Figure 6 (left):
We assume (inhibitory) and (excitatory).
Figure 8 shows typical dynamics for parameters that produce oscillatory states near Hopf bifurcation. Observe that the phase shift between nodes 1 (red) and 3 (green) is small, so the transition states persist only for a very short time.
Equations for the bidirectionally connected rabbit/duck network of Figure 6 (right) are:
Again, we assume (inhibitory) and (excitatory).
Figure 9 (left) shows typical dynamics for parameters that produce oscillatory states near Hopf bifurcation. Again, the phase shift between nodes 1 (red) and 3 (green) is small. The results are essentially the same as for Figure 8 (left), but the oscillations have different amplitudes from those in that figure, and are centered on different values.
In simulations we take to make phase relations clearer. The effect of the fast/slow timescale becomes greater if we make . Now the waveform becomes steeper and the phase shift becomes negligible. It would probably not be apparent in experiments, being shorter than subjects’ reaction times. For example see Figure 9 (right), where . Similar effects occur in all the models in this paper when .
5. 16-Node Necker Cube Network
The standard two-node model for the Necker cube, and the four-node model of Section 4.1, are arguably too simple to provide much insight into the decision processes involved. To some extent they build in the assumption that the eye is looking at a cube. We now consider an alternative approach to modelling perception of the Necker cube. It assumes that some segmentation process in the visual system decomposes the image into simpler pieces, Lappin and Craft [82], and analyses possible relationships between these segments using geometric consistency as a guide.
Each attribute corresponds to a straight line in the image, and it has two levels, corresponding to orientations of the line in space relative to the plane of the page: pointing forwards or backwards. To keep the analysis simple, we ignore the four vertical edges of the image and work with the eight slanting edges in Figure 10 (Left), obtaining a 16-node network consisting of eight 2-node columns. (To make the network correspond naturally to the geometry of the image, while keeping it simple, the ‘columns’ of the Wilson network are drawn as horizontal pairs.) We then add eight connections to model sensible geometric constraints.
This model is still a simplification. It is easy to design more elaborate ones with more line segments and more levels in each column, or models that segment the image in other ways. We therefore consider the 16-node model as ‘proof of concept’, showing that this kind of segmentation of the image leads to sensible results when a relatively small number of geometric consistency conditions are imposed. We do not claim that this precise architecture is present in the brain—merely that it can perform the required task using simple components and a natural architecture.
Mathematically, the model has a very useful feature: it has symmetry, so its oscillation patterns can be deduced in a model-independent manner using the theory of symmetric Hopf bifurcation, Section 3.1. (Without symmetry it would not be possible to analyze a model with 32 variables, except numerically.) The symmetries are inherited directly from the Necker cube image and the assumption of front/back symmetry in the perceived orientations of the slanting lines.
To set up the network we make the following genericity assumptions:
- (1)
- Lines that are (near) vertical in the image are (near) vertical in the 3-dimensional object detected as the percept. There is much evidence that the vertical direction is special in vision; see for example Quinn [83].
- (2)
- Lines that are (near) parallel in the image are (near) parallel in the 3-dimensional object detected as the percept.
- (3)
- Lines that are not (near) parallel in the image are not (near) parallel in the 3-dimensional object detected as the percept.
Assumption (1) removes the vertical edges from further consideration. Number the remaining edges 1–8 as shown in Figure 10 (left). This numbering groups the edges into two parallel sets: 1–4 and 5–8. Here the cube has been turned sideways to emphasize the symmetry of the image. Bistable perception still occurs for this version.
We treat these eight edges as attributes, and assign two possible levels to each edge, F and B. This gives 16 nodes: 1F, 1B, …, 8F, 8B. Now we use assumption (2) to represent geometric consistency conditions. The result is Figure 10 (right). In this figure all arrows are bidirectional and all arrows drawn using the same type of line have the same connection strength. The connection strength parameters are and .
We define two levels F and B of each attribute as follows. By assumption (1) the vertical edges are all parallel to a reference plane P (that of the page). By assumption (3) the eight numbered edges are not parallel to P. Therefore each edge has two distinct types of orientation. Type F (‘forwards’) means that when traversed from left to right, the edge points from the half-space in front of P towards that behind P. Type B (‘backwards’) means that when traversed from left to right, the edge points from the half-space behind P towards that in front of P.
Each pair of levels, called a ‘column’ in the discussion of Wilson networks, is here represented as a row, for convenience in drawing. The two levels are connected by an inhibitory link (dashed line with dots at each end) of strength . Excitatory connections (thin solid lines) of strength , together with inhibitory connections (thin dashed lines) of strength , represent the geometric constraints implied by assumption (2). For simplicity, and to keep geometric influences as local as possible, we add only nearest-neighbor connections, corresponding to adjacent parallel lines. These connections split the nodes into two connected sets of four pairs, 1–4 and 5–8. The remaining excitatory connections (thick solid lines, strength ) and inhibitory connections (thick dashed lines, strength ) represent geometric consistency conditions implied by the two crossings (edges and ). These must have opposite orientation types.
The resulting network is Figure 10 (right). It has 16 nodes, with an obvious symmetry generated by left-right and top-bottom reflection. There is also a symmetry that interchanges F and B in each pair. So, the overall symmetry group is . The overall dimension of the rate model is 32, since each node has an activity variable and a fatigue variable. Nevertheless, because of symmetry (and some pleasant features of rate models) we can obtain not just numerical results, but analytic ones.
5.1. Symmetry-Breaking Hopf Bifurcation
The Equivariant Hopf Theorem yields eight possible time-periodic patterns, shown in Figure 11. We give details in Section 6 as part of the rigorous analysis of the model.
From this list, symmetry-breaking and the heuristic principles discussed at the end of Section 3.1 select a unique symmetry class of Hopf bifurcations. Indeed, symmetry-breaking bifurcation from a fully fused state eliminates networks 1–4 in Figure 11. The excitatory/inhibitory connections for each set of parallel edges eliminate networks 7 and 8. The excitatory/inhibitory connections between sets 1–4 and 5–8 eliminate network 5. Thus, only Network 6 remains as a likely bifurcation. We verify these heuristics in Section 7 for the ‘special’ rate model, which has a fully synchronous fused state, proving that this symmetry class is the unique type of Hopf bifurcation occurring as the first bifurcation from a fully synchronous state. (The first bifurcation, when stable, determines the observed state of the system immediately after the symmetry of the fully synchronous state is broken.) In numerical simulations, the same seems to occur for the general model.
Examining the phase relations in state number 6, and bearing in mind that the symbols F and B refer to the orientation of the corresponding edge when traversed from left to right, we find that the solution repeatedly flips between two percepts which correspond to cubes in two different orientations, which is the standard Necker cube alternation. However, there is a phase shift (small in simulations) between the times when two sets of nodes and flip. These subsets are the group orbits of . This phase lag produces transitional states, much as in the rabbit/duck illusion. Notice that we did not assume from the start that the image represents a cube. Only assumptions (1, 2, 3) were made, and these involve only nearest-neighbor comparisons of edges. Of course, these local conditions do have global implications, but those are not built into the network architecture explicitly.
To back up this prediction, we use Equation (1) with the appropriate adjacency matrix to model the dynamics. The excitatory/inhibitory nature of the connections leads us to expect nodes in each pair to be a half-period out of phase. The combinations of excitatory/inhibitory pairs suggest that a top-bottom flip should leave the state invariant; a left-right flip should do the same.
A typical simulation of this network is shown in Figure 12 (left), which for clarity shows only the F nodes. Although not shown here, the time series for the corresponding B states are antisynchronous for each pair of nodes such as 1F, 1B, so there are four synchronous quadruplets:
Also, nodes and have smaller amplitude than the other four. Figure 13 separates the time series to show how they are related.
Applying the Interpretation Rule to this set of time series confirms the model-independent result: the periodic state represents switching between the two possible orientations of the Necker cube, with short-lived transitional states.
6. Analysis of the Rate Model
We now give a rigorous analysis of some features of the rate model for Figure 10, and compare the results with the heuristic arguments of the previous section. Our method follows general results of Stewart [50,51] on rate models. We can obtain fairly detailed results because rate models (with their usual type of gain function) have special features, which are mathematically convenient.
Remark 1.
To begin with we assume that the connection strengths are arbitrary. In particular we do not place the natural excitatory/inhibitory restrictions on their signs. Later, we use the signs to determine the pattern of the first Hopf bifurcation, which creates alternating percepts, and derive the percepts corresponding to observations of the Necker cube illusion.
6.1. Eigenstructure of the Adjacency Matrix
In Stewart [50,51] it is proved that for rate equations, eigenvalues and eigenvectors of the Jacobian at a fully synchronous state can be deduced from those of the adjacency matrix A of the network. Moreover, the spatiotemporal isotropy groups of bifurcating states are preserved by this correspondence. Each eigenvalue of A generically gives rise to two eigenvalues of J (the dimension of the state space is twice the number of nodes). We therefore begin the analysis by finding the eigenvalues and eigenvectors of the adjacency matrix. The symmetry of the network greatly simplifies the calculations.
The adjacency matrix for the network of Figure 10 is:
consisting of three distinct blocks. The eigenvalues of A are given by Table 1. Here
Since A is symmetric, its eigenvalues are all real, so all . It can be checked directly that these four quadratics are positive definite.
These formulas can be derived by hand using the general form of eigenvectors in Table 2, obtained by symmetry arguments. The calculation then reduces to matrices on . The eigenvectors can also be found this way, but will not be listed here. The results were also checked using Mathematica. The main reason simple formulas occur for a matrix is, of course, symmetry.
Generically the eigenvalues of A are distinct, so it is semisimple (diagonalizable) over . In Section 6.2 we show, by considering the corresponding eigenvectors, that these eight eigenvalues are listed in the same order as the corresponding patterns in Figure 11.
6.2. Spatiotemporal Symmetries of Critical Eigenspaces
Next we derive the symmetries of the corresponding eigenvectors. The symmetry group has eight irreducible representations over , all absolutely irreducible. All eight occur as components of the action on the network state space. Because the nodes of the network are 2-dimensional (, with the same group action on both variables, the -axial condition of Golubitsky et al. [72] can be realized. As remarked in Section 3.1, spatiotemporal symmetries for -axial subgroups can be read off from the entries of the critical eigenvectors. All eight spatiotemporal isotropy subgroups for primary Hopf bifurcation can occur.
Write the symmetry group as where:
- Reflects the diagram left-right.
- Reflects the diagram top-bottom.
- interchanges F and B in each pair of nodes with the same number.
Then each of has order 2 and they are independent generators of .
It is straightforward to prove that has one subgroup of order 8 (namely itself) and seven subgroups of order 4. (For instance, consider as a 3-dimensional vector space over .) Table 2 lists these groups in the ‘spatial K’ column, and relates them to the eight possible ways to assign + or − signs to the three generators. These signs correspond respectively to the trivial and the nontrivial representation of the group with that generator. Angle brackets denote the subgroup generated by their contents. These signs determine the spatial symmetry—the subgroup K that fixes every point on the periodic orbit. From this we can read off the sign pattern of the corresponding critical eigenvector. Changes of sign in entries of the critical eigenvector in pairs or correspond to relative phase shifts of . The phase shift between u and v depends on the parameters, and we have not calculated it analytically.
In the right-hand column of the table, the state variables are listed in the order 1F, 1B, 2F, 2B, …, 8F, 8B. The order is the same as in Figure 11, which gives schematic illustrations of these eight Hopf bifurcation patterns. The values are not arbitrary; they depend on the connection strengths. Mathematica provides specific formulas, but these are too complicated to list and are not needed here. These formulas agree with Table 2 and determine which eigenvalue corresponds to which type of eigenvector. For convenience, all such data are listed in the same order.
6.3. Special Model
In its general form, the network of Figure 10 (right) does not support a fully synchronous state in which all 16 nodes are synchronous. However, we need such a state to apply the results of Stewart [50,51].
There is a natural partial fusion state, given by symmetry. The group has two orbits, each of size 8:
The corresponding fixed-point space is dynamically invariant; it consists of elements of of the form
where u corresponds to the first orbit and v to the second. However, since typically this state is not fully fused.
In general, networks there is no way round this obstacle. However, the linear structure of the argument of the gain function in rate models opens up a new possibility. We can specialize the connection strengths so that
Then both self-loops have the same strength , and the fully synchronous subspace with all node states identical is invariant under the dynamics.
More strongly, and in some ways more naturally, we can impose the conditions
Numerical experiments show that although these four parameters are independent, their effect on state number 6 (the ‘Necker cube’ state we seek) is not changed in any significant qualitative way provided the excitatory connections are positive and the inhibitory ones are negative. In short, (9) is ‘mostly harmless’, Adams [84]. To illustrate this claim, Figure 14 produces almost exactly the same time series as Figure 13 (left), but with connection strengths that obey (9).
7. Analysis of the Special Model
Our aim is to show that some natural rate models for Figure 10 (right) have a first bifurcation from a fully synchronous state that is a Hopf bifurcation of type 5, which matches the observed oscillation between cubes in one or other of two possible orientations. For this purpose, it seems permissible to impose condition (9), since we are not trying to analyze all possible states of the rate model.
Stewart [50] discusses a rate model for a 4-node model of a biped central pattern generator. However, the same paper establishes several general properties of homogeneous rate models—those for which each node receives arrows with the same list of connection strengths. In Stewart [51] some further remarks are spelled out in the context of an 8-node model of a quadruped central pattern generator. The results we need apply without any significant changes to a more general class of rate models:
Definition 1.
A rate model network is gain-homogeneous if the sum of the connections strengths is the same for all nodes.
Equivalently, the connection matrix A has constant row-sums.
Theorem 4.1 of Stewart [50] analyses fully synchronous states of a homogeneous rate network such that the connection matrix A has constant row-sums r. Homogeneity is used to prove that the space of fully synchronous states is dynamically invariant. However, the same is true of a gain-homogeneous network, so the homogeneity condition can be relaxed. Thus, Theorem 4.1 applies to the special model. It shows that the fully synchronous equilibria form a cusp catastrophe surface with parameters I and .
Section 8 of Stewart [50] proves that at any fully synchronous equilibrium u, the Jacobian takes the block form
where
This theorem is valid for any connection matrix.
The next step is to relate the eigenvalues of to those of A. This is the content of Theorem 8.1 of Stewart [50], which states:
Theorem 2.
Let v be an eigenvector of A with eigenvalue μ. Then
is an eigenvector of with eigenvalue λ if and only if
Moreover, every eigenvector is of this form.
Proof.
This suggests taking v to be an eigenvector of A, say . We then get
Therefore, if
we obtain an eigenvector of . Solving,
which we can rewrite as
□
Using (12) we obtain:
Corollary 1.
In the special model, with symmetry group Ω, let v be an eigenvector of A with eigenvalue μ. Let be a corresponding eigenvector of . Suppose that w crosses the imaginary axis to create a Hopf bifurcation. Then the spatiotemporal symmetry group of w is the same as the twisted group for v.
Because (12) gives two copies of the group action, the waveforms on the bifurcating branch are not identical on the two -orbits, even though the bifurcations occur from the fully synchronous state. The reason is that synchrony is broken, so cancellations in the argument of no longer need occur. However, up to phase shifts there is one waveform for each -orbit on the nodes. As confirmation, exactly this behavior is seen in numerical simulations.
Next, we recall necessary and sufficient conditions for Hopf bifurcation to occur in a rate model, stated in Theorem 7.1 and proved in Section 12 of Stewart [50]. Equation (7.1) of that paper defines two positive constants:
We assume that , which by Stewart [50] Lemma 12.3 is equivalent to the condition
This is a reasonable condition to impose since the fast-slow dynamic assumes . In our simulations, and .
Theorem 7.1 of Stewart [50] shows that Hopf bifurcation to a periodic state whose spatiotemporal pattern corresponds to an eigenvalue occurs if and only if
The proof requires the existence of a fully synchronous equilibrium. Conditions (19) and (20) hold in all simulations included in this paper.
Finally, we come to the key result:
Theorem 3.
Suppose that all eigenvalues of the connection matrix A are real, and consider the corresponding rate model. For given connection strengths, let μ be the largest eigenvalue of A. Suppose that . Then as I increases, there is a Hopf bifurcation from a fully synchronous equilibrium to a periodic state with spatiotemporal symmetry corresponding to μ. Moreover, this is the first bifurcation from a fully synchronous equilibrium.
Proof.
This is essentially Theorem 6 of Stewart [51], which is stated there for homogeneous networks. However, its proof in that paper, which is a direct deduction from the results of Stewart [50] Section 12, carries over without any essential change to the gain-homogeneous case. The proof applies only to the real eigenvalues of A, but in the 16-node model all eigenvalues of A are real, so the existing proof applies to all eigenvalues of the 16-node model. □
The theorem does not state that this bifurcating branch is asymptotically stable, and we do not have a proof of this, but in simulations it generally seems to be asymptotically stable. Simulations in which I is increased from a value that creates a stable synchronous equilibrium state confirm that the time-periodic states in our Figures occur as synchrony-breaking bifurcations from the fully synchronous state (and are the first bifurcation as predicted by the above theorem).
Conditions for First Bifurcation
We now apply Theorem 3 to the special model, where it leads to simple explicit conditions for which Hopf bifurcation occurs first, and could therefore be stable.
Recall that the special model is obtained from the general model by imposing further conditions on connection strengths, which we now write as:
The first four pairs of eigenvalues become equal. This eigenvalue of multiplicity 8 is a direct consequence of assumption (9). Bifurcations associated with eigenvalues of high multiplicity can be very complicated, but these eigenvalues are not an issue here because we will prove that they do not occur as first bifurcations when . (Symmetry would simplify the possibilities anyway, because it splits the eigenspaces into distinct representations. Relaxing the conditions to (9) splits the eigenvalues.) We now prove that when , and for generic , whenever Hopf bifurcation occurs, the first such bifurcation is always to one of the patterns 5–8.
Since all eigenvalues of A are real for the special model (indeed, for the general one), Theorem 3 implies the following.
Theorem 4.
Consider the special model with . For given , the largest eigenvalue μ of A is:
If further the choice of connection strengths implies that , then as I increases, there is a Hopf bifurcation from a fully synchronous equilibrium to a periodic state with spatiotemporal symmetry corresponding to μ. Moreover, this is the first bifurcation from a fully synchronous equilibrium.
Proof.
This can be proved by straightforward comparisons of the eight eigenvalues. Since we can rule out for . In any ± pair, the plus sign gives the maximal value. Clearly is largest when . The corresponding statements for are also obvious; alternatively they may be deduced from by applying the parameter symmetries in the expressions for . □
In particular, when the first bifurcation is to pattern 6 if and only if . So and , the signs associated with excitatory and inhibitory connections. As explained in Section 5.1, pattern 6 is the one that matches the observed percepts for the Necker cube.
In summary: the local geometric consistency conditions embodied in the special model, with the natural excitatory/inhibitory signs on connection strengths, leads to alternation between two global percepts: cubes with different orientations. (There is one minor caveat, the occurrence of short-lived transitional states, which we discuss in Section 8.) Numerical experiments give the same results for the general model.
8. Transitional States Are Impossible Figures
There is one slight but significant difference between this model and the simple two-node network for the Necker cube or the 4-node network of Figure 4. Specifically, the switches between the smaller-amplitude nodes occur at slightly different times from those between the larger-amplitude nodes. This can be seen in the enlarged image in Figure 12 (right), where the switch between synchronous pairs and occurs slightly before the switch between and . This is similar to the phase lag observed in the rabbit/duck illusion.
The transitional states arise from the phase lag are analogous to ‘impossible figures’ such as the Penrose triangle, (Penrose and Penrose [7]), Figure 15 (left). Thus, in Figure 10 (left), consider the parallelogram formed by edges 1 and 2 and the vertical edges that join them. In one of the two transitional percepts, edge 1 points in front of the page but edge 2 points behind (reading left/right, with left-hand vertical edge in the page). In the other transitional percept these directions are reversed. Therefore, the right-hand end of edge 1 is in front of the page, but that of edge 2 is behind. However, these points are joined by a vertical line, which we are assuming is perceived as a true vertical—parallel to the page. Figure 15 (right) shows this rectangle, drawn in a similar manner to the Penrose triangle. The effect is repeated symmetrically (reflect top/bottom and left/right) across the whole percept.
The symmetries of the figure, under the assumed geometric constraints, require edges 2 and 7 to intersect where they appear to cross, and similarly for edges 3 and 6. Thus, in illusions, transitional patterns that do not obey geometric consistency can (sometimes) be impossible figures. Figure 15 (right) is well known in the literature on impossible figures, often as part of a more complex figure. It is discussed in Khoh and Kovesi [85] from the viewpoint of computer graphics.
9. Tristable Necker-Like Figure
Our models and methods are not limited to bistable illusions. In this section, we apply geometric consistency to a tristable illusion: a variation on the Necker cube introduced in Poston and Stewart [14], see Figure 16. The condition of geometric consistency naturally resolves a question asked by Wallis and Ringelhan [15]. Their experiments indicate that subjects observe switching among three distinct percepts:
- A small cube (dark grey) in a ‘room’—a corner where three rectangles meet (light grey).
- A small cubical hole (dark grey) removed from a cube (light grey).
- A small cube (dark grey) in front of a large cube (light grey).
Wallis and Ringelhan [15] remark: ‘there is, in theory, a valid fourth interpretation (of an inverted room within a larger room), but for the observers we tested, this interpretation turned out to be too improbable for it to ever win the perceptual tug-of-war.’ Our modelling approach suggests a plausible reason for this improbability below, based on geometric consistency, and derive a natural model in which this fourth percept is excluded.
To formulate a simple model for this illusion, decompose the figure into three faces of a large component, with a smaller section excised, Figure 17a, and three faces of a small component, Figure 17b. (A more complex model analogous to Section 5 could be constructed, but we have not done this. We return to this point at the end of the paper.) We show the three faces of the large component before removal of the cut-out in Figure 17c.
Figure 17b,c are opaque versions of the Necker cube, and are similarly bistable. We call these percepts cube and corner, referring to whether the central junction of three lines appears to be pointing out of the paper (towards the observer) or into the paper (away from the observer). The cube state corresponds to the figure being perceived as a cube; the corner state corresponds to the figure being perceived as a ‘room’—more precisely, as the corner of a room containing the observer.
With this decomposition, there are four possible combinations of percepts: either cube or corner for the large component, and independently either cube or corner for the small component. Figure 18 models these states as an untrained Wilson network with two attribute columns ‘large component’ and ‘small component’. Each has two levels: cube and corner.
This network, as it stands, predicts all four possible states, and it decouples the two components. However, these components are coupled geometrically by the laws of perspective. We add lateral connections (see [21]) between nodes to mimic the implications of perspective. This imposes a form of geometric consistency: lateral connections, possibly ‘hard-wired’ by evolution or trained by development, represent relationships between the components that would occur generically in genuine real-world objects. These relationships constrain the process for detecting such objects.
These lateral connections play much the same role in models of illusion that the two images sent to each separate eye play in the construction of rivalry networks. For rivalry, we can deduce the lateral connections from the learned patterns [19]. For illusions we assume a plausible set of lateral connections, based on geometric consistency.
For Figure 17b, the two percepts correspond to different orientations of the components. To make these alternatives clear we repeat the small component in Figure 19 (Left) with one face colored black. To distinguish the percepts, we ask whether the black face of the small component is perceived as being viewed from above, or from beneath. If from above, the image is perceived as a cube; if from beneath, the image is perceived as a corner. The same goes for the large component, and Figure 19 (Right) shows both components with one face black. To distinguish combinations of percepts for the large and small components, we ask whether the two black faces are being perceived as parallel. If they are, the image is perceived either as a small cube in a corner or as a large cube with a corner cut off. If not, it is perceived as a small cube in front of a large cube.
9.1. Why Is No Fourth Percept Observed?
Wallis and Ringelhan [15] ask why subjects do not perceive a fourth possibility: a small hollow room behind a ‘hole’ in a larger hollow room. A possible reason is that the alignment of the two pieces must be very precise to create the correct image, and that some points that coincide in the image typically would not coincide in a real object. More precisely, the edges of the hole in the large corner project as a hexagon, and so do the edges of a smaller corner. In three-dimensional space, these hexagons are not planar, and typically their edges do not coincide. Thus, this interpretation is ‘structurally unstable’, and would be destroyed if the objects were distorted or moved by a small amount. See Smale [86] and Thom [87] for discussions of structural stability in models.
In contrast, for the three percepts actually observed, points that appear to lie on particular lines in the image, and lines that appear to bound planar regions, behave in just that manner in the corresponding 3D realization. That is, the image is structurally stable.
In fact, there exists a fifth possible interpretation of the image in which a small cube hovers in front of a corner, with its edges failing to meet those of the corner, but coincidentally aligning with them in the projection creating the image. The visual system appears to exclude this interpretation, preferring to assume that the small cube is tucked neatly to fit into the corner. Only then is the alignment structurally stable.
It seems reasonable to suggest that the visual system has evolved to avoid structurally unstable interpretations of projected images, since these do not correspond to sensible real objects. Indeed, this may be one reason impossible objects such as the Penrose triangle are perplexing. With this assumption, Figure 16 has only the three geometrically consistent interpretations that are observed.
9.2. Completing the Network
The untrained Wilson network of Figure 18 does not incorporate the implications of structurally stable three-dimensional geometry. To achieve this, we add lateral connections, which can be excitatory or inhibitory, between certain nodes—for example, as in Figure 20.
This ‘pre-trained’ network is based on the hypothesis that—either by evolution or development or learning form experience, probably all three—the observer’s visual system has been pre-wired to associate possible interpretations with plausible three-dimensional structurally stable geometry. The model therefore builds in the following geometric consistency conditions:
- If the large component is at level cube then the small component can reasonably occur at either level cube or corner, so we insert excitatory connections from node 1 to nodes 3 and 4.
- If the large component is at level corner then by the above discussion the small component can occur in a structurally stable manner only at level cube, so we insert an excitatory connection from node 2 to node 3 and an inhibitory connection from node 2 to node 4.
In the absence of good reasons to the contrary, we have shown these lateral connections as being of four different types (strengths) in the figure. We have also assumed that there are no lateral connections from the ‘small cube’ column to the ‘large cube’ column. This assumption is mathematically convenient because it allows a partially fused state in which nodes 1 and 2 are at the same level. In effect, it assumes that the percept is mainly controlled by the perceived state of the large cube, which occupies most of the area of the image. This assumption may be false and is definitely questionable, but for simplicity, we make it here.
Simulations show that adding further connections back from the ‘small cube’ column to the ‘large cube’ column, preserving the sign of the coupling, does not change the key consequences significantly. We omit details.
Here:
Figure 21 shows two simulations in the oscillatory regime. As usual we assume that the maximum activity variable in each column determines the perceived attribute level. In both simulations, the first column (large component) alternates between red (cube) and blue (corner). In the first case, the second column (small component) remains in the green (cube) state. In the second case, green (cube) and purple (corner) alternate, but corner occurs only for short periods of time, and only when column 1 is in the cube state. The observer never perceives both components simultaneously in the corner state.
This is not entirely surprising, since we set up the connections in the network to exclude that combination. However, it confirms that the network behaves in the intended manner for the constructed rate equations. The choice of signs (excitatory/inhibitory) is crucial.
These transitions occur because the activity variables in nodes 3 and 4 differ at the Hopf bifurcation point. Initially the curves do not overlap, but as the amplitude grows, they cross. The crossing occurs only when node 1 is the node with maximum activity variable. This type of behavior is a structurally stable phenomenon for this network.
Wallis and Ringelhan [15] do not include experimental data for this particular illusion. However, they do state that ‘many subjects failed to report the third possible percept (of a cube in front of a larger cube), and so it was not used in the experiments described here …We have since created a new version that accentuates the third percept by making this interpretation correct in terms of visual perspective. It nonetheless remains possible to see the other two more obvious interpretations: a large cube with one corner cut away, or a misshapen room with a cube sitting in the corner. Please note that there is, in theory, a valid fourth interpretation (of an inverted room within a larger room), but for the observers we tested, this interpretation turned out to be too improbable for it to ever win the perceptual tug-of-war.’
Our model is oversimplified, and the time series shown here are just two samples. However, in the right-hand time series of Figure 21, percepts switch cyclically in the order
where the pairs refer to the states of the large and small components in that order. As remarked, the elusive fourth percept (corner, corner) never occurs. The (cube, cube) state occurs for shorter intervals of time than (corner, cube). This is in qualitative agreement with the observations reported by Wallis and Ringelhan [15]. However, these transitions and their timing depend on the parameters in the model. For instance, in the left-hand time series, the small component is always in the cube state, which is definitely not what is observed. The large component alternates between cube and corner. Thus, parameters more like those in the right-hand figure represent observations more accurately. The greater the overlap between the green and purple lines, the less time is spent in the improbable (cube, cube) state. This state then resembles the rapid transitional states that occur in other models in this paper, such as a right-facing head with a beak instead of ears pointing out of its back in the rabbit/duck illusion.
A more elaborate model might be more likely to resemble the observed responses, because the orientation of the small cube must differ significantly from that of the large cube in the (cube, cube) percept. The nodes of such a model might, for example, correspond to edges where apparent planes meet, and corners where three line segments meet. Intuitively, geometric consistency of the orientations at these intersections would make the difference in orientation of the two cubes less plausible.
10. Further Remarks and Summary
Illusions and rivalry differ in how visual information is presented to the eye(s). Illusions result from ambiguity in a single image; rivalry occurs when conflicting images are sent to the two eyes. Nevertheless, there are strong similarities in mathematical models of these two phenomena; indeed, the same models are often used in both cases, under the general heading of ‘competition’. More speculatively, the underlying neurological processes may also be similar. Until recently, most models employed just two nodes—one for each percept—and analyzed competition between them. As remarked in Section 4, such studies include Wilson [10], Curtu [73], Curtu et al. [74], Kalarickal and Marshall [75], Laing and Chow [76], Lehky [77], Matsuoka [78], Mueller [79], Noest et al. [80], and Seely and Chow [66].
Wilson [10] proposed using more elaborate networks, with several attribute columns and several levels, to model more general decision processes, with rivalry as a special case. Applications to rivalry by Diekman et al. [19,20,21] show that ‘derived’ patterns, not shown to either eye, can result from generic dynamic behavior in Wilson networks that have been trained on a pair of images. This is consistent with the occurrence of such patterns in experimental observations, such as the monkey/text and colored dots experiments of Kovács et al. [53] and the color-misbinding results of Shevell et al. [54].
In this paper, we have investigated the potential of Wilson networks as similar models of static illusions involving ambiguous figures. Models with several levels and several attributes avoid building in the assumption that only two specific percepts can occur. Instead, global percepts emerge, as complexes of associated local ‘choices’, from the collective dynamics of networks that model the perception of local segments/attributes of stimuli. These local choices influence each other via excitatory and inhibitory connections that reinforce learned patterns (rivalry) or pre-learned constraints (geometric consistency in illusions). The outcomes of these local competitions are synthesized dynamically by the network structure into a global percept. Ambiguity arises when the dynamics supports more than one global percept. (We suspect that the same basic process of synthesizing local information may also be relevant to normal perception of unambiguous images; illusions result not from malfunction, but from the existence of non-unique stable dynamic states.)
For example, the 16-node network for the Necker cube implements a local analysis of incidence relations between lines in the image (we ignored four vertical ones to simplify the model but they could be included as well, and the results are likely to be similar). In our models, geometric consistency of these choices is ‘wired in’ using excitatory and inhibitory connections between consistent states of nodes. These connections drive the dynamics into oscillations between two complexes of states, corresponding to cubes in the two observed orientations. These models permit and predict transitional states in which local decisions conflict with overall geometric consistency or learned patterns (a possibility that is automatically excluded by a two-node model). Transitions are ‘impossible objects’, and in the models discussed they persist (for dynamic reasons) over relatively short intervals of time, compared to the dominant, consistent percepts. Similar remarks apply to our models for the rabbit/duck illusion and the tristable illusion of Section 9. Moreover, in the tristable illusion, a generic form of geometric consistency implies that a potential fourth percept is never observed, which is consistent with experiments. Testing the occurrence of these transitional states experimentally would be difficult because, even if they do occur, they do so very transiently. It might perhaps be possible using fMRI if suitable neural correlates can be found.
A long-running debate, mentioned in Section 1, concerns the nature of the competition leading to non-unique percepts. The two main theories are that it is either caused by interocular domination, or by the visual processing system in the cortex. Wilson networks (or similarly distributed models) introduce an intermediate level of processing in which the images are ‘segmented’ into distinct attributes, each capable of occurring at several levels. Diekman et al. [21] remark that their results ‘support the conclusion that ⋯ that global IOG [interocular grouping] ⋯ can be achieved by simultaneous local eye dominance.’ See also [88,89,90].
The models discussed in this paper treat illusions in a similar manner, with a corresponding intermediate level of processing in which the image is segmented into local regions. A clear difference is that for illusions, interocular competition is unlikely to be involved, because the illusion persists when the image is shown to a single eye. All the models in this paper, except the standard 2-node model for the Necker cube, also involve this segmentation process. They show that it is possible in principle for the competition between global percepts to arise somewhere between the eye and the final perception, as an emergent consequence of local competition integrated either via learned images or pre-learned geometric consistency. In a sense, this suggests that ambiguous figures can be viewed, not just mathematically, but perhaps neurologically, as a form of rivalry: not between two images presented to the eye, but between two or more collective dynamic states of the perceptual network, inferred from the input image by ‘prior knowledge’—geometric consistency.
11. Conclusions
This paper is not intended as a proposal that Wilson networks are implemented literally in the visual system. Populations of neurons are more likely to play a role than individual ones, Wilson and Cowan [11], and network ‘components’ could be widely distributed in the brain. The inhibitory and excitatory connections in the model network are more likely to be mediated by other networks in the brain. Mainly, our results should be viewed as ‘proof of concept’, showing that simple networks, embodying simple rules based on and derived from evolution and/or experience of the outside world, are capable of making complex perceptual decisions.
We end by summarizing our main conclusions:
- Wilson networks with natural geometric consistency conditions are capable of modelling the perception of multistable illusions.
- A relatively small number of local geometric consistency conditions can generate the observed global form of the percepts.
- A potentially important type of geometric consistency is a form of structural stability: the percept should not depend on features of the image that can be destroyed by small perturbations.
- Important features of rate models, such as the first Hopf bifurcation from a fully synchronous equilibrium, can be understood analytically, even for quite complicated networks, provided connection strengths are gain-homogeneous and the network has sufficient symmetry.
- In particular, the first bifurcation from a fusion state in the 16-node Necker cube model selects a unique spatiotemporal pattern that matches observations.
- However, in some cases (including the 16-node model) transitional states occur that do not satisfy the geometric consistency conditions used to construct the model. These percepts correspond to impossible figures, but probably occur so briefly that they would be difficult to observe.
Author Contributions
Conceptualization, M.G.; Writing—original draft and revision, I.S. Both authors contributed equally to the work.
Funding
This research was supported in part by the National Science Foundation Grant DMS-1440386 to the Mathematical Biosciences Institute, Columbus, Ohio.
Conflicts of Interest
The authors declare no conflict of interest. The funders had no role in the design of the study; in the collection, analyses, or interpretation of data; in the writing of the manuscript, or in the decision to publish the results.
References
- Blake, R.; Logothetis, N.K. Visual competition. Nat. Rev. Neurosci. 2002, 3, 1–11. [Google Scholar] [CrossRef] [PubMed]
- Breese, B.B. Binocular rivalry. Psychol. Rev. 1909, 16, 410–415. [Google Scholar] [CrossRef]
- Wilson, H. Computational evidence for a rivalry hierarchy in vision. Proc. Nat. Acad. Sci. USA 2003, 100, 14499–14503. [Google Scholar] [CrossRef] [PubMed] [Green Version]
- Wilson, H. Minimal physiological conditions for binocular rivalry and rivalry memory. Vis. Res. 2007, 47, 2741–2750. [Google Scholar] [CrossRef] [PubMed] [Green Version]
- Eagleman, D.M. Visual illusions and neurobiology. Nat. Rev. Neurosci. 2001, 2, 920–926. [Google Scholar] [CrossRef] [PubMed]
- Leopold, D.A.; Logothetis, N.K. Multistable phenomena: changing views in perception. Trends Cog. Sci. 1999, 3, 254–264. [Google Scholar] [CrossRef]
- Penrose, L.S.; Penrose, R. Impossible objects: A special type of optical illusion. Brit. J. Psych. 1958, 49, 31–33. [Google Scholar] [CrossRef]
- Wikipedia. Penrose triangle. Available online: https://en.wikipedia.org/wiki/Penrose̲triangle (accessed on 1 June 2019).
- Sherman, D.A. Optical illusions. Cornell U. 2015. Available online: http://people.cornellcollege.edu/dsherman/illusions/ (accessed on 1 June 2019).
- Wilson, H.R. Requirements for conscious visual processing. In Cortical mechanisms of vision; Jenkin, M., Harris, L., Eds.; Cambridge University Press: Cambridge, UK, 2009; pp. 399–417. [Google Scholar]
- Wilson, H.R.; Cowan, J.D. Excitatory and inhibitory interactions in localized populations of model neurons. Biophys. J. 1972, 12, 1–24. [Google Scholar] [CrossRef]
- Yoon, M.J.; Shen, J.J. First-order modeling and stability analysis of illusory contours. Visual Comm. Image Representation 2008, 19, 42–55. [Google Scholar] [Green Version]
- Naber, M.; Gruenhage, G.; Einhäuser, W. Tri-stable stimuli reveal interactions among subsequent percepts: rivalry is biased by perceptual history. Vision Res. 2010, 50, 818–828. [Google Scholar] [CrossRef]
- Poston, P.; Stewart, I. Nonlinear modelling of multistable perception. Behavioral Science 1978, 23, 318–334. [Google Scholar] [CrossRef] [PubMed]
- Wallis, G.; Ringelhan, S. The dynamics of perceptual rivalry in bistable and tristable perception. Journal of Vision 2013, 24, 1–21. [Google Scholar] [CrossRef] [PubMed]
- Necker, L.A. Observations on some remarkable optical phænomena seen in Switzerland; and on an optical phænomenon which occurs on viewing a figure of a crystal or geometrical solid. London and Edinburgh Philosophical Magazine and Journal of Science 1832, 1, 329–337. [Google Scholar] [CrossRef]
- Jastrow, J. The mind’s eye. Popular Science Monthly 1889, 54, 299–312. [Google Scholar]
- Ermentrout, G.B.; Terman, D.H. Mathematical Foundations of Neuroscience; Springer: New York, NY, USA, 2010. [Google Scholar]
- Diekman, C.; Golubitsky, M. Network symmetry and binocular rivalry experiments. J. Math. Neuro. 2014, 4. [Google Scholar] [CrossRef]
- Diekman, C.; Golubitsky, M.; McMillen, T.; Wang, Y. Reduction and dynamics of a generalized rivalry network with two learned patterns. SIAM J. Appl. Dynam. Sys. 2012, 11, 1270–1309. [Google Scholar] [CrossRef]
- Diekman, C.; Golubitsky, M.; Wang, Y. Derived patterns in binocular rivalry networks. J. Math. Neuro. 2013, 3. [Google Scholar] [CrossRef]
- Gregory, R.L. Putting illusions in their place. Perception 1991, 20, 1–4. [Google Scholar] [CrossRef]
- Gregory, R.L. Visual illusions classified. Trends in Cognitive Sciences 1997, 1, 190–194. [Google Scholar] [CrossRef]
- Changizi, M.A.; Hsieh, A.; Nijhawan, R.; Kanai, R.; Shinsuke, S. Perceiving the present and a systematization of illusions. Cognitive Science 2008, 32, 459–503. [Google Scholar] [CrossRef]
- Bach, M.; Poloschek, C.M. Optical Illusions. Adv. Clin. Neurosci. Rehabil. 2006, 6, 20–21. [Google Scholar]
- Zöllner, F. Ueber eine neue Art von Pseudoskopie und ihre Beziehungen zu den von Plateau und Oppel beschrieben Bewegungsphaenomenen. Annalen der Physik 1860, 186, 500–525. [Google Scholar] [CrossRef]
- Wikipedia. Zöllner illusion. Available online: https://en.wikipedia.org/wiki/Zöllner̲illusion (accessed on 1 June 2019).
- Fraser, J. A new visual illusion of direction. British J. Psych. 1908, 2, 307–320. [Google Scholar] [CrossRef]
- Wikipedia. Fraser spiral illusion. Available online: https://en.wikipedia.org/wiki/Fraser_spiral_illusion (accessed on 1 June 2019).
- Wikipedia. Poggendorff illusion. Available online: https://en.wikipedia.org/wiki/Poggendorff̲illusion (accessed on 1 June 2019).
- Maffei, L.; Fiorentini, A. The unresponsive regions of visual cortical receptive fields. Vis. Res. 1976, 16, 1131–1139. [Google Scholar] [CrossRef]
- Allman, J.; Miezin, F.; McGuinness, E. Stimulus specific responses from beyond the classical receptive field: neurophysiological mechanisms for local-global comparisons in visual neurons. Annu. Rev. Neurosci. 1985, 8, 407–430. [Google Scholar] [CrossRef]
- Howe, C.Q.; Yang, Z.; Purves, D. The Poggendorff illusion explained by natural scene geometry. Proc. Nat. Acad. Sci. USA 2005, 102, 7707–7712. [Google Scholar] [CrossRef] [PubMed] [Green Version]
- Osher, S.; Sethian, J.A. Fronts propagating with curvature-dependent speed: algorithms based on Hamilton-Jacobi formulations. J. Comput. Phys. 1988, 79, 12–49. [Google Scholar] [CrossRef]
- Wikipedia. Spinning Dancer. Available online: https://en.wikipedia.org/wiki/Spinning̲Dancer (accessed on 1 June 2019).
- Bernal, B.; Guillen, M.; Marquez, J. The spinning dancer illusion and spontaneous brain fluctuations: An fMRI study. Neurocase 2014, 20, 627–639. [Google Scholar] [CrossRef]
- Troje, N.F.; McAdam, M. The viewing-from-above bias and the silhouette illusion. i-Perception 2010, 1, 143–148. [Google Scholar] [CrossRef]
- Grossberg, S.; Pinna, B. Neural dynamics of gestalt principles of perceptual organization: from grouping to shape and meaning. Gestalt Theory 2012, 34, 399–482. [Google Scholar]
- Pinna, B.; Gregory, R.L. Shifts of edges and deformations of patterns. Perception 2002, 31, 1503–1508. [Google Scholar] [PubMed]
- Logothetis, N.K.; Schall, J.D. Neuronal correlates of subjective visual perception. Science 1989, 245, 761–763. [Google Scholar] [CrossRef]
- Leopold, D.A.; Logothetis, N.K. Activity changes in early visual cortex reflect monkeys? percepts during binocular rivalry. Nature 1996, 379, 549–553. [Google Scholar] [CrossRef]
- Sheinberg, D.L.; Logothetis, N.K. The role of temporal cortical areas in perceptual organization. Proc. Nat. Acad. Sci. USA 1997, 94, 3408–3413. [Google Scholar] [CrossRef] [PubMed] [Green Version]
- Laing, C.R.; Frewen, T.; Kevrekidis, I.G. Reduced models for binocular rivalry. J. Comput. Neurosci. 2010, 28, 459–476. [Google Scholar] [CrossRef] [PubMed] [Green Version]
- Moreno-Bote, R.; Rinzel, J.; Rubin, N. Noise-induced alternations in an attractor network model of perceptual bistability. J. Neurophysiology 2007, 98, 1125–1139. [Google Scholar] [CrossRef] [PubMed]
- Logothetis, N.K.; Leopold, D.A.; Sheinberg, D.L. What is rivalling during binocular rivalry? Nature 1996, 380, 621–624. [Google Scholar] [CrossRef]
- Dayan, P. A hierarchical model of binocular rivalry. Neural Comput. 1998, 10, 1119–1135. [Google Scholar] [CrossRef]
- Tong, F.; Engel, S.A. Interocular rivalry revealed in the human cortical blind-spot representation. Nature 2001, 411, 195–199. [Google Scholar] [CrossRef]
- Lumer, E.D.; Friston, K.J.; Rees, G. Neural correlates of perceptual rivalry in the human brain. Science 1998, 280, 1930–1934. [Google Scholar] [CrossRef]
- Tong, F.; Nakayama, K.; Vaughan, J.T.; Kanwisher, N. Binocular rivalry and visual awareness in human extrastriate cortex. Neuron 1998, 21, 753–759. [Google Scholar] [CrossRef]
- Stewart, I. Symmetry-breaking in a rate model for a biped locomotion central pattern generator. Symmetry 2014, 6, 23–66. [Google Scholar] [CrossRef]
- Stewart, I. Spontaneous symmetry-breaking in a network model for quadruped locomotion. Internat. J. Bif. Chaos 2017, 27, 1730049. [Google Scholar] [CrossRef]
- Hong, S.W.; Shevell, S.K. Resolution of binocular rivalry: perceptual misbinding of color. Vis. Neurosci. 2006, 23, 561–566. [Google Scholar] [CrossRef] [PubMed]
- Kovács, I.; Papathomas, T.V.; Yang, M.; Fehér, A. When the brain changes its mind: interocular grouping during binocular rivalry. Proc. Natl. Acad. Sci. USA 1996, 93, 15508–15511. [Google Scholar] [CrossRef] [PubMed]
- Shevell, S.K.; St Clair, R.; Hong, S.W. Misbinding of color to form in afterimages. Vis. Neurosci. 2008, 25, 355–360. [Google Scholar] [CrossRef]
- Wiesel, T.N.; Hubel, D.H. Single-cell responses in striate cortex of kittens deprived of vision in one eye. J. Neurophysiol. 1963, 26, 1003–1017. [Google Scholar] [CrossRef] [PubMed]
- Hirsch, H.V.B.; Spinelli, D.N. Visual experience modifies distribution of horizontally and vertically oriented receptive fields in cats. Science 1970, 168, 869–871. [Google Scholar] [CrossRef]
- Iacaruso, M.F.; Gasler, I.T.; Hofer, S.B. Synaptic organisation of visual space in primary visual cortex. Nature 2017, 547, 449–452. [Google Scholar] [CrossRef]
- Bressloff, P.C.; Cowan, J.D.; Golubitsky, M.; Thomas, P.J.; Wiener, M.C. Geometric visual hallucinations, Euclidean symmetry, and the functional architecture of striate cortex. Phil. Trans. R. Soc. London B 2001, 356, 299–330. [Google Scholar] [CrossRef]
- Golubitsky, M.; Shiau, L.-J.; Török, A. Bifurcation on the visual cortex with weakly anisotropic lateral coupling. SIAM J. Appl. Dyn. Syst. 2003, 2, 97–143. [Google Scholar] [CrossRef]
- Blasdel, G.G. Orientation selectivity, preference, and continuity in monkey striate cortex. J. Neurosci. 1992, 12, 3139–3161. [Google Scholar] [CrossRef] [PubMed]
- Golubitsky, M.; Stewart, I. Nonlinear dynamics of networks: the groupoid formalism. Bull. Amer. Math. Soc. 2006, 43, 305–364. [Google Scholar] [CrossRef]
- Golubitsky, M.; Stewart, I.; Török, A. Patterns of synchrony in coupled cell networks with multiple arrows. SIAM J. Appl. Dynam. Sys. 2005, 4, 78–100. [Google Scholar] [CrossRef]
- Stewart, I.; Golubitsky, M.; Pivato, M. Symmetry groupoids and patterns of synchrony in coupled cell networks. SIAM J. Appl. Dynam. Sys. 2003, 2, 609–646. [Google Scholar] [CrossRef]
- Ta’eed, L.K.; Ta’eed, O.; Wright, J.E. Determinants involved in the perception of the Necker cube: An application of catastrophe theory. Behavioral Sci. 1998, 33, 97–115. [Google Scholar]
- Peregoy, P.; Stewart, I. Catastrophe theory modelling in psychology. Psych. Bull. 1983, 94, 336–362. [Google Scholar]
- Seely, J.; Chow, C.C. The role of mutual inhibition in binocular rivalry. J. Neurophysiol. 2011, 106, 2136–2150. [Google Scholar] [CrossRef]
- Liu, L.; Tyler, C.W.; Schor, C.M. Failure of rivalry at low contrast: evidence of a suprathreshold binocular summation process. Vis. Res. 1992, 32, 1471–1479. [Google Scholar] [CrossRef]
- Shpiro, A.; Curtu, R.; Rinzel, J.; Rubin, N. Dynamical characteristics common to neuronal competition models. J. Neurophysiol. 2007, 97, 462–473. [Google Scholar] [CrossRef]
- Guckenheimer, J.; Holmes, P. Nonlinear Oscillations, Dynamical Systems, and Bifurcations of Vector Fields; Springer: New York, NY, USA, 1983. [Google Scholar]
- Hassard, B.D.; Kazarinoff, N.D.; Wan, Y.-H. Theory and Applications of Hopf Bifurcation; London Mathematical Society Lecture Note series; Cambridge University Press: Cambridge, UK, 1981; Volume 41. [Google Scholar]
- Golubitsky., M.; Stewart, I. The Symmetry Perspective; Progress in Mathematics; Birkhäuser: Basel, Switzerland, 2002; Volume 200. [Google Scholar]
- Golubitsky., M.; Stewart, I.; Schaeffer, D.G. Singularities and Groups in Bifurcation Theory II; Applied Mathematics Series; Springer: New York, NY, USA, 1988; p. 69. [Google Scholar]
- Curtu, R. Singular Hopf bifurcations and mixed-mode oscillations in a two-cell inhibitory neural network. Phys. D 2010, 239, 504–514. [Google Scholar] [CrossRef]
- Curtu, R.; Shpiro, A.; Rubin, N.; Rinzel, J. Mechanisms for frequency control in neuronal competition models. SIAM J. Appl. Dyn. Syst. 2008, 7, 609–649. [Google Scholar] [CrossRef]
- Kalarickal, G.J.; Marshall, J.A. Neural model of temporal and stochastic properties of binocular rivalry. Neurocomputing 2000, 32, 843–853. [Google Scholar] [CrossRef]
- Laing, C.; Chow, C. A spiking neuron model for binocular rivalry. J. Comput. Neurosci. 2002, 12, 39–53. [Google Scholar] [CrossRef]
- Lehky., S.R. An astable multivibrator model of binocular rivalry. Perception 1988, 17, 215–228. [Google Scholar] [CrossRef] [PubMed]
- Matsuoka, K. The dynamic model of binocular rivalry. Biol. Cybern. 1984, 49, 201–208. [Google Scholar] [CrossRef]
- Mueller, T.J. A physiological model of binocular rivalry. Vis. Neurosci. 1990, 4, 63–73. [Google Scholar] [CrossRef] [PubMed]
- Noest, A.J.; van Ee, R.; Nijs, M.M.; van Wezel, R.J.A. Percept-choice sequences driven by interrupted ambiguous stimuli: a low-level neural model. J. Vis. 2007, 7(8), 10. [Google Scholar] [CrossRef]
- Shpiro, A.; Moreno-Bote, R.; Rubin, N.; Rinzel, J. Balance between noise and adaptation in competition models of perceptual bistability. J. Comput. Neurosci. 2009, 27, 37–54. [Google Scholar] [CrossRef] [Green Version]
- Lappin, J.S.; Craft, W.D. Foundations of spatial vision: from retinal images to perceived shapes. Psychol. Rev. 2000, 107, 6–38. [Google Scholar] [CrossRef]
- Quinn, P.C. Visual perception of orientation is categorical near vertical and continuous near horizontal. Perception 2004, 33, 897–906. [Google Scholar] [CrossRef] [PubMed]
- Adams, D. The Hitch Hiker’s Guide to the Galaxy; Pan: London, UK, 1979. [Google Scholar]
- Khoh, C.W.; Kovesi, P. Animating impossible objects. Computer Science & Software Engineering, U of Western Australia 1999. Available online: http://www.csse.uwa.edu.au/~pk/Impossible/impossible.html (accessed on 1 June 2019).
- Smale, S. Differentiable dynamical systems. Bull. Amer. Math. Soc. 1967, 73, 747–817. [Google Scholar] [CrossRef] [Green Version]
- Thom, R. Structural Stability and Morphogenesis; Benjamin: Reading MA, USA, 1975. [Google Scholar]
- Blake, R.; Yu, K.; Lokey, M.; Norman, H. What is suppressed during binocular rivalry? Perception 1980, 9, 223–231. [Google Scholar] [CrossRef] [PubMed]
- Lee, S.; Blake, R. A fresh look at interocular grouping during binocular rivalry. Vis. Res. 2004, 44, 983–991. [Google Scholar] [CrossRef] [Green Version]
- Papathomas, T.V.; Kovács, I.; Conway, T. Interocular grouping in binocular rivalry: Basic attributes and combinations. In Binocular Rivalry; Alais, D., Blake, R., Eds.; MIT Press: Cambridge, MA, USA, 2005; pp. 155–168. [Google Scholar]
Figure 1.
Two classic multistable illusions. (Left) Necker cube; (Right) Rabbit/duck.
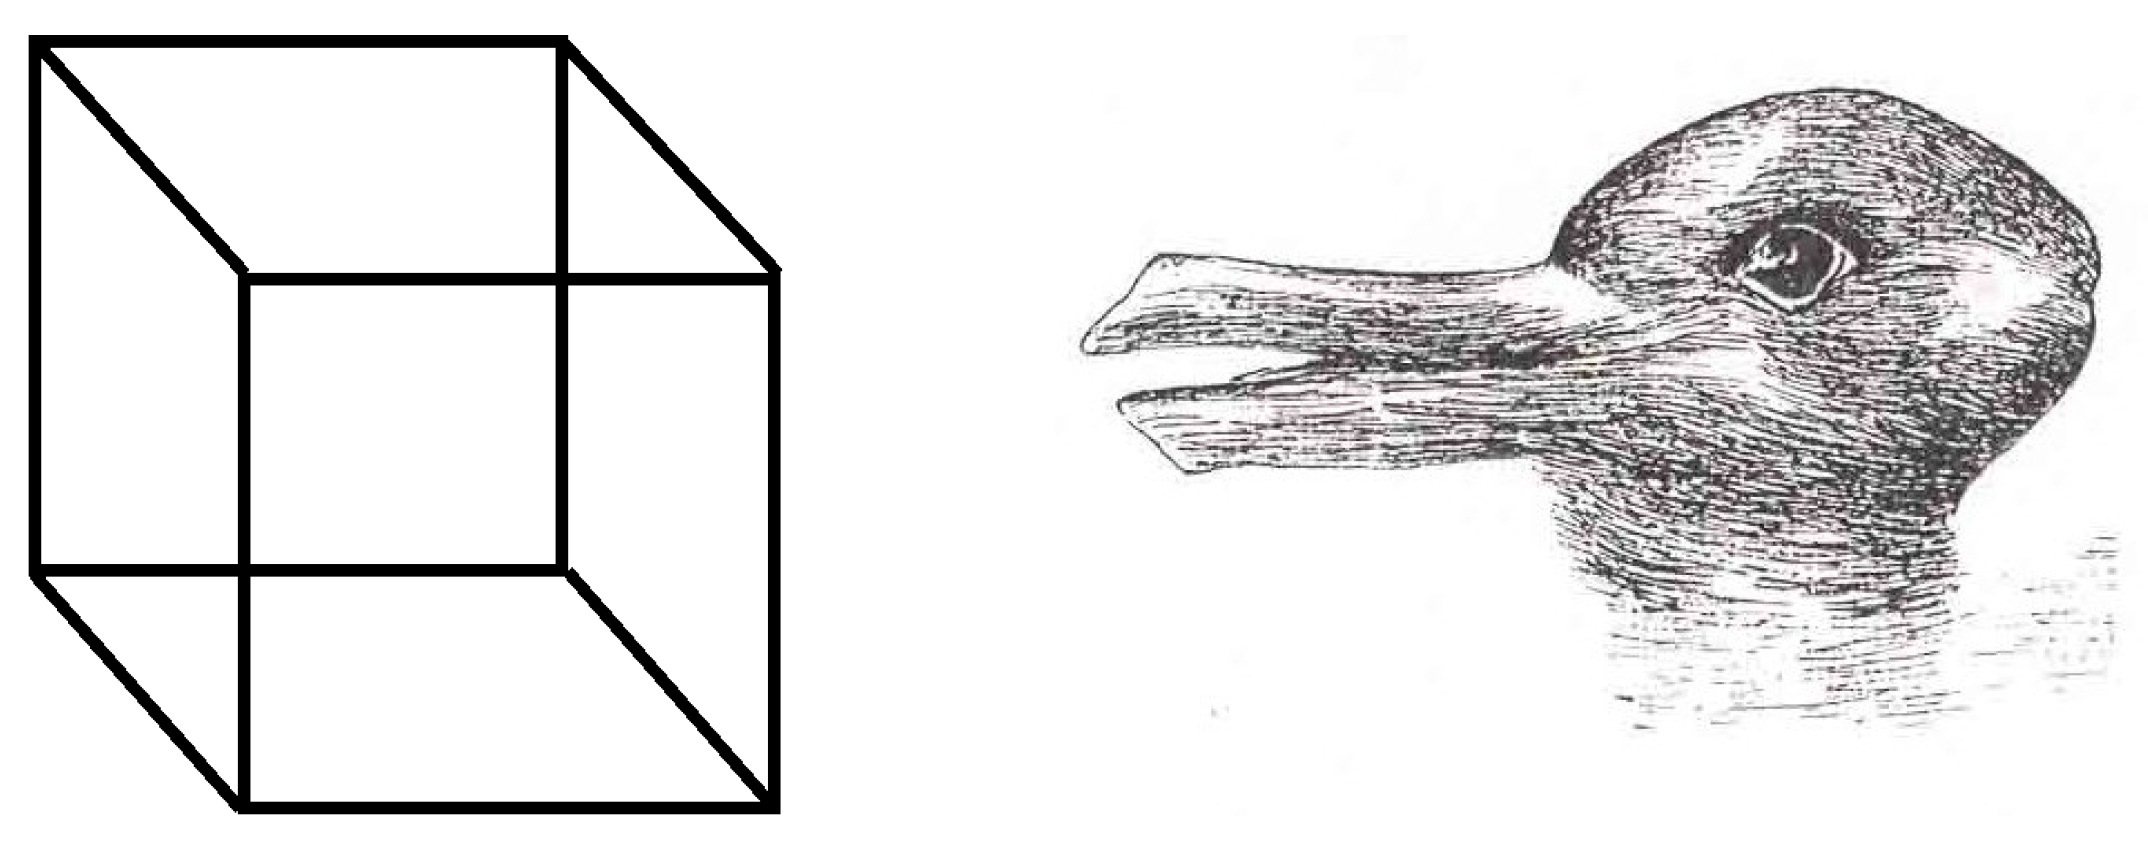
Figure 2.
(Left) Architecture of an untrained Wilson network. (Right) Network trained on a single pattern by adding excitatory connections between the levels representing that pattern. Dashed lines are inhibitory, solid lines excitatory.
Figure 2.
(Left) Architecture of an untrained Wilson network. (Right) Network trained on a single pattern by adding excitatory connections between the levels representing that pattern. Dashed lines are inhibitory, solid lines excitatory.

Figure 3.
Attributes for Necker cube. At each intersection, does the horizontal line pass over or under the vertical one?
Figure 3.
Attributes for Necker cube. At each intersection, does the horizontal line pass over or under the vertical one?
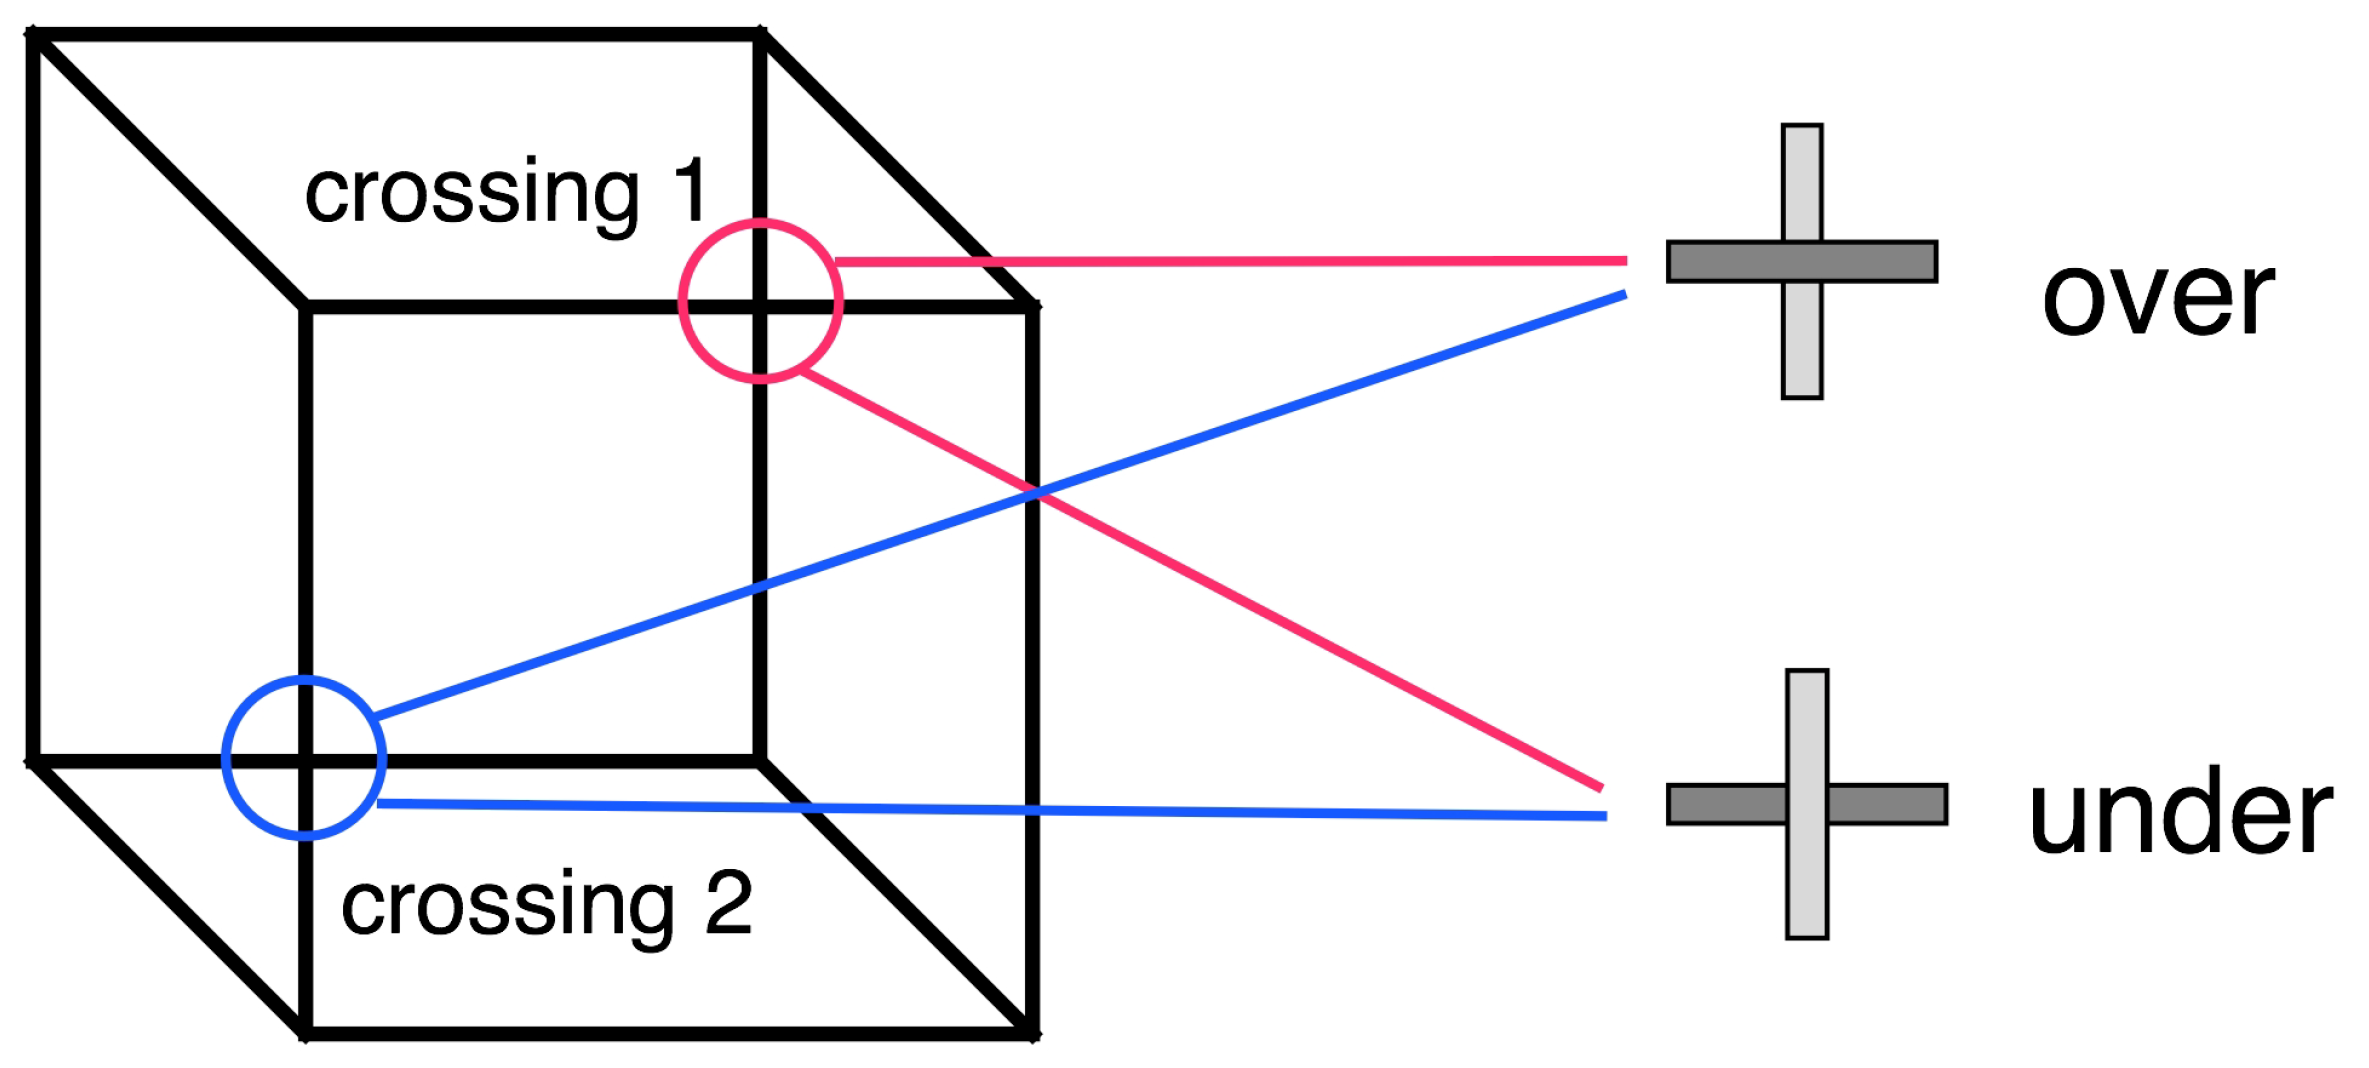
Figure 4.
Network for 4-node Necker cube model. At each intersection, does the horizontal line pass over or under the vertical one? Lines ending in bars indicate inhibitory connections, arrows excitatory ones.
Figure 4.
Network for 4-node Necker cube model. At each intersection, does the horizontal line pass over or under the vertical one? Lines ending in bars indicate inhibitory connections, arrows excitatory ones.

Figure 5.
Time series for rate equations for 4-node model of Necker cube. (Left) Nodes 1 (red) and 2 (blue). (Right) Nodes 3 (green) and 4 (magenta). Here . Time series for nodes 1 and 4 coincide, as do those for 2 and 3.
Figure 5.
Time series for rate equations for 4-node model of Necker cube. (Left) Nodes 1 (red) and 2 (blue). (Right) Nodes 3 (green) and 4 (magenta). Here . Time series for nodes 1 and 4 coincide, as do those for 2 and 3.
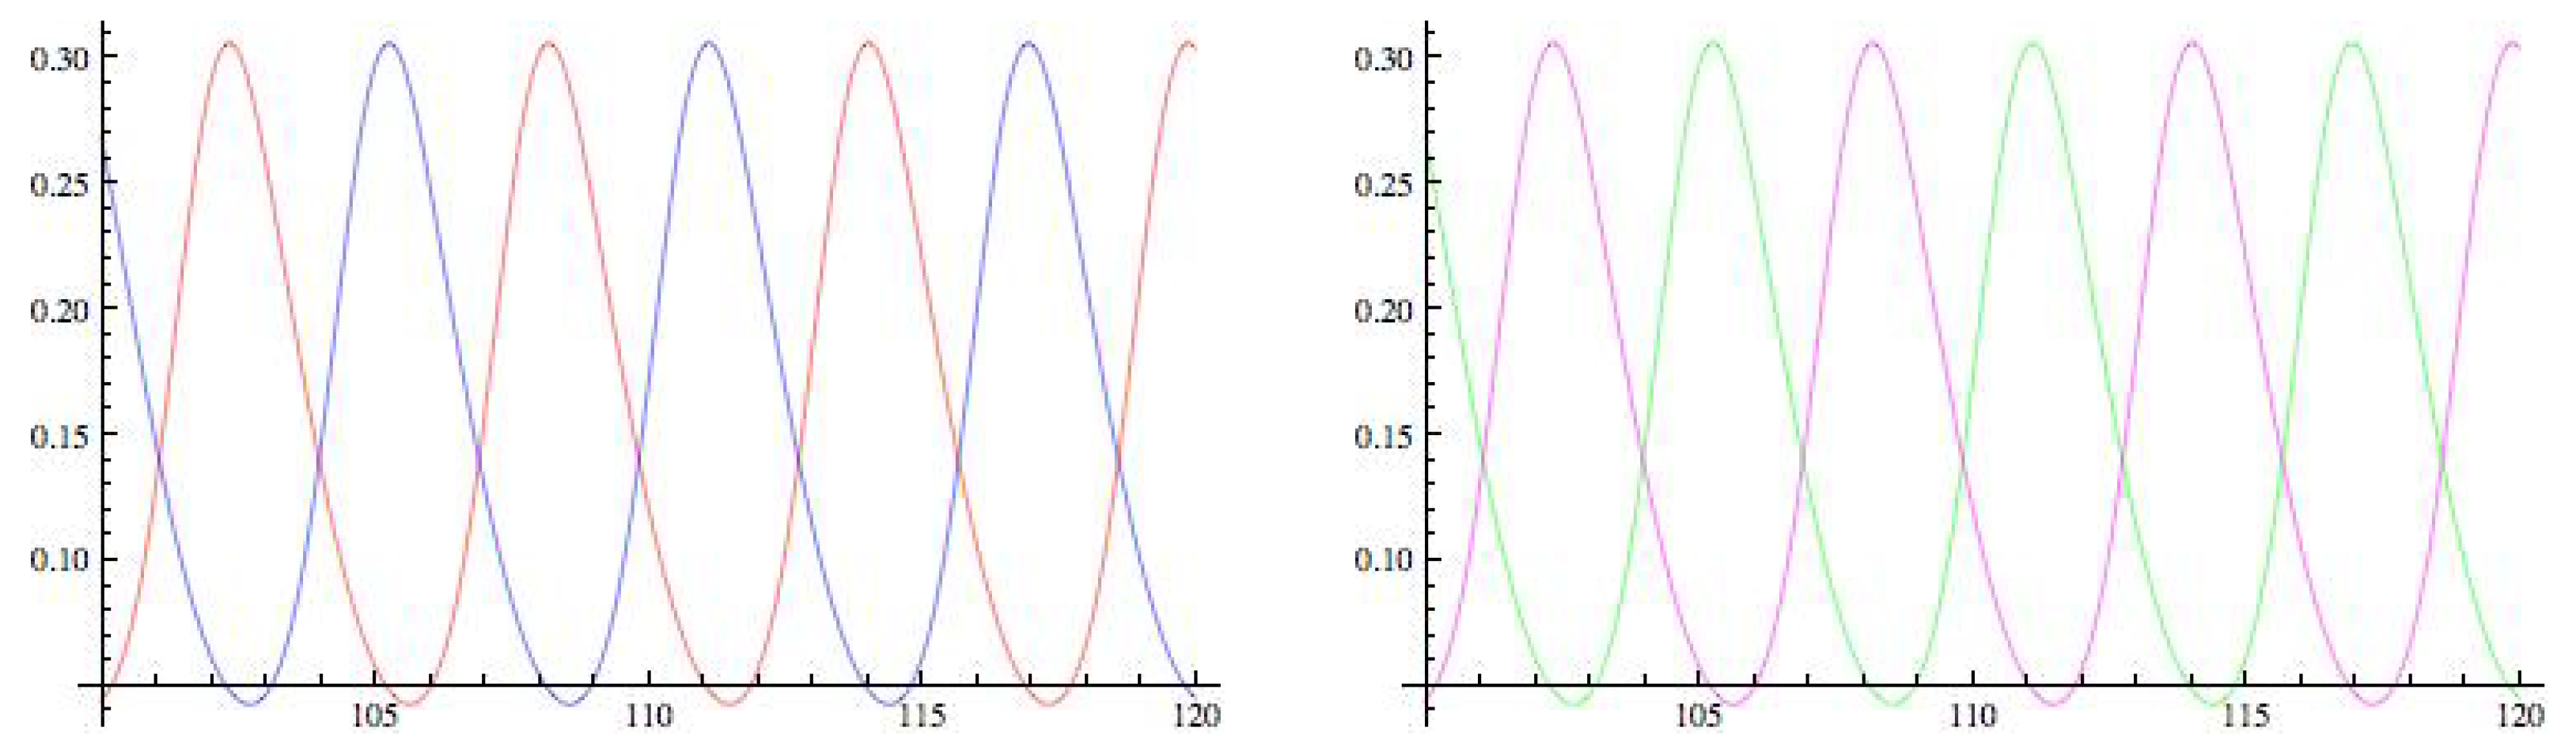
Figure 6.
Network for the rabbit/duck illusion. (Left) One-way connections for geometric constraints. (Right) Two-way connections. Lines ending in bars indicate inhibitory connections, arrows excitatory ones.
Figure 6.
Network for the rabbit/duck illusion. (Left) One-way connections for geometric constraints. (Right) Two-way connections. Lines ending in bars indicate inhibitory connections, arrows excitatory ones.

Figure 7.
Plot of (blue, initially positive), (blue, initially negative), (red, initially positive), (red, initially negative).
Figure 7.
Plot of (blue, initially positive), (blue, initially negative), (red, initially positive), (red, initially negative).
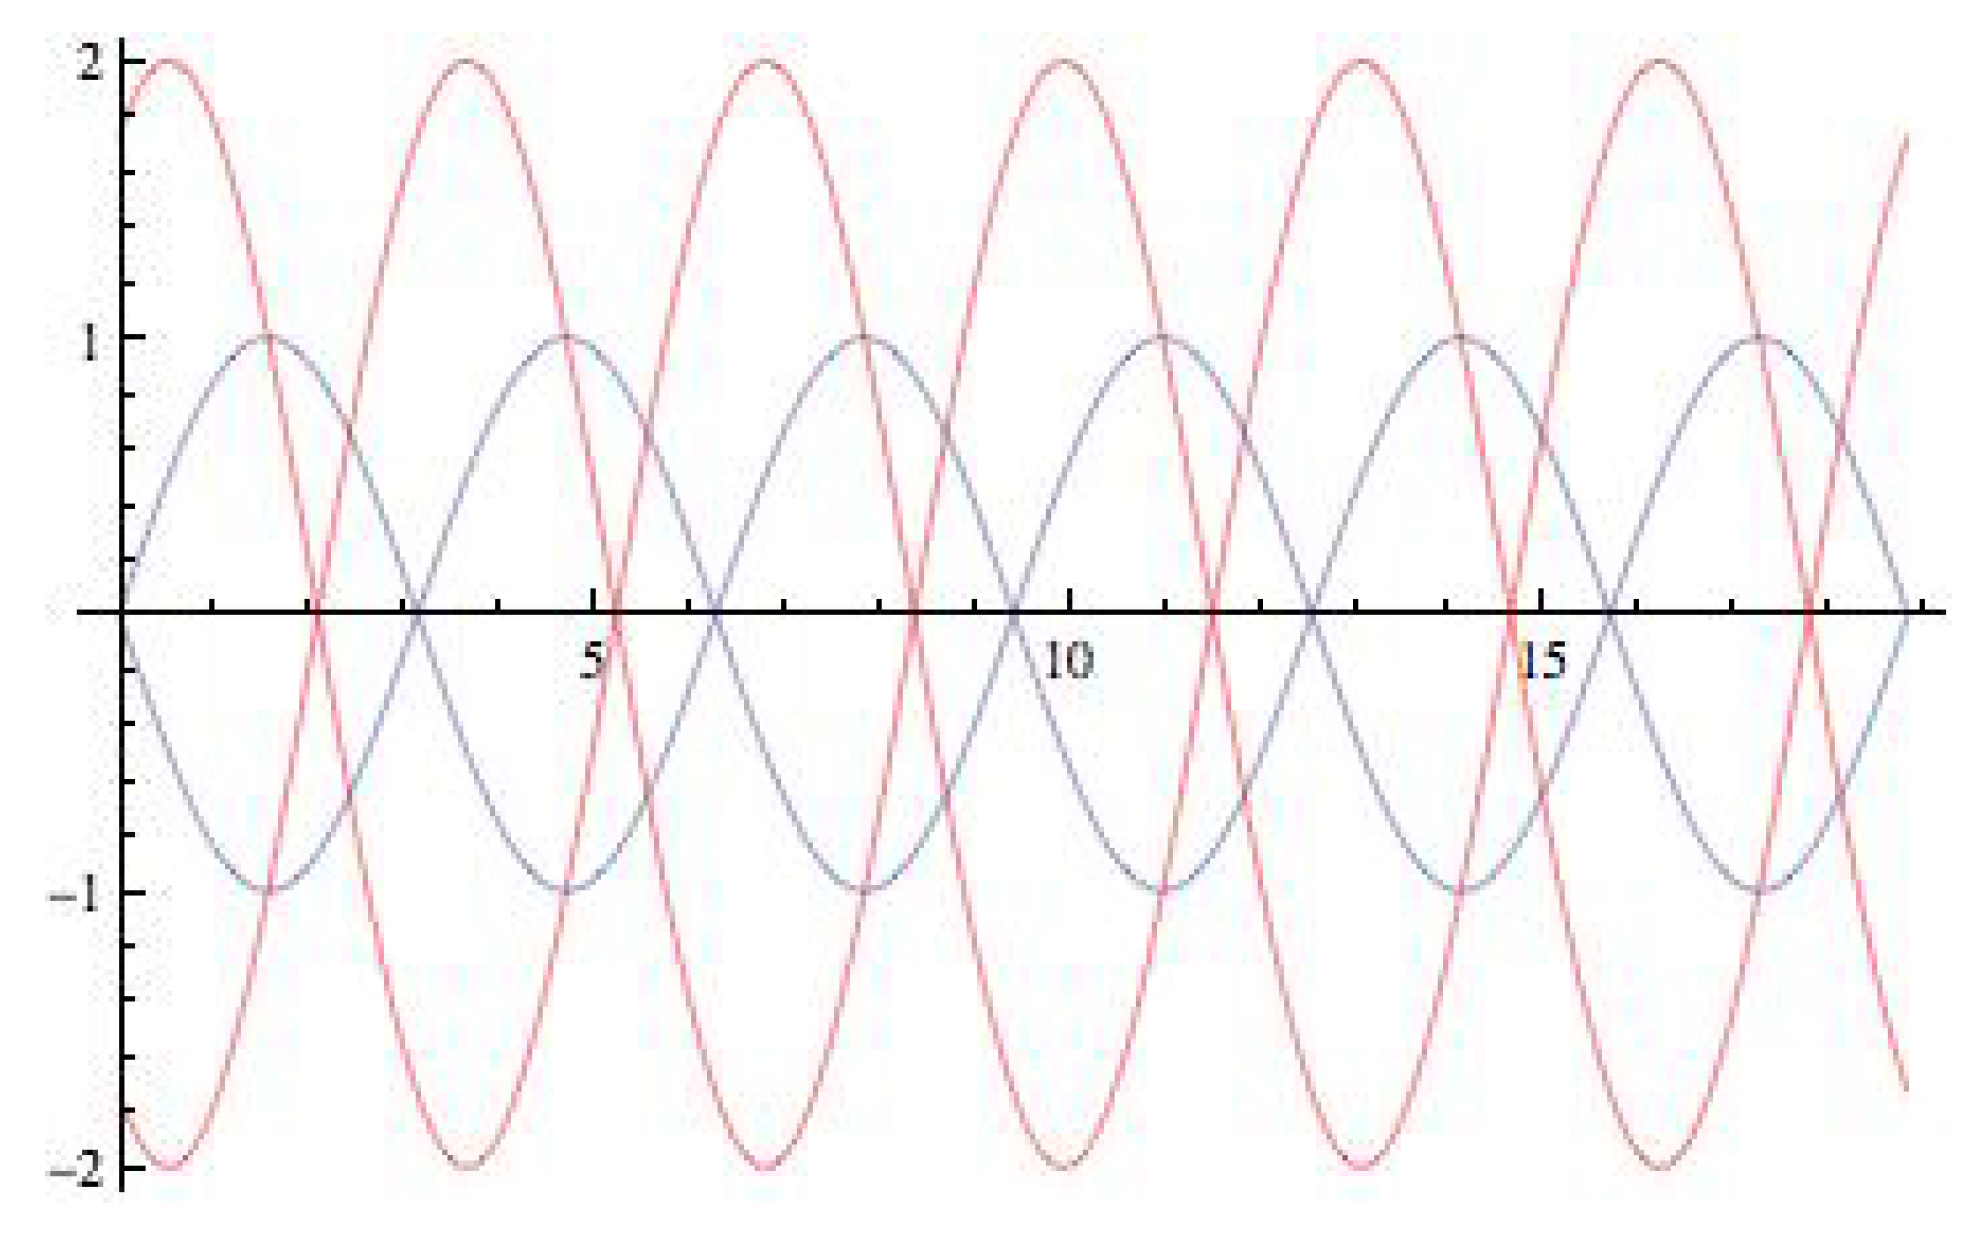
Figure 8.
Simulation of Figure 6 (left). Here . Colors are: node 1 red, node 2 blue, node 3 green, node 4 magenta.
Figure 8.
Simulation of Figure 6 (left). Here . Colors are: node 1 red, node 2 blue, node 3 green, node 4 magenta.
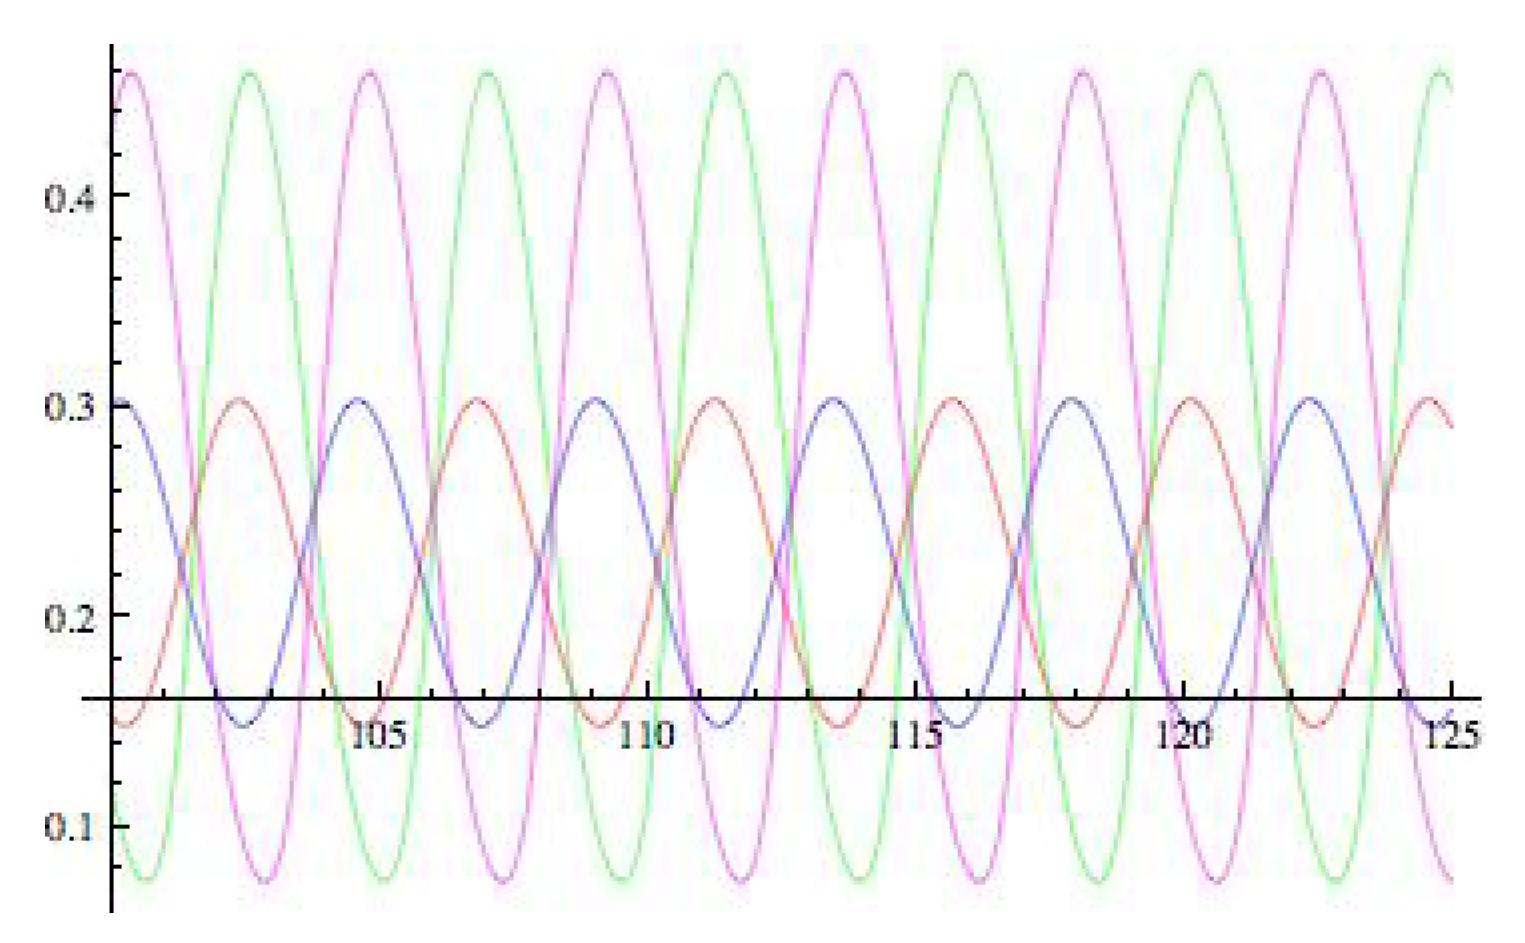
Figure 9.
Dynamics in the 4-node network. Colors are: node 1 red, node 2 blue, node 3 green, node 4 magenta. (Left) Parameter values are , . (Right) Same parameters except that .
Figure 9.
Dynamics in the 4-node network. Colors are: node 1 red, node 2 blue, node 3 green, node 4 magenta. (Left) Parameter values are , . (Right) Same parameters except that .
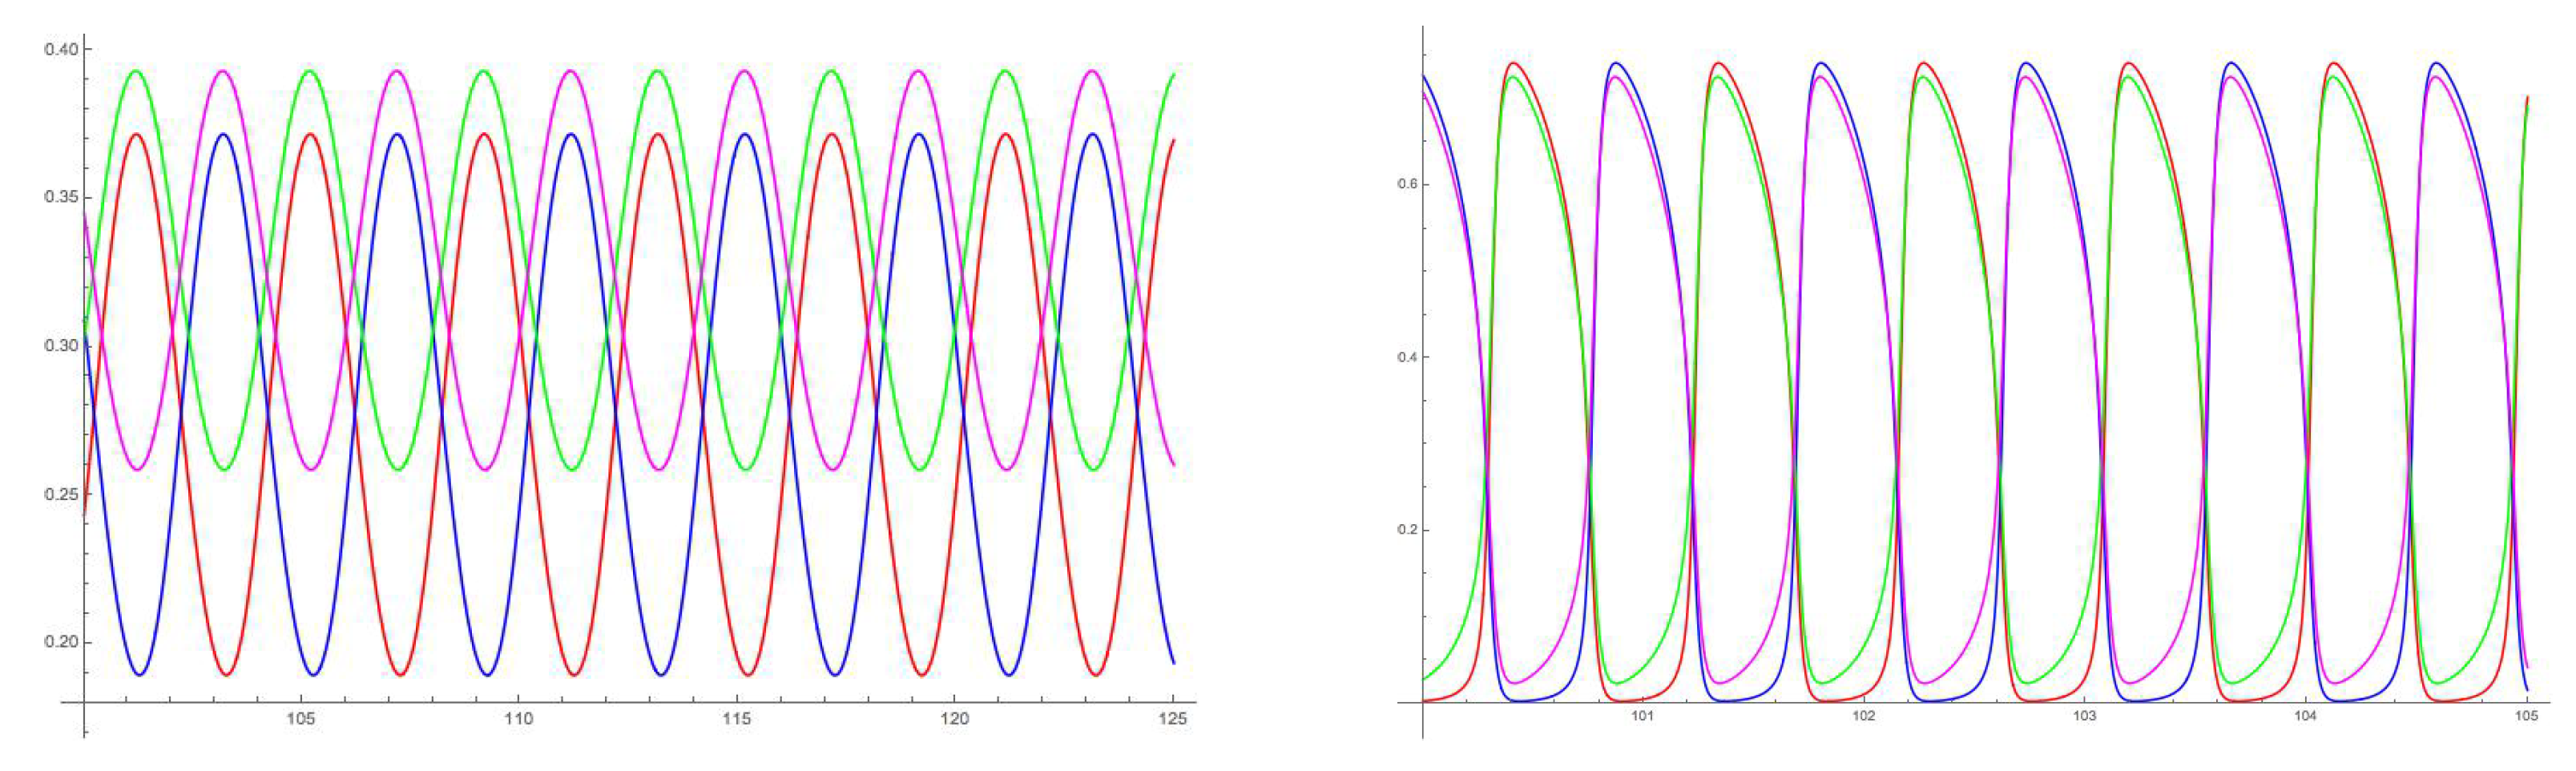
Figure 10.
(Left) Eight numbered edges of the Necker cube. (Right) Network modelling the orientations of the eight numbered edges. For convenience, the ‘columns’ of this Wilson network are drawn as horizontal pairs and the network is not drawn as a single rectangular array. All connections bidirectional; arrows omitted for clarity. A subscript e indicates an excitatory connection; i indicates an inhibitory one.
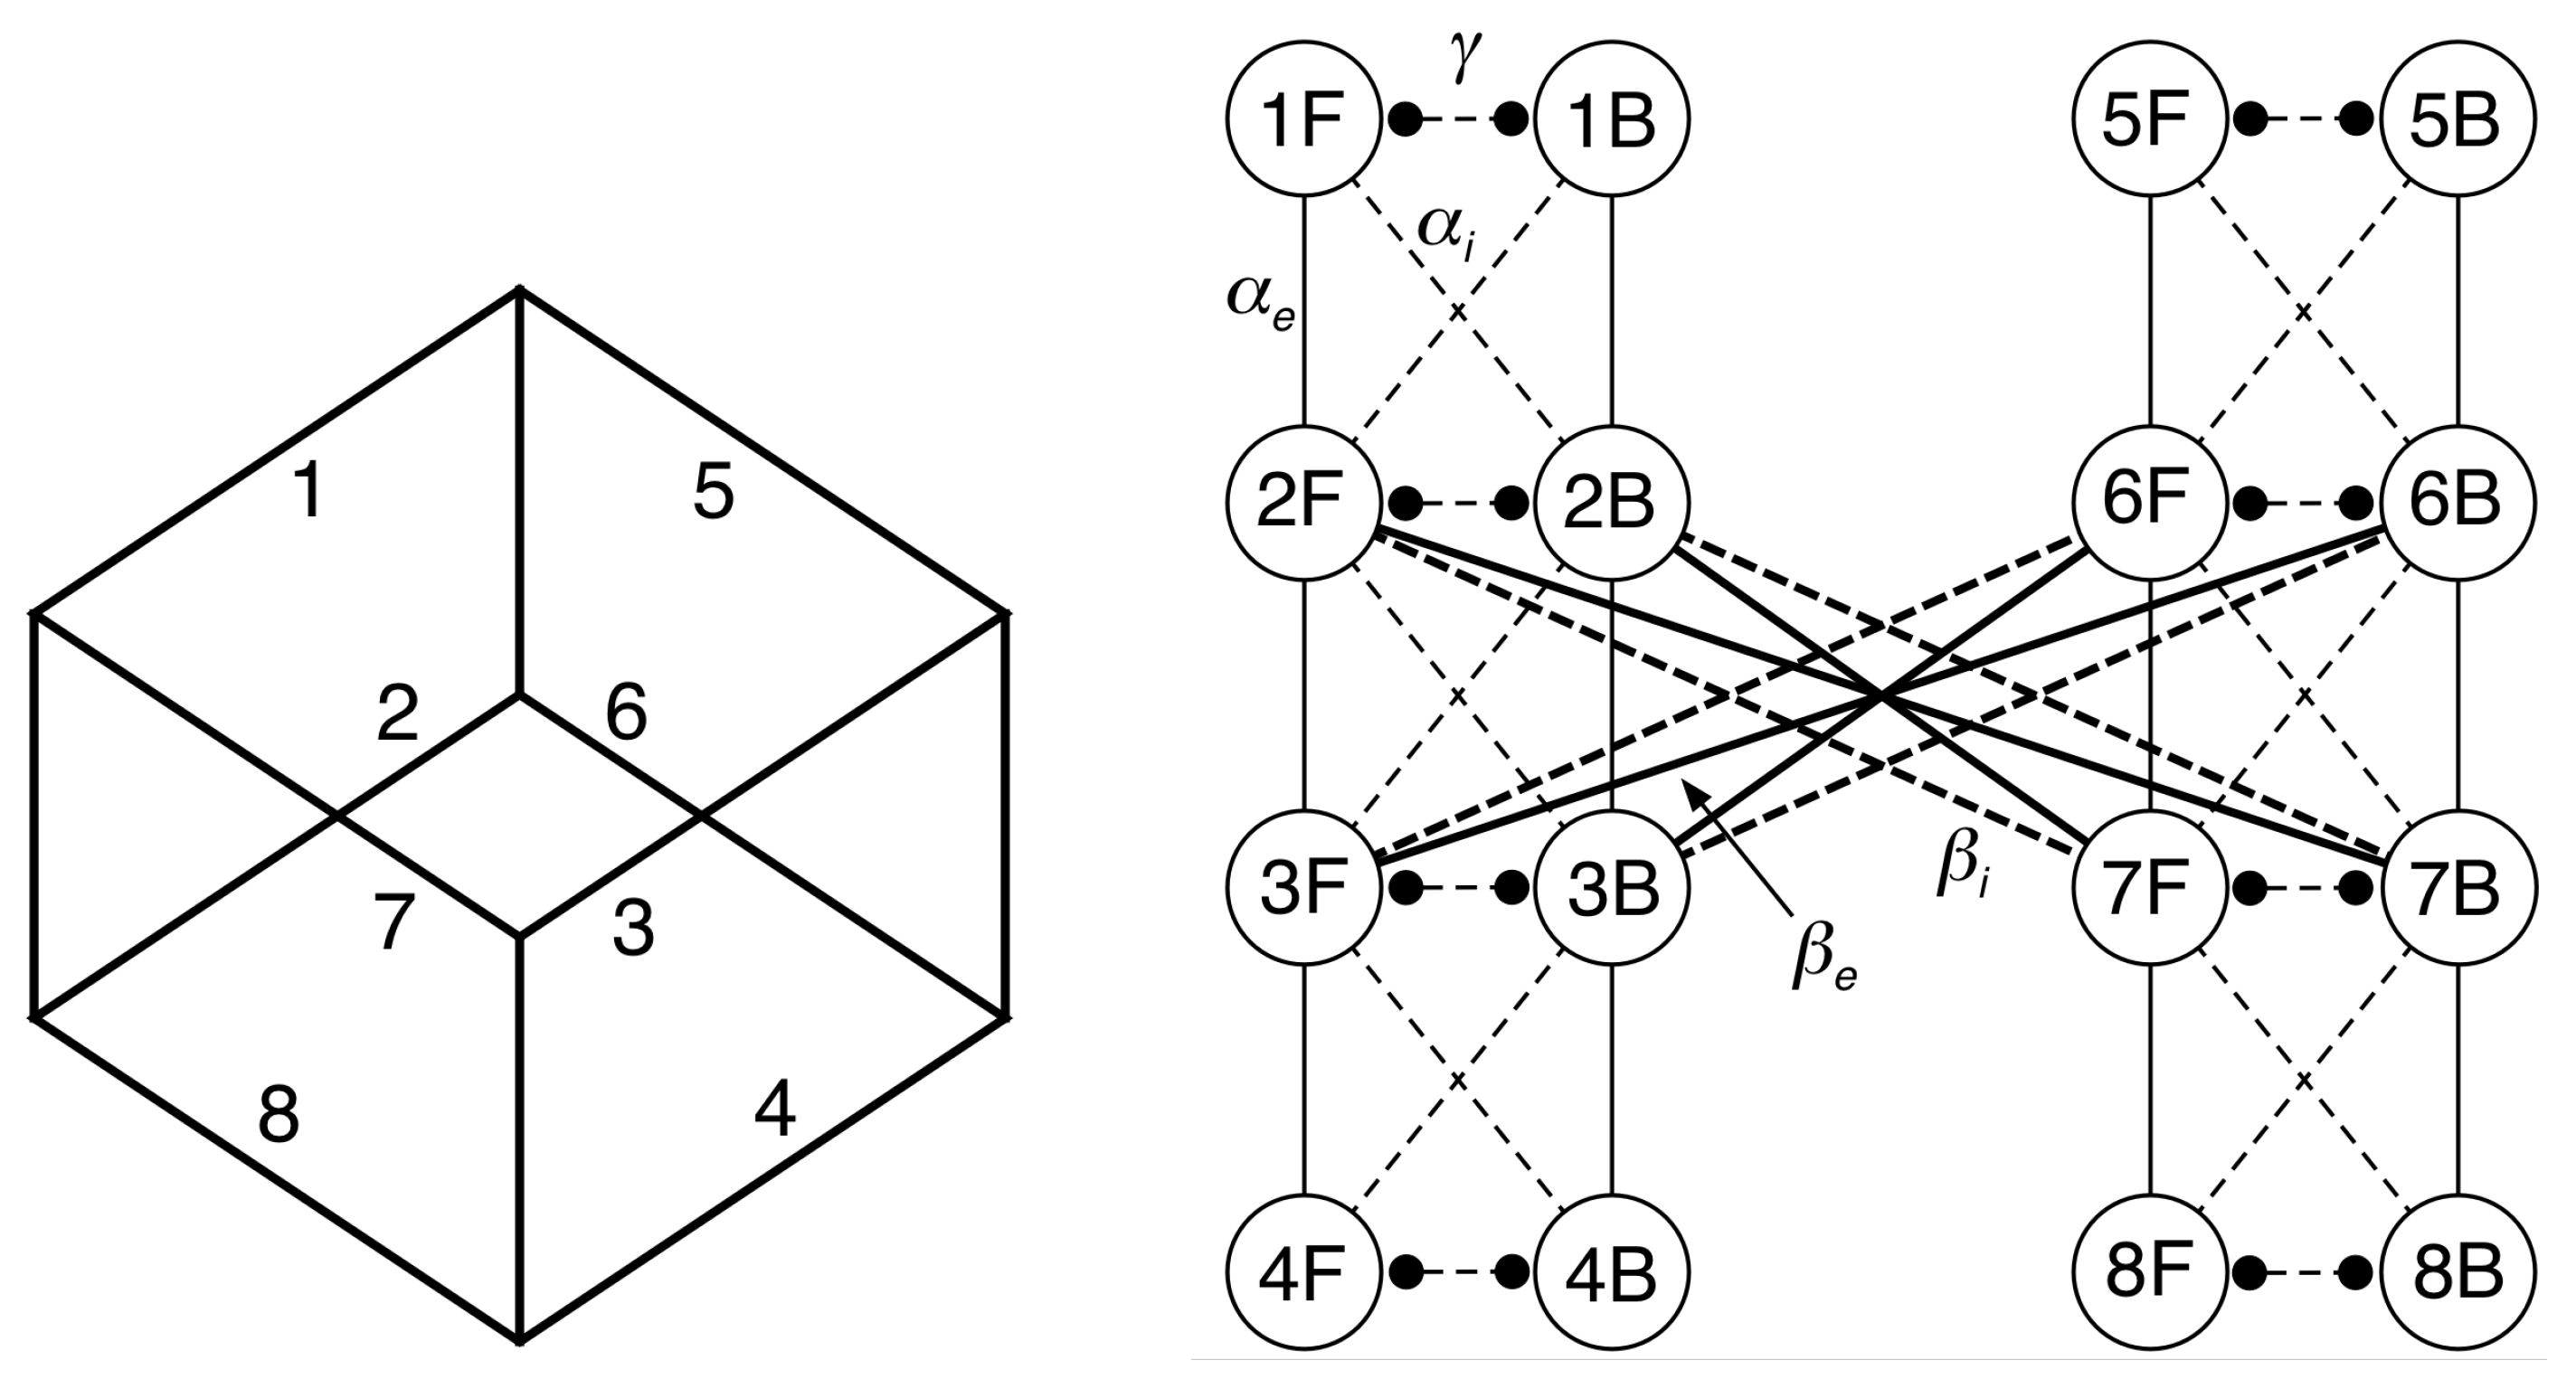
Figure 11.
The eight Hopf bifurcation patterns predicted by the equivariant Hopf theorem. White/grey shading indicates half-period phase shift. Dotted pattern in nodes 5–8 is a reminder that these nodes have a different waveform from nodes 1–4.
Figure 11.
The eight Hopf bifurcation patterns predicted by the equivariant Hopf theorem. White/grey shading indicates half-period phase shift. Dotted pattern in nodes 5–8 is a reminder that these nodes have a different waveform from nodes 1–4.

Figure 12.
General model. (Left) Time series for all F nodes. Parameters are . (Right) Enlarged view of the crossings, showing phase lag between the switching times. Colors correspond to nodes as follows: red = 1F, blue = 2F, green = 3F, magenta = 4F, cyan = 5F, black = 6F, brown = 7F, purple = 8F.
Figure 12.
General model. (Left) Time series for all F nodes. Parameters are . (Right) Enlarged view of the crossings, showing phase lag between the switching times. Colors correspond to nodes as follows: red = 1F, blue = 2F, green = 3F, magenta = 4F, cyan = 5F, black = 6F, brown = 7F, purple = 8F.
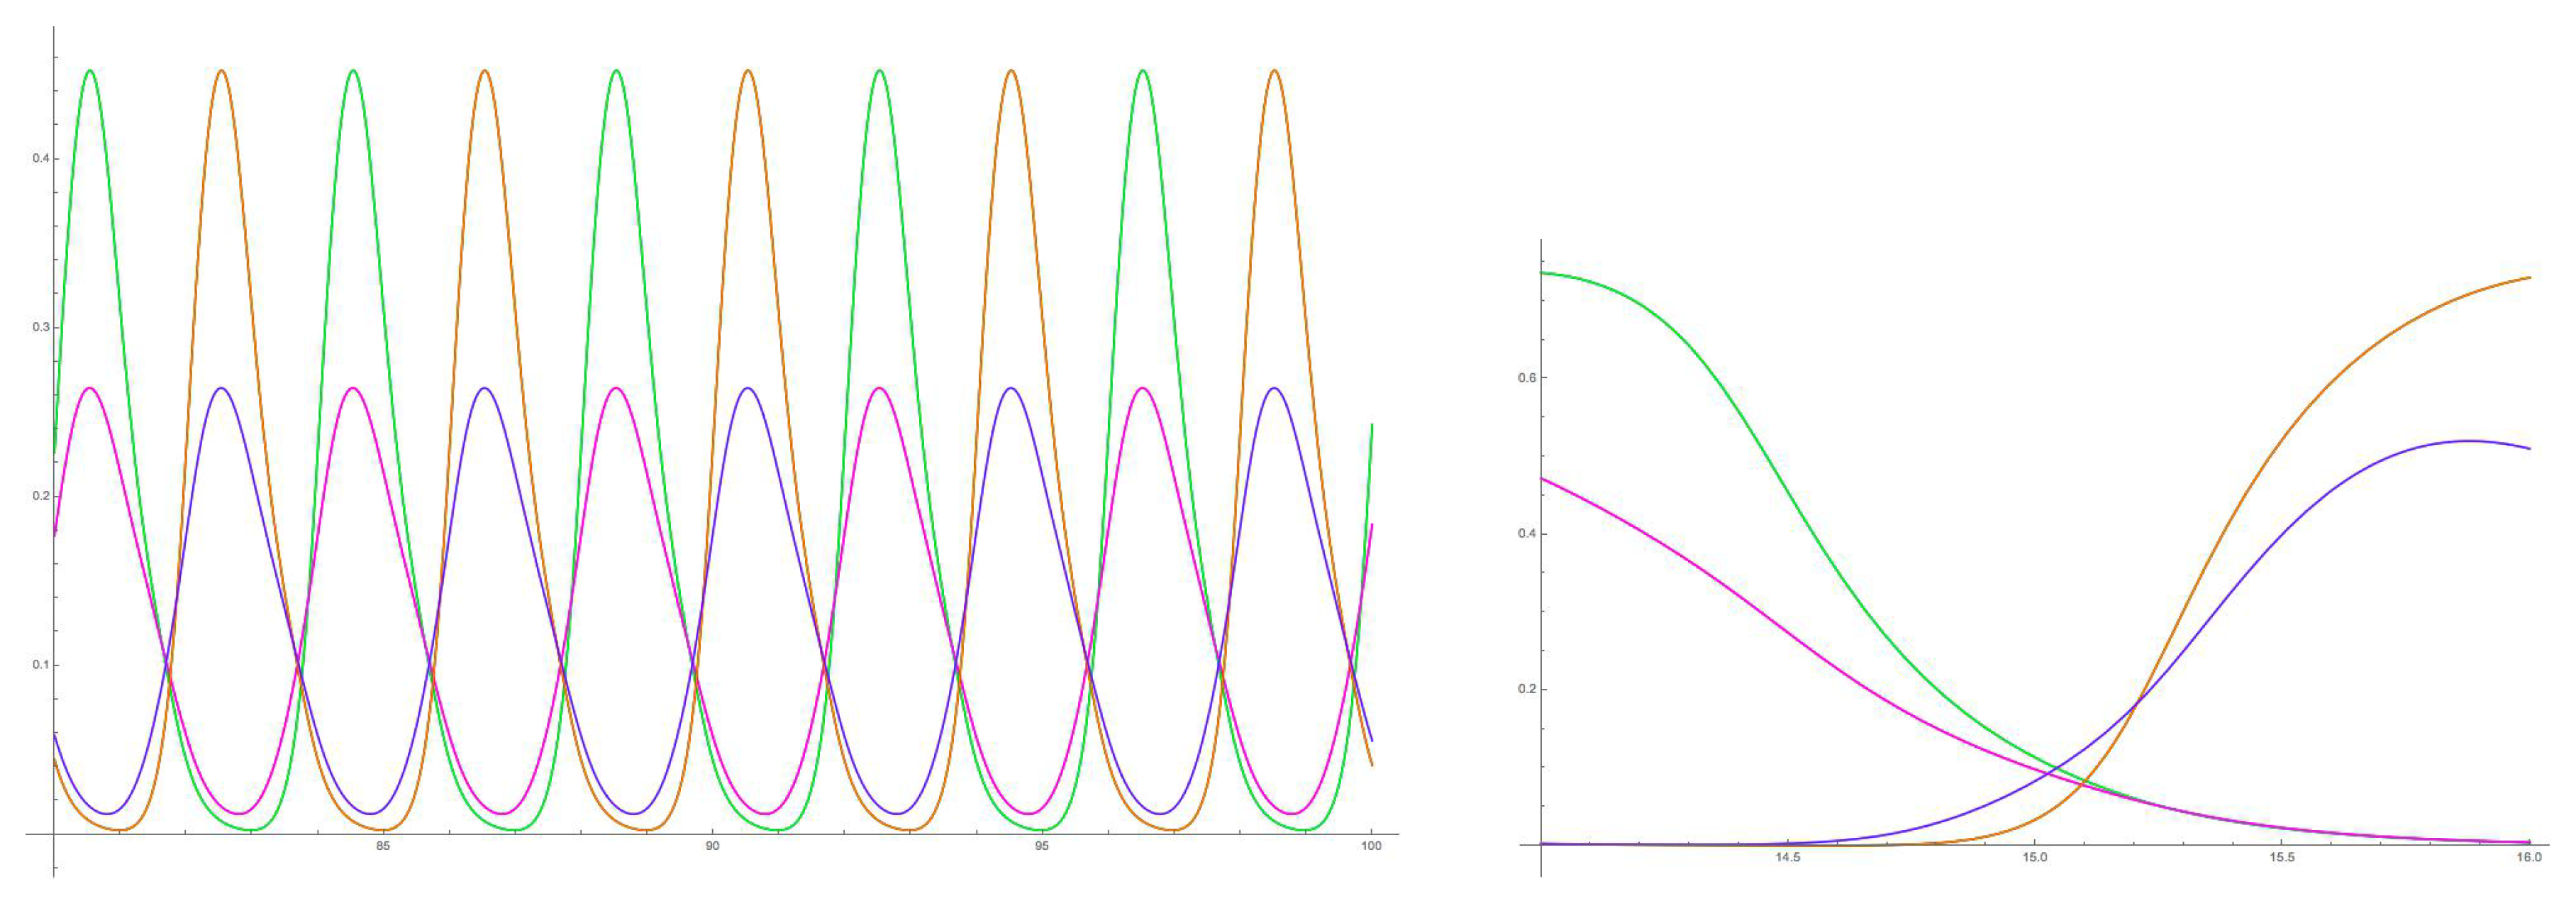
Figure 13.
General model. (Left) Time series nodes 1F, 2F, 3F, 4F. (Right) Time series nodes 5F, 6F, 7F, 8F. Each trace shows two superposed time series of exactly synchronous nodes.
Figure 13.
General model. (Left) Time series nodes 1F, 2F, 3F, 4F. (Right) Time series nodes 5F, 6F, 7F, 8F. Each trace shows two superposed time series of exactly synchronous nodes.
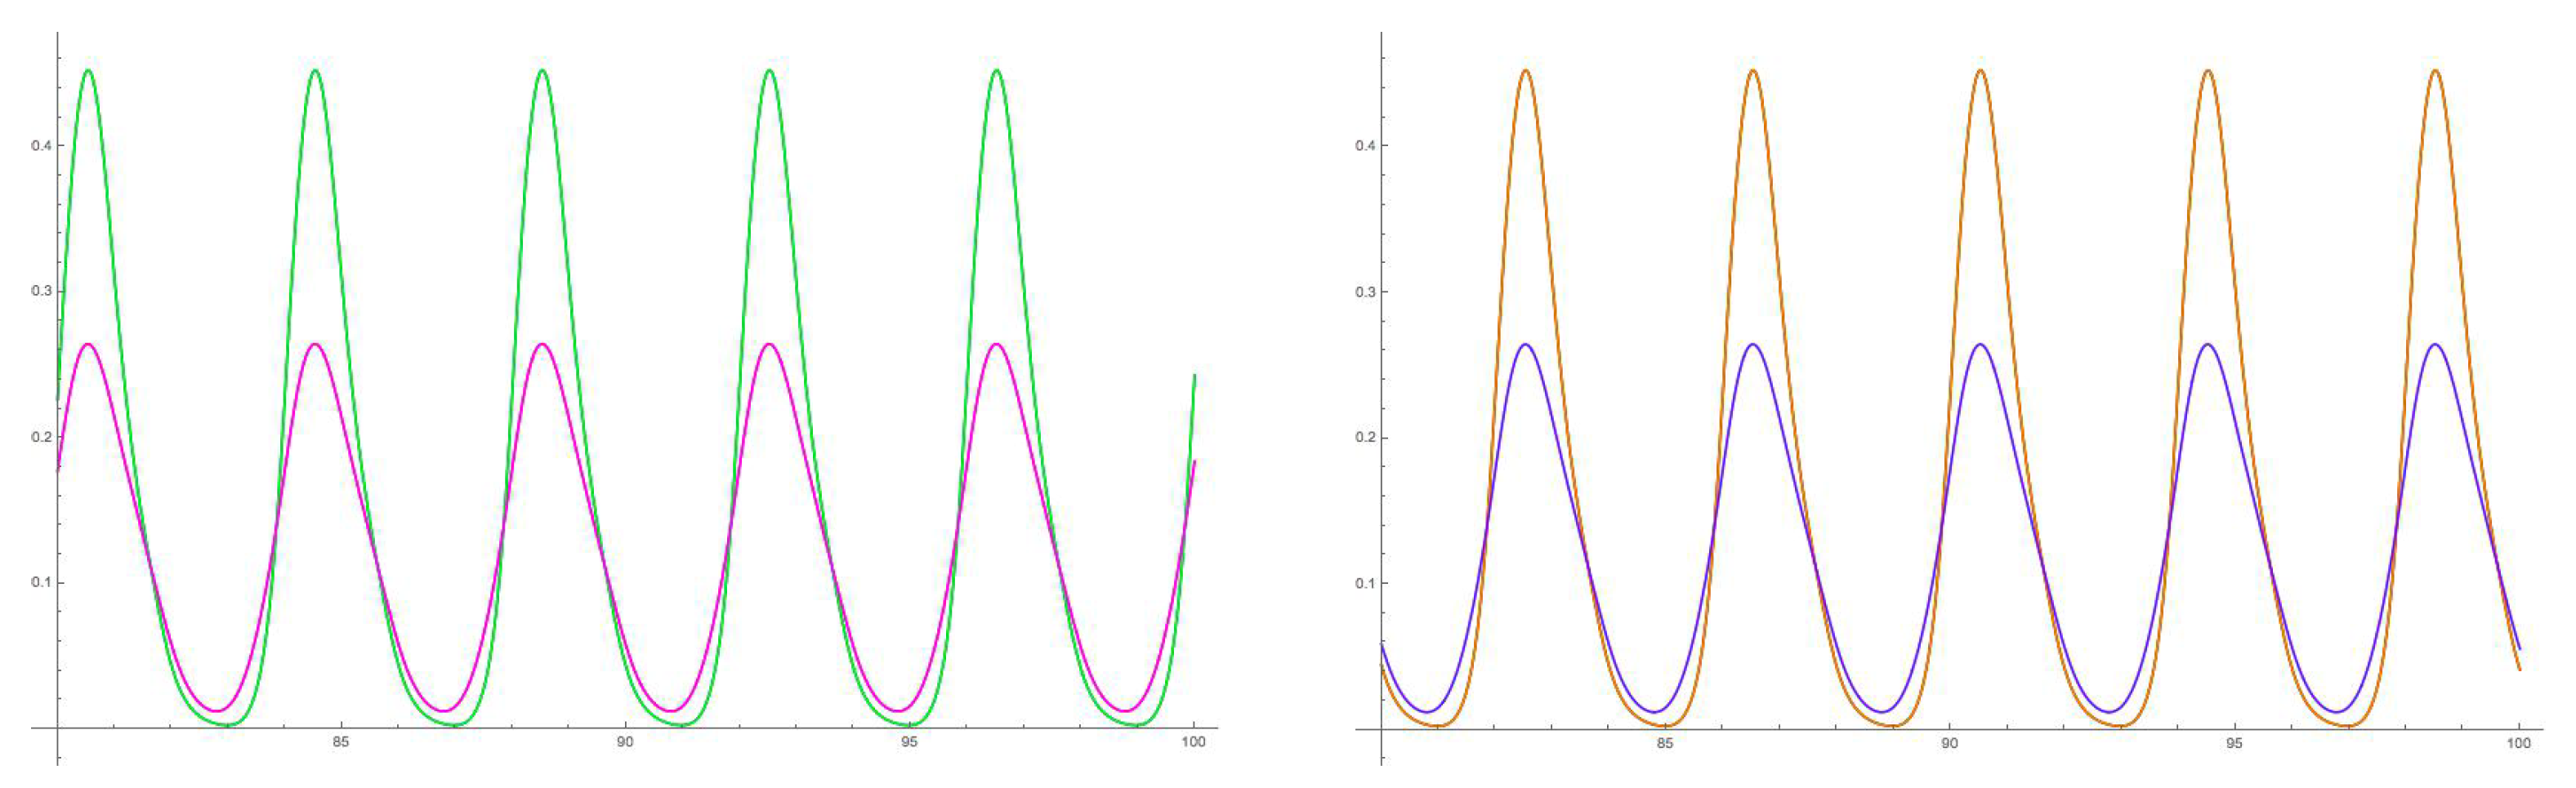
Figure 14.
Special model. (Left) Time series for all F nodes. Parameters are . (Right) Enlarged view of the crossings, showing phase lag between the switching times. Colors correspond to nodes as follows: red = 1F, blue = 2F, green = 3F, magenta = 4F, cyan = 5F, black = 6F, brown = 7F, purple = 8F.
Figure 14.
Special model. (Left) Time series for all F nodes. Parameters are . (Right) Enlarged view of the crossings, showing phase lag between the switching times. Colors correspond to nodes as follows: red = 1F, blue = 2F, green = 3F, magenta = 4F, cyan = 5F, black = 6F, brown = 7F, purple = 8F.

Figure 15.
(Left) Impossible Penrose triangle. (Right) Impossible rectangle formed by edges 1 and 2 of Figure 10 (left) in the transitional percept.
Figure 15.
(Left) Impossible Penrose triangle. (Right) Impossible rectangle formed by edges 1 and 2 of Figure 10 (left) in the transitional percept.
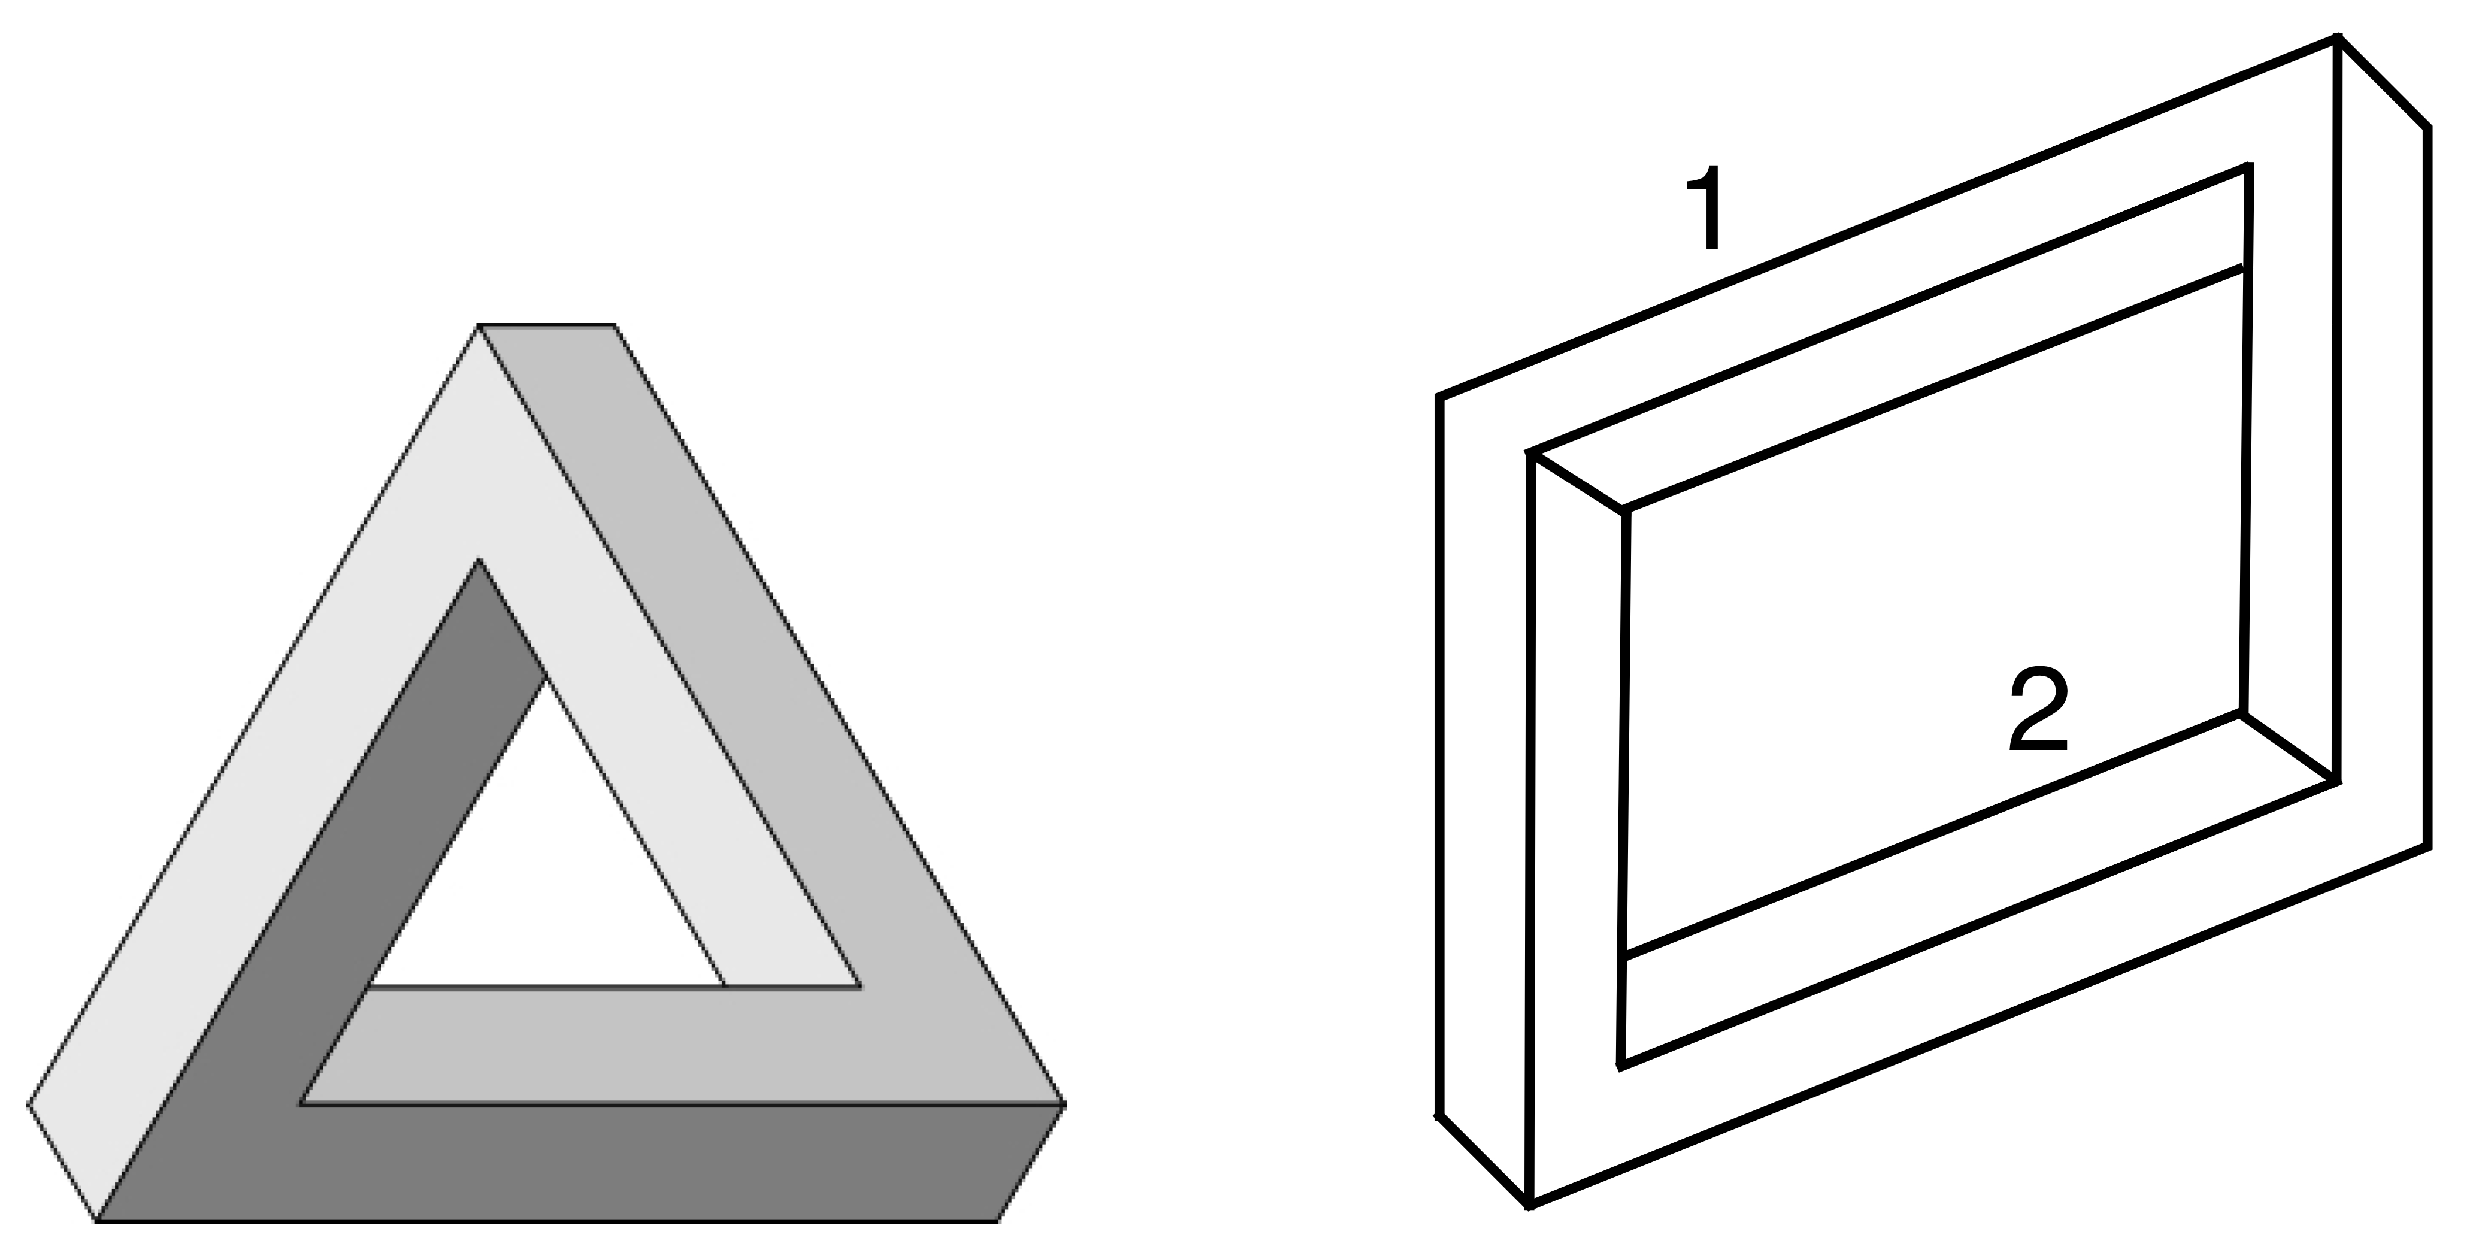
Figure 16.
Tristable figure from Poston and Stewart [14].
Figure 16.
Tristable figure from Poston and Stewart [14].
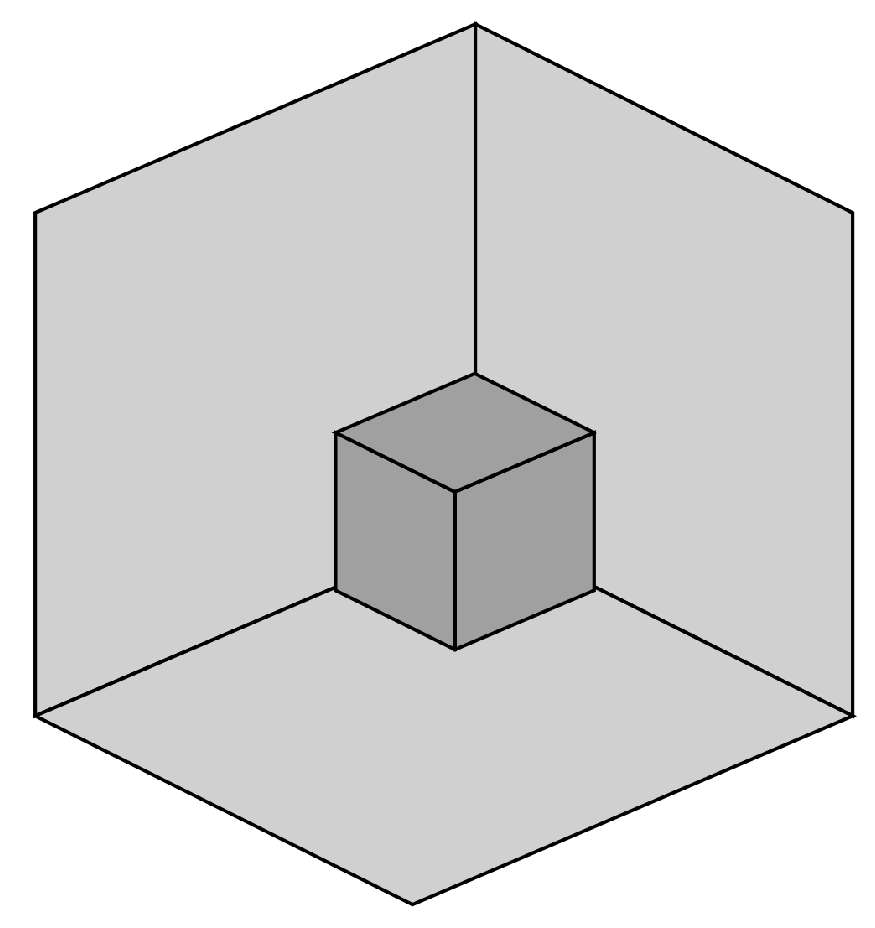
Figure 17.
Decomposing tristable figure from Poston and Stewart [14].
Figure 17.
Decomposing tristable figure from Poston and Stewart [14].
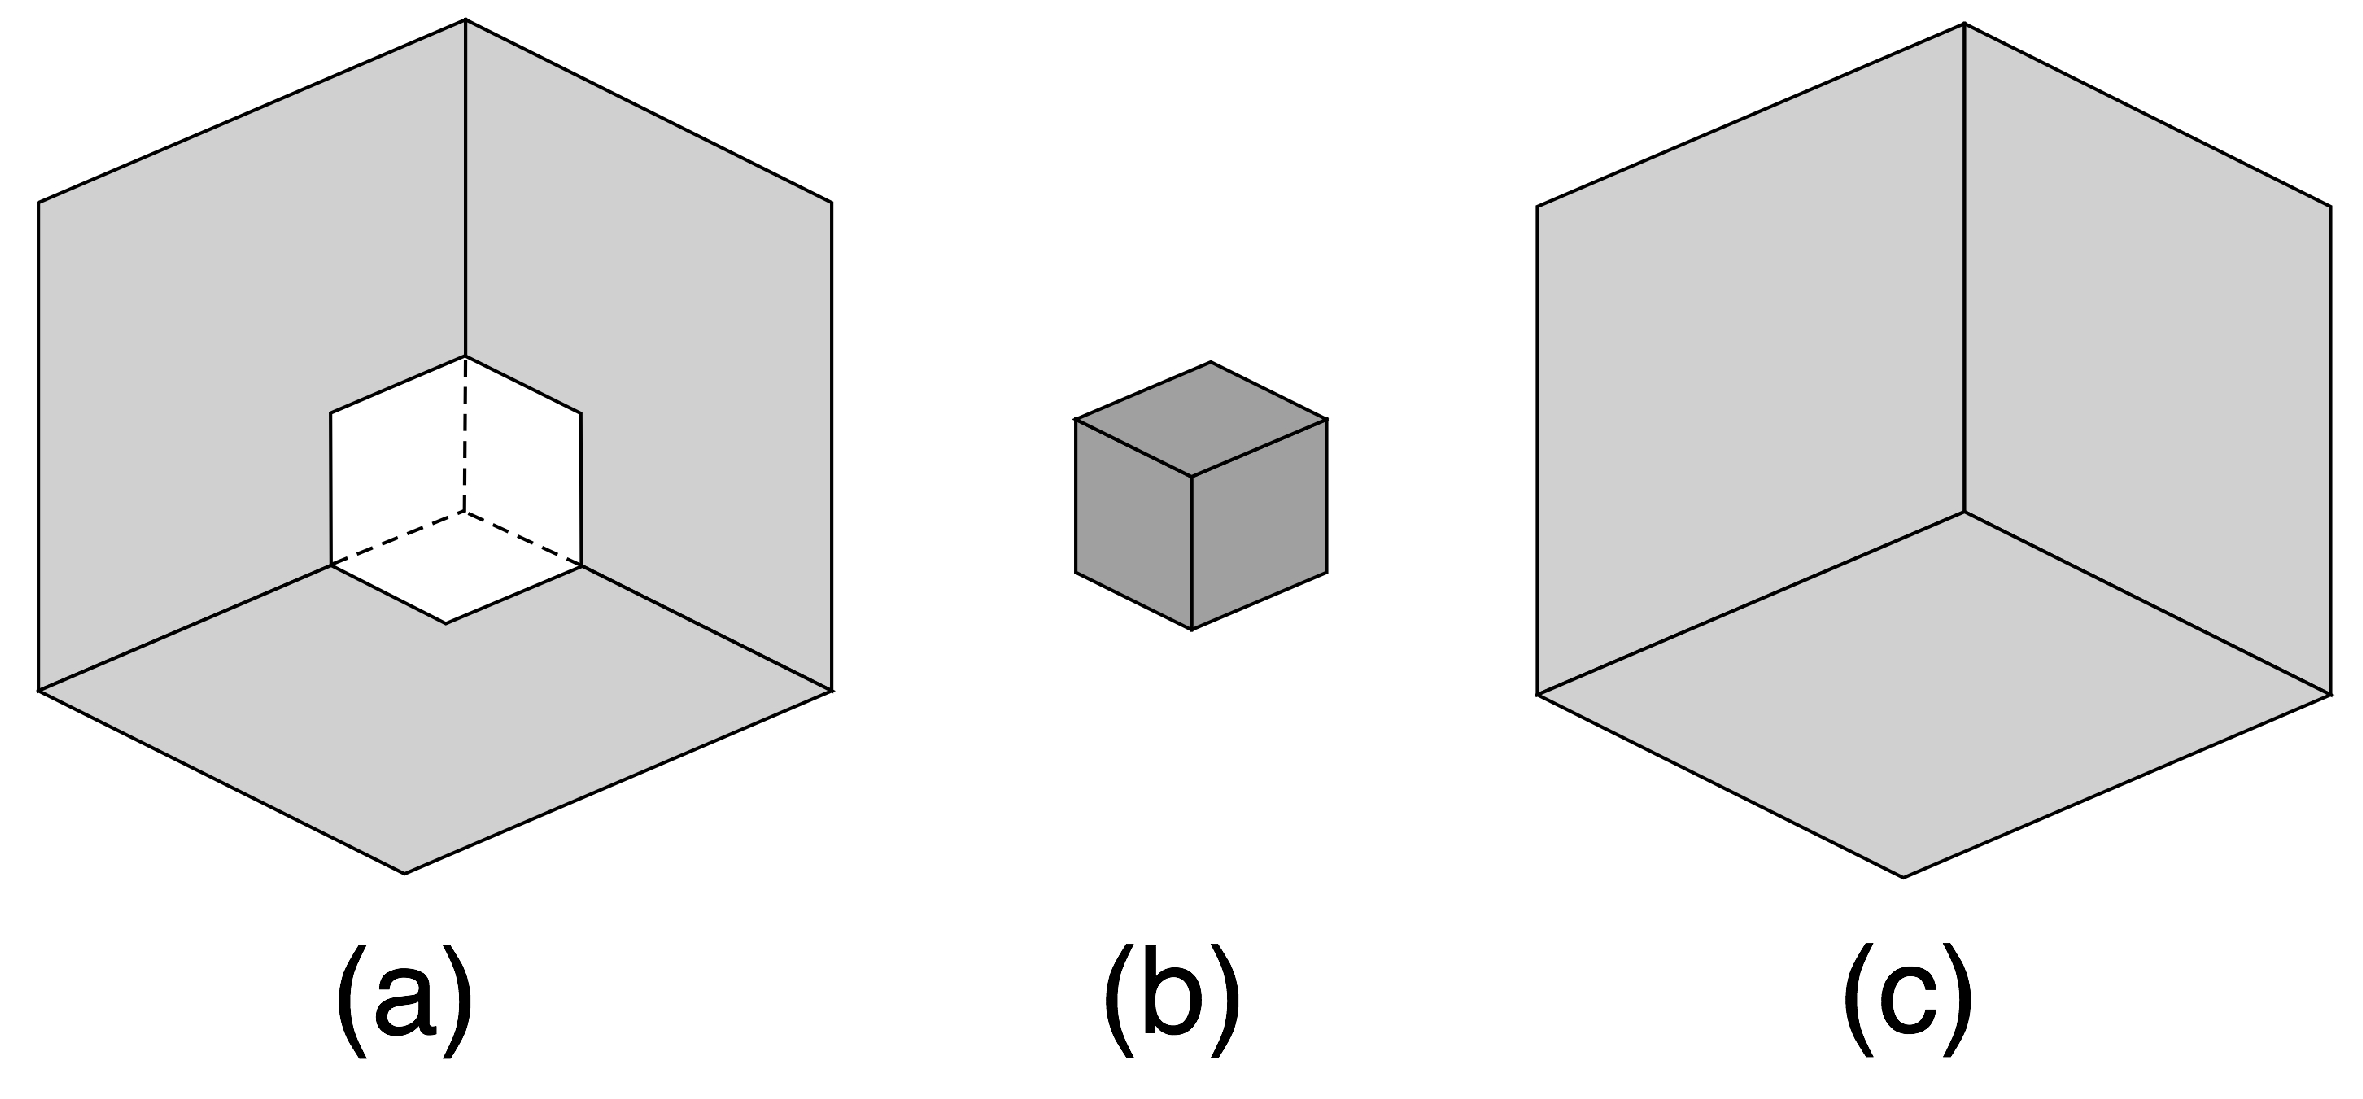
Figure 18.
Attributes and levels for tristable figure from Poston and Stewart [14].
Figure 18.
Attributes and levels for tristable figure from Poston and Stewart [14].
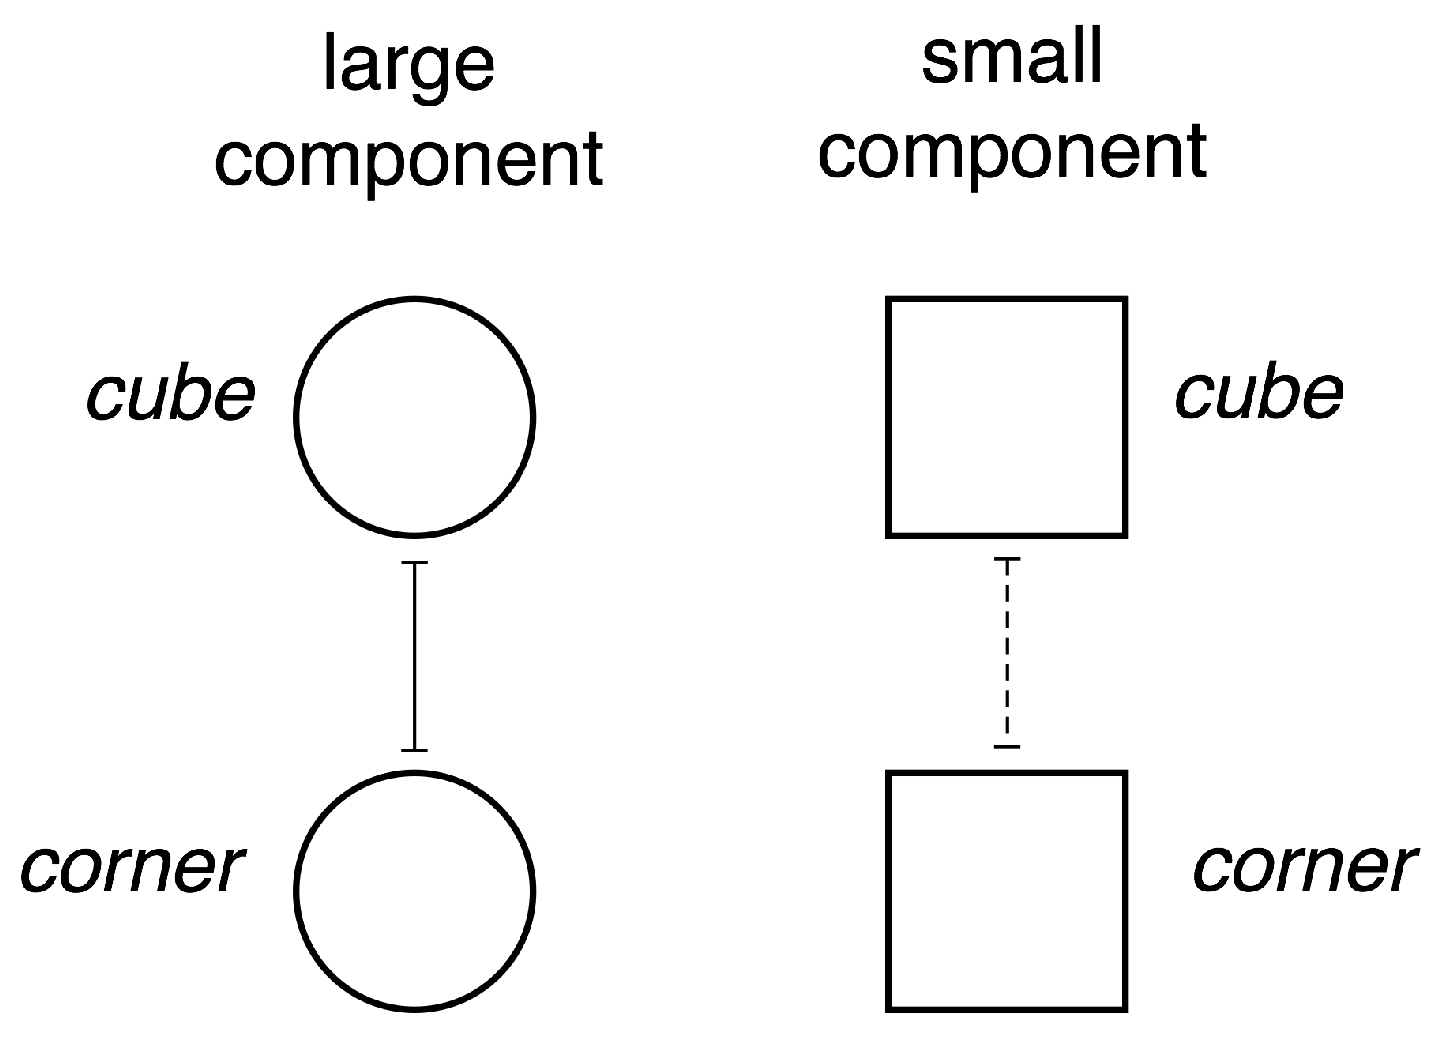
Figure 19.
(Left) Is the black face of the small component being viewed from above, or from beneath? If above, the image is perceived as a cube; if beneath, the image is perceived as a corner. (Right) Are the black faces parallel? If they are, the image is perceived either as a small cube in a corner, or as a big cube with a corner cut off. If not, it is perceived as a small tilted cube in front of a large cube.
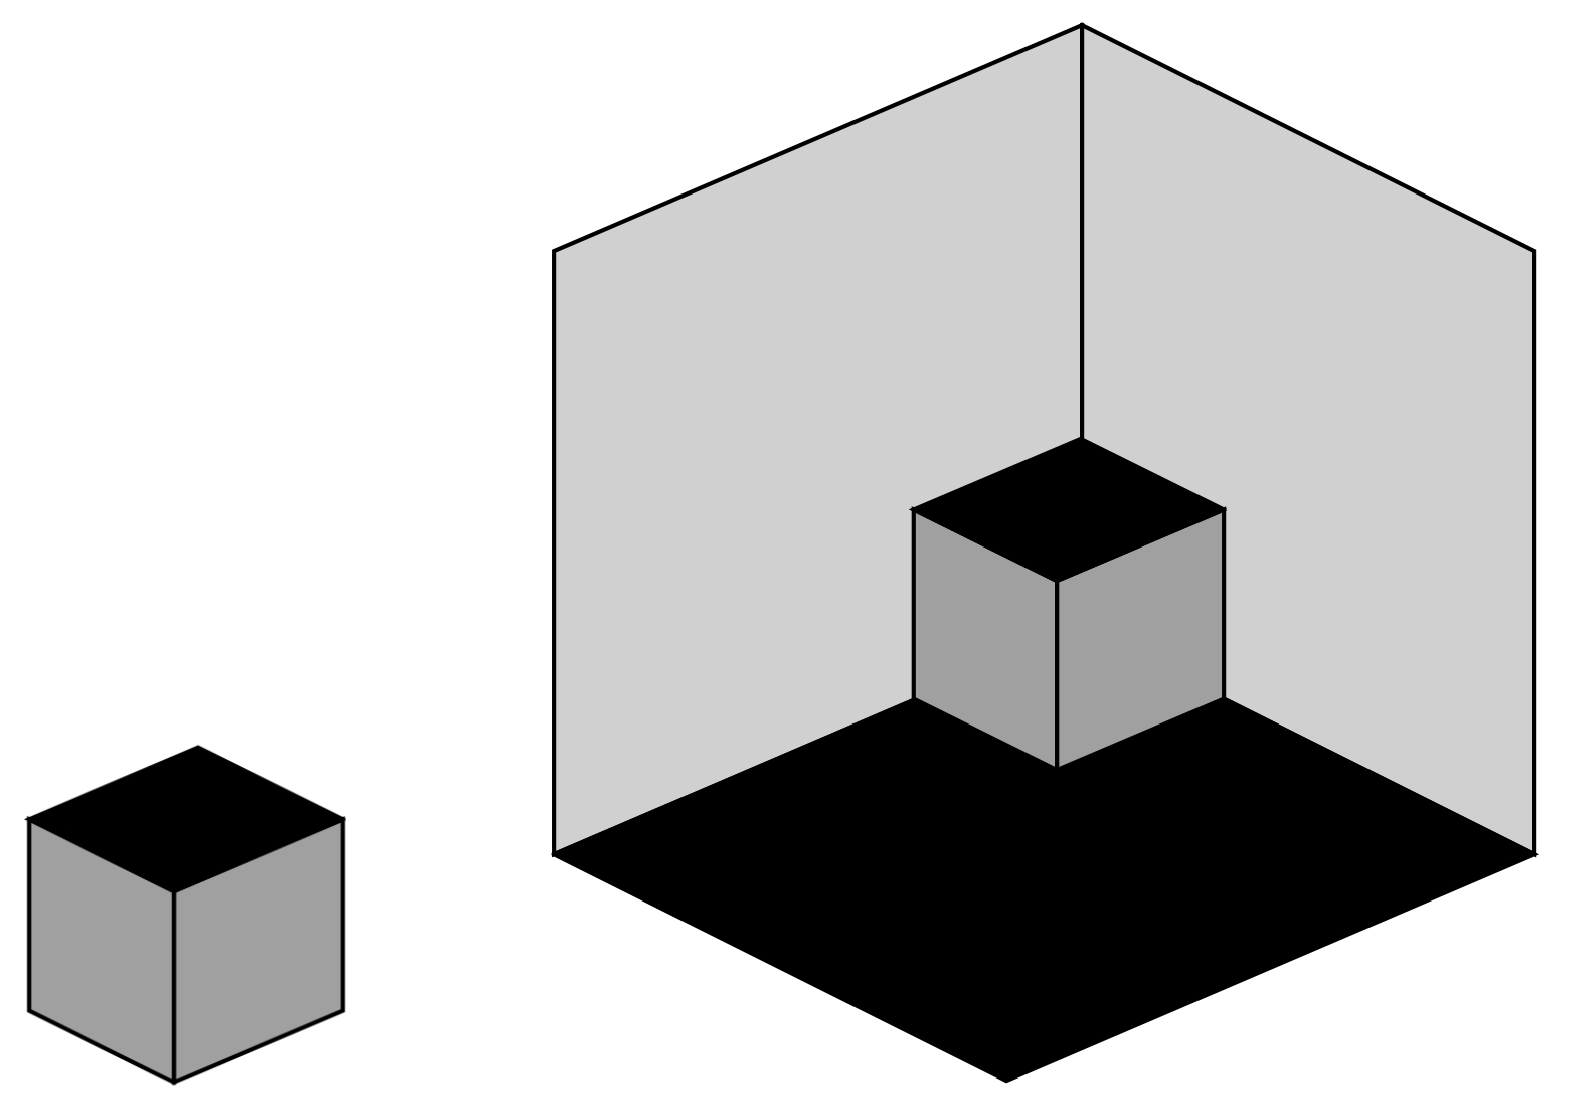
Figure 20.
The network with lateral connections added and nodes numbered.
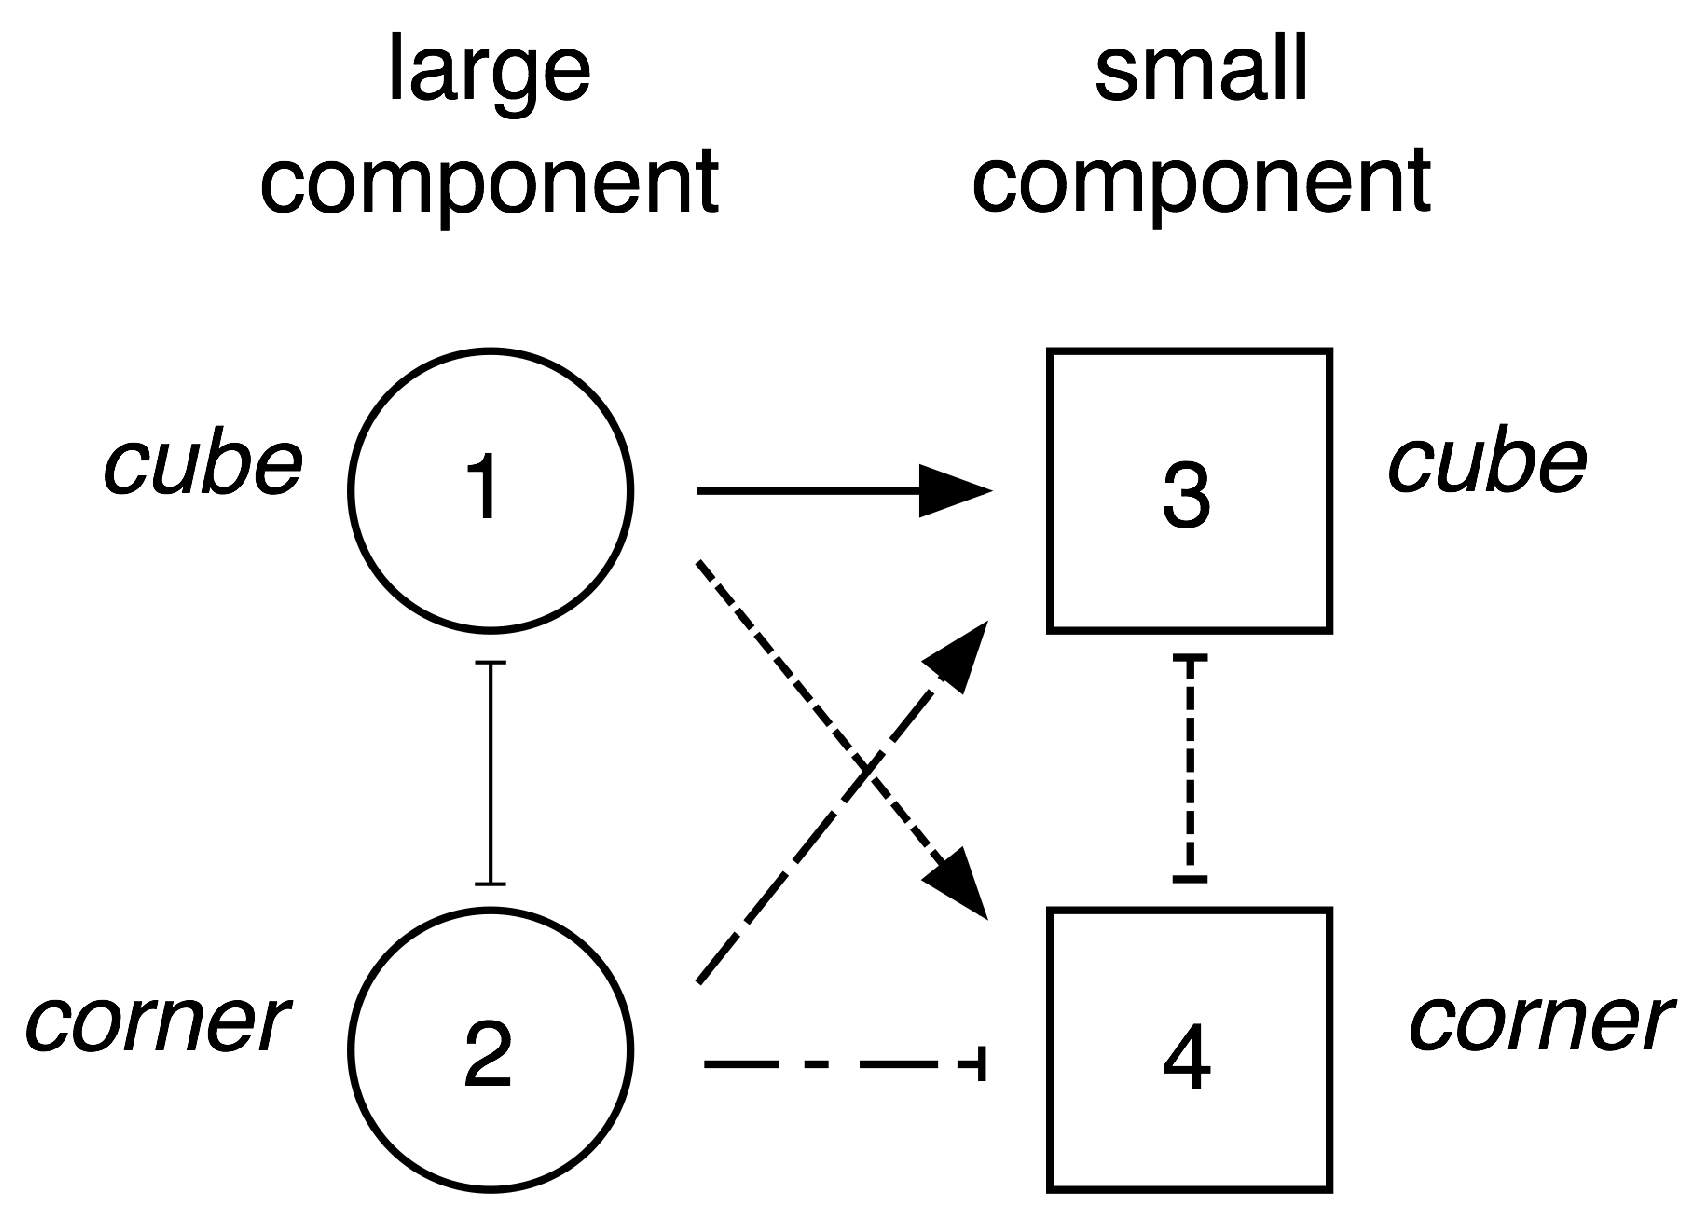
Figure 21.
Dynamics in the 4-node network. (Left) . (Right) All parameters unchanged, except . Colors are: node 1 red, node 2 blue, node 3 green, node 4 purple.
Figure 21.
Dynamics in the 4-node network. (Left) . (Right) All parameters unchanged, except . Colors are: node 1 red, node 2 blue, node 3 green, node 4 purple.
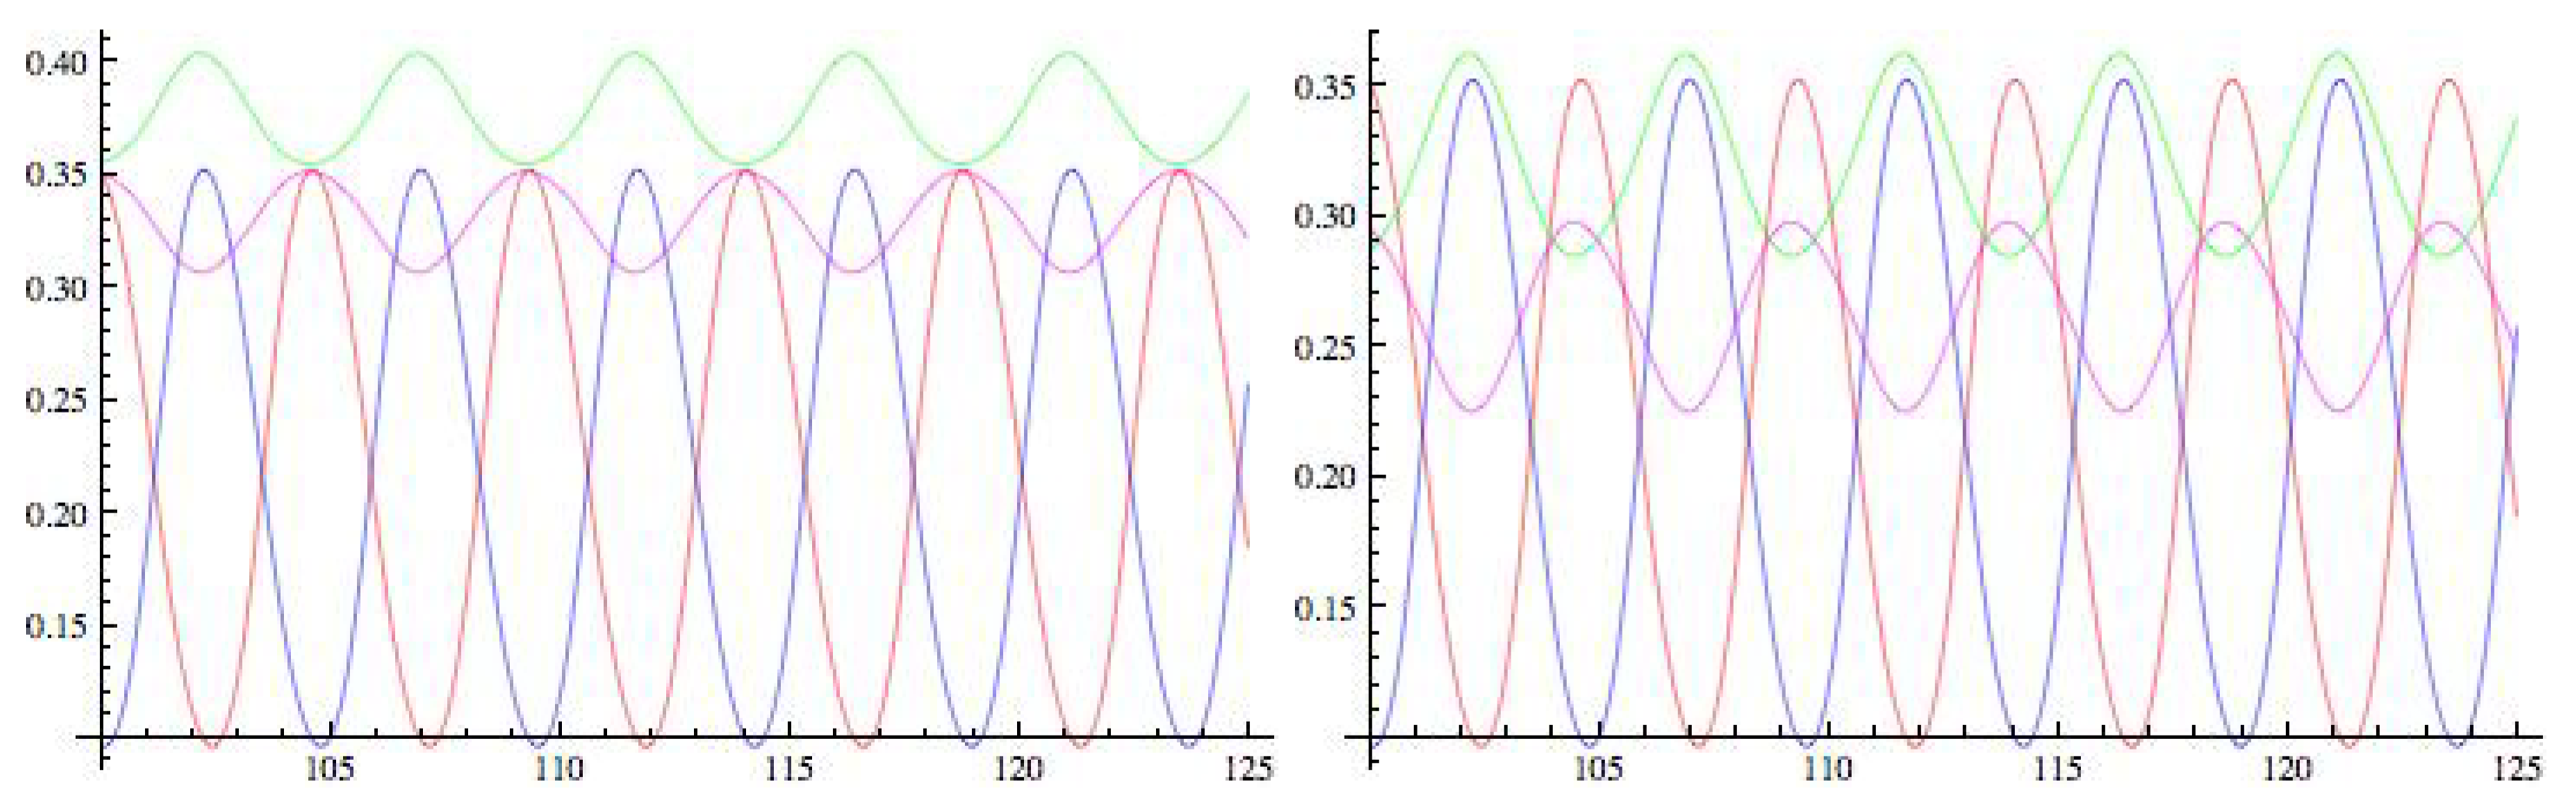

Table 1.
Eigenvalues of A and the associated periodic patterns.
| Pattern | Eigenvalue |
|---|---|
| 1 | |
| 2 | |
| 3 | |
| 4 | |
| 5 | |
| 6 | |
| 7 | |
| 8 |
Table 2.
Spatiotemporal isotropy subgroups of the eight types of primary Hopf bifurcation. ‘No.’ refers to the position in Figure 11 reading from left to right, top to bottom. For specific choices of parameters, take specific values.
Table 2.
Spatiotemporal isotropy subgroups of the eight types of primary Hopf bifurcation. ‘No.’ refers to the position in Figure 11 reading from left to right, top to bottom. For specific choices of parameters, take specific values.
| No. | Spatial K | Eigenvector Structure (Activity Variable Only) | |||
|---|---|---|---|---|---|
| 1 | + | + | + | ||
| 2 | − | + | + | ||
| 3 | + | − | + | ||
| 4 | − | − | + | ||
| 5 | − | + | − | ||
| 6 | + | + | − | ||
| 7 | − | − | − | ||
| 8 | + | − | − |
Table 3.
Eigenvalues of A for the special model.
| Pattern | Eigenvalue | Symbol |
|---|---|---|
| 1 | [multiplicity 2] | |
| 2 | [multiplicity 2] | |
| 3 | [multiplicity 2] | |
| 4 | [multiplicity 2] | |
| 5 | ||
| 6 | ||
| 7 | ||
| 8 |
© 2019 by the authors. Licensee MDPI, Basel, Switzerland. This article is an open access article distributed under the terms and conditions of the Creative Commons Attribution (CC BY) license (http://creativecommons.org/licenses/by/4.0/).
Share and Cite
MDPI and ACS Style
Stewart, I.; Golubitsky, M. Symmetric Networks with Geometric Constraints as Models of Visual Illusions. Symmetry 2019, 11, 799. https://doi.org/10.3390/sym11060799
AMA Style
Stewart I, Golubitsky M. Symmetric Networks with Geometric Constraints as Models of Visual Illusions. Symmetry. 2019; 11(6):799. https://doi.org/10.3390/sym11060799
Chicago/Turabian StyleStewart, Ian, and Martin Golubitsky. 2019. "Symmetric Networks with Geometric Constraints as Models of Visual Illusions" Symmetry 11, no. 6: 799. https://doi.org/10.3390/sym11060799
Note that from the first issue of 2016, this journal uses article numbers instead of page numbers. See further details here.