Article

Research Front Detection and Topic Evolution Based on Topological Structure and the PageRank Algorithm

School of Information, Zhejiang University of Finance and Economics, Hangzhou 310018, China
*
Author to whom correspondence should be addressed.
Symmetry 2019, 11(3), 310; https://doi.org/10.3390/sym11030310
Submission received: 8 January 2019 / Revised: 22 February 2019 / Accepted: 24 February 2019 / Published: 1 March 2019

Abstract

:
Research front detection and topic evolution has for a long time been an important direction for research in the informetrics field. However, most previous studies either simply use a citation count for scientific document clustering or assume that each scientific document has the same importance in detecting the clustering theme in a cluster. In this study, utilizing the topological structure and the PageRank algorithm, we propose a new research front detection and topic evolution approach based on graph theory. This approach is made up of three stages: (1) Setting a time window with appropriate length according to the accuracy of scientific documents clustering results and the time delay of a scientific document to be cited, dividing scientific documents into several time windows according to their years of publication, calculating similarities between them according to their topological structure, and clustering them in each time window based on the fast greedy algorithm; (2) combining the PageRank algorithm and keywords’ frequency to detect the clustering theme, which assumes that the more important a scientific document in the cluster is, the greater the possibility that it is cited by the other documents in the same cluster; and (3) reconstructing the cluster graph where nodes represent clusters and edges’ strengths represent the similarities between different clusters, then detecting research front and identifying topic evolution based on the reconstructed cluster graph. To evaluate the performance of our proposed approach, the scientific documents related to data mining and covered by Science Citation Index Expanded (SCI-EXPANDED) or Social Science Citation Index (SSCI) in Web of Science are collected as a case study. The experiment’s results show that the proposed approach can obtain reasonable clustering results, and it is effective for research front detection and topic evolution.

1. Introduction

Understanding research front and topic evolution can help researchers better understand research fields, and keep track of the flow of innovation and knowledge. Therefore, how to detect the research front and identify topic evolution has been an important research direction in the informetrics field for a long time. There are many studies that focus on research front detection and topic evolution. For example, some studies [1,2] used visualization tools such as CiteSpace or SCI2 to identify research front and topic evolution; some studies [3,4,5] proposed their topic evolution methods, which cluster documents and analyze the dynamic of clustering themes.
There is no doubt that the aforementioned studies have all contributed to research front detection and topic evolution. However, there are still some limitations that need to be addressed. On the one hand, though the visualization tools simplify the work of document clustering and topic evolution to a certain extent, they have become a bottleneck for researchers in proposing their own modeling approaches or using the extended algorithms, which are not supported by visualization tools. Therefore, based on the topological structure and PageRank algorithm, we propose a new research front detection and topic evolution method in the current study, which is more flexible than visualization tools.
On the other hand, because of the time lapse of a scientific document to be cited, co-citation analysis performs well in the clustering of old documents, but performs poorly in the clustering of current documents, while bibliographic coupling does the opposite [6]. It is necessary to consider both co-citation and bibliographic coupling for the clustering of scientific documents. However, most previous studies such as Boyack and Klavans [6] and Glänzel and Thijs [7], clustered documents simply based on only one of these citation analyses—direct citation, co-citation, or bibliographic coupling—all of which have room for improvement. In addition, some previous studies, such as Yu et al. [8], detected the clustering theme according to the frequency of keywords in the cluster, which did not consider the fact that different scientific documents play different important roles in the cluster.
To solve the issues mentioned above, a new research front detection and topic evolution method based on topological structure and the PageRank algorithm is proposed in this study, which is composed of three stages. In the first stage, we divide scientific documents into several time windows with a certain length t, by considering not only the accuracy of scientific document clustering results but also the time delay of a scientific document to be cited. Then, based on the graph theory [9], we cluster scientific documents in each time window based on their topological structure. For scientific document clustering, our proposed approach goes beyond the traditional approach that combines relative co-citation and bibliographic coupling [10], by integrating both the in-degree and out-degree of a scientific document.
In the second stage, inspired by the document ranking method [11], we employ the PageRank algorithm to rank the scientific documents in the cluster. As a result, the more important a scientific document in the cluster is, the greater the possibility that it is cited by the other documents in the same cluster. We then combine the frequency of keywords with the scientific documents’ rank value to detect the clustering theme.
In the third stage, we reconstruct the cluster graph where nodes represent clusters and edges’ strengths represent the similarities between different clusters. Then, we divide the edges in the cluster graph into three levels, including strong connection, common connection, and weak connection, according to their strengths. Finally, we identify and visualize research front and topic evolution according to the reconstructed cluster graph. The experiment’s results show that our proposed approach is an effective approach for research front detection and topic evolution.
The remainder of this article is organized as follows. Section 2 presents a review of some related works. Section 3 describes in detail our proposed approach. Section 4 introduces the data used in this study and discusses the experiment’s results. Finally, Section 5 concludes the study and discusses our future research direction.

2. Related Works

Research front detection and topic evolution has been an important research direction in past decades. The aim of this section is to introduce related studies in the two directions below and identify current challenges that need to be overcome in future research.

2.1. Research front Detection and Topic Evolution

Latent Dirichlet Allocation (LDA) [12] is a popular model in research front detection and topic evolution that assumes that each document represents a probability distribution of some topics and each topic represents a probability distribution of some words. Kim and Lee [13] used LDA to recommend reviewers, some studies [5,14,15] used LDA to detect documents’ topics, and analyzed the dynamic of these topics to identify topic evolution. However, the number of topics has to be set before using LDA and cannot be changed during different time windows.
In addition, some studies cluster documents before detecting research front and identifying topic evolution. For example, Morris et al. [16] used the hierarchical clustering algorithm to cluster documents and visualized the research front using timelines. They calculated documents’ similarities according to bibliographic coupling network, and detected the clustering theme based on documents’ titles. Liu et al. [3] clustered documents based on citation network, divided clustering into several time windows, and addressed emerging trends based on the vector of keywords. However, both Morris et al. [16] and Liu et al. [3] assumed that different documents are equally important in the cluster and did not combine co-citation and bibliographic coupling in document clustering. To distinguish the importance of every document in the cluster, Glänzel and Thijs [7] proposed the concept of core documents, so that some marginal documents were not considered in detecting the clustering theme. Moreover, Shubankar et al. [11] used the PageRank algorithm to assign an authoritative score to each document, then they determined the important documents in the cluster by looking at the scores of all documents in the same cluster. In addition, Bichteler and Iii [10] beheld the negative impact due to a single consideration of co-citation or bibliographic coupling, and used an approach that combines relative co-citation and bibliographic coupling for document retrieval. However, it cannot distinguish whether two documents have direct citation relationship.
In this study, based on the topological structure and the PageRank algorithm, we propose a new method of research front detection and topic evolution that not only considers both co-citation and bibliographic coupling, but also ranks scientific documents according to their importance in the cluster.

2.2. Related Algorithms Used in this Study

In this study, we used the fast-greedy algorithm [17] to cluster scientific documents in each time window, and used the PageRank algorithm [18] to rank the scientific documents according to their importance in the cluster.
To detect community structure in the complex network, Girvan and Newman [19] defined the concept of edge betweenness and proposed the Girvan–Newman algorithm (GN algorithm). Moreover, they proved that the GN algorithm can detect community structure very successfully. However, the GN algorithm is computationally demanding, which sometimes limits its application. To overcome the shortcoming of the GN algorithm, Newman [20] defined the concept of modularity and proposed the fast-greedy algorithm, which obtains qualitatively similar results as those based on the GN algorithm, but runs much faster than the latter. Therefore, the fast-greedy algorithm has been widely used for document clustering [4,21]. Clauset et al. [17] enhanced the traditional fast-greedy algorithm by using a more sophisticated data structure. As a result, the extended fast-greedy algorithm proposed by Clauset et al. [17] runs far more quickly than the traditional fast-greedy algorithm. Moreover, it is available in the igraph package of R programming (https://github.com/igraph/rigraph). Therefore, we use the extended fast-greedy algorithm proposed by Clauset et al. [17] for scientific document clustering in this study.
Ever since the PageRank algorithm was proposed by Brin and Page [18], it has been widely used in ranking documents, researchers, and journals, among others. For example, Chen et al. [22] used the PageRank algorithm to rank the documents published in the Physical Review family of journals, with the goal of measuring documents’ importance in journals. Nykl et al. [23] ranked authors based on an algorithm that combines the PageRank algorithm and journal impact values. In our previous work, Yu et al. [24] combined PageRank and hyperlink-induced topics search algorithms to rank journals. In this study, we considered different scientific documents to have different important roles in the cluster. In other words, we assumed that: (1) If a scientific document had been cited many times by many scientific documents in the same cluster, then this scientific document was important in the cluster; (2) if a scientific document had been cited by the other important document in the cluster, then this scientific document was also important in the cluster. These ideas are similar to that of the PageRank algorithm, which transforms the importance of one document to another repeatedly until a steady result is reached. Therefore, in this study, the PageRank algorithm was used to rank the importance of scientific documents in the cluster, before detecting the clustering theme.

3. The Proposed Research Front Detection and Topic Evolution Method

In this study, based on the topological structure and PageRank algorithm, we proposed a new method of research front detection and topic evolution that not only considers both co-citation and bibliographic coupling, but also considers the fact that different scientific documents have different important roles in the cluster.

3.1. Notations

To detect research front and identify topic evolution, the following notations were used in our proposed approach:
A/Bscientific documents A or B in case study
p/qclusters p or q in this study
|p/q|number of scientific documents in the clusters p or q
NAnumber of scientific documents in the cluster which contains document A
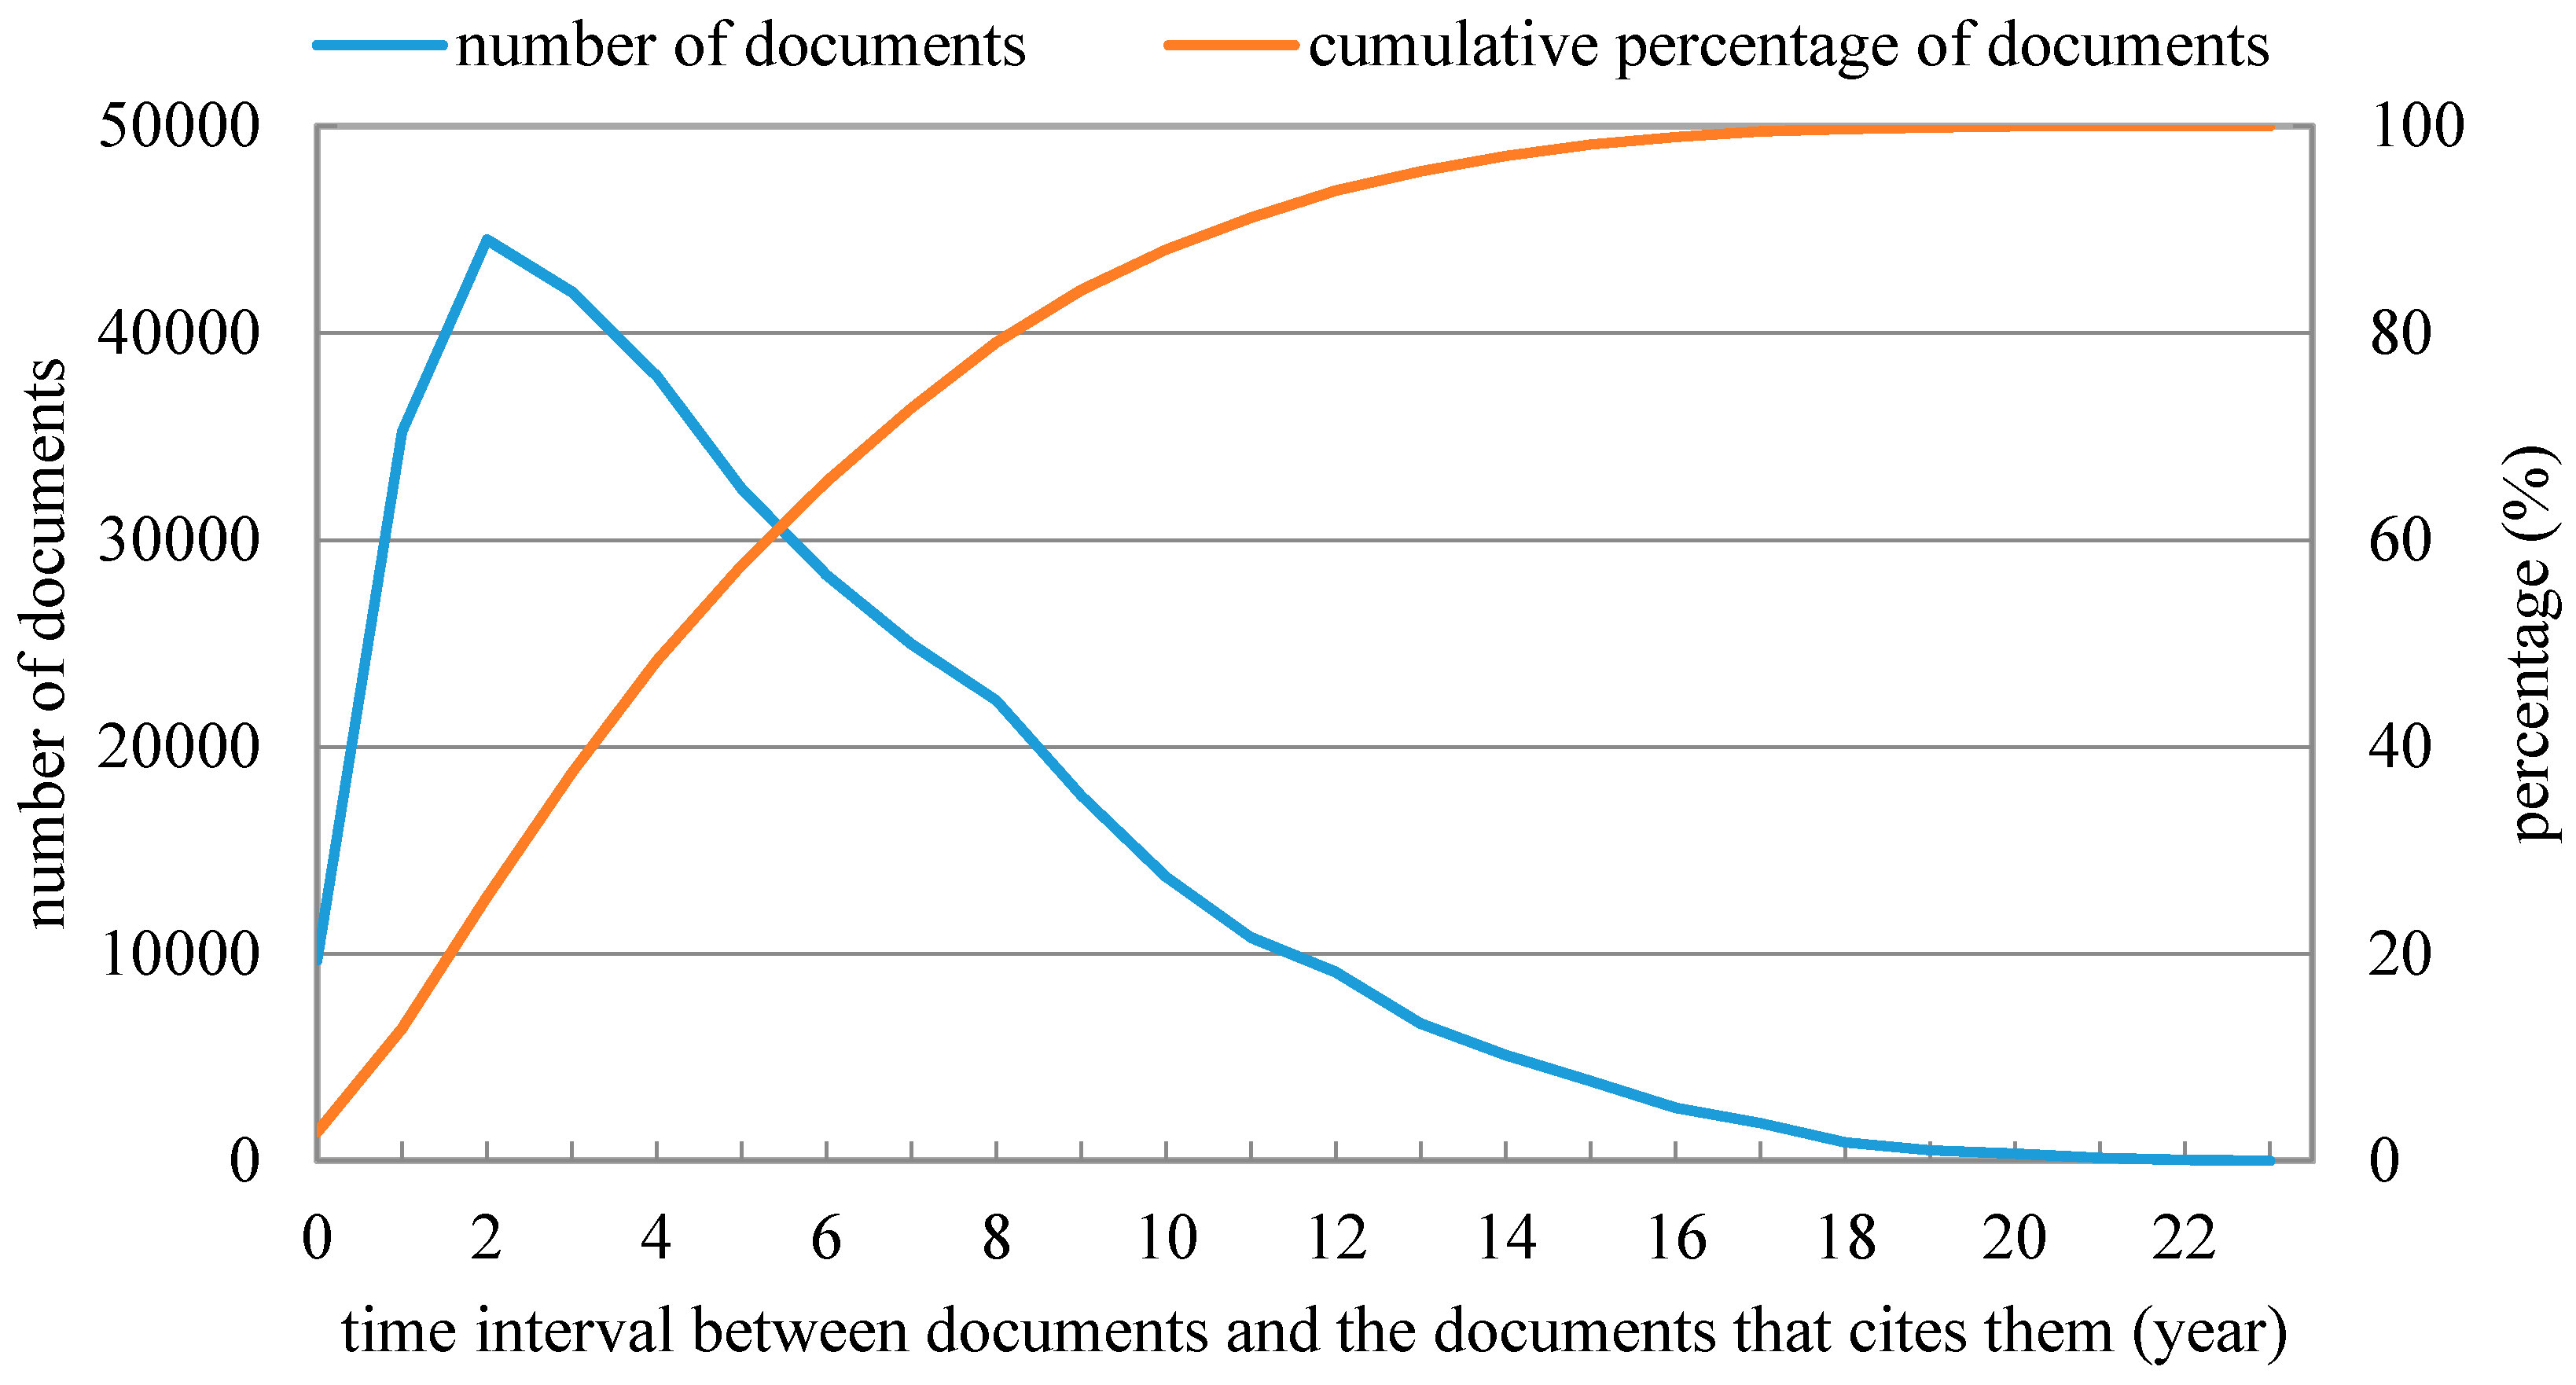
tlength of time window
ddamping factor introduced in the PageRank algorithm, which is set as 0.85 in this study
Ccite(A/B)collection of scientific documents that cite documents A or B
Ccited(A/B)collection of scientific documents that are cited by documents A or B
P(A/B)rank value of documents A or B in the cluster
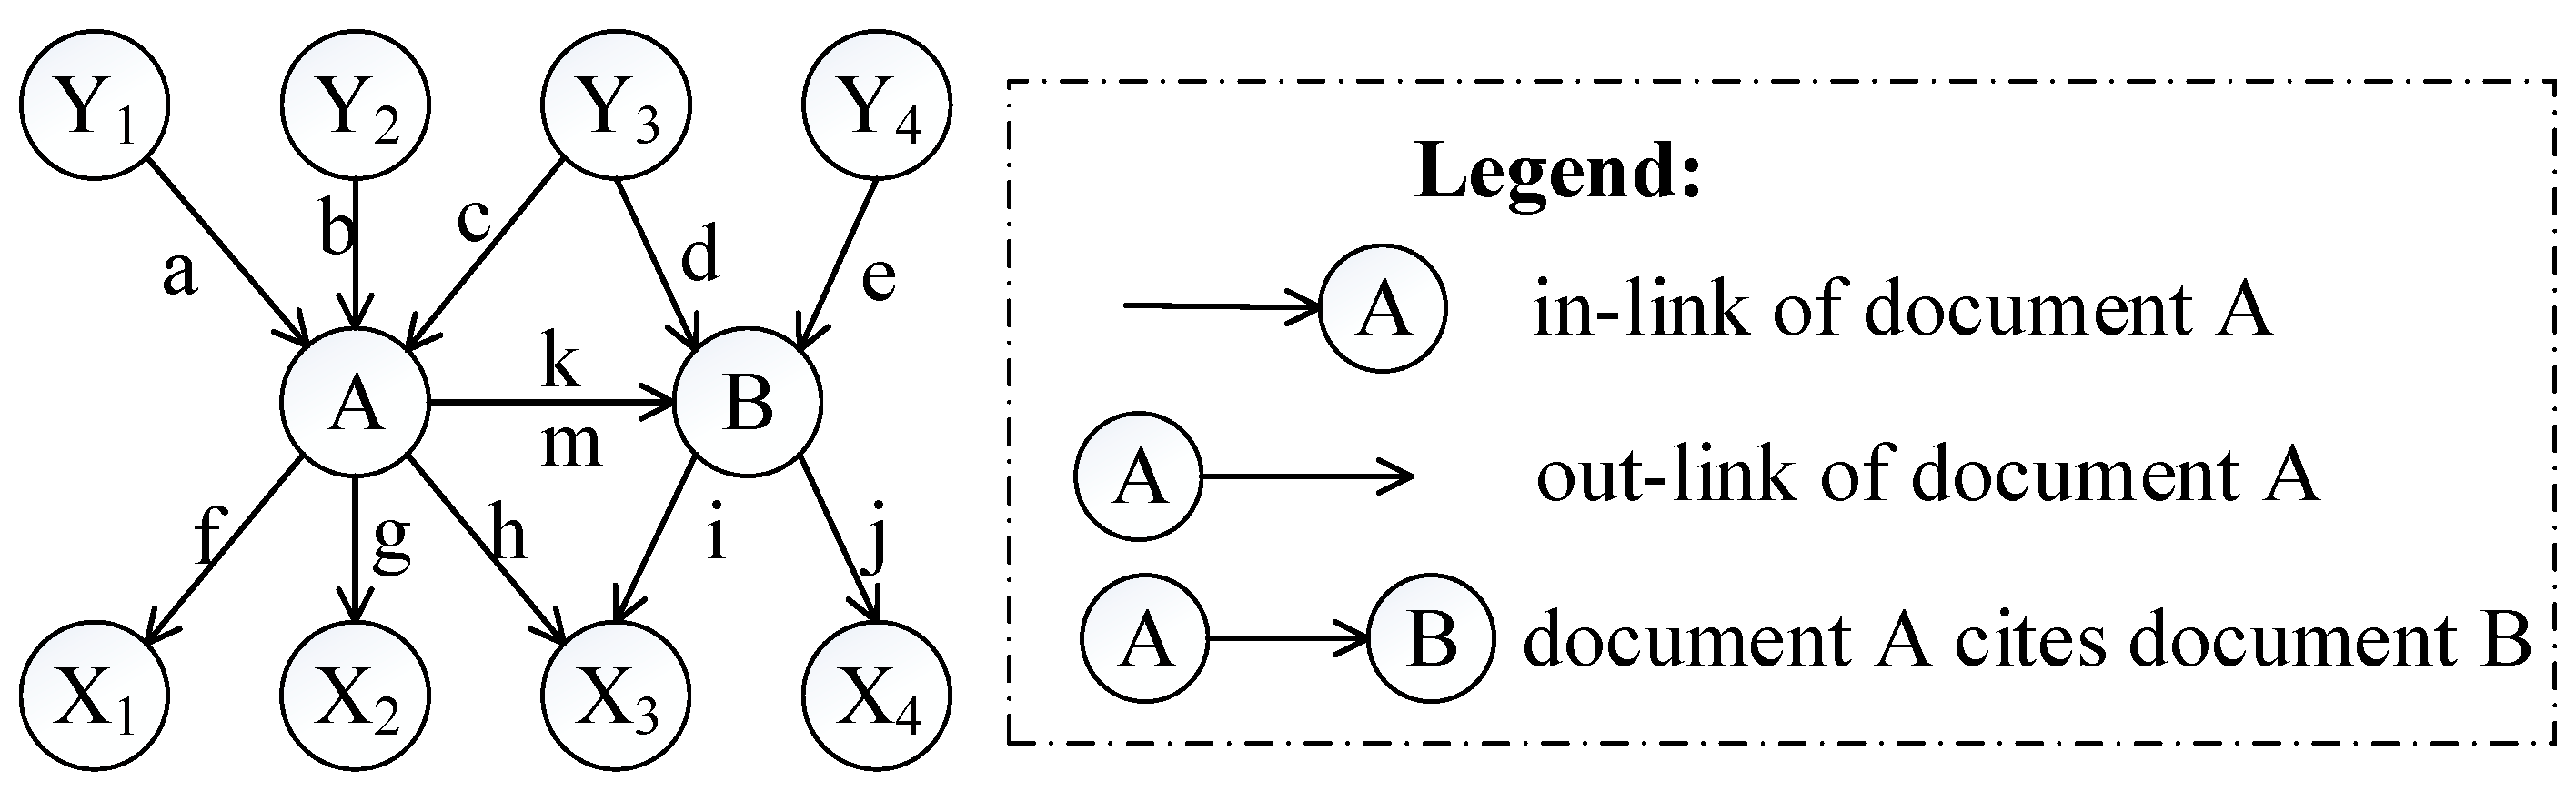
Nin(A/B)in-degree of documents A or B, which equals the number of scientific documents that cite documents A or B
Nout(A/B)out-degree of documents A or B, which equals the number of scientific documents that are cited by documents A or B
Ncluster(B)number of scientific documents that are cited by document B and belong to the same cluster with document B
Nci(p,q)number of citations between clusters q and p
H(var)function that returns the value of variable var if var is not equal to zero, otherwise it returns positive infinity.
Hin(A,B)function that returns Nin(A) if document B cites document A, returns Nin(B) if document A cites document B, and returns positive infinity if documents A and B have no direct citation relationship
Hout(A,B)function that returns Nout(A) if document A cites document B, returns Nout(B) if document B cites document A, and returns positive infinity if documents A and B have no direct citation relationship
Sco(A,B)similarity between documents A and B based on relative co-citation [25]
Sbi(A,B)similarity between documents A and B based on relative bibliographic coupling [25]
S(A,B)similarity between documents A and B based on the traditional approach that combines relative co-citation and bibliographic coupling [10]
S c o ( A , B ) similarity between documents A and B based on extended co-citation
S b i ( A , B ) similarity between documents A and B based on extended bibliographic coupling
S ( A , B ) similarity between documents A and B based on our proposed approach
Scluster(p,q)similarity between clusters p and q
F(p,x)enhanced frequency of keyword x in the cluster p, which is based on our proposed approach
δ(A,x)binary parameter, with 1 representing that document A contains keyword x, and 0 otherwise

3.2. Scientific Document Clustering

Co-citation and bibliographic coupling analyses are widely used for document clustering [4,6,8]. In particular, relative co-citation and bibliographic coupling [25] are some of the most popular analyses of co-citation and bibliographic coupling, respectively. The mathematical expressions of relative co-citation and bibliographic coupling [25] are shown in Equations (1) and (2), respectively.
S c o ( A , B ) = | C c i t e ( A ) C c i t e ( B ) | | C c i t e ( A ) C c i t e ( B ) | ,
S b i ( A , B ) = | C c i t e d ( A ) C c i t e d ( B ) | | C c i t e d ( A ) C c i t e d ( B ) | .
According to Equation (1), relative co-citation means that the greater the number of documents that cite both documents A and B, or the fewer the number of documents that cite either documents A or B, the greater the similarity between documents A and B. This is the same for the relative bibliographic coupling according to Equation (2).
However, there are some limitations of relative co-citation and bibliographic coupling. For example, relative co-citation and bibliographic coupling cannot distinguish whether document A cites or is cited by document B. Therefore, based on the graph theory [9], we expanded the relative co-citation and bibliographic coupling. As a result, the similarity between documents A and B would be greater if they also have a direct citation relationship. Equations (3) and (4) show the mathematical expressions of the extended co-citation and bibliographic coupling, respectively.
S c o ( A , B ) = 1 2 ( | C c i t e ( A ) C c i t e ( B ) | N i n ( A ) + | C c i t e ( A ) C c i t e ( B ) | N i n ( B ) + 1 H i n ( A , B ) ) ,
S b i ( A , B ) = 1 2 ( | C c i t e d ( A ) C c i t e d ( B ) | N o u t ( A ) + | C c i t e d ( A ) C c i t e d ( B ) | N o u t ( B ) + 1 H o u t ( A , B ) ) .
In addition, because of the time lapse of a scientific document to be cited, co-citation analysis performs well in old documents’ clustering but performs poorly in current documents’ clustering, while bibliographic coupling does the opposite [6]. Therefore, Bichteler and Iii [10] combined relative co-citation and bibliographic coupling. Equations (5) and (6) show the mathematical expressions for document clustering based on the traditional approach [10] and our proposed approach, respectively.
S ( A , B ) = | ( C c i t e ( A ) C c i t e d ( A ) ) ( C c i t e ( B ) C c i t e d ( B ) ) | | ( C c i t e ( A ) C c i t e d ( A ) ) ( C c i t e ( B ) C c i t e d ( B ) ) | ,
S ( A , B ) = | C c i t e ( A ) C c i t e ( B ) | H ( N i n ( A ) ) + | C c i t e ( A ) C c i t e ( B ) | H ( N i n ( B ) ) + | C c i t e d ( A ) C c i t e d ( B ) | H ( N o u t ( A ) ) + | C c i t e d ( A ) C c i t e d ( B ) | H ( N o u t ( B ) ) + 1 H i n ( A , B ) + 1 H o u t ( A , B ) N i n ( A ) H ( N i n ( A ) ) + N o u t ( A ) H ( N i n ( B ) ) + N i n ( B ) H ( N o u t ( A ) ) + N o u t ( B ) H ( N o u t ( B ) ) .
To distinguish the difference among the approaches mentioned above, Figure 1 shows an illustrative example of the computing measures in Equations (1)–(6). According to the definition of relative co-citation (Equation (1)), the similarity between documents A and B is 1/5, because the number of documents which cite both of documents A and B is one (i.e., document Y3), and the number of documents which cite either document A or document B is five (i.e., documents Y1, Y2, Y3, Y4, and A). According to the definition of relative bibliographic coupling (Equation (2)), the similarity between documents A and B is 1/5, because the number of documents which are cited by both documents A and B is one (i.e., document X3), and the number of documents which are cited by either document A or document B is five (i.e., documents X1, X2, X3, X4, and B). According to the definition of the approach that combines relative co-citation and bibliographic coupling (Equation (5)), the similarity between documents A and B is 2/10, because the number of documents that cite or are cited by both documents A and B is two (i.e., documents Y3 and X3), and the number of documents that cite or are cited by either document A or document B is 10 (i.e., documents Y1, Y2, Y3, Y4, X1, X2, X3, X4, A, and B).
In this study, we assumed that each strength of links a, b, and c was 1/3; each strength of links d, e, and k was 1/3; each strength of links f, g, h, and m was 1/4; and each strength of links i and j was 1/2. Therefore, each sum strength of document A’s in-links, document B’s in-links, document A’s out-links, and document B’s out-links equalled 1. Though both of links k and m represented that document A cited document B, it was assumed that their strengths were different in this study (link k was document B’s in-link and link m was document A’s out-link). Therefore, according to the definition of extended co-citation (Equation (3)), the similarity between documents A and B was 1/2, because the sum strength of links c, k, and d was 1/3 + 1/3 + 1/3 = 1, and the sum strength of in-links of documents A and B was 1/3 + 1/3 + 1/3 + 1/3 + 1/3 + 1/3 = 2 (i.e. links a, b, c, k, d, and e). According to the definition of extended bibliographic coupling (Equation (4)), the similarity between documents A and B was 1/2, because the sum strength of links h, m, and i was 1/4 + 1/4 + 1/2 = 1, and the sum strength of out-links of documents A and B was 1/4 + 1/4 + 1/4 + 1/4 + 1/2 + 1/2 = 2 (i.e., links f, g, h, m, i, and j). According to the definition of our proposed approach (Equation (6)), the similarity between documents A and B was 2/4, because the sum strength of links c, k, d, h, m, and i was 1/3 + 1/3 + 1/3 + 1/4 + 1/4 + 1/2 = 2, and the sum strength of all of links corresponding to documents A and B was 1/3+ 1/3 +1/3 + 1/3 + 1/3 + 1/4 + 1/4 + 1/4 + 1/2 + 1/2 + 1/3 + 1/4 = 4 (i.e., links a, b, c, d, e, f, g, h, i, j, k, and m).
In addition, Table 1 lists the comparisons among relative co-citation, relative bibliographic coupling, extended co-citation, extended bibliographic coupling, the traditional approach that combines relative co-citation and bibliographic coupling, and our proposed approach with four illustrative examples. Each number in Table 1 represents the similarity between documents A and B. Therefore, the bigger the number is, the higher the similarity between documents A and B is. The topological structures of the document graphs show that the similarities between documents A and B in the second example should be higher than those in the first example, and the similarities between documents A and B in the fourth example should be higher than those in the third example, because documents A and B in the second and fourth examples not only had co-citation and bibliographic coupling relationships, but also had direct citation relationships. In addition, the topological structures of the document graphs show that the similarities between documents A and B in the first example should be higher than those in the third example, and the similarities between documents A and B in the second example should be higher than those in the fourth example, because documents A and B in the first and second examples had fewer documents which cite or are cited by either document A or document B. However, only the extended co-citation, the extended bibliographic coupling, and the proposed approach distinguished these situations. This shows that the extended co-citation, the extended bibliographic coupling, and the proposed approach revealed the similarities between scientific documents more accurately than relative co-citation, relative bibliographic coupling, and the traditional approach in these situations, respectively. Therefore, the proposed approach was used to calculate similarities between scientific documents in this study.
In addition, before calculating the similarities between scientific documents based on our proposed approach, we divided them into several time windows according to their year of publication and the length of the time window.

3.3. Clustering Theme Detection

In this study, we considered different scientific documents to have different important roles in the cluster. In other words, the more important a scientific document in the cluster was, the greater the possibility that it was cited by the other documents in the same cluster. Therefore, the traditional approach that simply counts the frequency of keywords in the cluster as the clustering theme cannot address this challenge. Therefore, our proposed method of research front detection and topic evolution combines the PageRank algorithm and keywords’ frequency for clustering theme detection.
First, we used the PageRank algorithm to rank scientific documents according to their topological structure in the cluster. The mathematical expression of the PageRank algorithm [18] used in this study is shown in Equation (7).
P ( A ) = 1 d N A + d B P ( B ) N c l u s t e r ( B ) .
In Equation (7), document B is the scientific document that cites document A and belongs to the same cluster as document A. We set the initial rank value of each document in the cluster according to Equation (8).
P ( A ) = 1 N A .
According to the definition of the PageRank algorithm used in this study, a scientific document’s PageRank value was influenced by the other scientific documents’ PageRank values in the same cluster, but was not influenced by the scientific documents’ PageRank values in the different clusters. Therefore, it was meaningless to compare scientific documents’ PageRank values in different clusters. For example, we could not determine which was more important, document A or document B, if document A’s PageRank value was higher than document B’s PageRank value but they belong to different clusters.
We then enhanced the keywords’ frequency with documents’ rank value in the cluster, which is shown in Equation (9).
F ( p , x ) = A | p | δ ( A , x ) P ( A ) ,
where document A belongs to the cluster p. The top three most frequent keywords in the cluster were considered a clustering theme. Therefore, even though there may exist two terms that appear in the same number of scientific documents in the same cluster, the term with higher PageRank value would be more likely to be selected as the cluster’s theme. In addition, some researchers have removed some terms to enhance the representativeness of keywords. For example, Boyack et al. [26] did not consider the terms whose inverse document frequency score were below 1.5 in their BM25 method. Dehdarirad et al. [27] removed any keywords which were unrelated to the topic, such as countries. In this study, to distinguish the difference between clusters and make the clustering theme more accurate, some frequent but meaningless terms such as “algorithm,” “model,” “method,” and so on, needed to be removed. Therefore, we firstly normalized the keywords. For example, “algorithm” and “algorithms” were regarded as the same term. Then we calculated the keywords’ frequency in the case study, and obtained a keywords’ frequency list. The top six most frequent keywords were “data mining” (contained in 7375 scientific documents), “classification” (contained in 2007 scientific documents), “algorithm” (contained in 1639 scientific documents), “model” (contained in 1372 scientific documents), “system” (contained in 1207 scientific documents), and “association rule” (contained in 878 scientific documents). Therefore, we removed the terms which were contained in more than 5% of the scientific documents in the study (i.e., the terms which were contained in more than 950 scientific documents).

3.4. Research front Detection and Topic Evolution

In this study, only the top three largest clusters in each time window or the clusters that contained more than 100 scientific documents were considered. Then, we reconstructed the cluster graph, where clusters were regarded as nodes, citations in different clusters were regarded as edges, and the similarities between different clusters were regarded as edges’ strengths. In addition, self-edges did not exist in the reconstructed cluster graph, because we ignored the citations in the same cluster. We calculated the similarities between different clusters according to Equation (10).
S c l u s t e r ( p , q ) = N c i ( p , q ) 1 2 ( | p | + | q | ) .
Finally, we divided the edges in the reconstructed cluster graph into three levels, including strong connection, common connection, and weak connection, according to their strengths. As a result, we could identify the research front and topic evolution based on the reconstructed cluster graph.

4. Case Study and Experiments
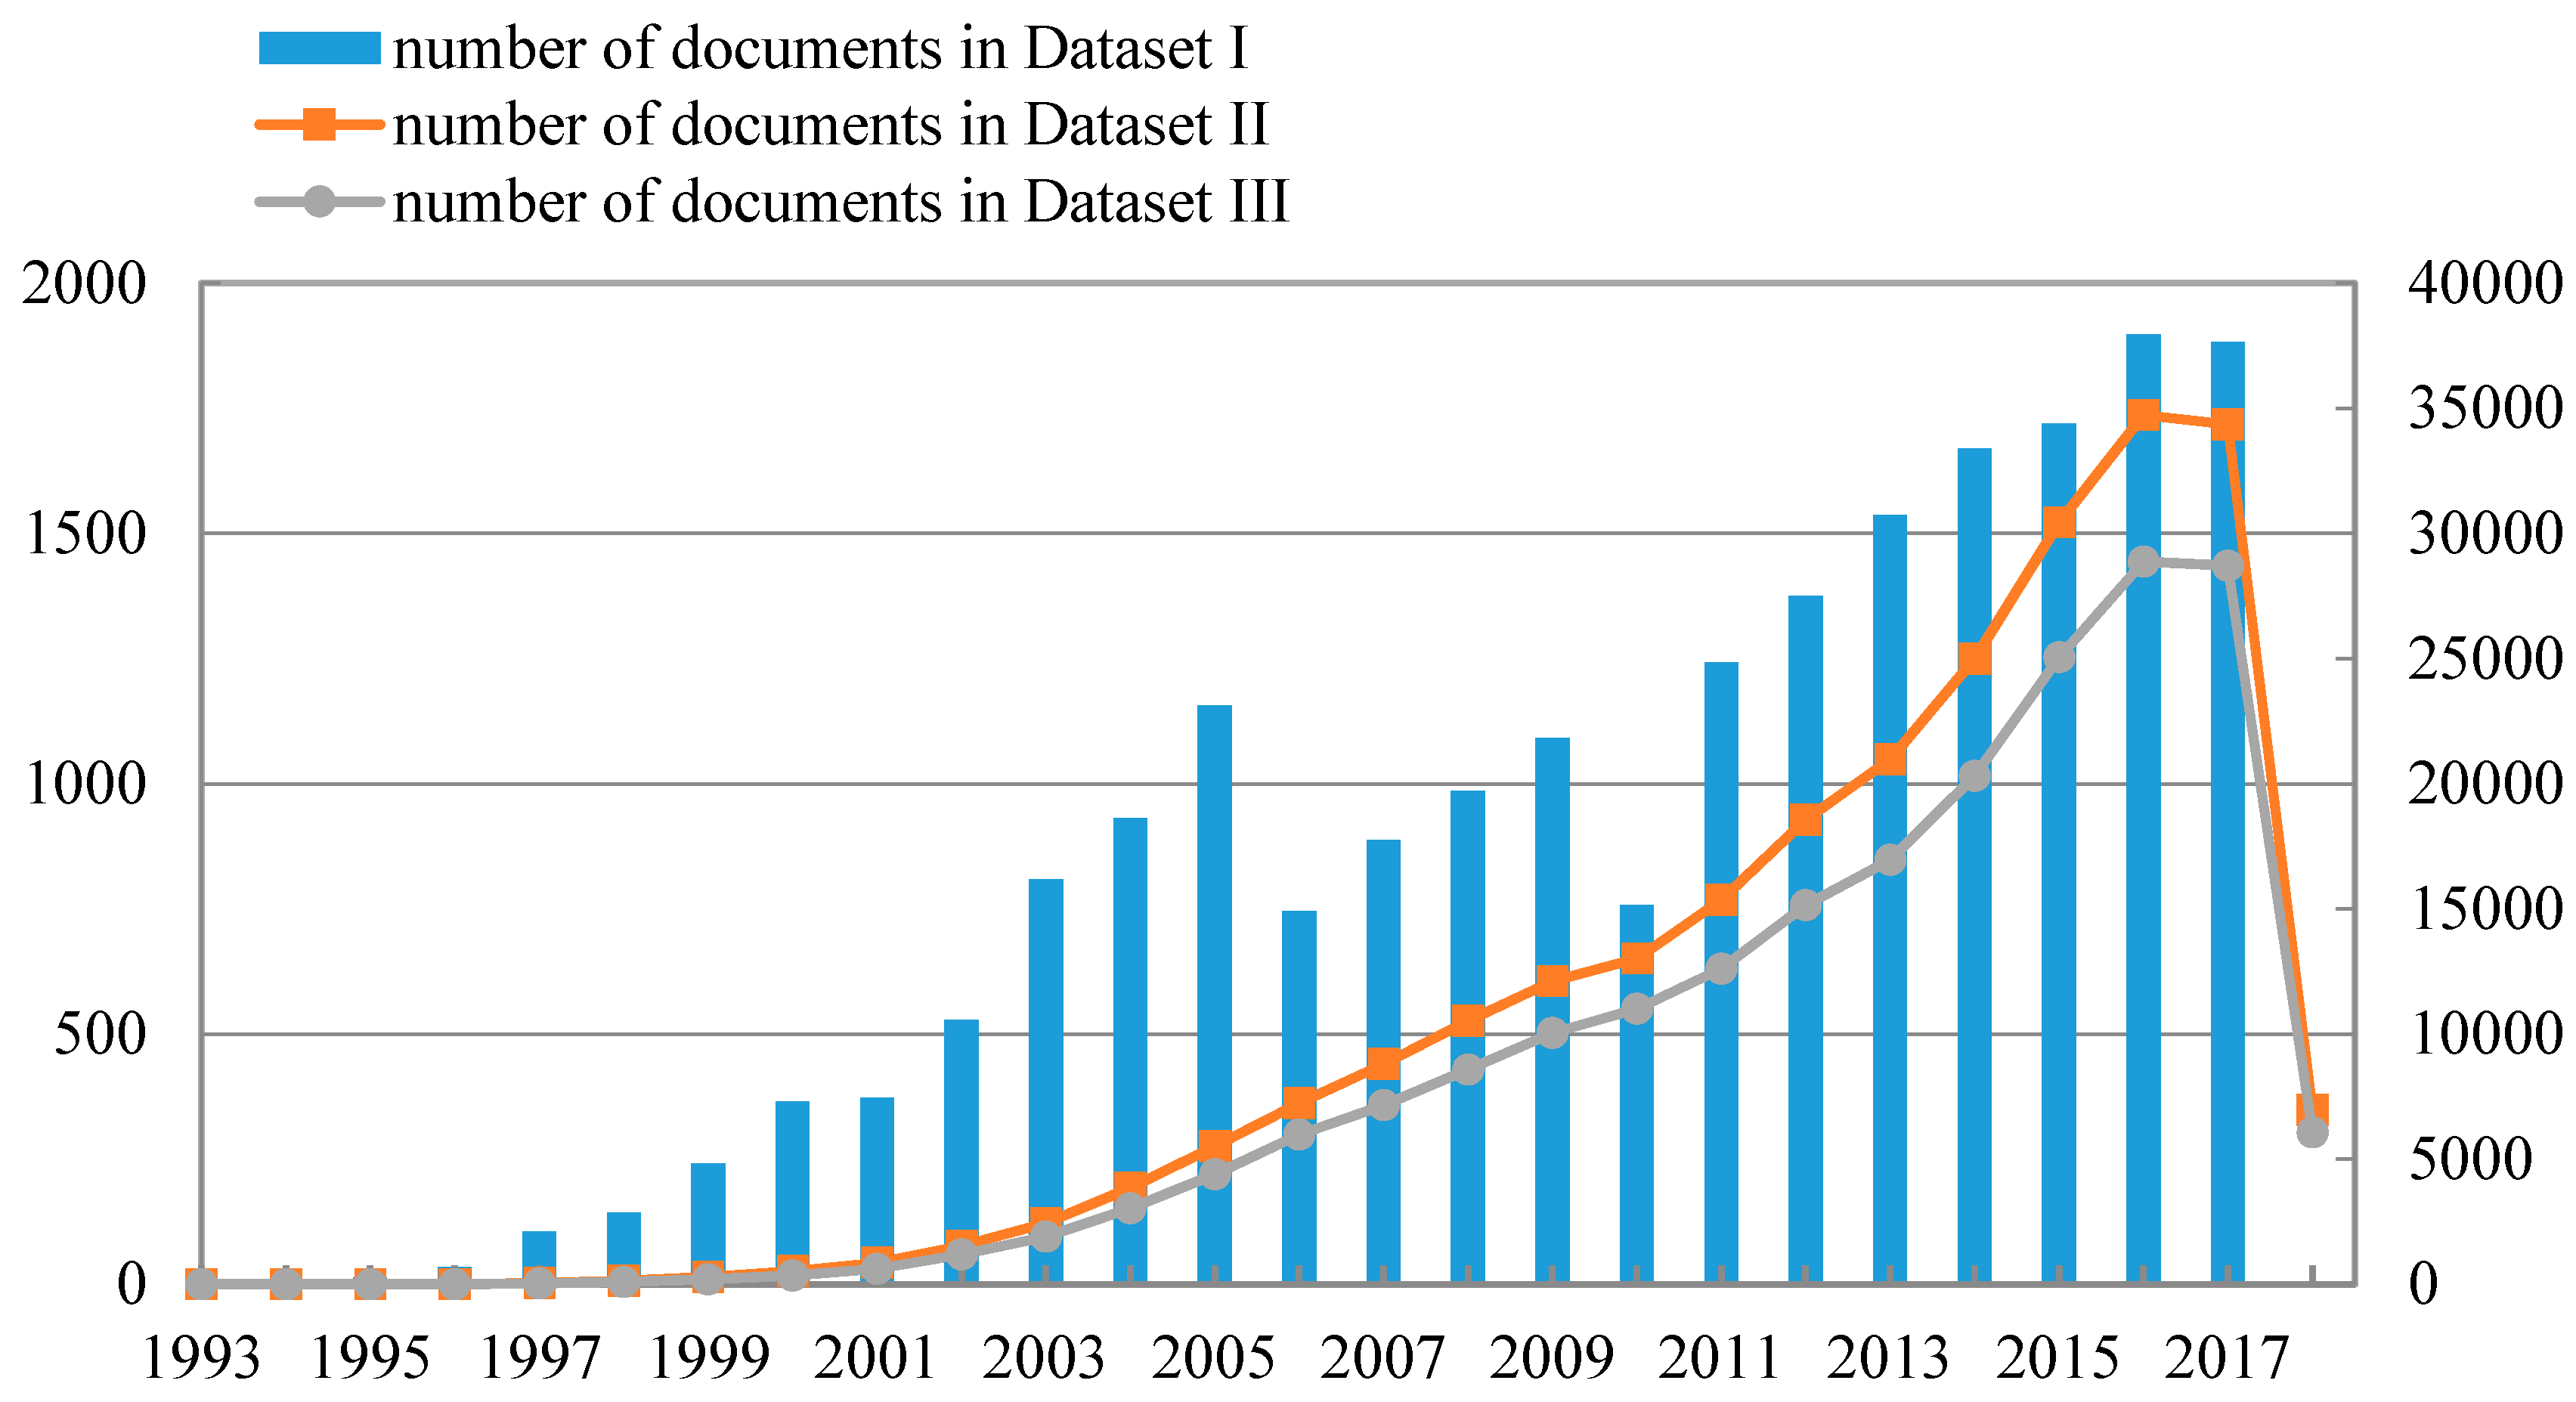
4.1. Dataset

In this study, the data mining related scientific documents covered by Science Citation Index Expanded (SCI-EXPANDED) or Social Science Citation Index (SSCI) were collected as our case study. We collected these documents in Web of Science by typing “data mining” as the subject on 22 March 2018. The retrieval results showed that the first scientific document was published in 1993. Therefore, the related scientific documents in the last 25 years (1993–2017) were downloaded and they contained 20,502 data mining-related documents. To identify their topological structure, especially their in-degree, more accurately, the scientific documents that cited the documents in the case study were also downloaded from Web of Science, which contained 253,302 documents. To distinguish different datasets in this study, we defined Dataset I as the collection of scientific documents related to data mining, Dataset II as the collection of scientific documents that cited the documents in Dataset I, and Dataset III as the collection of scientific documents in Dataset II but not in Dataset I.
Figure 2 shows the number of documents in Dataset I per year from 1993 to 2017, the number of documents in Dataset II per year from 1993 to 2018 (until 22 March 2018), and the number of documents in Dataset III per year from 1993 to 2018 (until 22 March 2018). The left ordinate scale refers to the values of bar graph, and the right ordinate scale refers to the values of line charts. According to Figure 2, data mining has increasingly become a hotspot of research and attracted much attention in recent years. It is meaningful to detect research front and identify topic evolution in the data mining field, which will help researchers, especially the novice researchers, to understand the data mining field better.

4.2. Data Preprocessing

In this study, we used C# to extract the citation relationships between scientific documents, which included direct citation, co-citation, and bibliographic coupling. Then, we removed the isolated scientific documents in Dataset I, which did not have any citation relationship with other documents in Dataset I. Finally, we collected 515,653 scientific documents, including 19,005 scientific documents in Dataset I, and 496,648 scientific documents that cite or were cited by the documents in Dataset I but were not included in this dataset. In addition, we upload the data used in this study on figshare.com (https://doi.org/10.6084/m9.figshare.7665785) to facilitate experimental verification.
We divided scientific documents in Dataset I into several time windows according to their year of publication and length of time window t before document clustering. Moreover, when t was set as 3 years, we found that there were only eight documents in Dataset I in the time window from 1993 to 1995. The number of the documents in this time window was too small to cluster. Therefore, we combined them with the documents in the time window from 1996 to 1998.

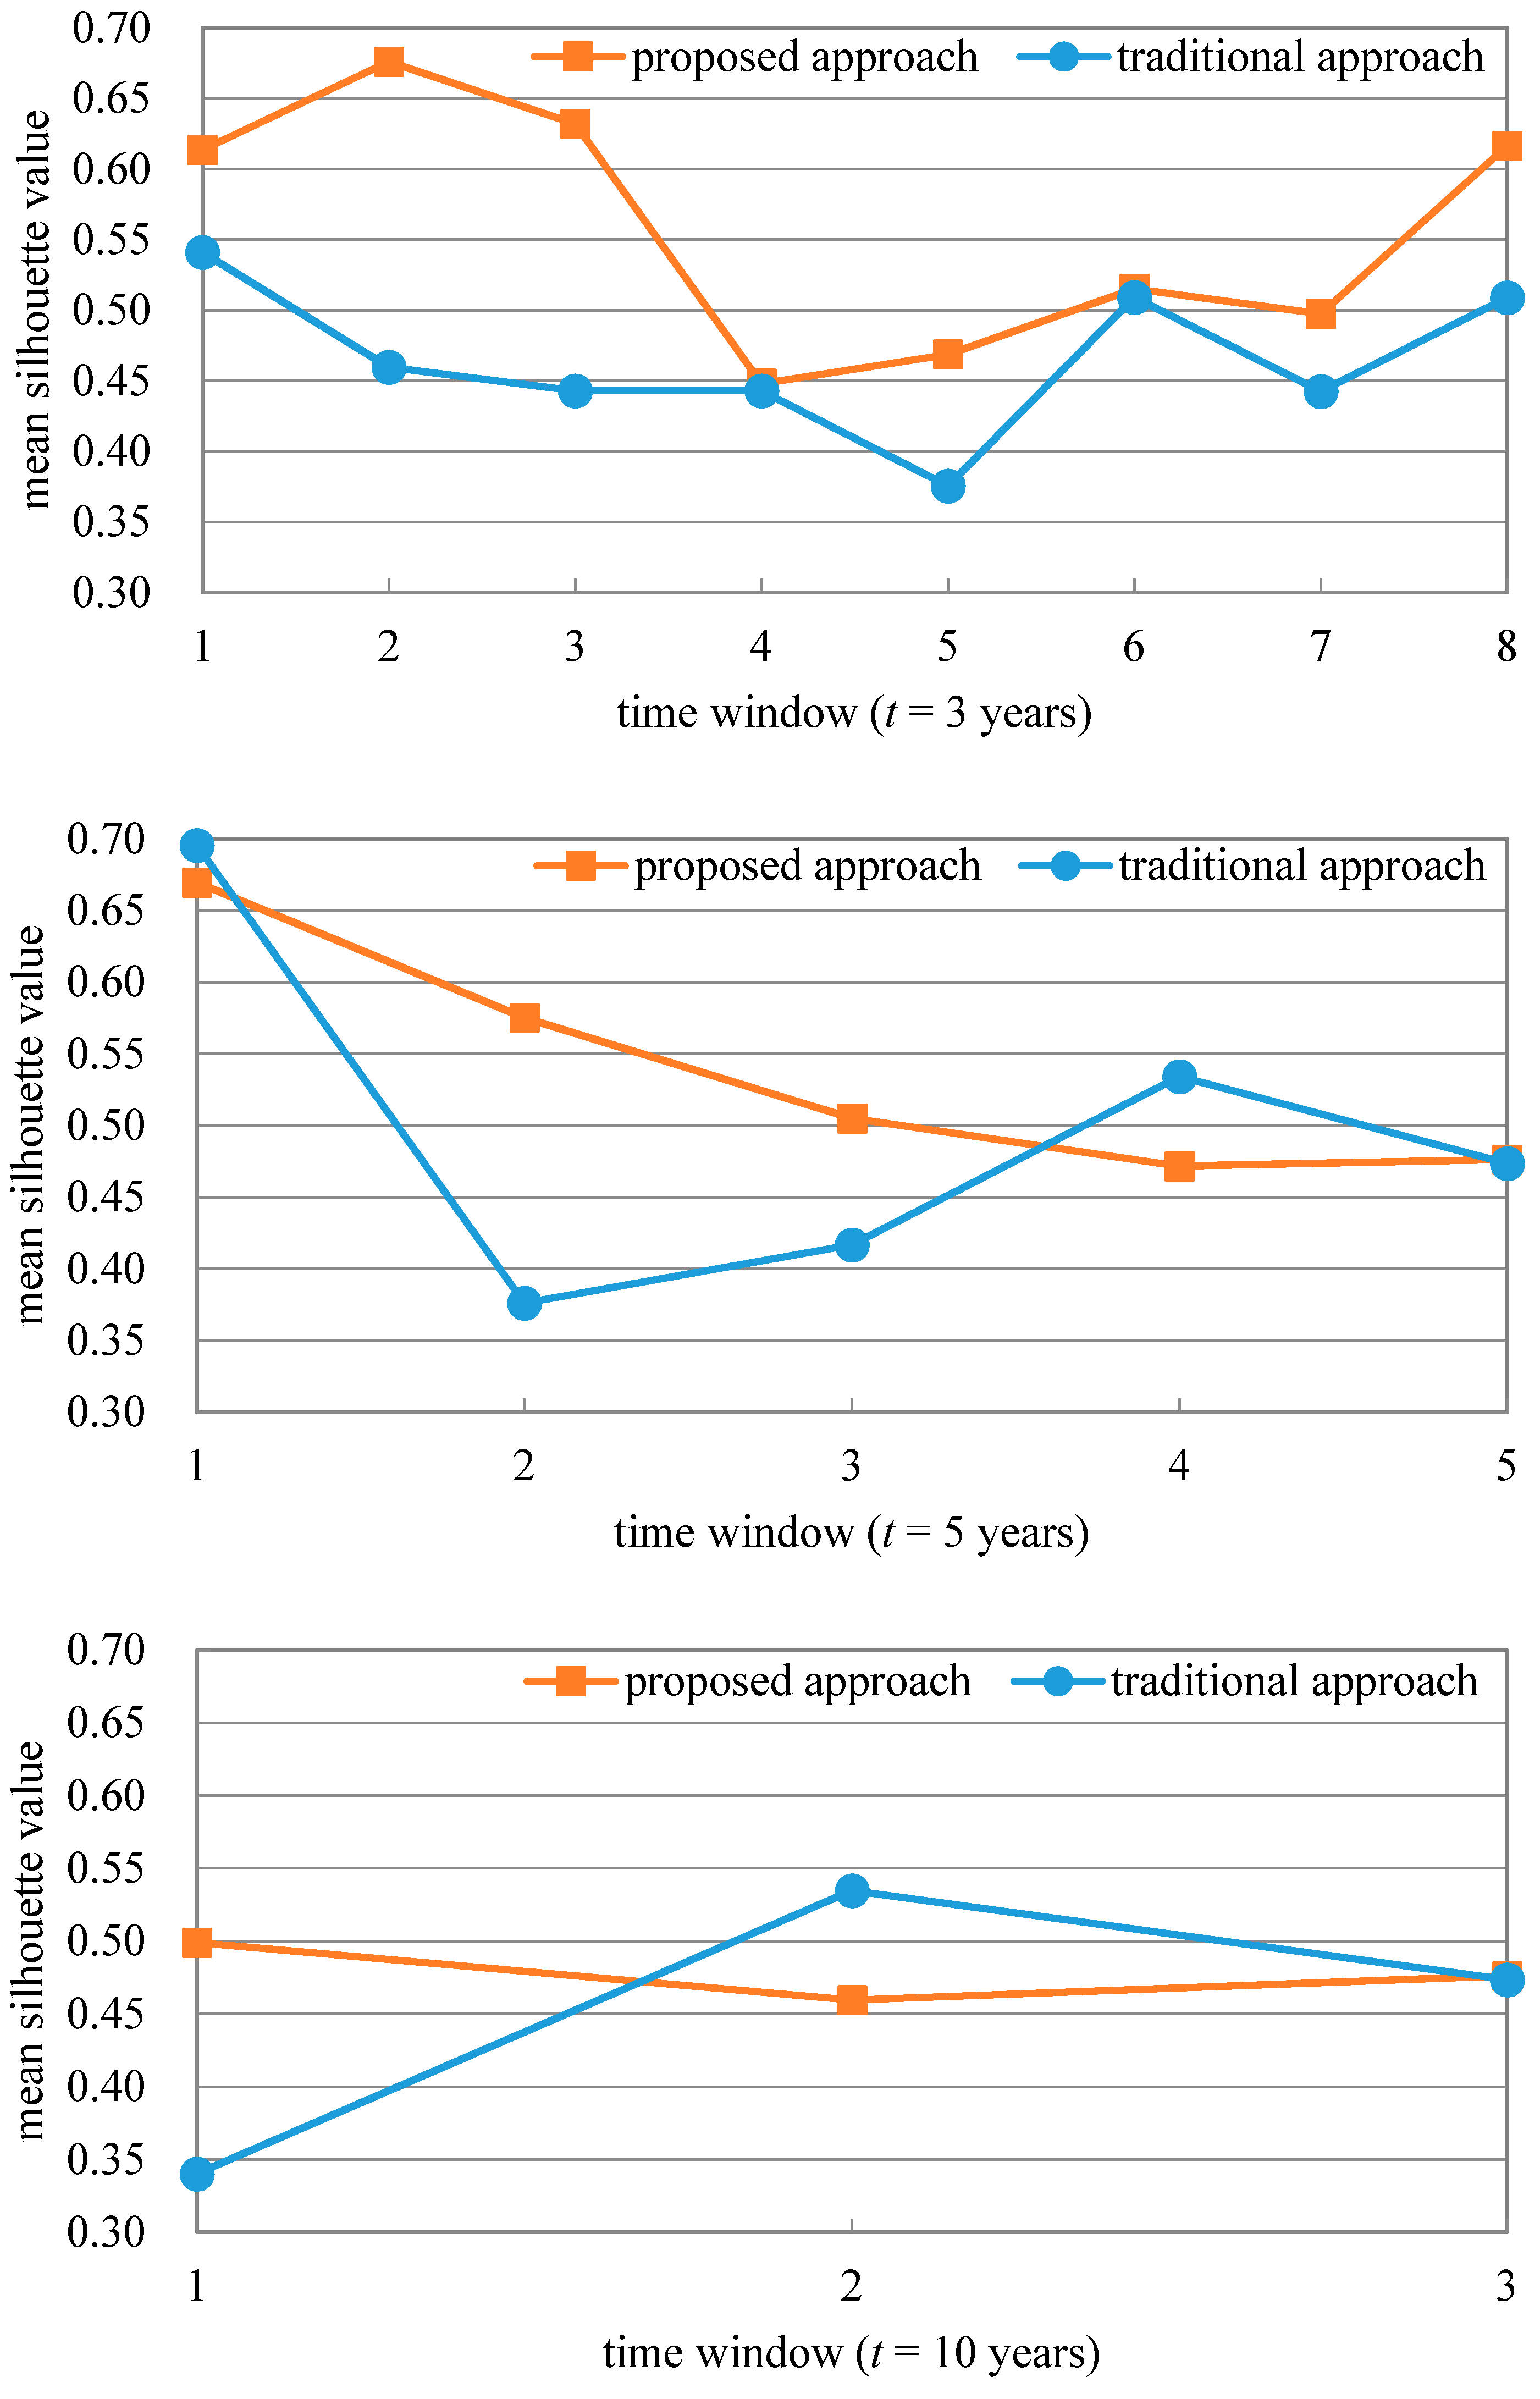
4.3. Experimental Design and Evaluation Index

The fast-greedy algorithm in the R programming software package was used to cluster scientific documents in this work. The PageRank algorithm was implemented in C# by the authors to rank the importance of scientific documents in the cluster. All of our experiments were supported by a personal computer with Windows 7 64-bit, 1.60 GHz Intel (R) Core CPU and 4 GB RAM.
In addition, silhouette coefficient, which was proposed by Rousseeuw [28], has been widely used to evaluate clustering results [29,30]. In this study, we employed the mean silhouette value to evaluate the clustering results, which depended on the similarities between one document and both of the other documents in the same cluster and that in the most similar cluster. The mean silhouette value in each time window equaled the arithmetic means of corresponding documents’ silhouette values. The mathematical expression of the silhouette value of document A based on the silhouette coefficient is shown in Equation (11).
S V A = M A 1 M A 2 max ( M A 1 , M A 2 ) ,
where SVA represents the silhouette value of document A; M A 1 represents the mean similarity between document A and the scientific documents in the same cluster; and M A 2 represents the mean similarity between document A and the scientific documents in the cluster which is most similar to the cluster that contains document A. Moreover, M A 2 is calculated according to Equation (12).
M A 2 = max p N p { 1 | p | B | p | H s ( A , B ) } ,
where Np represents the number of clusters in the time window which contains document A, and Hs(A,B) represents the similarity function between documents A and B, which returns S ( A , B ) if documents are clustered based on our proposed approach, and returns S(A,B) if documents are clustered based on the traditional approach [10]. In Equation (12), documents A and B belong to different clusters.

4.4. Experiment Results

In this sub-section, we compare the performance of our proposed approach and that of the traditional approach for scientific documents clustering, determine the length of time window, detect the clustering theme in each time window, visualize topic evolution in the data mining field, and prove the effectiveness of our proposed approach.

4.4.1. Scientific Document Clustering

Figure 3 shows the comparison of document clustering results based on our proposed approach and the traditional approach, respectively. The x-axis represents the time window. For example, “2” in the x-axis represents the second time window, which ranged from 1999 to 2001 when t equaled three years; ranged from 1998 to 2002 when t equaled five years; and ranged from 2003 to 2012 when t equaled 10 years. According to Figure 3, when t was set as three years, all of the mean silhouette values based on our proposed approach were higher than those based on the traditional approach, and the highest mean silhouette value based on our proposed approach was about 20% higher than those based on the traditional approach. When t was set as five years, most of the mean silhouette values based on our proposed approach were higher than those based on the traditional approach, and the lowest mean silhouette value based on our proposed approach was about 28% higher than those based on the traditional approach, as was similar as the situation when t was set as 10 years. The comparison results show that our proposed approach was effective for document clustering.
Figure 3 shows that the mean silhouette values corresponding to a three or five-year time window were higher than those corresponding to a ten-year time window. A time window with appropriate length t should be determined by considering not only the accuracy of scientific document clustering results but also the time delay of a document to be cited. Therefore, to further determine the most suitable time window length t between three and five years we revealed the relationship between the number of documents (cumulative percentage of documents) and the published time interval between the documents and their corresponding references, which are shown in Figure 4. It was found that half of scientific documents were cited within five years since they were published, while only about one third of scientific documents were cited within three years since they were published. Therefore, we eventually determined the length of time window as a five-year one in this study.

4.4.2. Clustering Theme Detection

We combined the PageRank algorithm with keywords’ frequency to detect the clustering theme, and regarded the top three most frequent keywords in the cluster as the clustering theme. However, due to the limited space, Table 2 shows the partial clustering themes as illustrative examples, with a time window ranging from 2013 to 2017. The number of scientific documents in this time window was 8201. The complete clustering themes with all of time windows are listed in Table A1 in the Appendix. According to Table 2, in recent years, as many as a quarter of the studies in the data mining field combined social network and big data, and focused on clustering analysis (Cluster 1); some studies use data mining technology in bioinformatics field (Cluster 3); some studies focus on using the rule of association to discover the information hidden in data (Cluster 4); some studies focus on educational data mining (Cluster 6); some studies focus on uncertainty research (Cluster 7); and some studies focus on privacy in big data (Cluster 8). Studies in both Clusters 2 and 5 focus on prediction analysis. However, studies in Cluster 2 mainly elaborate on support vector machine and neural network, while studies in Cluster 5 mainly elaborate on the decision tree. The experiment’s results show that our proposed approach could obtain reasonable clustering results.

4.4.3. Research front Detection and Topic Evolution

After detecting clustering themes, we reconstructed the cluster graph, where nodes represented clusters, edges’ strengths represented the similarities between different clusters, and we ignored the citations in the same cluster. We then removed the edges that contained fewer than five citations or whose strengths were lower than 0.2. Finally, we reconstructed the cluster graph with 26 nodes and 45 edges.
In this study, we divided the edges in the cluster graph into three levels, including strong connection (edge’s strength is greater than 0.5), common connection (edge’s strength ranges from 0.3 to 0.5), and weak connection (edge’s strength is lower than 0.3). Due to the limited space, Figure 5 shows the evolution of the topics on support vector machine, prediction, and neural network (Cluster 2 listed in Table 2). The complete evolution of the topics on clusters in recent time windows is shown in Figure A1 in the Appendix. In addition, to visualize the topic evolution more clearly, we ignored the 16 edges between clusters that were not in the adjacent time window because almost all of these connections were weak.
In Figure 5, the numbers in each cluster circle represents the properties of the corresponding cluster (i.e., the first number represents the corresponding time window and the second number represents the size ranking of the cluster in the time window). For example, “5,2” in one cluster circle represents the second largest cluster (Cluster 2) in the fifth time window (i.e., from 2013 to 2017).
Figure 5 shows that topics about prediction algorithms, such as support vector machines and neural networks, mainly developed from topics about prediction algorithms such as the support vector machine and the decision tree (the circle labeled “4,2”). The experiment’s results show that our proposed approach was an effective approach for research front detection and topic evolution.
In addition, Figure 5 shows the topic evolution from the perspective of one of the clusters in a recent time window. Therefore, we could reveal the history of this clustering theme. We could also identify the topic evolution from the reconstructed graph by selecting the cluster in the initial time window or intermediate time window. As a result, we could reveal the development of the clustering theme. However, due to the limited space, we do not discuss the topic evolution from these perspectives.

5. Conclusions and Future Work

Through this study, we aimed to detect research front and identify topic evolution. We noticed that there were some limitations in relative co-citation and bibliographic coupling in revealing the similarities between documents. Moreover, we acknowledge that different scientific documents have different important roles in the cluster. For instance, some scientific documents are core documents while some scientific documents are marginal documents. Therefore, we proposed a new research front detection and topic evolution approach based on topological structure and the PageRank algorithm. Further, we reconstructed the cluster graph whose nodes represent clusters and edges’ strengths represent the similarities between different clusters. As a result, we could detect the research front and identify topic evolution according to the reconstructed cluster graph. To evaluate the performance of our proposed approach, scientific documents related to data mining in Web of Science were collected as a case study, and the mean silhouette value was selected as evaluation index for clustering results. The experiment’s results proved that our proposed approach could obtain reasonable clustering results, and that this was an effective approach for research front detection and topic evolution.
However, there were still some limitations in this study, which need to be addressed in future work. For example, we removed some documents in the data preprocessing stage because their information downloaded from Web of Science was incomplete. Due to the limited space, we only applied the traditional PageRank algorithm to calculate the importance of documents. However, the PageRank algorithm relies on the topological structure of scientific documents in the same cluster, which is not very effective in the small-size cluster. Therefore, extending the PageRank algorithm to fit various citation networks better is also one of our future research directions. In addition, the other measure, such as term frequency–inverse document frequency, can be integrated with the present keywords frequency method and the PageRank algorithm to detect clustering more accurately.

Author Contributions

Y.X. conceived the idea of the paper and wrote the paper; S.Z., W.Z., and S.Y. reviewed and revised the paper; Y.S. performed the experiments.

Funding

This research was funded by National Natural Science Foundation of China (No. 51875503, No. 51475410).

Acknowledgments

The authors would like to thank the editors and anonymous reviewers for their helpful comments and suggestions. This research was funded by National Natural Science Foundation of China (No. 51875503, No. 51475410).

Conflicts of Interest

The authors declare no conflicts of interest.

Appendix A

Table A1. Clustering themes in each time window.
Time WindowCluster (Size)Clustering Theme
1993–1997Cluster 1 (35)Neural network; uncertainty; prediction
Cluster 2 (31)Association rule; knowledge discovery; clustering
Cluster 3 (19)Knowledge discovery; machine learning; rule
1998–2002Cluster 1 (325)Protein; identification; neural network
Cluster 2 (207)Neural network; knowledge discovery; decision tree
Cluster 3 (163)Neural network; machine learning; genetic algorithm
Cluster 4 (151)Knowledge discovery; rough set; machine learning
Cluster 5 (146)Association rule; knowledge discovery; pattern
Cluster 6 (136)Decision tree; machine learning; knowledge discovery
2003–2007Cluster 1 (1597)Clustering analysis; bioinformatics; gene expression
Cluster 2 (747)Decision tree; machine learning; neural network
Cluster 3 (373)Association rule; sequential pattern; knowledge discovery
Cluster 4 (344)Association rule; knowledge discovery; frequent itemset
Cluster 5 (303)Rough set; feature selection; genetic algorithm
Cluster 6 (224)Sequential pattern; association rule; knowledge discovery
Cluster 7 (115)Knowledge discovery; prediction; neural network
2008–2012Cluster 1 (1830)Clustering analysis; identification; bioinformatics
Cluster 2 (1617)Support vector machine; decision tree; prediction
Cluster 3 (566)Association rule; pattern; knowledge discovery
Cluster 4 (232)Privacy; security; k-anonymity
Cluster 5 (200)Sequential pattern; association rule; knowledge discovery
2013–2017Cluster 1 (2117)Clustering analysis; social network; big data
Cluster 2 (1750)Support vector machine; prediction; neural network
Cluster 3 (1544)Identification; gene expression; bioinformatics
Cluster 4 (930)Association rule; sequential pattern; knowledge discovery
Cluster 5 (517)Machine learning; prediction; decision tree
Cluster 6 (460)Prediction; educational data mining; design
Cluster 7 (249)Rough set; attribute reduction; approximation
Cluster 8 (189)Differential privacy; k-anonymity; big data
Figure A1. The complete evolution of the topics of clusters in recent time window.
Symmetry 11 00310 g0a1

References

  1. Chen, C. Citespace II: Detecting and visualizing emerging trends and transient patterns in scientific literature. J. Am. Soc. Inf. Sci. Technol. 2006, 57, 359–377. [Google Scholar] [CrossRef]
  2. Wu, Y.; Jin, X.; Xue, Y.Z. Evaluation of research topic evolution in psychiatry using co-word analysis. Medicine 2017, 96, e7349. [Google Scholar] [CrossRef] [PubMed]
  3. Liu, X.; Jiang, T.; Ma, F. Collective dynamics in knowledge networks: Emerging trends analysis. J. Informetrics 2013, 7, 425–438. [Google Scholar] [CrossRef]
  4. Fujita, K.; Kajikawa, Y.; Mori, J.; Sakata, I. Detecting research fronts using different types of weighted citation networks. J. Eng. Technol. Manag. 2014, 32, 129–146. [Google Scholar] [CrossRef]
  5. Chen, B.; Tsutsui, S.; Ding, Y.; Ma, F. Understanding the topic evolution in a scientific domain: An exploratory study for the field of information retrieval. J. Informetr. 2017, 11, 1175–1189. [Google Scholar] [CrossRef]
  6. Boyack, K.W.; Klavans, R. Co-citation analysis, bibliographic coupling, and direct citation: Which citation approach represents the research front most accurately? J. Assoc. Inf. Sci. Technol. 2010, 61, 2389–2404. [Google Scholar] [CrossRef]
  7. Glänzel, W.; Thijs, B. Using ‘core documents’ for detecting and labelling new emerging topics. Scientometrics 2012, 91, 399–416. [Google Scholar] [CrossRef]
  8. Yu, D.J.; Wang, W.R.; Zhang, S.; Zhang, W.Y.; Liu, R.Y. Hybrid self-optimized clustering model based on citation links and textual features to detect research topics. PLoS ONE 2017, 12, e0187164. [Google Scholar] [CrossRef] [PubMed]
  9. Zhang, W.; Wang, X.G.; Zhao, D.L.; Tang, X.O. Graph degree linkage: Agglomerative clustering on a directed graph. In Proceedings of the 12th European Conference on Computer Vision, Florence, Italy, 7–13 October 2012; pp. 428–441. [Google Scholar]
  10. Bichteler, J.; Iii, E.A.E. The combined use of bibliographic coupling and cocitation for document retrieval. J. Am. Soc. Inf. Sci. 1980, 31, 278–282. [Google Scholar] [CrossRef]
  11. Shubankar, K.; Singh, A.P.; Pudi, V. A frequent keyword-set based algorithm for topic modeling and clustering of research papers. In Proceedings of the 3rd Conference on Data Mining and Optimization, Putrajaya, Malaysia, 28–29 June 2011; pp. 96–102. [Google Scholar]
  12. Blei, D.M.; Ng, A.Y.; Jordan, M.I. Latent dirichlet allocation. J. Mach. Learn. Res. 2003, 3, 993–1022. [Google Scholar]
  13. Kim, J.; Lee, E. Understanding review expertise of developers: A reviewer recommendation approach based on latent dirichlet allocation. Symmetry Basel 2018, 10, 114. [Google Scholar] [CrossRef]
  14. Kim, M.; Gupta, B.B.; Rho, S. Crowdsourcing based scientific issue tracking with topic analysis. Appl. Soft Comput. 2018, 66, 506–511. [Google Scholar] [CrossRef]
  15. Qiao, S.; Han, A. A way to construct evolution model of scientific papers based on the seed document and OLDA models. In Proceedings of the 2013 International Conference on Mechatronic Science, Electric Engineering and Computer, Shenyang, China, 20–22 December 2013; pp. 900–903. [Google Scholar]
  16. Morris, S.A.; Yen, G.; Wu, Z.; Asnake, B. Time line visualization of research fronts. J. Am. Soc. Inf. Sci. Technol. 2003, 54, 413–422. [Google Scholar] [CrossRef]
  17. Clauset, A.; Newman, M.E.; Moore, C. Finding community structure in very large networks. Phys. Rev. E 2004, 70, 066111. [Google Scholar] [CrossRef] [PubMed] [Green Version]
  18. Brin, S.; Page, L. The anatomy of a large-scale hypertextual web search engine. Comput. Netw. ISDN Syst. 1998, 30, 107–117. [Google Scholar] [CrossRef]
  19. Girvan, M.; Newman, M.E.J. Community structure in social and biological networks. Proc. Natl. Acad. Sci. USA 2002, 99, 7821–7826. [Google Scholar] [CrossRef] [PubMed] [Green Version]
  20. Newman, M.E.J. Fast algorithm for detecting community structure in networks. Phys. Rev. E 2004, 69, 066133. [Google Scholar] [CrossRef] [PubMed] [Green Version]
  21. dos Santos, C.K.; Evsukoff, A.G.; de Lima, B.S.L.P. Cluster analysis in document networks. In Proceedings of the Conference on Data Mining Protection, Univ Cadiz, Cadiz, Spain, 26–28 May 2008; pp. 95–104. [Google Scholar]
  22. Chen, P.; Xie, H.; Maslov, S.; Redner, S. Finding scientific gems with google’s PageRank algorithm. J. Informetr. 2007, 1, 8–15. [Google Scholar] [CrossRef]
  23. Nykl, M.; Campr, M.; Jezek, K. Author ranking based on personalized PageRank. J. Informetr. 2015, 9, 777–799. [Google Scholar] [CrossRef]
  24. Yu, D.J.; Wang, W.R.; Zhang, S.; Zhang, W.Y.; Liu, R.Y. A multiple-link, mutually reinforced journal-ranking model to measure the prestige of journals. Scientometrics 2017, 111, 521–542. [Google Scholar] [CrossRef]
  25. Egghe, L.; Rousseau, R. Co-citation, bibliographic coupling and a characterization of lattice citation networks. Scientometrics 2002, 55, 349–361. [Google Scholar] [CrossRef]
  26. Boyack, K.W.; Newman, D.; Duhon, R.J.; Klavans, R.; Patek, M.; Biberstine, J.R. Clustering more than two million biomedical publications: Comparing the accuracies of nine text-based similarity approaches. PLoS ONE 2011, 6, e18029. [Google Scholar] [CrossRef] [PubMed]
  27. Dehdarirad, T.; Villarroya, A.; Barrios, M. Research trends in gender differences in higher education and science: A co-word analysis. Scientometrics 2014, 101, 273–290. [Google Scholar] [CrossRef]
  28. Rousseeuw, P.J. Silhouettes: A graphical aid to the interpretation and validation of cluster analysis. J. Comput. Appl. Math. 1987, 20, 53–65. [Google Scholar] [CrossRef] [Green Version]
  29. Janssens, F.; Glänzel, W.; Moor, B.D. A hybrid mapping of information science. Scientometrics 2008, 75, 607–631. [Google Scholar] [CrossRef]
  30. Bafna, P.; Pramod, D.; Vaidya, A. Document clustering: TF-IDF approach. In Proceedings of the International Conference on Electrical, Electronics, and Optimization Techniques, Palnchur, India, 3–5 March 2016; pp. 61–66. [Google Scholar]
Figure 1. An illustrative example of different clustering approaches.
Symmetry 11 00310 g001
Figure 2. Number of documents in Dataset I, Dataset II, and Dataset III, respectively.
Symmetry 11 00310 g002
Figure 3. Mean silhouette value of document clustering based on our proposed approach and the traditional approach, with different time window lengths t.
Symmetry 11 00310 g003
Figure 4. Relationship between the number of documents (cumulative percentage of documents) and the published time interval between the documents and their corresponding references.
Symmetry 11 00310 g004
Figure 5. Evolution of the topics in the second largest cluster with a time window from 2013 to 2017.
Symmetry 11 00310 g005
Table 1. Similarities between documents A and B with different approaches.
ExampleRelative Co-CitationRelative Bibliographic CouplingExtended Co-CitationExtended Bibliographic CouplingTraditional ApproachOur Proposed Approach
(1) Symmetry 11 00310 i0011/31/31/21/21/31/2
(2) Symmetry 11 00310 i0021/41/47/127/121/47/12
(3) Symmetry 11 00310 i0031/41/45/125/121/45/12
(4) Symmetry 11 00310 i0041/51/51/21/21/51/2
Notes: The circle represents a scientific document and the arrow represents citation direction. For example, document Y1 cites document A in the first example.
Table 2. Clustering themes with time window from 2013 to 2017.
Cluster (Size)Clustering Theme
Cluster 1 (2117)Clustering analysis; social network; big data
Cluster 2 (1750)Support vector machine; prediction; neural network
Cluster 3 (1544)Identification; Gene expression; Bioinformatics
Cluster 4 (930)Association rule; sequential pattern; knowledge discovery
Cluster 5 (517)Machine learning; prediction; decision tree
Cluster 6 (460)Prediction; educational data mining; design
Cluster 7 (249)Rough set; attribute reduction; approximation
Cluster 8 (189)Differential privacy; k-anonymity; big data

