From Theory to Practice: A Data Quality Framework for Classification Tasks


1
Grupo de Ingeniería Telemática, Universidad del Cauca, Campus Tulcán, 190002 Popayán, Colombia
2
Departamento de Informática, Universidad Carlos III de Madrid, Avenida de la Universidad, 30, 28911 Leganés, Spain
3
Grupo de Ingeniería Telemática, Universidad del Cauca, Campus Tulcán, 190002 Popayán, Colombia
*
Author to whom correspondence should be addressed.
†
These authors contributed equally to this work.
Symmetry 2018, 10(7), 248; https://doi.org/10.3390/sym10070248
Submission received: 26 April 2018
/
Revised: 29 May 2018
/
Accepted: 29 May 2018
/
Published: 1 July 2018
Abstract
:The data preprocessing is an essential step in knowledge discovery projects. The experts affirm that preprocessing tasks take between 50% to 70% of the total time of the knowledge discovery process. In this sense, several authors consider the data cleaning as one of the most cumbersome and critical tasks. Failure to provide high data quality in the preprocessing stage will significantly reduce the accuracy of any data analytic project. In this paper, we propose a framework to address the data quality issues in classification tasks DQF4CT. Our approach is composed of: (i) a conceptual framework to provide the user guidance on how to deal with data problems in classification tasks; and (ii) an ontology that represents the knowledge in data cleaning and suggests the proper data cleaning approaches. We presented two case studies through real datasets: physical activity monitoring (PAM) and occupancy detection of an office room (OD). With the aim of evaluating our proposal, the cleaned datasets by DQF4CT were used to train the same algorithms used in classification tasks by the authors of PAM and OD. Additionally, we evaluated DQF4CT through datasets of the Repository of Machine Learning Databases of the University of California, Irvine (UCI). In addition, 84% of the results achieved by the models of the datasets cleaned by DQF4CT are better than the models of the datasets authors.
1. Introduction
The digital information era is an inevitable trend. Recently, advances in Information Technologies (Telecommunications, smartphone applications, Internet of Things, etc.) have generated a deluge of digital data [1,2].
Recently, the IT divisions of enterprises are centered on taking advantage of the significant amount of data to extract useful knowledge and supporting decision-making [3,4]. These benefits facilitate the growth of organizational locations, strategies, and customers. Decision-makers can utilize the more readily available data to maximize customer satisfaction and profits, and predict potential opportunities and risks. In all cases to achieve it, the data quality (DQ) must be guaranteed. Data quality is directly related to the perceived or established purposes of the data. High-quality data meets expectations to a greater extent than low-quality data [5].
Thus, to guarantee data quality (DQ), before extracting knowledge from data, a preprocessing phase must be considered. The experts affirm that the preprocessing phase takes 50% to 70% of the total time of the knowledge discovery process [6].
Several data mining tools based on methodologies as Knowledge Discovery in Databases (KDD) [7] or Cross Industry Standard Process for Data Mining (CRISP-DM) [8] offer algorithms for data pre processing: graphical environments such as Waikato Environment for Knowledge Analysis (WEKA) [9], RapidMiner [10], KNIME [11] and script mathematical tools such as MATLAB [12], R [13], Octave [14]. However, these data mining tools do not offer a standard guided process for data cleaning [15].
To tackle the aforementioned problems, we proposed a Data Quality Framework For Classification Tasks (DQF4CT) through (i) a conceptual framework to provide the user a guidance of how deal data quality issues in classification tasks and (ii) an ontology that represents the knowledge in data cleaning and suggests the suitable data cleaning approaches. The rest of the paper is organized as follows: Section 2 discusses several definitions of DQ frameworks and ontologies. The related works are presented in Section 3. DQF4CT is explained in Section 4; Section 5 presents results and Section 6 provides conclusions and future works.
2. Background
In this section, we briefly review the concepts that were employed for building DQF4CT:
2.1. Data Quality Framework
Data are representations of the perception of the real world and the basis of information and digital knowledge [16]. In this context, from the data quality field, there exist two factors to define the perception and consumers needs: how well it meets the expectations of data consumers [17] and how well it represents the objects, events, and concepts of the real world. To measure whether data meets expectations or is “fit for use”, both need to be defined through metrics as consistency, completeness, etc. [5].
For ensuring data quality in Data Management Systems (DMS), we need to consider two relevant aspects: the actual quality of the data source and the expected quality by the users [18].
The Data Quality Frameworks (DQF) are used for assessing, analyzing and using clean data with poor quality in DMS. These DMS are relevant because they drive profitability tasks or processes within an organization [19,20]. The structure of DQF can go beyond the individual elements of quality assessment, and the DQF must provide a general scheme to analyze and solve data quality problems [21].
2.2. Data Quality Ontology
In artificial intelligence communities, the ontologies are widely used and have many definitions; Gruber [22] provided a popular one: an ontology is an “explicit specification of a conceptualization”. The conceptualization represents a specific world view on the domain of interest [23] and it is composed of concepts, attributes, instances and relations between concepts.
From Data Quality (DQ), an ontology is created for three main reasons: (1) model the knowledge about DQ concepts as well as about domain concepts and their relationships to each other, (2) modularize the knowledge and make it reusable, and (3) use the ontology as a configuration in an automatic process of evaluating DQ [24].
We propose Data Cleaning Ontology for modeling the data quality issues in classification tasks and the data cleaning algorithms to solve these DQ problems. First, the scope of data quality issues is evaluated and second data cleaning algorithms are recommended.
3. Related Work
This section presents a review of the current literature around the two major topic areas. The first section covers related works of frameworks in data quality. The second section concerns related works of ontologies for data cleaning.
3.1. Data Quality Frameworks
Several studies provided data quality frameworks in relational databases, conceptual, health systems and enterprise service bus (ESB). Table 1 presents the data quality issues found in the related works.
A number of works built data quality frameworks for relational databases.The work of [25] is focused on assessing the integrity constraints. In case of [18], the authors proposed an extension of the Common Warehouse Metamodel, which stores cleansing methods for eliminating duplicates, handling inconsistencies, managing imprecise data, missing data, and data freshness. In [26], the authors offers a data cleansing process: data transformation, duplicate elimination and data fusion. is a framework for data profiling [27]. The authors in [28] built a framework for management of an enterprise data warehouse based on an object-oriented data quality model, from dimensions: relevance, consistency, currency, usability, correctness and completeness. The work in [29] proposes a big data pre-processing quality framework. It deals with data quality issues as: data type, data format, and domain.
From health systems, data quality frameworks are built. For instance, the authors of [30] proposed a DQ framework for matching the records from multiples sources of electronic medical record data. The authors in [31] proposed a framework for cloud-based health care systems. The aim is to gather electronic health records from different sources. The work of [32] proposed a framework of procedures for data quality assurance in medical registries; they address data quality problems as illegible handwriting, incompleteness, and unsuitable data format.
Other researchers design data quality conceptual frameworks. The work presented in [36] develops a framework as a basis for organizational databases considering domain information as operation and assurance costs, and personnel management. The authors of [33] monitored the content in an e-government meta-data repository, using syntactic, semantic and pragmatic data quality metrics. Similarly, the authors of [34] designed a framework for Government Data based on three DQ issues: missing values, lack of meta-data, and timeliness. The authors [35] have identified relationships amongst four data quality dimensions: consistency, timeliness, accuracy and completeness. A qualitative approach was conducted applying 37 surveys. Factor analysis and Cronbach-alpha test were applied to interpret the results. A data quality framework for manage resources in Enterprise Service Bus (ESB) is built in [38]. The framework measures data quality coming from different sensors and selects the most suitable data source among all available data sources, in respect to the data quality metrics: accuracy, trueness, completeness, timeliness, and consistency.
Finally, the authors in [15] built a conceptual framework based on data quality issues mentioned in data mining methodologies such as CRISP-DM [8], SEMMA [39], KDD [7] and the Data Science Process [40]. Subsequently, the same authors [37] designed a data cleaning process in regression models.
We observed a large diversity of data quality frameworks used in the literature designed mainly for health systems, data warehouses, relational databases, and enterprise service buses; however, the related works are not concentrated in classification models. In addition, these works lack:
- A user-oriented process to address DQ issues: high dimensionality, imbalanced classes, outliers, duplicate instances, mislabeled instances and missing values.
- Recommendations of the suitable data cleaning algorithm/approach to address data quality issues.
3.2. Data Cleaning Ontologies
Similarly to literature review presented in Section 3.1, we found data cleaning ontologies from relational databases, health systems, and others’ domain applications. Table 2 shows the data quality issues addressed by the ontologies.
Different data cleaning ontologies were found in the literature. [41] design an ontology that selects data cleaning algorithms respect to the user’s goal. The selected algorithm is applied to DB based on the results produced from queries on ontology. The authors of [42] designed a model to represent data cleaning operations, enabling their reuse in different databases. The model is composed of an orthogonal cleaning ontology and domain ontologies. Rule Mining for Automatic Ontology Based Data Cleaning is proposed in [43]. This consists of checking tuples for correctness. When invalid tuples are being detected, they have to be modified using valid tuples stored in their ontology. The work in [44] contains a method for dealing with semantic heterogeneity during the process of data cleaning, which is the difference of terminologies in distinct data sources. They are based on linguistic knowledge provided by a domain ontology in order to generate some correspondence assertions between tuples. These assertions are used during the integration of the data.
Other data cleaning ontologies were used to support health systems. In [45], health care data quality literature was mined for the important terms used to describe the ontology. Four high-level data quality dimensions were defined: Correctness, Consistency, Completeness and Currency. In [46], an ontology for patient clinical records was built to assess uniqueness, existence and consistency. They are supported in domain ontology to analyze relations as a doctor cannot be treated himself as a patient.
From other domains, the data cleaning ontologies are also used for the construction of reservoir models [48], selection of features in datasets related to cancer [47], and preparation of genotype–phenotype relationships in a familial hypercholesterolemia dataset [49].
The related works presented above conduct data cleaning ontologies from databases; however, they do not focus on data quality issues for classification tasks, while the remaining research is focused on solving data quality issues in a specific domain. Thus, in Section 4.2, we propose an ontology for data cleaning in classification tasks.
4. Data Quality Framework for Classification Tasks
In this section, we describe the proposed data quality framework (DQF4CT). Our approach is defined by (i) a conceptual framework to provide the user with guidance on how to deal with data problems in classification tasks; and (ii) an ontology that represents the knowledge in data cleaning and suggests the proper data cleaning approaches. Below, we expose each of these components.
4.1. Conceptual Framework
We build the conceptual framework to address poor quality data in classification tasks of data mining and machine learning projects from epistemological, and methodological perspectives taking into account the philosophy, definitions, and procedures proposed by [50]. The epistemological concept defines “how things are” and “how things work” in an assumed reality, and the methodological concept exposes the process of building the conceptual framework and assessing what it can tell us about the “real” world [51]. Next, each phase of procedures is explained.
The proposed conceptual framework was developed to address poor quality data in classification tasks of data mining and machine learning projects. To construct the conceptual framework, we adapted the methodology [50] following the next steps:
4.1.1. Mapping the Selected Data Sources
The primary goal of this step is identify the data quality issues presented in classification tasks. This process includes review text types and other sources of data, such as research papers, standards or methodologies. From data mining, we find four relevant methodologies. Table 3 shows the data quality issues found in data mining methodologies.
High dimensionality, duplicate instances, outliers, missing values and noise were the data quality issues found in the methodologies mentioned in Table 3. Furthermore, we built a literature review [52] with the aim of finding DQ issues in classification tasks. We analyzed four digital libraries: IEEE Xplore, Science Direct, Springer Link, and Google Scholar. Table 4 shows the papers found by data quality issue and digital library:
4.1.2. Understanding the Selected Data
In this phase, we present the definitions of DQ issues found for classification tasks:
- Missing values: refers to missed of values of an attribute, and typically occurs due to faults in the process of data recollection, e.g, data transfer problems, sensor faults, incompleteness in surveys, etc. [55].
- Inconsistency: refers to duplicate instances with different class labels [63].
- Redundancy: in classification tasks, this is referred to as duplicate records [63].
- Amount of data: corresponds to the total of available data for training a classifier [63]; this DQ issue is highly related with high dimensionality. Large datasets with a high number of features can generate high dimensionality, while small datasets can build inaccurate models.
- Heterogeneity: defined as data incompatibility of a variable. This occurs when data from different sources are joined [64].
4.1.3. Identifying and Categorizing Components
In this phase, we organize and categorize the DQ issues with respect to their meaning. Thus, we concluded:
- Inconsistency, Redundancy and Timeliness were renamed as Mislabelled class, Duplicate instances and Data obsolescence, respectively.
- According to the Noise definition “irrelevant or meaningless data”, we considered as kinds of Noise: Missing values, Outliers, High dimensionality, Imbalanced class, Mislabelled class and Duplicate instances.
- We redefined Amount of data as lack of information due to the poor process of data collection.
- The amount of data, Heterogeneity and Data obsolescence are issues of the recollection data process. Therefore, these data quality issues were classified in a new category called Provenance, defined by the Oxford English Dictionary as a fact of coming from some particular source or quarter, origin, or derivation.
Figure 1 presents the classification of data quality issues. The conceptual framework is focused on solving Noise problems in the data.
4.1.4. Integrating Components
In this step, we present the data cleaning tasks to address Noise issues (Table 5). Subsequently, we analyze how to integrate the cleaning tasks.
Next, the data cleaning tasks are explained:
- Imputation: fills missing data with synthetic values. Different approaches are defined for imputing missing values: (i) Deletion: removes all instances with missing values [67]. (ii) Hot deck: missing data are filled with values from the same dataset [68]. (iii) Imputation based on missing attributes: computes a new value from measures of central tendency as median, mode, mean, etc. The computed value is used for filling the missing data. (iv) Imputation based on non-missing attributes: a classification or regression model is built from available data to fill the missing values [69].
- Dimensionality reduction: selects a subset of relevant attributes to represent the dataset [73] based on attribute importance [59,74]. Three-dimensionality reduction approaches are defined: (i) Filter: computes correlation coefficients between features and class, then it selects the features with highest correlation [74]; (ii) Wrapper: builds models with all combinations of features. The subset of features is selected based on model performance [75]; (iii) Embedded: incorporates the feature selection as part of the training process and reduces the computation time taken up for reclassifying different subsets that are done in wrapper methods [76,77].
- Label correction: are identified instances with the same values. If classes are different, the label is corrected, or the instance is removed [80].
- Remove duplicate instances: deletes duplicate records from dataset [81].
Once the data cleaning tasks are defined, we integrated them as depicted in Figure 2:
Thus, a user of the conceptual framework follow the next steps:
- A
- Check missing values in the dataset.
- B
- In case of the occurrence of missing values, the imputation task must be applied. The new data must be analyzed because the imputation methods can create outliers.
- C
- Subsequently, an outlier detection algorithm is applied with the aim to find candidate outliers in the raw dataset or generated in the previous step.
- D
- Label correction algorithm looks for mislabelled instances in the raw dataset or generated by the Imputation methods.
- E
- Verify if the dataset is imbalanced; Imbalance Ratio (IR) is used to measure the distribution of binary class:where represents the size of the majority class and the size of the minority class. A dataset with IR 1 is perfectly balanced, while datasets with a higher IR are more imbalanced [82].In case of the class having more than two labels, Normalized Entropy is used [83]. This measure indicates the degree of uniformity of the distribution of class labels, denoted bywhere is the probability that assumes the ith value , for . We suppose that each label of the class has the same probability of appearing, therefore the theoretical maximum value for the entropy of the class is . Thus, the normalized entropy can be computed as:The class is balanced when is close to 1.
- F
- If the dataset is imbalanced, then we use an algorithm for balanced of classes. This creates synthetic instances (oversampling or undersampling techniques) on the minority class.
- G
- Remove duplicate instances in the raw dataset or generated by previous data cleaning tasks.
- H
- Finally, the algorithms for dimensionality reduction are used for reducing the dimensionality of the dataset.
Our conceptual framework guides the user in the solution of data quality issues in classification tasks. In Section 4.2, we propose an ontology for representation of knowledge in data cleaning and recommendation of the suitable data cleaning approaches.
4.1.5. Validating the Conceptual Framework
We evaluated DQF4CT through UCI datasets [84]. The datasets cleaned by DQF4CT are used for training the classifiers proposed by authors of UCI datasets. Subsequently, we compare the Precision and Area Under Curve of the classifiers generated by the datasets’ authors against the classifiers of the datasets processed by DQF4CT. Additionally, we show the data cleaning process of DQF4CT in the datasets:
In Section 5, we will explain in detail the validation of the conceptual framework.
4.2. Data Cleaning Ontology
In this subsection, we describe the Data Cleaning Ontology (DCO). This one represents the knowledge in data cleaning and the rules to solve the data quality issues. From the analysis presented by [87], which compares six appropriate methodologies to build ontologies through the criteria: level of detail and associated software application, we selected METHONTOLOGY [88] as the methodology to create DCO. METHONTOLOGY defines five phases: glossary of terms, concept taxonomies, ad hoc binary relation diagrams, concept dictionary, and rules. Next, we describe the way DCO was created following the phases mentioned above.
4.2.1. Build Glossary of Terms
In this step, we identify the set of terms to be included on the Data Cleaning Ontology (their natural language definition, and their synonyms and acronyms). Table 6 presents the main classes considered.
We defined 23 subclasses of the classes given in Table 6. The taxonomies of the classes are shown below.
4.2.2. Build Concept Taxonomies
This task involves building concept taxonomies from a glossary of terms. We defined two general taxonomies from Attribute and Data Cleaning Task classes.
The class Attribute has two subclasses: Numeric: attribute with continuous values or Nominal: attribute with discrete values as shown in Figure 3.
Figure 4 exposes the Taxonomy of Data Cleaning Tasks: Imputation, Outliers Detection, Balanced Classes, Label Correction, Dimensionality Reduction, and Removing of Duplicate Instances.
Each sub-class of Data Cleaning Tasks itself has several techniques to solve the problem identified. According to Section 4.1.4, the methods used by sub-classes of the taxonomy of Data Cleaning Tasks are presented hereunder.
- Imputation is resolved through approaches: Imputation Based on Non-Missing Attributes, Deletion, Hot Deck Imputation, and Imputation Based on Missing Attributes. Figure 5 exposes the approaches that are sub-classes of Imputation tasks.
- The Outliers Detection take into account techniques based on Density or High Dimensional (see Figure 6).
- Label Correction is addressed in two ways: approaches based on Threshold or Classification algorithms. Figure 8 shows:
- Approaches as Embedded, Filter, Projection and Wrapper are used to Dimensionality Reduction. Figure 9 lists:
- Up to now, we have not found the classification of techniques of Removing of Duplicate Instances.
4.2.3. Build Ad Hoc Binary Relation Diagrams
In this task, we establish ad hoc relationships between concepts of the taxonomies. Figure 10 presents five binary relations among four classes:
- A Dataset (1..1) has Data Quality Issues (1..*).
- A Data Quality Issue (1..*) is resolved with Data Cleaning Tasks (1..*).
- A Dataset (1..1) uses Data Cleaning Tasks (1..*).
- An Attribute (1..*) is part of a Dataset (1..1).
- An Attribute (1..*) has Data Quality Issues (1..* ).
4.2.4. Build Concept Dictionary
This task builds a description of the classes as their instances and their attributes.
The Dataset class presents information related to the number of classes, instances, attributes, imbalance ratio of the classes, percentage of missing values (mv_PP), instances with percentage of missing values greater than or equal to 65% (ins_mv_65PP) and ordered. Model dependency, fast assessment describes the user preferences to build a classifier. Dataset contains 35 instances. These instances correspond to UCI datasets [84] selected to evaluate the conceptual framework.
The Nominal class has a number of discrete values or labels of an attribute while Numeric class statistical information has mean, median, minimum, maximum, standard deviation, 1st_quartile and 3rd_quartile. Instances correspond to the number of attributes per dataset from ds1_att_i to ds9_att_i where i is the i-th attribute of dataset.
The Data Quality Issue class is composed of the instances: missing values, outliers, imbalanced class, mislabeled class, duplicate instances and high-dimensional spaces.
Table 7 shows the instances of Imputation approaches. Thus, Deletion is represented by algorithms: list wise deletion, pair wise deletion, Hot Deck Imputation: last observation carried forward, Imputation Based on Missing Attributes by measures: mean, median, mode and Imputation Based on Non-Missing Attributes by regression models: linear, logistic and Bayesian.
Table 8 gathers algorithms for Outliers Detection. Density-based spatial clustering of applications with noise (dbscan), local outlier factor and ordering points to identify the clustering structure (optics) are algorithms based on Density. In High-Dimensional spaces, algorithms are used as: angle based outlier degree, grid based subspace outlier, and sub space outlier degree.
Table 9 encompasses instances of the approaches of Balanced Classes and Label Correction. Random over sampling and smote are algorithms of Over Sampling, while condensed nearest neighbor rule, edited nearest neighbor rule, neighborhood cleaning rule, one side selection, random under sampling, and tome link of the Under Sampling approach. In Label Correction, Classification algorithms such as c4.5, k nearest neighbor, support vector machine and Threshold as entropy conditional distribution and least complex correct hypothesis are commonly used.
Table 10 contains Filter, Projection and Wrapper algorithms for Dimensionality Reduction. Measures such as chi-squared test, gain ratio, information gain, Pearson correlation, and Spearman correlation belong to the Filter approach. Principal component analysis is an algorithm based on Projection, while sequential backward elimination and sequential forward selection are algorithms based on the Wrapper approach.
4.2.5. Describe Rules
We used Semantic Web Rule Language (SWRL) to create the rules of Data Cleaning Ontology. SWRL is a proposal to combine Web Ontology Language (OWL) and RuleML. The rules are expressed regarding of OWL concepts (classes, attributes, instances) and saved as part of the ontology. These include a high-level abstract syntax for Horn-like rules [89]. The rules syntax have the form: , where the antecedent and consequent are conjunctions of atoms and functions . The variables are represented through a question mark (e.g., ).
We built thirty rules for addressing the data quality issues. The rules were constructed based on literature reviews about data cleaning tasks [15,52,90,91,92,93,94]. The most representative rules are explained below. For example, the rules for selecting a suitable data cleaning approach of dimensionality reduction were built based on the work proposed by [93]. These authors proposed three scenarios for the use of dimensionality reduction approaches as shown Table 11.
Thus, the rules for Dimensionality Reduction are defined based on two criteria [59]: whether the learning algorithm to use in the classification task is defined (learning algorithm defined = Yes: 1 or Not: 0), and the computational resources for processing the dimensionality reduction algorithms (computational resources= High: 2, Limited: 1 or Low: 0). Thus, the Wrapper rule is defined:
, similarly the Embedded rule:
and the Filter rule:
In the case of the Imputation task, the Deletion rules were defined based on our experience and knowledge, for example Deletion is applied on Dataset when the instances with missing values greater than 65% (ins_mv_65PP) are less than or equal to 10% of instances of the dataset:
In addition, the Deletion approach is applied on Attribute when the missing values are greater than 50% (att_mv_50PP):
The proportion of missing data is directly related to the quality of statistical inferences. There is no established cutoff from the literature regarding an acceptable percentage of missing data in a dataset for valid statistical inferences [95]. The threshold of the Imputation rules was defined based on our knowledge and the assumption of [96], for which he asserted that a missing rate of 5% or less is inconsequential.
5. Evaluation
This section shows the evaluation of DQF4CT. The basic idea is to apply DQF4CT to datasets used by research works where the primary goal are classification tasks. We took the datasets of [86] (physical activity monitoring) and [85] (prediction of occupancy in an office room). After that, we apply DQF4CT to the datasets mentioned above (datasets without preprocessing). Subsequently, the cleaned datasets by DQF4CT are used to train the classifiers proposed by [85,86]. Finally, we compare the Accuracy of the models created with the datasets authors against the models of the datasets processed by DQF4CT. This section is organized as follows: in Section 5.1, we present the experimental dataset; in Section 5.2, we process the datasets using DQF4CT; Section 5.3 exposes the accuracy results achieved by the classifiers (the trained by original datasets versus the trained by DQF4CT).
5.1. Experimental Datasets
5.1.1. Physical Activity Monitoring
We used nine datasets for physical activity monitoring [86]. Each dataset represents one subject. The entire dataset contains 54 attributes and 2,871,916 instances related with sensors’ measurements (located at chest, hand and ankle). The class has 12 labels: walking, running, rope jumping, vacuum cleaning, ironing, standing, sitting, nordic walking, lying, cycling, ascending and descending stairs. Table 12 shows the instances by subject.
5.1.2. Occupancy Detection of an Office Room
The authors in [85] proposed a dataset for prediction of occupancy in an office room using six variables: temperature, humidity, light, humidity ratio, and the class occupancy status (0 for non-occupied, 1 for occupied). Three datasets were used, one for training (8143 instances), and two for testing the models (Test 1: 2665 instances and Test 2: 9752 ).
5.2. Evaluation Process
We applied DQF4CT for each real dataset. First, the conceptual framework is applied. Subsequently, Data Cleaning Ontology is used on each cleaning task of the conceptual framework for selecting the suitable approach. The selection of the data cleaning algorithm is based on expert knowledge.
5.2.1. Physical Activity Monitoring
Figure 11 presents the suggested process by our approach for cleaning the Physical activity monitoring (PAM) dataset. The process is explained in detail below:
Imputation: First, we observed how the missing values are distributed on the dataset. Figure 12 illustrates the frequencies of missing data patterns. The magenta color shows the missing values and the blue color non-missing data. Each row represents a missing data pattern. For example, the first row (bottom up) indicates that the heart_rate has 0.9% missing values when the remaining attributes have data. On the other hand, in the sixth row, the attributes’ temp hand, X3D accel hand, scale hand, resolution hand, X3D accel hand 2, scale hand 2, resolution hand 2, X3D giro hand 1, X3D giro hand 2, X3D giro hand 3, X3D magno hand 1, X3D magno hand 2, X3D magno hand 3, orienta hand 1, orienta hand 2, orienta hand 3, and orienta hand 4 has 0.004% missing values, while the remainder of the attributes have data.
The missing data for each subject is shown in Table 13. Datasets have around 1.83–2.10% missing values. Heart rate has the highest missing data (greater than 90%).
Following the Data Cleaning Ontology, this one suggests:
- Use Deletion approach to remove heart_rate attribute and 34 instances. We used List Wise Deletion.
- Use Imputation Based on Non-Missing Attributes on the dataset. We imputed each subject dataset with Linear and Bayesian regression.
Outliers Detection: once the values are imputed, the outliers’ detection task is applied with the aim to find erroneous imputations. Data Cleaning Ontology recommends using Density algorithms. We used the Local Outlier Factor (LOF). Table 14 shows the potential outliers for each subject. Thus, the instances with a Local Outlier Factor less than the lower limits or greater than the upper limits are considered potential outliers.
The lower and upper limits are calculated from Tukey Fences [97]; potential outliers are values below (lower limit) or above (upper limit), where and are the first and third quartiles. In Figure 13, the whiskers of the box plots represent the Tukey Fences of the Local Outlier Factor.
The candidate outliers presented in Table 14 were removed. This is noise added by imputation tasks.
Label Correction:
To correct the labels of the classes, we used Contradictory Instances Detection. The dataset has no contradictory instances.
Balanced Classes:
According to Figure 11, we used the balanced classes task for each subject. In this sense. Data Cleaning Ontology recommends the oversampling approach, we use a Synthetic Minority Over-sampling Technique (Smote). Due to the dataset having 12 classes, we first identify the majority class and the minority classes, thus we applied Smote for each minority class when 2 < IR < 10. Figure 14 shows the instance distribution per class for all subjects. Purple bars represent the imbalanced dataset, and blue bars the balanced dataset using Smote.
The Smote algorithm increases instances of the classes: ascending_stairs (72,199), descending_stairs (111,366), rope_jumping (64,925), running (62,899), sitting (16,248) and standing (10,683). The remaining classes maintain the same number of instances.
Remove Duplicate Instances:
For evaluation of duplicate instances, we used Standard Duplicate Elimination. In this case, the dataset has no duplicate instances.
Dimensionality Reduction:
We merge the nine subjects in one dataset, and then we applied the dimensionality reduction task. Data Cleaning Ontology suggests the Filter approach. This approach is considered faster and has a low computational cost [93]. The absolute values of pairwise correlations are considered. If two attributes have a high correlation, the filter algorithm looks at the mean absolute correlation of each attribute and removes the variable with the largest mean absolute correlation [94]. In this case, we used the Pearson Correlation; the algorithm finds weights of continuous attributes based on their correlation with the class. Figure 15 presents the Top-15 of attributes with the highest correlation.
According to Figure 15, the temperatures of hands, chests, and ankles have attributes with a correlation coefficient greater than 0.75. The correlation values of the remaining Top-15 attributes are between 0.24-0.29. The remaining attributes out of the Top-15 measure are accelerometers, orientations, and magnetometers with correlations between 0.22–0.23. For this case, we use all attributes due to a lack of knowledge about the physical activity monitoring domain.
5.2.2. Occupancy Detection of an Office Room
Figure 16 presents the suggested process by our approach for cleaning the occupancy detection dataset. The process is explained in detail below:
Outliers detection: In the first step, we apply the outliers’ detection task. Data Cleaning Ontology recommends using Density algorithms. We again used the Local Outlier Factor (LOF). The algorithm finds 872 potential outliers based on Tukey fences. We considered as potential outliers the instances with LOF among 0.808 (lower fence) and 1.297 (upper fence). After removing the potential outliers, 1600 instances indicate that the room is occupied (Yes), and 5671 non-occupied (No).
Label Correction:
To correct the labels of the classes, we used Contradictory Instances Detection. The dataset has no contradictory instances.
Balanced Classes:
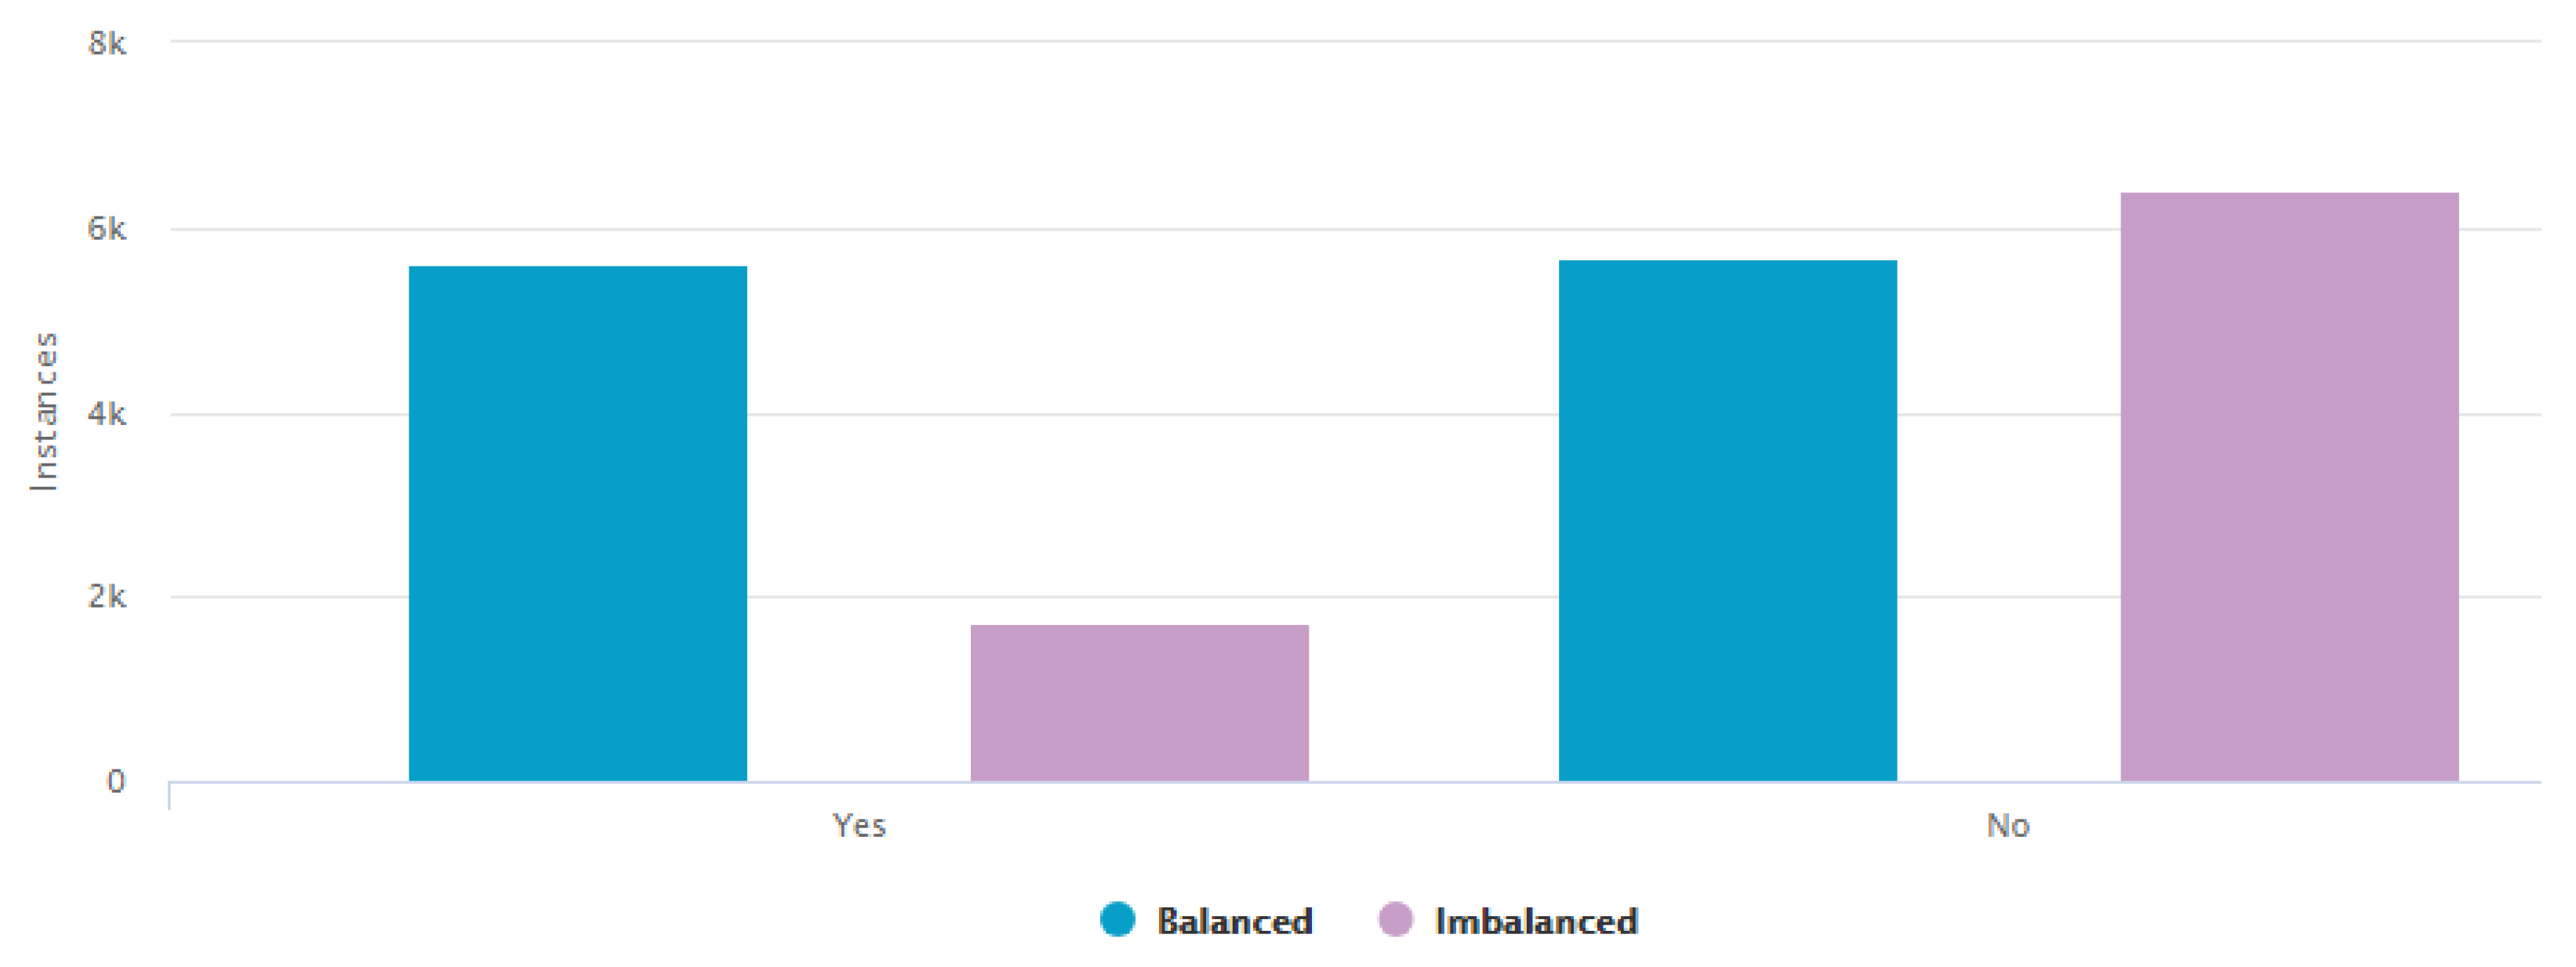
The Data Cleaning Ontology recommends an oversampling approach because the imbalance ratio of classes is 3.7 and then IR < 10 (rule 4.10). We used the Synthetic Minority Over-sampling Technique (Smote). Figure 17 shows the instance distribution per class for all subjects. Purple bars represent the imbalanced dataset, and blue bars the balanced dataset using Smote. Thus, 4000 instances were added to the minority class.
Remove Duplicate Instances:
We used Standard Duplicate Elimination again. We removed 812 duplicate instances (809 non-occupied and three occupied).
5.3. Results
In this section, we compare the accuracy of the classifiers trained with the datasets produced by [85,86] versus the same classifiers but trained with the datasets processed by DQF4CT.
5.3.1. Physical Activity Monitoring
The authors of the Physical Activity Monitoring (PAM) dataset [86] used the classifiers: Decision tree (C4.5), Boosting-C4.5 decision tree, Bagging-C4.5 decision tree, Naive Bayes and K nearest neighbor from the Weka toolkit. We used the same experimental configuration proposed by the authors [86] based on standard x-fold cross-validation. Table 15 shows the accuracy for the Physical Activity Monitoring (PAM) dataset.
In standard 9-fold cross-validation (Table 15), our conceptual framework obtained better accuracy to the models: Decision tree (99.30), Boosted (99.99), Bagging (99.60) and K-nearest neighbor (99.97). Meanwhile, the best results for Naive Bayes (94.19) are obtained by [86] (physical activity monitoring). Therefore, from the results obtained by our approach using Naive Bayes, we think that many attributes of the dataset analyzed represent similar information (e.g., two accelerometers for a wrist with a three-axis in two scales = 12 attributes). Moreover, if we take into account the affirmation of [98], the Naive Bayes has a systemic problem with analyzing independency of features.
5.3.2. Occupancy Detection of an Office Room
The authors in [85] used the classifiers: Random Forest (RF), Gradient Boosting Machines (GBM), Linear Discriminant Analysis (LDA) and Classification and Regression Trees (CART) with a CARET package available in R [94]. For the classifiers, we used the same experimental configuration proposed by the authors [85]. Table 16 presents the accuracies for mentioned models with 10-fold cross-validation (once our approach was applied), occupancy detection with original attributes and preprocessing attributes.
For Test 1, once our conceptual framework on training data was applied, the accuracy of the models RF and GBM are 0.63 and 0.98 percentage points below the best results of occupancy detection with preprocessing attributes. For the CART model, our conceptual framework has the best accuracy (97.75), while the three approaches obtain the same accuracy for LDA (97.90).
For Test 2, our conceptual framework reaches higher accuracies in RF (99.25), GBM (96.68) and CART (98.70) models. The higher accuracy for the LDA model (99.33) is obtained by [85] with preprocessing attributes.
The best results obtained by occupancy detection with preprocessing (RF, GBM in Test 1 and LDA in Test 2) can be due to two new attributes included by the authors: the number of seconds from midnight for each day and week status (weekend or a weekday).
5.4. Comparative Study
To guarantee the performance of Data Quality Framework for Classification Tasks, DQF4CT was validated with real datasets coming from the UCI Repository of Machine Learning Databases [84]. We used the classifiers: Linear Discriminant Analysis (LDA), Random Forest (RF), C4.5 Decision Tree, Bagging and Boosting with C4.5 as a base classifier, Classification and Regression Trees (CART), Support Vector Machine (SVM) and Multi Layer Perceptron (MLP). Table 17 and Table 18 show the Precision and Area Under Curve (AUC) of classifiers produced by authors of UCI datasets compared with the same classifiers trained with the datasets processed by DQF4CT. The values underlined in Table 17 and Table 18 correspond to the highest precisions and the best AUCs.
Once the UCI datasets by DQF4CT were cleaned, 84% of the models achieve the highest precisions and the best AUCs compared to models proposed by the datasets’ authors. The remaining 16% correspond to the models of the dataset authors: “Anuran families calls”, “Anuran species calls”, “Portuguese bank telemarketing” and “Phishing detection”. In case of “Anuran families calls” and “Anuran species calls”, the precision difference of the MLP generated by authors with respect to MLP built with datasets processed by DQF4CT are 1.4% and 0.1%, while the precision difference of “Portuguese bank telemarketing” is 0.3%. For “Phishing detection”, the Area Under Curve generated by the CART model of the dataset authors covers 6.2% more than the CART model of DQF4CT.
DQF4CT offers a general data cleaning solution for several domains, while the preparation of the datasets’ authors is based on previous domain knowledge and a data cleaning process ad hoc. Thus, DQF4CT reaches or overcomes the results proposed by the datasets’ authors.
6. Conclusions
In this work, we proposed a framework to address the DQ issues in classification tasks. DQF4CT is composed of: (i) a conceptual framework to provide the user with guidance of how to deal with data problems in classification tasks; and (ii) an ontology that represents the knowledge in data cleaning and suggests the proper data cleaning approaches. DQF4CT supports inexpert users to detection of data quality problems, and also in the recommendation of a suitable data cleaning approach. Additionally, DQF4CT achieves good quality datasets without considering the domain knowledge, reaching or overcoming accuracy results in classification tasks (84% of the models generated by datasets cleaned by DQF4CT achieve the highest precisions and the best AUCs compared to models proposed by the datasets’ authors). However, the results obtained by the LDA model in “Occupancy detection of an office room” [85], where the authors preprocess attributes, make us suppose that domain knowledge will allow for improving the results obtained.
We propose as future works:
- Build an integrated data quality framework for several knowledge discovery tasks as regression [37], clustering and association rules. The integrated data quality framework would consider the Big Data paradigm [29] and hence huge datasets. Deletion of redundancies will play a key role in decreasing the computational complexity of the Big Data models.
- Use ontologies of several domains to improve the performance of the data cleaning algorithms—e.g, the dimensionality reduction task. We could use the ontology of cancer diagnosis developed by [47] to select a subset of relevant features in datasets related to cancer.
- Create a case-based reasoning (CBR) for the recommendation of suitable data cleaning algorithms based on past experiences. The case representation would be based on annotation of samples also called dataset meta-features (e.g. mean absolute skewness, mean absolute kurtosis, mutual information, etc. [119]). The meta-features gather knowledge about datasets in order to provide an automatic selection, recommendation, or support for a future task [120]—in this case, recommendation of data cleaning algorithms.
Author Contributions
This paper is the result of the PhD thesis: “Framework for Data Quality in Knowledge Discovery Tasks” by David Camilo Corrales with the support of his supervisors Agapito Ledezma and Juan Carlos Corrales.
Acknowledgments
The authors are grateful to the Control Learning Systems Optimization Group (CAOS) of the Carlos III University of Madrid and the Telematics Engineering Group (GIT) of the University of Cauca for the technical support. In addition, the authors are grateful to COLCIENCIAS for the PhD scholarship granted to David Camilo Corrales. This work has also been supported by:
- Project: “Red de formación de talento humano para la innovación social y productiva en el Departamento del Cauca InnovAcción Cauca”. Convocatoria 03-2018 Publicación de artículos en revistas de alto impacto.
- Project: “Alternativas Innovadoras de Agricultura Inteligente para sistemas productivos agrícolas del departamento del Cauca soportado en entornos de IoT - ID 4633” financed by Convocatoria 04C–2018 “Banco de Proyectos Conjuntos UEES-Sostenibilidad” of Project “Red de formación de talento humano para la innovación social y productiva en el Departamento del Cauca InnovAcción Cauca”.
- Spanish Ministry of Economy, Industry and Competitiveness (Projects TRA2015-63708-R and TRA2016-78886-C3-1-R).
Conflicts of Interest
The authors declare no conflict of interest.
Abbreviations
The following abbreviations are used in this manuscript:
| DQ | Data Quality |
| DQF4CT | Data Quality Framework for Classification Tasks |
| DCO | Data Cleaning Ontology |
References
- Gantz, J.; Reinsel, D. The Digital Universe in 2020: Big Data, Bigger Digital Shadows, And Biggest Growth in the Far East. Available online: https://www.emc-technology.com/collateral/analyst-reports/idc-the-digital-universe-in-2020.pdf (accessed on 20 April 2018).
- Hu, H.; Wen, Y.; Chua, T.S.; Li, X. Toward Scalable Systems for Big Data Analytics: A Technology Tutorial. IEEE Access 2014, 2, 652–687. [Google Scholar] [Green Version]
- Rajaraman, A.; Ullman, J.D. Mining of Massive Datasets; Cambridge University Press: New York, NY, USA; Cambridge, UK, 2011. [Google Scholar]
- Pacheco, F.; Rangel, C.; Aguilar, J.; Cerrada, M.; Altamiranda, J. Methodological framework for data processing based on the Data Science paradigm. In Proceedings of the 2014 XL Latin American Computing Conference (CLEI), Montevideo, Uruguay, 15–19 September 2014; pp. 1–12. [Google Scholar]
- Sebastian-Coleman, L. Measuring Data Quality for Ongoing Improvement: A Data Quality Assessment Framework; Morgan Kaufmann Publishers Inc.: San Francisco, CA, USA, 2012. [Google Scholar]
- Eyob, E. Social Implications of Data Mining and Information Privacy: Interdisciplinary Frameworks and Solutions: Interdisciplinary Frameworks and Solutions; Information Science Reference: Hershey, PA, USA, 2009. [Google Scholar]
- Piateski, G.; Frawley, W. Knowledge Discovery in Databases; MIT Press: Cambridge, MA, USA, 1991. [Google Scholar]
- Chapman, P. CRISP-DM 1.0: Step-By-Step Data Mining Guide. SPSS, 2000. Available online: http://www.crisp-dm.org/CRISPWP-0800.pdf (accessed on 20 April 2018).
- Hall, M.; Frank, E.; Holmes, G.; Pfahringer, B.; Reutemann, P.; Witten, I.H. The WEKA Data Mining Software: An Update. SIGKDD Explor. Newsl. 2009, 11, 10–18. [Google Scholar] [CrossRef]
- Mierswa, I.; Wurst, M.; Klinkenberg, R.; Scholz, M.; Euler, T. YALE: Rapid Prototyping for Complex Data Mining Tasks. In Proceedings of the 12th ACM SIGKDD International Conference on Knowledge Discovery and Data Mining, Philadelphia, PA, USA, 20–23 August 2006; ACM: New York, NY, USA, 2006; pp. 935–940. [Google Scholar]
- Berthold, M.; Cebron, N.; Dill, F.; Gabriel, T.; Kötter, T.; Meinl, T.; Ohl, P.; Thiel, K.; Wiswedel, B. KNIME—The Konstanz information miner: Version 2.0 and Beyond. ACM SIGKDD Explor. Newsl. 2009, 11, 26–31. [Google Scholar] [CrossRef]
- MATHWORKS. Matlab; The MathWorks Inc.: Natick, MA, USA, 2004. [Google Scholar]
- Ihaka, R.; Gentleman, R. R: A language for data analysis and graphics. J. Comput. Graph. Stat. 1996, 5, 299–314. [Google Scholar]
- Eaton, J.W. GNU Octave Manual; Network Theory Limited: Eastbourne, UK, 2002. [Google Scholar]
- Corrales, D.C.; Ledezma, A.; Corrales, J.C. A Conceptual Framework for Data Quality in Knowledge Discovery Tasks (FDQ-KDT): A Proposal. J. Comput. 2015, 10, 396–405. [Google Scholar] [CrossRef] [Green Version]
- Caballero, I.; Verbo, E.; Calero, C.; Piattini, M. A Data Quality Measurement Information Model Based on ISO/IEC 15939; ICIQ: Cambridge, MA, USA, 2007; pp. 393–408. [Google Scholar]
- Ballou, D.P.; Pazer, H.L. Modeling Data and Process Quality in Multi-Input, Multi-Output Information Systems. Manag. Sci. 1985, 31, 150–162. [Google Scholar] [CrossRef]
- Berti-Équille, L. Measuring and Modelling Data Quality for Quality-Awareness in Data Mining. In Quality Measures in Data Mining; Guillet, F.J., Hamilton, H.J., Eds.; Springer: Berlin/Heidelberg, Germany, 2007; pp. 101–126. [Google Scholar]
- Kerr, K.; Norris, T. The Development of a Healthcare Data Quality Framework and Strategy. In Proceedings of the Ninth International Conference on Information Quality (ICIQ-04), Cambridge, MA, USA, 5–7 November 2004; pp. 218–233. [Google Scholar]
- Wang, R.Y.; Strong, D.M. Beyond accuracy: What data quality means to data consumers. J. Manag. Inf. Syst. 1996, 12, 5–33. [Google Scholar] [CrossRef]
- Eppler, M.J.; Wittig, D. Conceptualizing Information Quality: A Review of Information Quality Frameworks from the Last Ten Years. In Proceedings of the 2000 International Conference on Information Quality (IQ 2000), Cambridge, MA, USA, 20–22 October 2000; pp. 83–96. [Google Scholar]
- Gruber, T.R. Toward principles for the design of ontologies used for knowledge sharing? Int. J. Hum. Comput. Stud. 1995, 43, 907–928. [Google Scholar] [CrossRef] [Green Version]
- Uschold, M.; Gruninger, M. Ontologies: Principles, methods and applications. Knowl. Eng. Rev. 1996, 11, 93–136. [Google Scholar] [CrossRef]
- Geisler, S.; Quix, C.; Weber, S.; Jarke, M. Ontology-Based Data Quality Management for Data Streams. J. Data Inf. Qual. 2016, 7, 18:1–18:34. [Google Scholar] [CrossRef]
- Chiang, F.; Sitaramachandran, S. A Data Quality Framework for Customer Relationship Analytics. In Proceedings of the WISE 2015 16th International Conference on Web Information Systems Engineering, Miami, FL, USA, 1–3 November 2015; Wang, J., Cellary, W., Wang, D., Wang, H., Chen, S.C., Li, T., Zhang, Y., Eds.; Springer International Publishing: Cham, Switzerland, 2015; pp. 366–378. [Google Scholar]
- Galhard, H.; Florescu, D.; Shasha, D.; Simon, E. An extensible Framework for Data Cleaning. In Proceedings of the 16th International Conference on Data Engineering, Washington, DC, USA, 28 February–3 March 2000; p. 312. [Google Scholar]
- Sampaio, S.D.F.M.; Dong, C.; Sampaio, P. DQ2S—A framework for data quality-aware information management. Expert Syst. Appl. 2015, 42, 8304–8326. [Google Scholar] [CrossRef]
- Li, W.; Lei, L. An Object-Oriented Framework for Data Quality Management of Enterprise Data Warehouse. In Proceedings of the 9th Pacific Rim International Conference on Artificial Intelligence Trends in Artificial Intelligence (PRICAI 2006), Guilin, China, 7–11 August 2006; Yang, Q., Webb, G., Eds.; Springer: Berlin/Heidelberg, Germany, 2006; pp. 1125–1129. [Google Scholar]
- Taleb, I.; Dssouli, R.; Serhani, M.A. Big Data Pre-processing: A Quality Framework. In Proceedings of the 2015 IEEE International Congress on Big Data, New York, NY, USA, 27 June–2 July 2015; pp. 191–198. [Google Scholar]
- Reimer, A.P.; Milinovich, A.; Madigan, E.A. Data quality assessment framework to assess electronic medical record data for use in research. Int. J. Med. Inform. 2016, 90, 40–47. [Google Scholar] [CrossRef] [PubMed] [Green Version]
- Almutiry, O.; Wills, G.; Alwabel, A. Toward a framework for data quality in cloud-based health information system. In Proceedings of the International Conference on Information Society (i-Society 2013), Toronto, ON, Canada, 24–26 June 2013; pp. 153–157. [Google Scholar]
- Arts, D.G.; De Keizer, N.F.; Scheffer, G.J. Defining and improving data quality in medical registries: A literature review, case study, and generic framework. J. Am. Med. Inform. Assoc. 2002, 9, 600–611. [Google Scholar] [CrossRef] [PubMed]
- Myrseth, P.; Stang, J.; Dalberg, V. A data quality framework applied to e-government metadata: A prerequsite to establish governance of interoperable e-services. In Proceedings of the 2011 International Conference on E-Business and E-Government (ICEE), Maui, Hawaii, 19–24 June 2011; pp. 1–4. [Google Scholar]
- Vetro, A.; Canova, L.; Torchiano, M.; Minotas, C.O.; Iemma, R.; Morando, F. Open data quality measurement framework: Definition and application to Open Government Data. Gov. Inf. Q. 2016, 33, 325–337. [Google Scholar] [CrossRef]
- Panahy, P.H.S.; Sidi, F.; Affendey, L.S.; Jabar, M.A.; Ibrahim, H.; Mustapha, A. A Framework to Construct Data Quality Dimensions Relationships. Indian J. Sci. Technol. 2013, 6, 4422–4431. [Google Scholar]
- Wang, R.Y.; Storey, V.C.; Firth, C.P. A framework for analysis of data quality research. IEEE Trans. Knowl. Data Eng. 1995, 7, 623–640. [Google Scholar] [CrossRef] [Green Version]
- Corrales, D.C.; Corrales, J.C.; Ledezma, A. How to Address the Data Quality Issues in Regression Models: A Guided Process for Data Cleaning. Symmetry 2018, 10. [Google Scholar] [CrossRef]
- Rasta, K.; Nguyen, T.H.; Prinz, A. A framework for data quality handling in enterprise service bus. In Proceedings of the 2013 Third International Conference on Innovative Computing Technology (INTECH), London, UK, 29–31 August 2013; pp. 491–497. [Google Scholar]
- Olson, D.L.; Delen, D. Advanced Data Mining Techniques; Springer Science & Business Media: Berlin/Heidelberg, Germany, 2008. [Google Scholar]
- Schutt, R.; O’Neil, C. Doing Data Science: Straight Talk from the Frontline; O’Reilly Media, Inc.: Newton, MA, USA, 2013. [Google Scholar]
- Wang, X.; Hamilton, H.J.; Bither, Y. An Ontology-Based Approach to Data Cleaning; Technical Report CS-2005-05; Department of Computer Science, University of Regina: Regina, SK, Canada, 2005. [Google Scholar]
- Almeida, R.; Oliveira, P.; Braga, L.; Barroso, J. Ontologies for Reusing Data Cleaning Knowledge. In Proceedings of the 2012 IEEE Sixth International Conference on Semantic Computing, Palermo, Italy, 19–21 September 2012; pp. 238–241. [Google Scholar]
- Brüggemann, S. Rule Mining for Automatic Ontology Based Data Cleaning. In Proceedings of the 10th Asia-Pacific Web Conference ON Progress in WWW Research and Development, Shenyang, China, 26–28 April 2008; Zhang, Y., Yu, G., Bertino, E., Xu, G., Eds.; Springer: Berlin/Heidelberg, Germany, 2008; pp. 522–527. [Google Scholar]
- Kedad, Z.; Métais, E. Ontology-Based Data Cleaning. In Natural Language Processing and Information Systems, Proceedings of the 6th International Conference on Applications of Natural Language to Information Systems, NLDB 2002, Stockholm, Sweden, 27–28 June 2002; Andersson, B., Bergholtz, M., Johannesson, P., Eds.; Springer: Berlin/Heidelberg, Germany, 2002; pp. 137–149. [Google Scholar]
- Johnson, S.G.; Speedie, S.; Simon, G.; Kumar, V.; Westra, B.L. A Data Quality Ontology for the Secondary Use of EHR Data. AMIA Ann. Symp. Proc. 2015, 2015, 1937–1946. [Google Scholar]
- Abarza, R.G.; Motz, R.; Urrutia, A. Quality Assessment Using Data Ontologies. In Proceedings of the 2014 33rd International Conference of the Chilean Computer Science Society (SCCC), Talca, Chile, 8–14 November 2014; pp. 30–33. [Google Scholar]
- Da Silva Jacinto, A.; da Silva Santos, R.; de Oliveira, J.M.P. Automatic and semantic pre-Selection of features using ontology for data mining on datasets related to cancer. In Proceedings of the International Conference on Information Society (i-Society 2014), London, UK, 10–12 November 2014; pp. 282–287. [Google Scholar]
- Garcia, L.F.; Graciolli, V.M.; Ros, L.F.D.; Abel, M. An Ontology-Based Conceptual Framework to Improve Rock Data Quality in Reservoir Models. In Proceedings of the 2016 IEEE 28th International Conference on Tools with Artificial Intelligence (ICTAI), San Jose, CA, USA, 6–8 November 2016; pp. 1084–1088. [Google Scholar]
- Coulet, A.; Smail-Tabbone, M.; Benlian, P.; Napoli, A.; Devignes, M.D. Ontology-guided data preparation for discovering genotype-phenotype relationships. BMC Bioinform. 2008, 9, S3. [Google Scholar] [CrossRef] [PubMed] [Green Version]
- Jabareen, Y. Building a conceptual framework: Philosophy, definitions, and procedure. Int. J. Qual. Methods 2009, 8, 49–62. [Google Scholar] [CrossRef]
- Guba, E.G.; Lincoln, Y. Competing paradigms in qualitative research. Handb. Qual. Res. 1994, 2, 105. [Google Scholar]
- Corrales, D.C.; Ledezma, A.; Corrales, J.C. A systematic review of data quality issues in knowledge discovery tasks. Rev. Ing. Univ. Medel. 2016, 15. [Google Scholar] [CrossRef]
- Xiong, H.; Pandey, G.; Steinbach, M.; Kumar, V. Enhancing data analysis with noise removal. IEEE Trans. Knowl. Data Eng. 2006, 18, 304–319. [Google Scholar] [CrossRef] [Green Version]
- Chandola, V.; Banerjee, A.; Kumar, V. Anomaly Detection: A Survey. ACM Comput. Surv. 2009, 41, 15:1–15:58. [Google Scholar] [CrossRef]
- Aydilek, I.B.; Arslan, A. A hybrid method for imputation of missing values using optimized fuzzy c-means with support vector regression and a genetic algorithm. Inf. Sci. 2013, 233, 25–35. [Google Scholar] [CrossRef]
- Hawkins, D.M. Identification of Outliers; Springer: Berlin, Germany, 1980; Volume 11. [Google Scholar]
- Barnett, V.; Lewis, T. Outliers in Statistical Data; Wiley: New York, NY, USA, 1994; Volume 3. [Google Scholar]
- Johnson, R.A.; Wichern, D.W. Applied Multivariate Statistical Analysis; Prentice-Hall: Upper Saddle River, NJ, USA, 2014; Volume 4. [Google Scholar]
- Khalid, S.; Khalil, T.; Nasreen, S. A survey of feature selection and feature extraction techniques in machine learning. In Proceedings of the Science and Information Conference (SAI), London, UK, 27–29 August 2014; pp. 372–378. [Google Scholar]
- Tang, J.; Alelyani, S.; Liu, H. Feature selection for classification: A review. In Data Classification: Algorithms and Applications; Chapman and Hall/CRC: Boca Raton, FL, USA, 2014; p. 37. [Google Scholar]
- He, H.; Garcia, E.A. Learning from Imbalanced Data. IEEE Trans. Knowl. Data Eng. 2009, 21, 1263–1284. [Google Scholar] [Green Version]
- Chairi, I.; Alaoui, S.; Lyhyaoui, A. Learning from imbalanced data using methods of sample selection. In Proceedings of the 2012 International Conference on Multimedia Computing and Systems (ICMCS), Tangier, Morocco, 10–12 May 2012; pp. 254–257. [Google Scholar]
- Bosu, M.F.; MacDonell, S.G. A Taxonomy of Data Quality Challenges in Empirical Software Engineering. In Proceedings of the 2013 22nd Australian Software Engineering Conference, Melbourne, Australia, 4–7 June 2013; pp. 97–106. [Google Scholar]
- Hakimpour, F.; Geppert, A. Resolving Semantic Heterogeneity in Schema Integration. In Proceedings of the International Conference on Formal Ontology in Information Systems, Ogunquit, ME, USA, 17–19 October 2001; ACM: New York, NY, USA, 2001; Volume 2001, pp. 297–308. [Google Scholar]
- Finger, M.; Silva, F.S.D. Temporal data obsolescence: Modelling problems. In Proceedings of the Fifth International Workshop on Temporal Representation and Reasoning (Cat. No. 98EX157), Sanibel Island, FL, USA, 16–17 May 1998; pp. 45–50. [Google Scholar]
- Maydanchik, A. Data Quality Assessment; Data Quality for Practitioners Series; Technics Publications: Bradley Beach, NJ, USA, 2007. [Google Scholar]
- Aljuaid, T.; Sasi, S. Proper imputation techniques for missing values in datasets. In Proceedings of the 2016 International Conference on Data Science and Engineering (ICDSE), Cochin, India, 23–25 August 2016; pp. 1–5. [Google Scholar]
- Strike, K.; Emam, K.E.; Madhavji, N. Software cost estimation with incomplete data. IEEE Trans. Softw. Eng. 2001, 27, 890–908. [Google Scholar] [CrossRef] [Green Version]
- Magnani, M. Techniques for dealing with missing data in knowledge discovery tasks. Obtido 2004, 15, 2007. [Google Scholar]
- Breunig, M.M.; Kriegel, H.P.; Ng, R.T.; Sander, J. LOF: Identifying Density-Based Local Outliers; ACM Sigmod Record; ACM: New York, NY, USA, 2000; Volume 29, pp. 93–104. [Google Scholar]
- Ester, M.; Kriegel, H.P.; Sander, J.; Xu, X. A density-based algorithm for discovering clusters in large spatial databases with noise. In Proceedings of the Second International Conference on Knowledge Discovery and Data Mining (KDD-96 Proceedings), Portland, OR, USA, 2–4 August 1996; pp. 226–231. [Google Scholar]
- Kriegel, H.P.; Zimek, A.; Hubert, M.S. Angle-based outlier detection in high-dimensional data. In Proceedings of the 14th ACM SIGKDD International Conference On Knowledge Discovery and Data Mining, Las Vegas, NV, USA, 24–27 August 2008; pp. 444–452. [Google Scholar]
- Fayyad, U.M.; Piatetsky-Shapiro, G.; Smyth, P. Advances in Knowledge Discovery and Data Mining; Chapter from Data Mining to Knowledge Discovery: An Overview; American Association for Artificial Intelligence: Menlo Park, CA, USA, 1996; pp. 1–34. [Google Scholar]
- Ladha, L.; Deepa, T. Feature Selection Methods And Algorithms. Int. J. Comput. Sci. Eng. 2011, 3, 1787–1797. [Google Scholar]
- Chandrashekar, G.; Sahin, F. A survey on feature selection methods. Comput. Electr. Eng. 2014, 40, 16–28. [Google Scholar] [CrossRef]
- Blum, A.L.; Langley, P. Selection of relevant features and examples in machine learning. Artif. Intell. 1997, 97, 245–271. [Google Scholar] [CrossRef]
- Jolliffe, I. Principal Component Analysis; Wiley Online Library: Hoboken, NJ, USA, 2002. [Google Scholar]
- Wang, J.; Xu, M.; Wang, H.; Zhang, J. Classification of Imbalanced Data by Using the SMOTE Algorithm and Locally Linear Embedding. In Proceedings of the 2006 8th international Conference on Signal Processing, Beijing, China, 16–20 November 2006; Volume 3. [Google Scholar]
- He, H.; Ma, Y. Imbalanced Learning: Foundations, Algorithms, and Applications; John Wiley and Sons: Hoboken, NJ, USA, 2013. [Google Scholar]
- Frenay, B.; Verleysen, M. Classification in the Presence of Label Noise: A Survey. IEEE Trans. Neural Netw. Learn. Syst. 2014, 25, 845–869. [Google Scholar] [CrossRef] [PubMed]
- Huang, L.; Jin, H.; Yuan, P.; Chu, F. Duplicate Records Cleansing with Length Filtering and Dynamic Weighting. In Proceedings of the 2008 Fourth International Conference on Semantics, Knowledge and Grid, Beijing, China, 3–5 December 2008; pp. 95–102. [Google Scholar]
- Verbiest, N.; Ramentol, E.; Cornelis, C.; Herrera, F. Improving SMOTE with Fuzzy Rough Prototype Selection to Detect Noise in Imbalanced Classification Data. In Advances in Artificial Intelligence—IBERAMIA 2012, Proceedings of the 13th Ibero-American Conference on AI, Cartagena de Indias, Colombia, 13–16 November 2012; Pavón, J., Duque-Méndez, N.D., Fuentes-Fernández, R., Eds.; Springer: Berlin/Heidelberg, Germany, 2012; pp. 169–178. [Google Scholar]
- Jacquemin, A.P.; Berry, C.H. Entropy measure of diversification and corporate growth. J. Ind. Econ. 1979, 27, 359–369. [Google Scholar] [CrossRef]
- Asuncion, A.; Newman, D.; UCI Machine Learning Repository. Irvine, CA: University of California, School of Information and Computer Science. 2007. Available online: http://www.ics.uci.edu/~{}mlearn/MLRepository.html (accessed on 15 March 2018).
- Candanedo, L.M.; Feldheim, V. Accurate occupancy detection of an office room from light, temperature, humidity and CO2 measurements using statistical learning models. Energy Build. 2016, 112, 28–39. [Google Scholar] [CrossRef]
- Reiss, A.; Stricker, D. Creating and Benchmarking a New Dataset for Physical Activity Monitoring. In Proceedings of the 5th International Conference on PErvasive Technologies Related to Assistive Environments, Heraklion, Greece, 6–8 June 2012; ACM: New York, NY, USA, 2012; pp. 40:1–40:8. [Google Scholar]
- Bautista-Zambrana, M.R. Methodologies to Build Ontologies for Terminological Purposes. Procedia Soc. Behav. Sci. 2015, 173, 264–269. [Google Scholar] [CrossRef]
- Gómez-Pérez, A.; Fernández-López, M.; Corcho, O. Ontological Engineering: With Examples from the Areas of Knowledge Management, e-Commerce and the Semantic Web. (Advanced Information and Knowledge Processing); Springer-Verlag New York, Inc.: Secaucus, NJ, USA, 2007. [Google Scholar]
- Horrocks, I.; Patel-Schneider, P.F.; Bole, H.; Tabet, S.; Grosof, B.; Dean, M. SWRL: A Semantic Web Rule Language Combining OWL and RuleML. 2004. Available online: https://www.w3.org/Submission/SWRL/ (accessed on 1 May 2018).
- Rodríguez, J.P.; Girón, E.J.; Corrales, D.C.; Corrales, J.C. A Guideline for Building Large Coffee Rust Samples Applying Machine Learning Methods. In Proceedings of the International Conference of ICT for Adapting Agriculture to Climate Change, Popayán, Colombia, 22–24 November 2017; pp. 97–110. [Google Scholar]
- Juddoo, S. Overview of data quality challenges in the context of Big Data. In Proceedings of the 2015 International Conference on Computing, Communication and Security (ICCCS), Pamplemousses, Mauritius, 4–5 December 2015; pp. 1–9. [Google Scholar]
- Cai, L.; Zhu, Y. The challenges of data quality and data quality assessment in the big data era. Data Sci. J. 2015, 14. [Google Scholar] [CrossRef]
- Corrales, D.C.; Lasso, E.; Ledezma, A.; Corrales, J.C. Feature selection for classification tasks: Expert knowledge or traditional methods? J. Intell. Fuzzy Syst. 2018, 34, 2825–2835. [Google Scholar] [CrossRef]
- Kuhn, M. Building predictive models in R using the caret package. J. Stat. Softw. 2008, 28, 1–26. [Google Scholar] [CrossRef]
- Dong, Y.; Peng, C.Y.J. Principled missing data methods for researchers. SpringerPlus 2013, 2, 222. [Google Scholar] [CrossRef] [PubMed]
- Schafer, J.L. Multiple imputation: A primer. Stat. Methods Med. Res. 1999, 8, 3–15. [Google Scholar] [CrossRef] [PubMed]
- Grubbs, F.E. Procedures for detecting outlying observations in samples. Technometrics 1969, 11, 1–21. [Google Scholar] [CrossRef]
- Rennie, J.D.M.; Shih, L.; Teevan, J.; Karger, D.R. Tackling the Poor Assumptions of Naive Bayes Text Classifiers. In Proceedings of the Twentieth International Conference on Machine Learning, Washington, DC, USA, 21–24 August 2003; pp. 616–623. [Google Scholar]
- Colonna, J.G.; Cristo, M.; Salvatierra, M.; Nakamura, E.F. An incremental technique for real-time bioacoustic signal segmentation. Expert Syst. Appl. 2015, 42, 7367–7374. [Google Scholar] [CrossRef]
- Colonna, J.G.; Gama, J.; Nakamura, E.F. How to Correctly Evaluate an Automatic Bioacoustics Classification Method. In Advances in Artificial Intelligence; Luaces, O., Gámez, J.A., Barrenechea, E., Troncoso, A., Galar, M., Quintián, H., Corchado, E., Eds.; Springer International Publishing: Cham, Switzerland, 2016; pp. 37–47. [Google Scholar]
- Colonna, J.G.; Gama, J.; Nakamura, E.F. Recognizing Family, Genus, and Species of Anuran Using a Hierarchical Classification Approach. In Discovery Science; Calders, T., Ceci, M., Malerba, D., Eds.; Springer International Publishing: Cham, Switzerland, 2016; pp. 198–212. [Google Scholar]
- Thabtah, F. Autism Spectrum Disorder Screening: Machine Learning Adaptation and DSM-5 Fulfillment. In Proceedings of the 1st International Conference on Medical and Health Informatics, Taichung City, Taiwan, 20–22 May 2017; ACM: New York, NY, USA, 2017; pp. 1–6. [Google Scholar]
- Estrela da Silva, J.; Marques de Sá, J.P.; Jossinet, J. Classification of breast tissue by electrical impedance spectroscopy. Med. Biol. Eng. Comput. 2000, 38, 26–30. [Google Scholar] [CrossRef]
- Ayres-de Campos, D.; Bernardes, J.; Garrido, A.; Marques-de Sa, J.; Pereira-Leite, L. SisPorto 2.0: A program for automated analysis of cardiotocograms. J. Matern.-Fetal Med. 2000, 9, 311–318. [Google Scholar] [PubMed]
- Yeh, I.C.; Lien, C.H. The comparisons of data mining techniques for the predictive accuracy of probability of default of credit card clients. Expert Syst. Appl. 2009, 36, 2473–2480. [Google Scholar] [CrossRef]
- Reyes-Ortiz, J.L.; Oneto, L.; Samà, A.; Parra, X.; Anguita, D. Transition-aware human activity recognition using smartphones. Neurocomputing 2016, 171, 754–767. [Google Scholar] [CrossRef] [Green Version]
- Zhang, K.; Fan, W. Forecasting skewed biased stochastic ozone days: Analyses, solutions and beyond. Knowl. Inf. Syst. 2008, 14, 299–326. [Google Scholar] [CrossRef]
- Abdelhamid, N.; Ayesh, A.; Thabtah, F. Phishing detection based Associative Classification data mining. Expert Syst. Appl. 2014, 41, 5948–5959. [Google Scholar] [CrossRef]
- Zikeba, M.; Tomczak, S.K.; Tomczak, J.M. Ensemble Boosted Trees with Synthetic Features Generation in Application to Bankruptcy Prediction. Expert Syst. Appl. 2016, 58, 93–101. [Google Scholar]
- Moro, S.; Cortez, P.; Rita, P. A data-driven approach to predict the success of bank telemarketing. Decis. Support Syst. 2014, 62, 22–31. [Google Scholar] [CrossRef] [Green Version]
- Mohammad, R.M.; Thabtah, F.; McCluskey, L. Predicting phishing websites based on self-structuring neural network. Neural Comput. Appl. 2014, 25, 443–458. [Google Scholar] [CrossRef]
- Mansouri, K.; Ringsted, T.; Ballabio, D.; Todeschini, R.; Consonni, V. Quantitative structure–activity relationship models for ready biodegradability of chemicals. J. Chem. Inf. Model. 2013, 53, 867–878. [Google Scholar] [CrossRef] [PubMed]
- Fernandes, K.; Cardoso, J.S.; Fernandes, J. Transfer Learning with Partial Observability Applied to Cervical Cancer Screening. In Pattern Recognition and Image Analysis; Alexandre, L.A., Salvador Sánchez, J., Rodrigues, J.M.F., Eds.; Springer International Publishing: Cham, Switzerland, 2017; pp. 243–250. [Google Scholar]
- Fatlawi, H.K. Enhanced Classification Model for Cervical Cancer Dataset based on Cost Sensitive Classifier. Int. J. Comput. Tech. 2007, 4, 115–120. [Google Scholar]
- Kabiesz, J.; Sikora, B.; Sikora, M.; Wróbel, Ł. Application of rule-based models for seismic hazard prediction in coal mines. Acta Montan. Slovaca 2013, 18, 262–277. [Google Scholar]
- Da Rocha Neto, A.R.; de Alencar Barreto, G. On the Application of Ensembles of Classifiers to the Diagnosis of Pathologies of the Vertebral Column: A Comparative Analysis. IEEE Latin Am. Trans. 2009, 7, 487–496. [Google Scholar] [CrossRef]
- Da Rocha Neto, A.R.; Sousa, R.; de A. Barreto, G.; Cardoso, J.S. Diagnostic of Pathology on the Vertebral Column with Embedded Reject Option. In Pattern Recognition and Image Analysis; Vitrià, J., Sanches, J.M., Hernández, M., Eds.; Springer: Berlin/Heidelberg, Germany, 2011; pp. 588–595. [Google Scholar]
- Tsanas, A.; Little, M.A.; Fox, C.; Ramig, L.O. Objective Automatic Assessment of Rehabilitative Speech Treatment in Parkinson’s Disease. IEEE Trans. Neural Syst. Rehabil. Eng. 2014, 22, 181–190. [Google Scholar] [CrossRef] [PubMed] [Green Version]
- Wang, G.; Song, Q.; Sun, H.; Zhang, X.; Xu, B.; Zhou, Y. A Feature Subset Selection Algorithm Automatic Recommendation Method. J. Artif. Int. Res. 2013, 47, 1–34. [Google Scholar]
- Reif, M.; Shafait, F.; Dengel, A. Meta2-features: Providing meta-learners more information. In Proceedings of the 35th German Conference on Artificial Intelligence, Saarbrücken, Germany, 24 September 2012; pp. 74–77. [Google Scholar]
Figure 1.
Data quality issues in classification tasks.

Figure 2.
Conceptual framework.
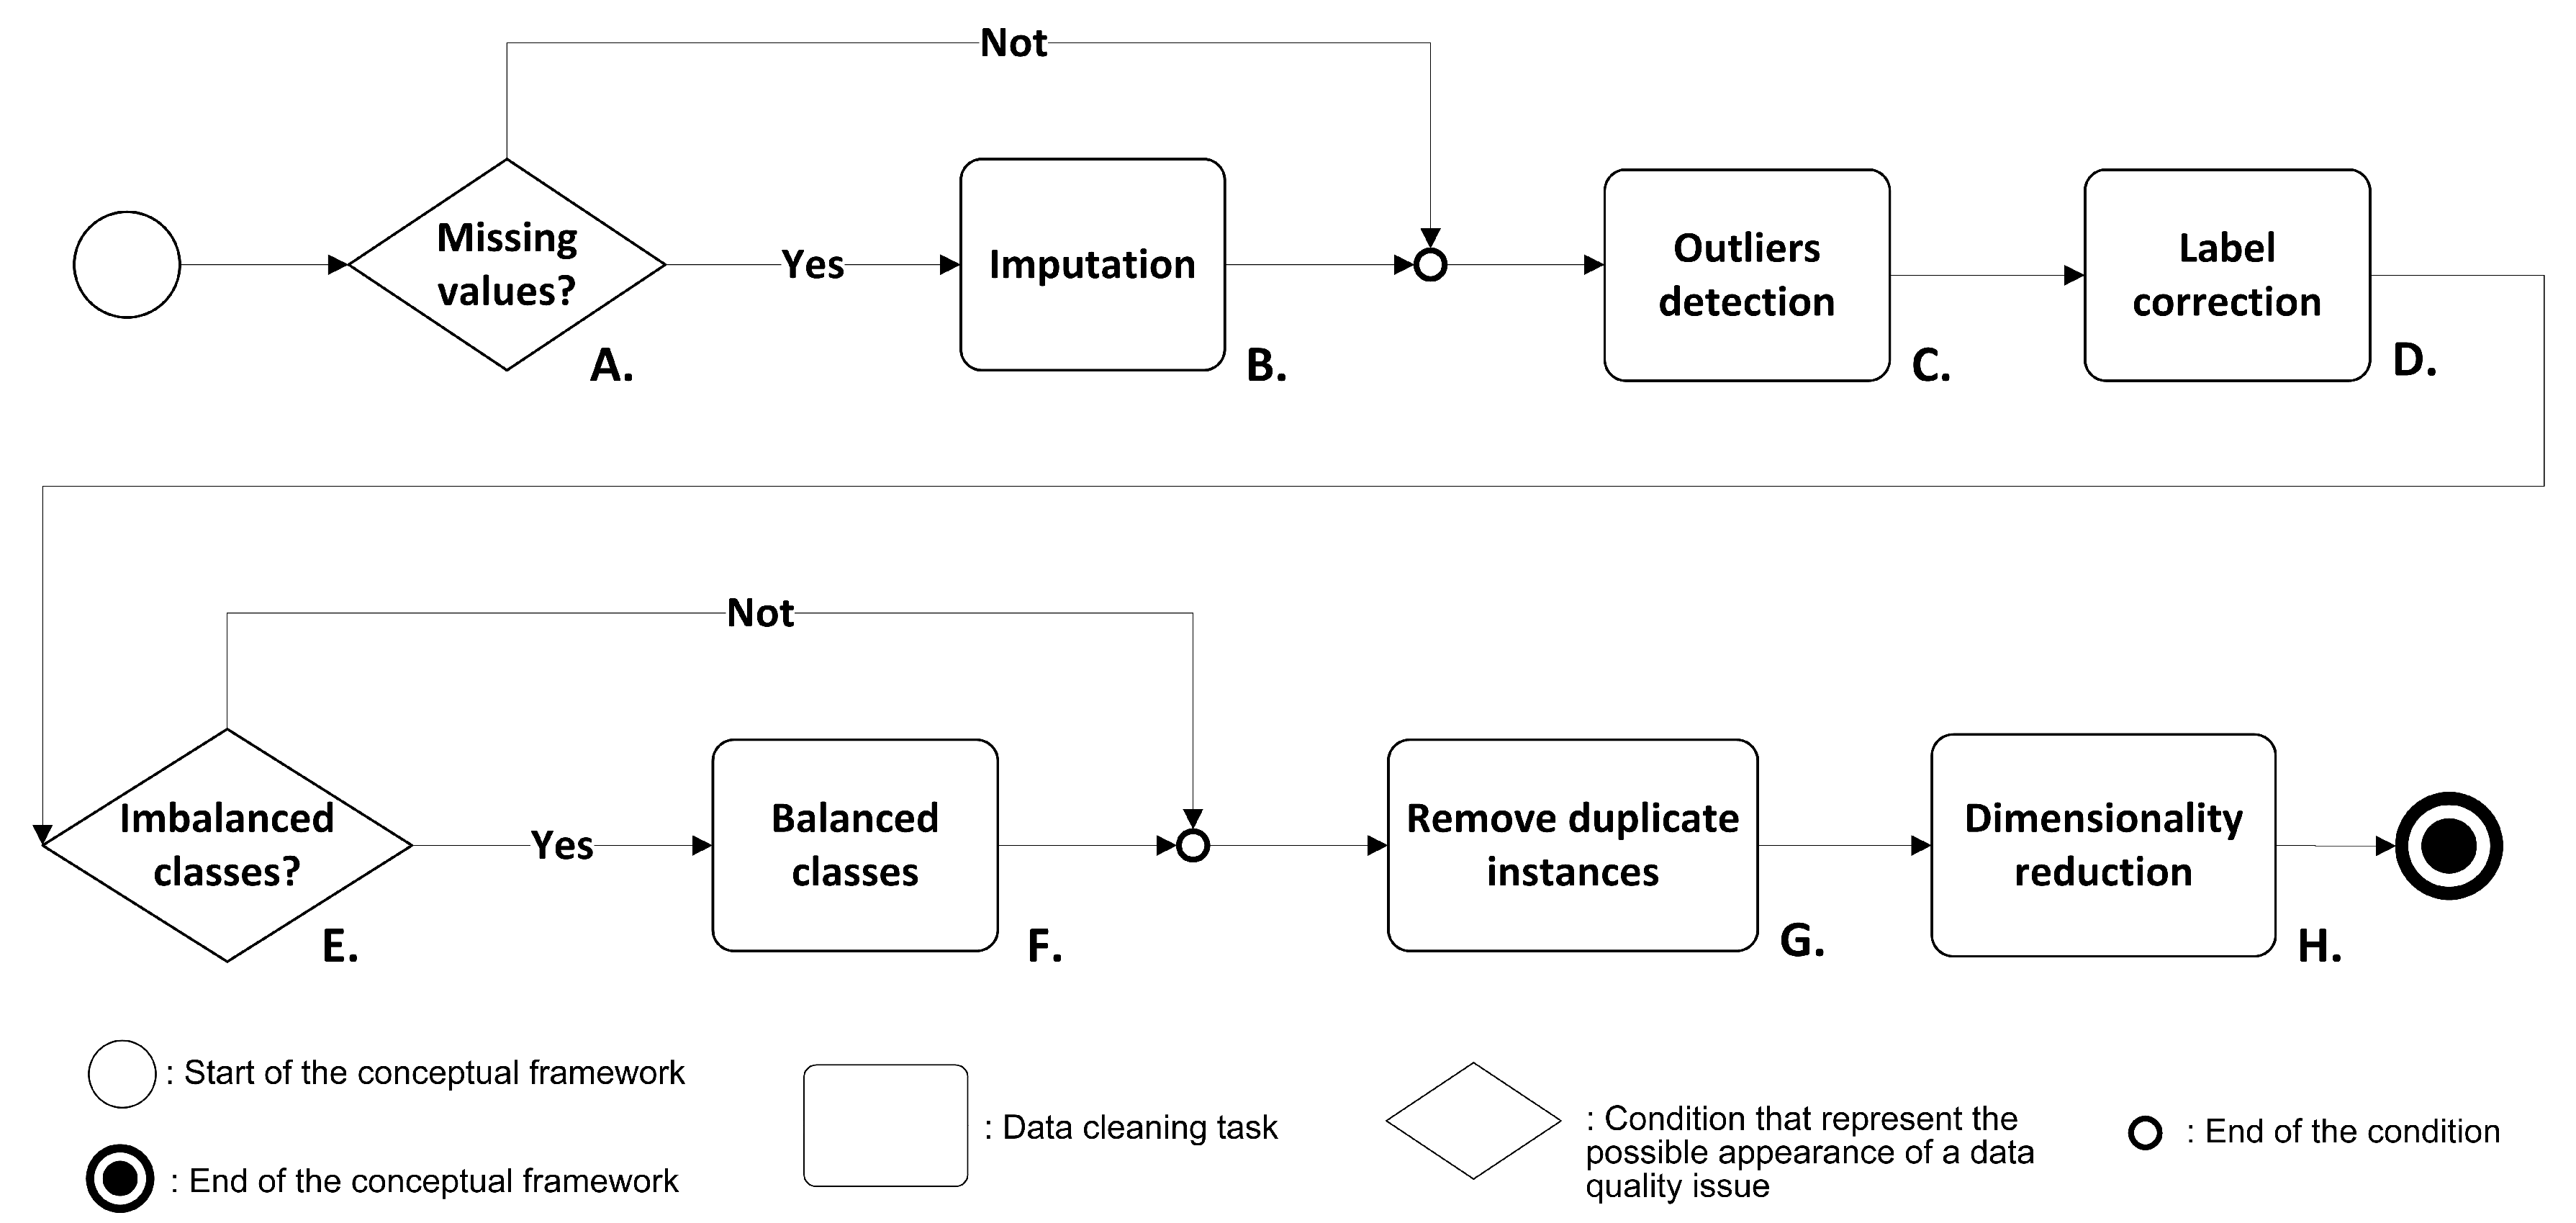
Figure 3.
Taxonomy attributes.

Figure 4.
Taxonomy of data cleaning tasks.
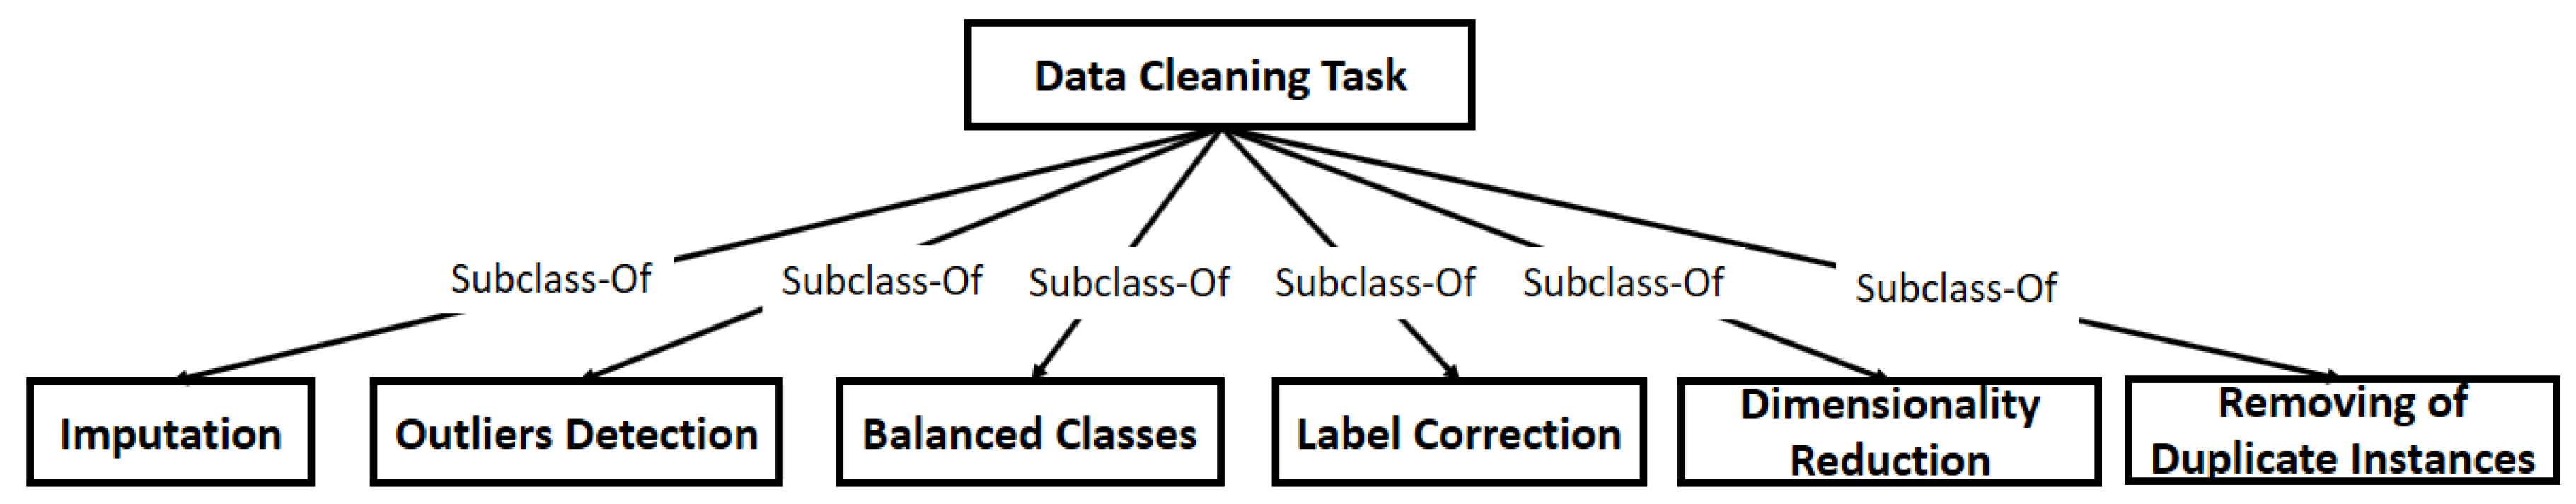
Figure 5.
Taxonomy imputation.
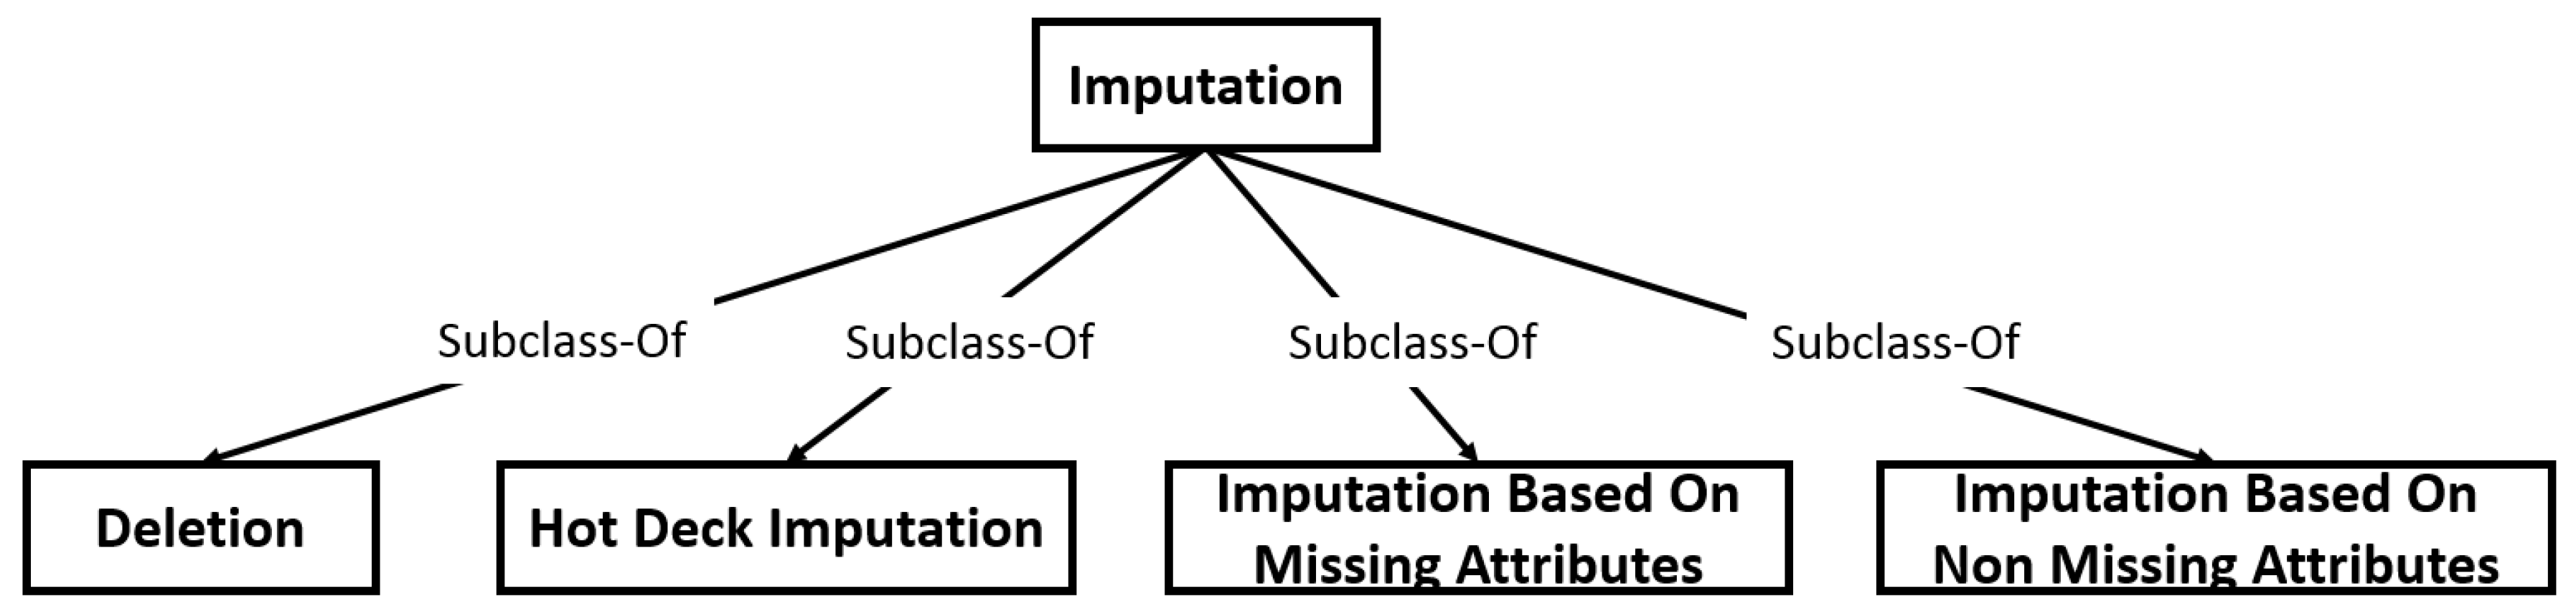
Figure 6.
Taxonomy outliers detection.
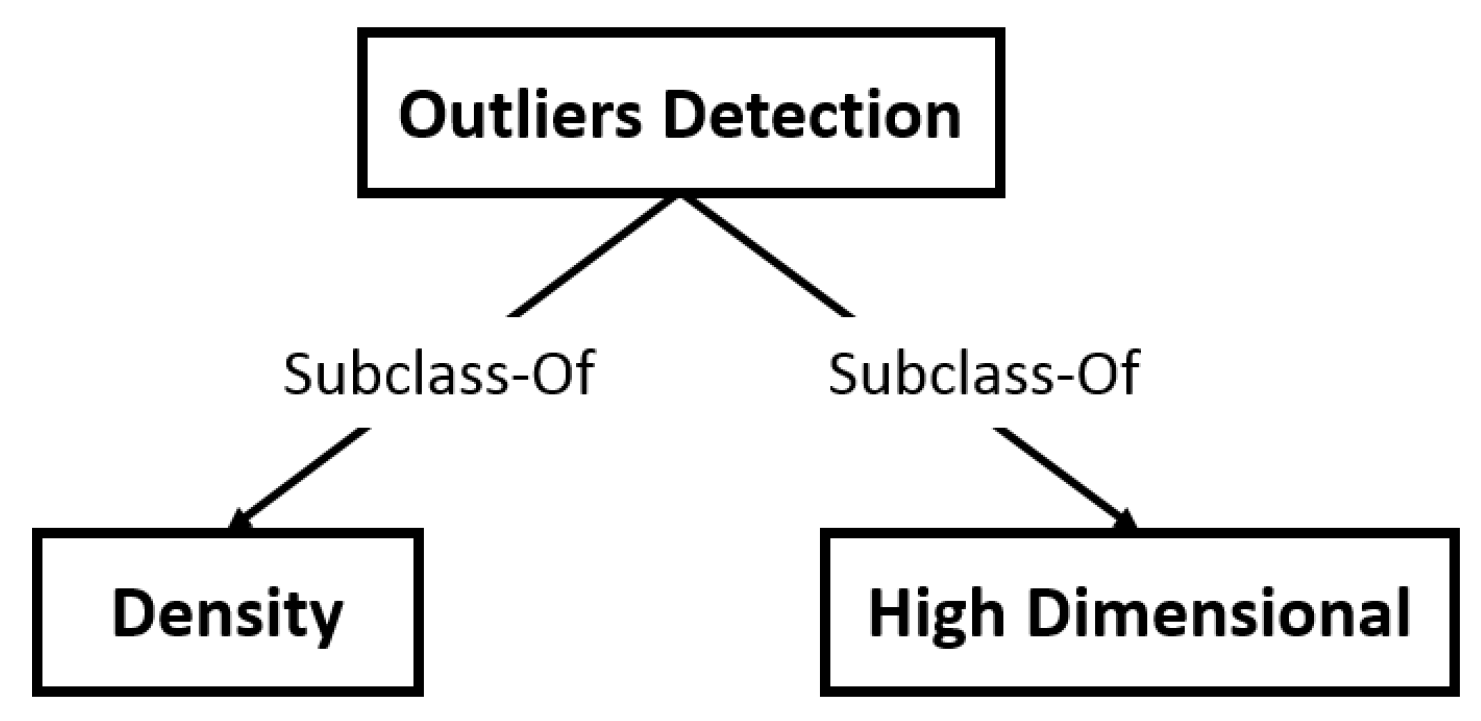
Figure 7.
Taxonomy balanced classes.
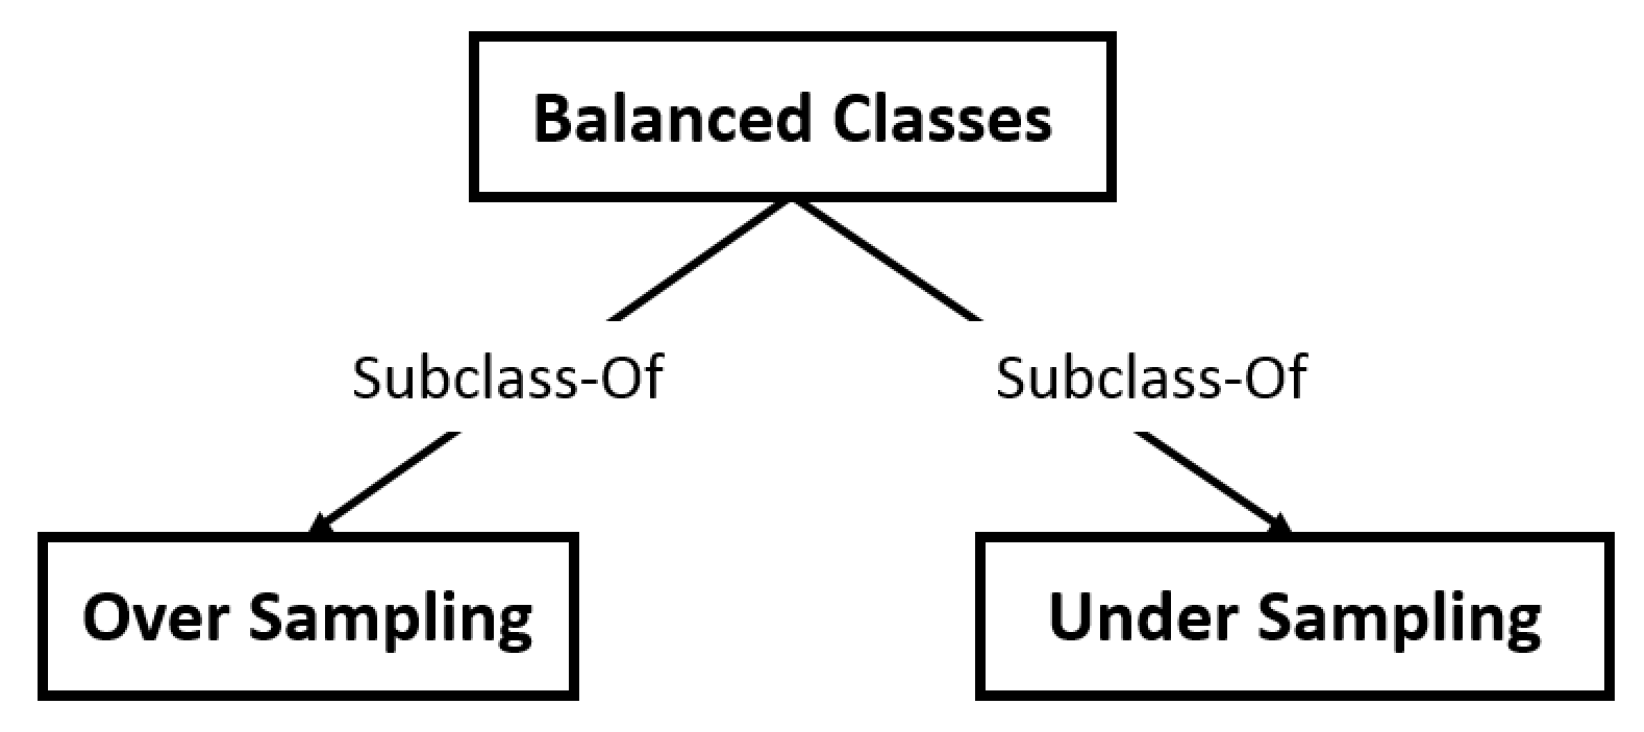
Figure 8.
Taxonomy label correction.
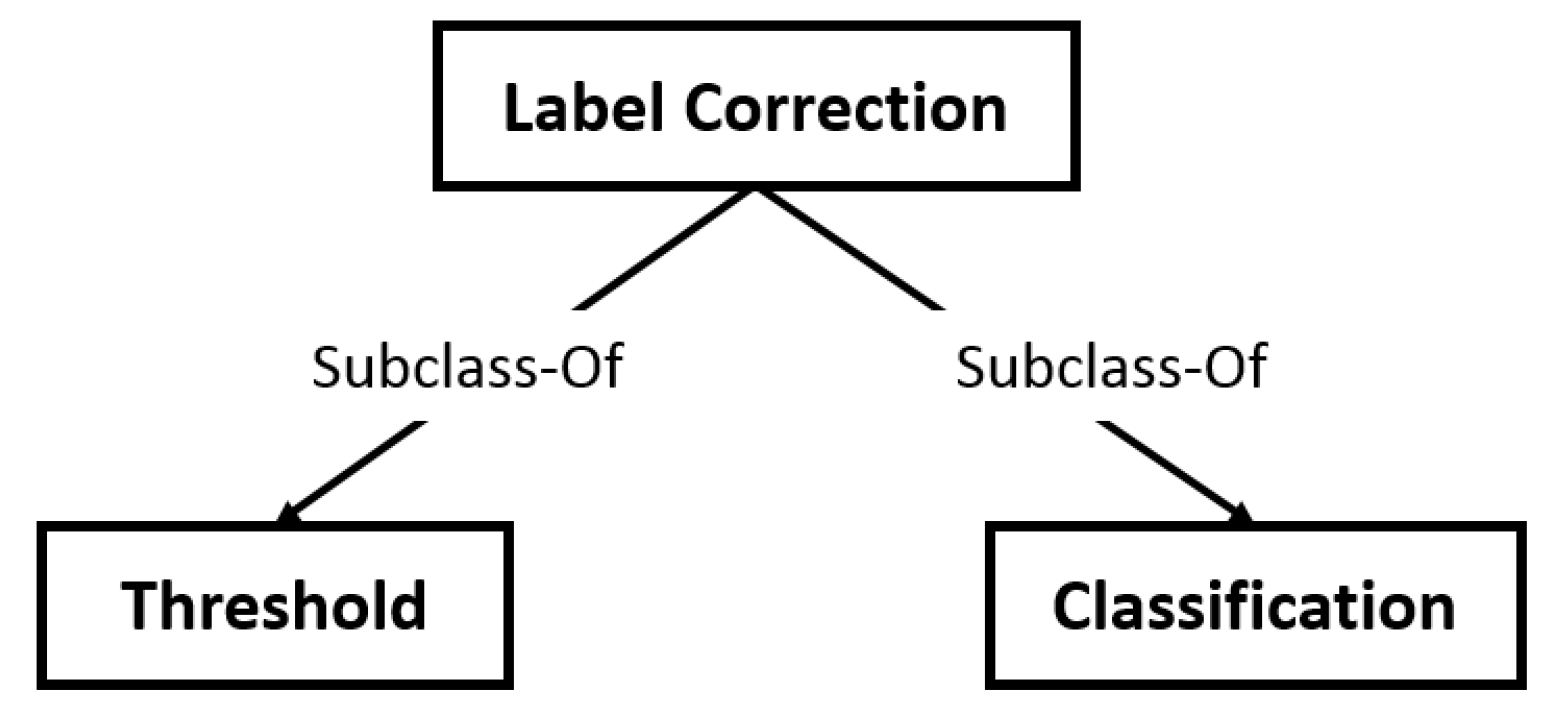
Figure 9.
Taxonomy dimensionality reduction.
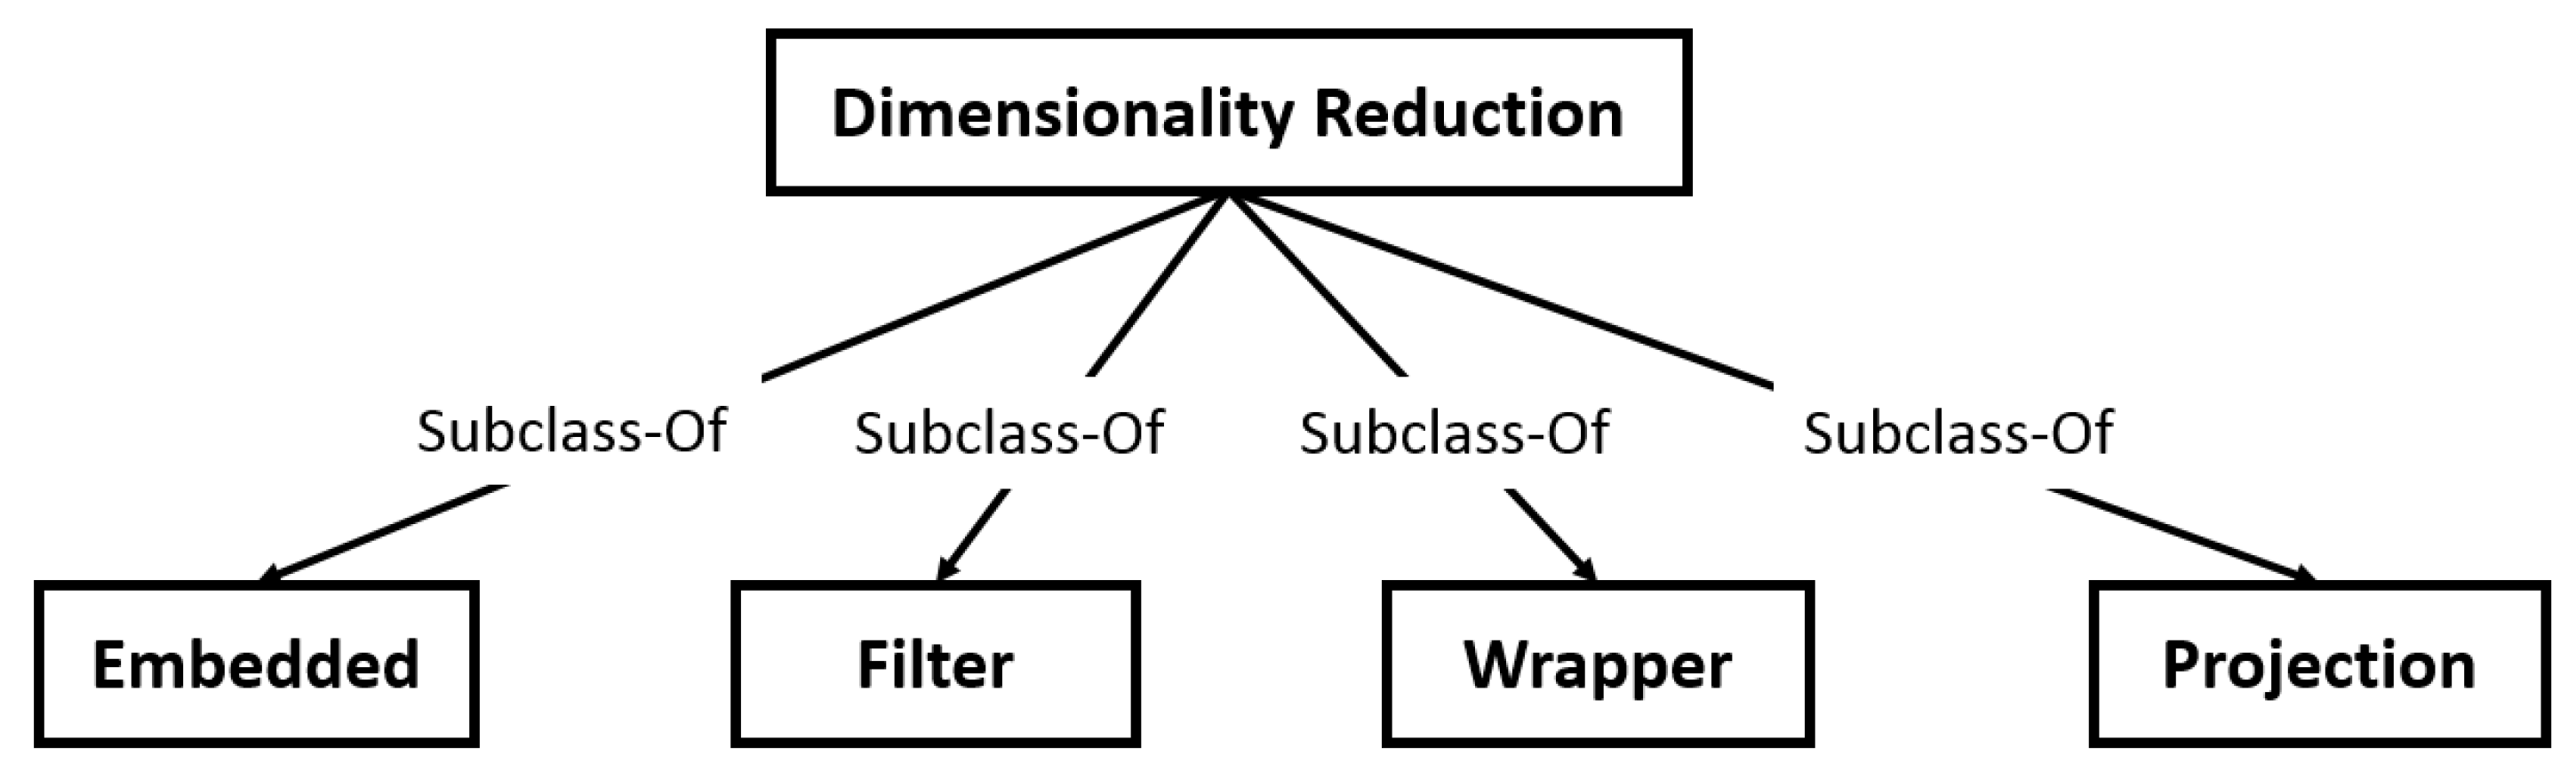
Figure 10.
Taxonomy dimensionality reduction.
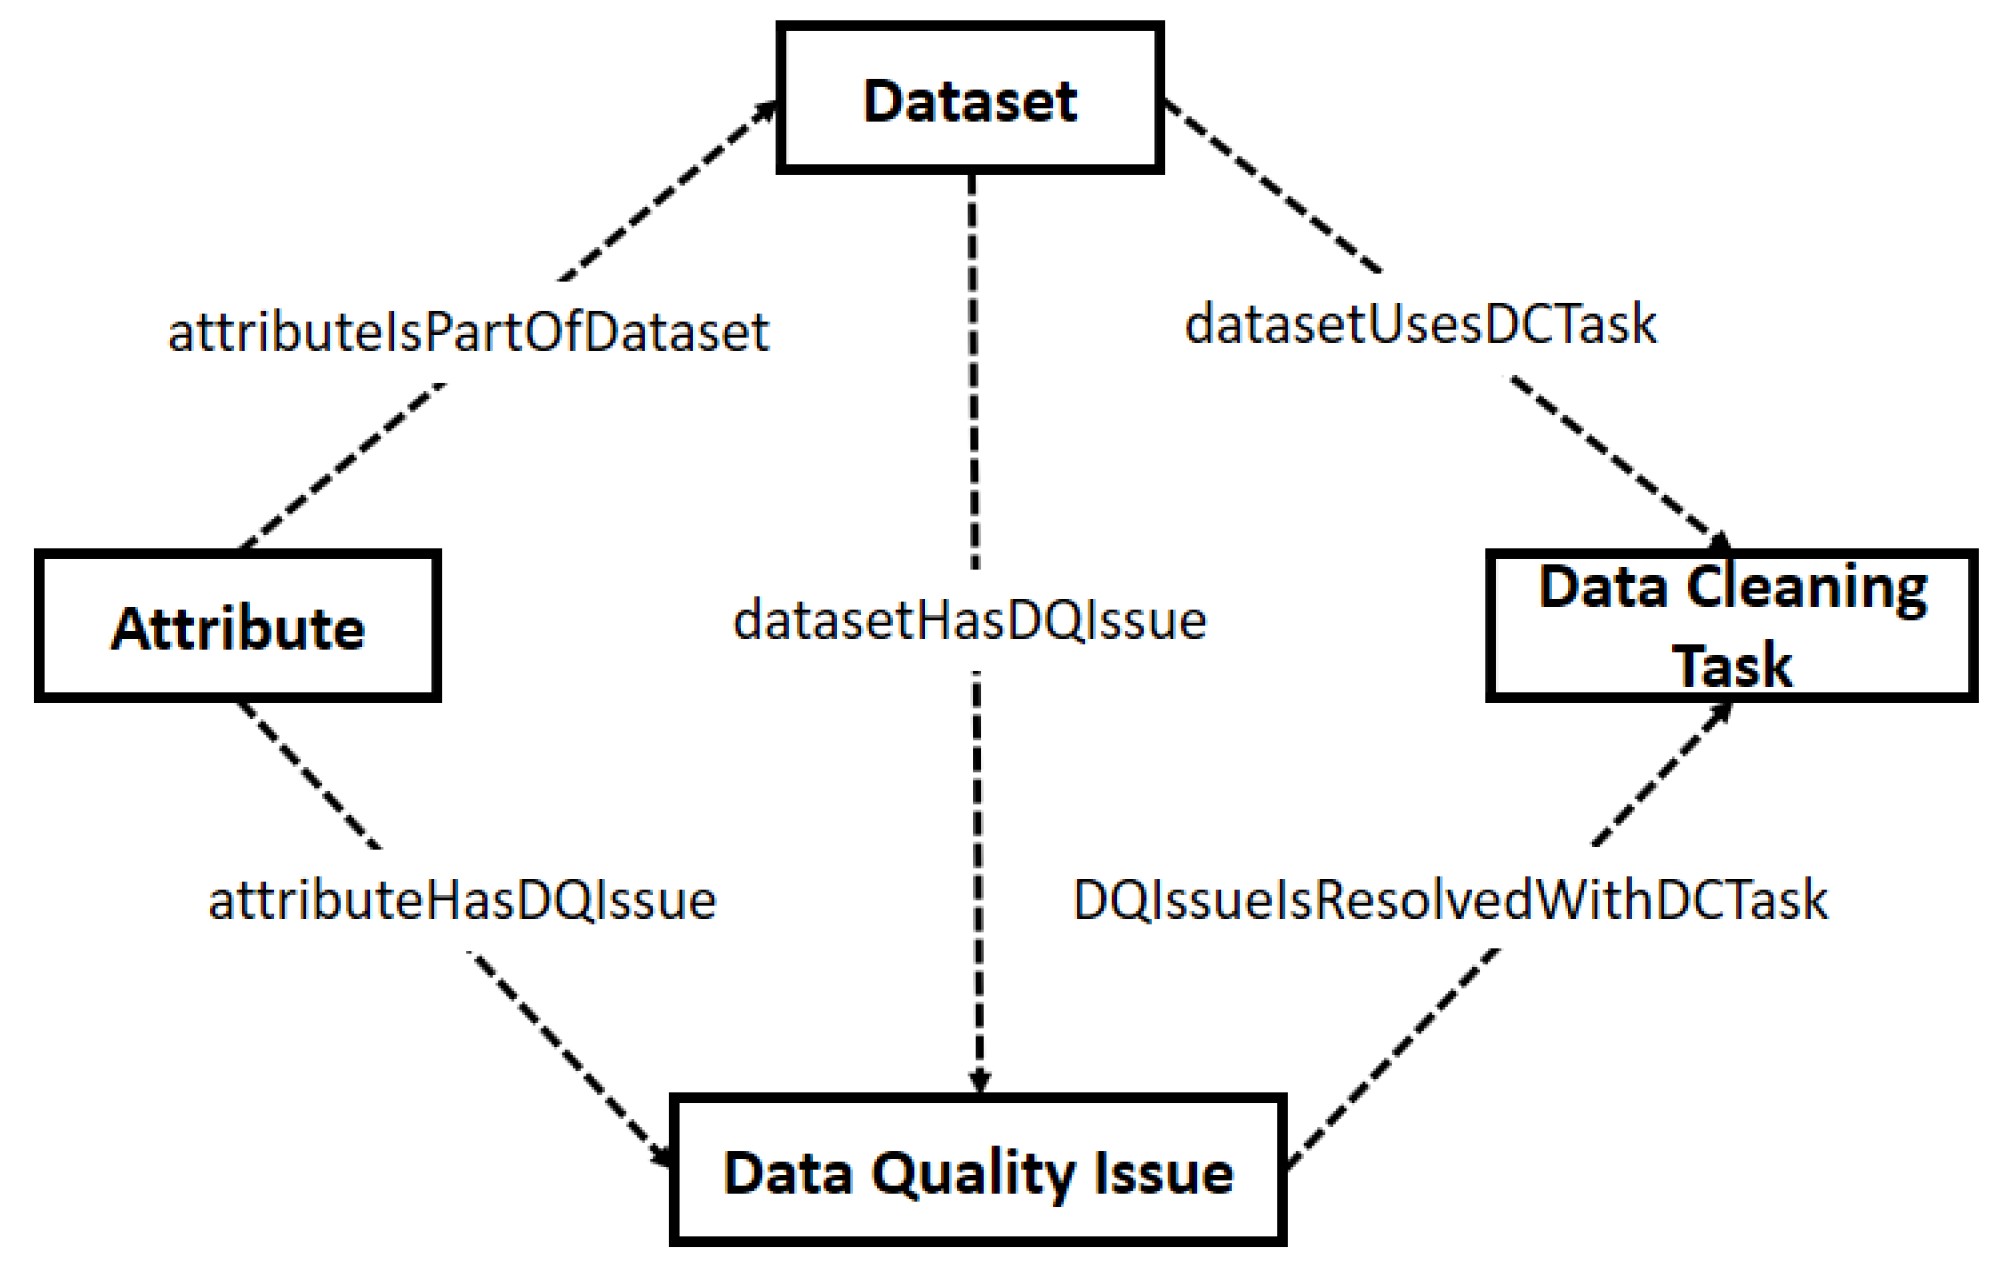
Figure 11.
Data cleaning process for the physical activity monitoring dataset.
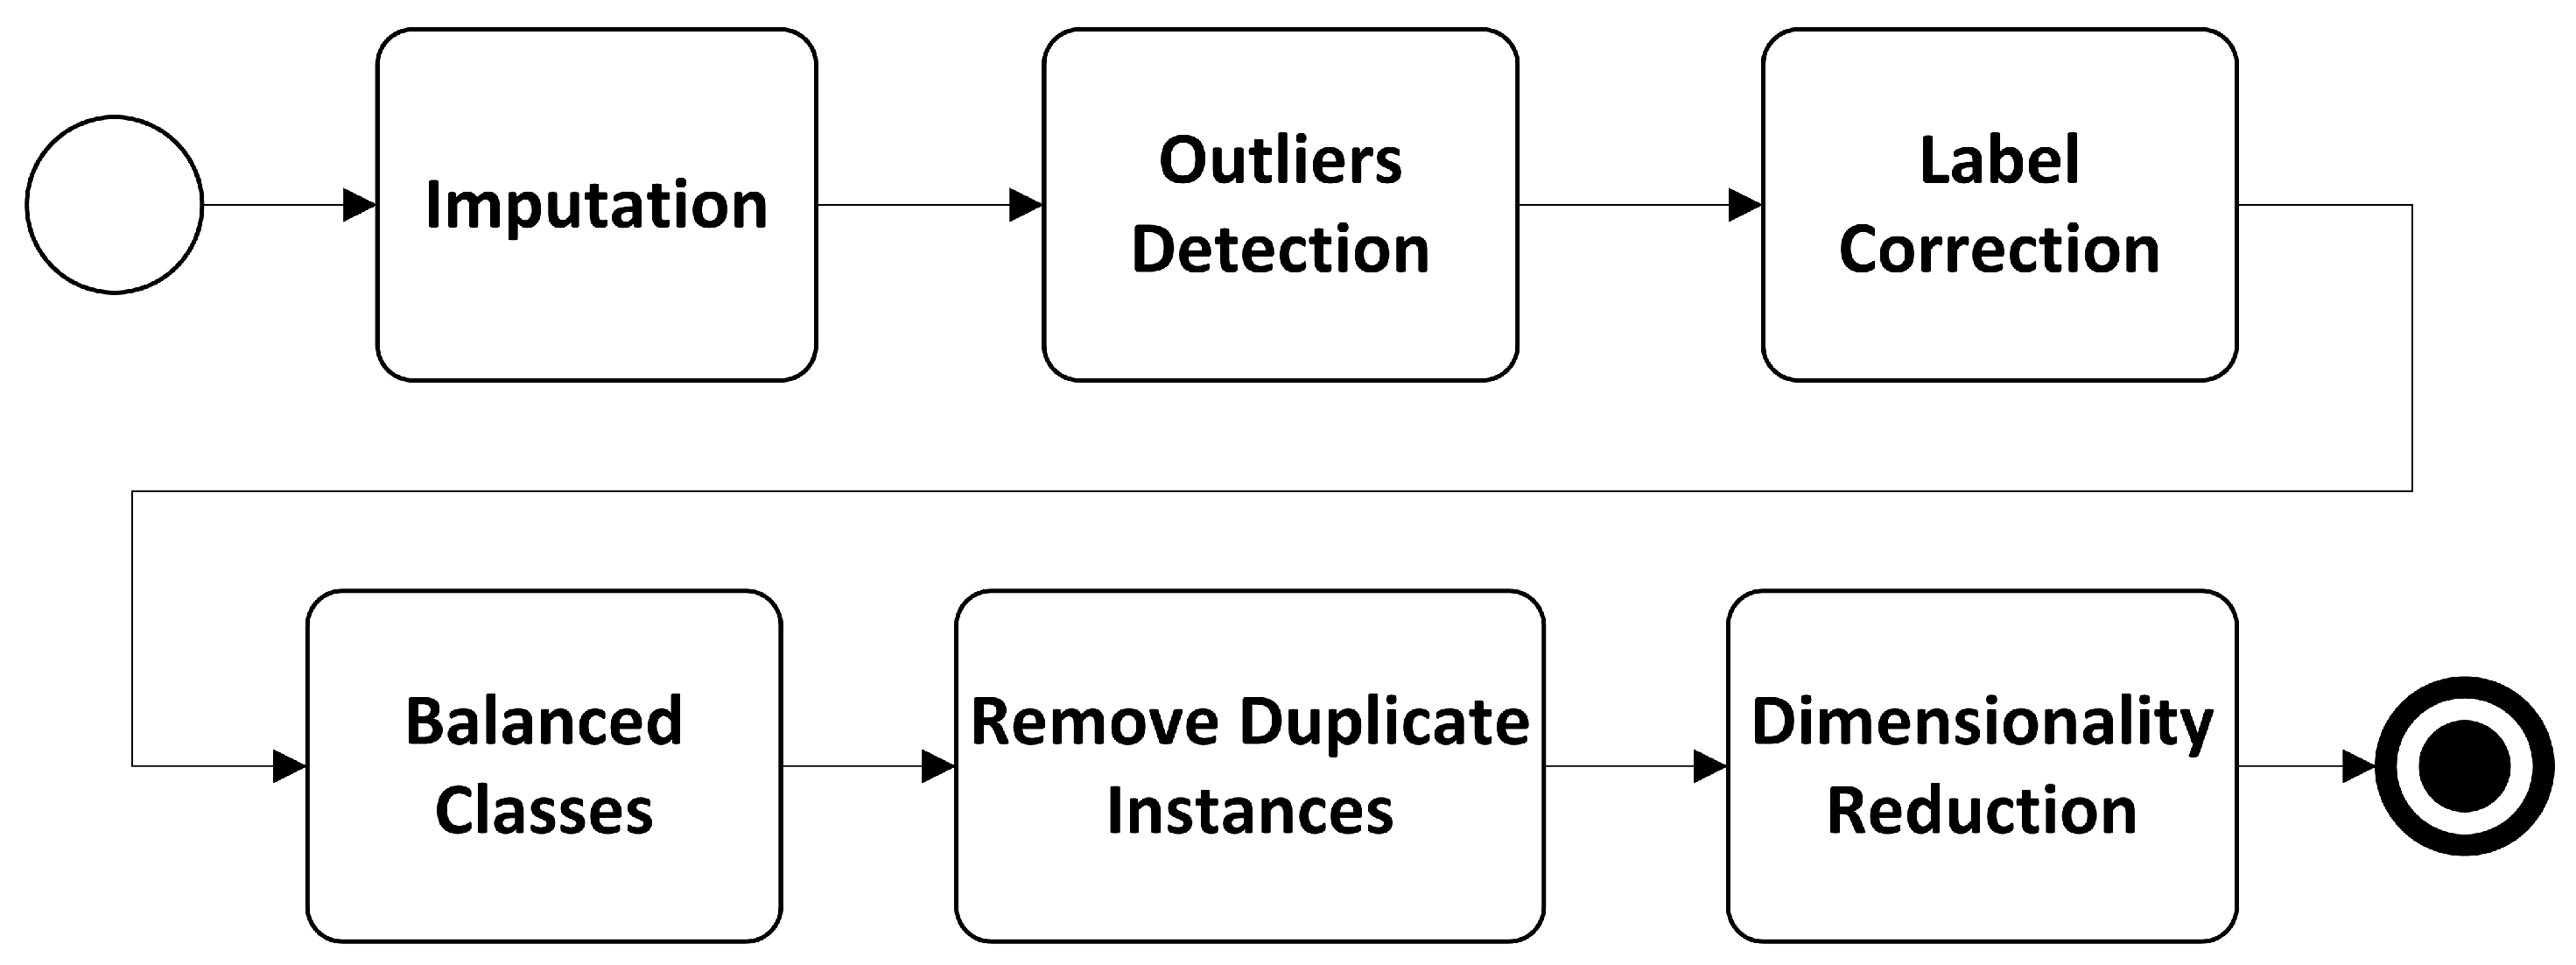
Figure 12.
Missing pattern.
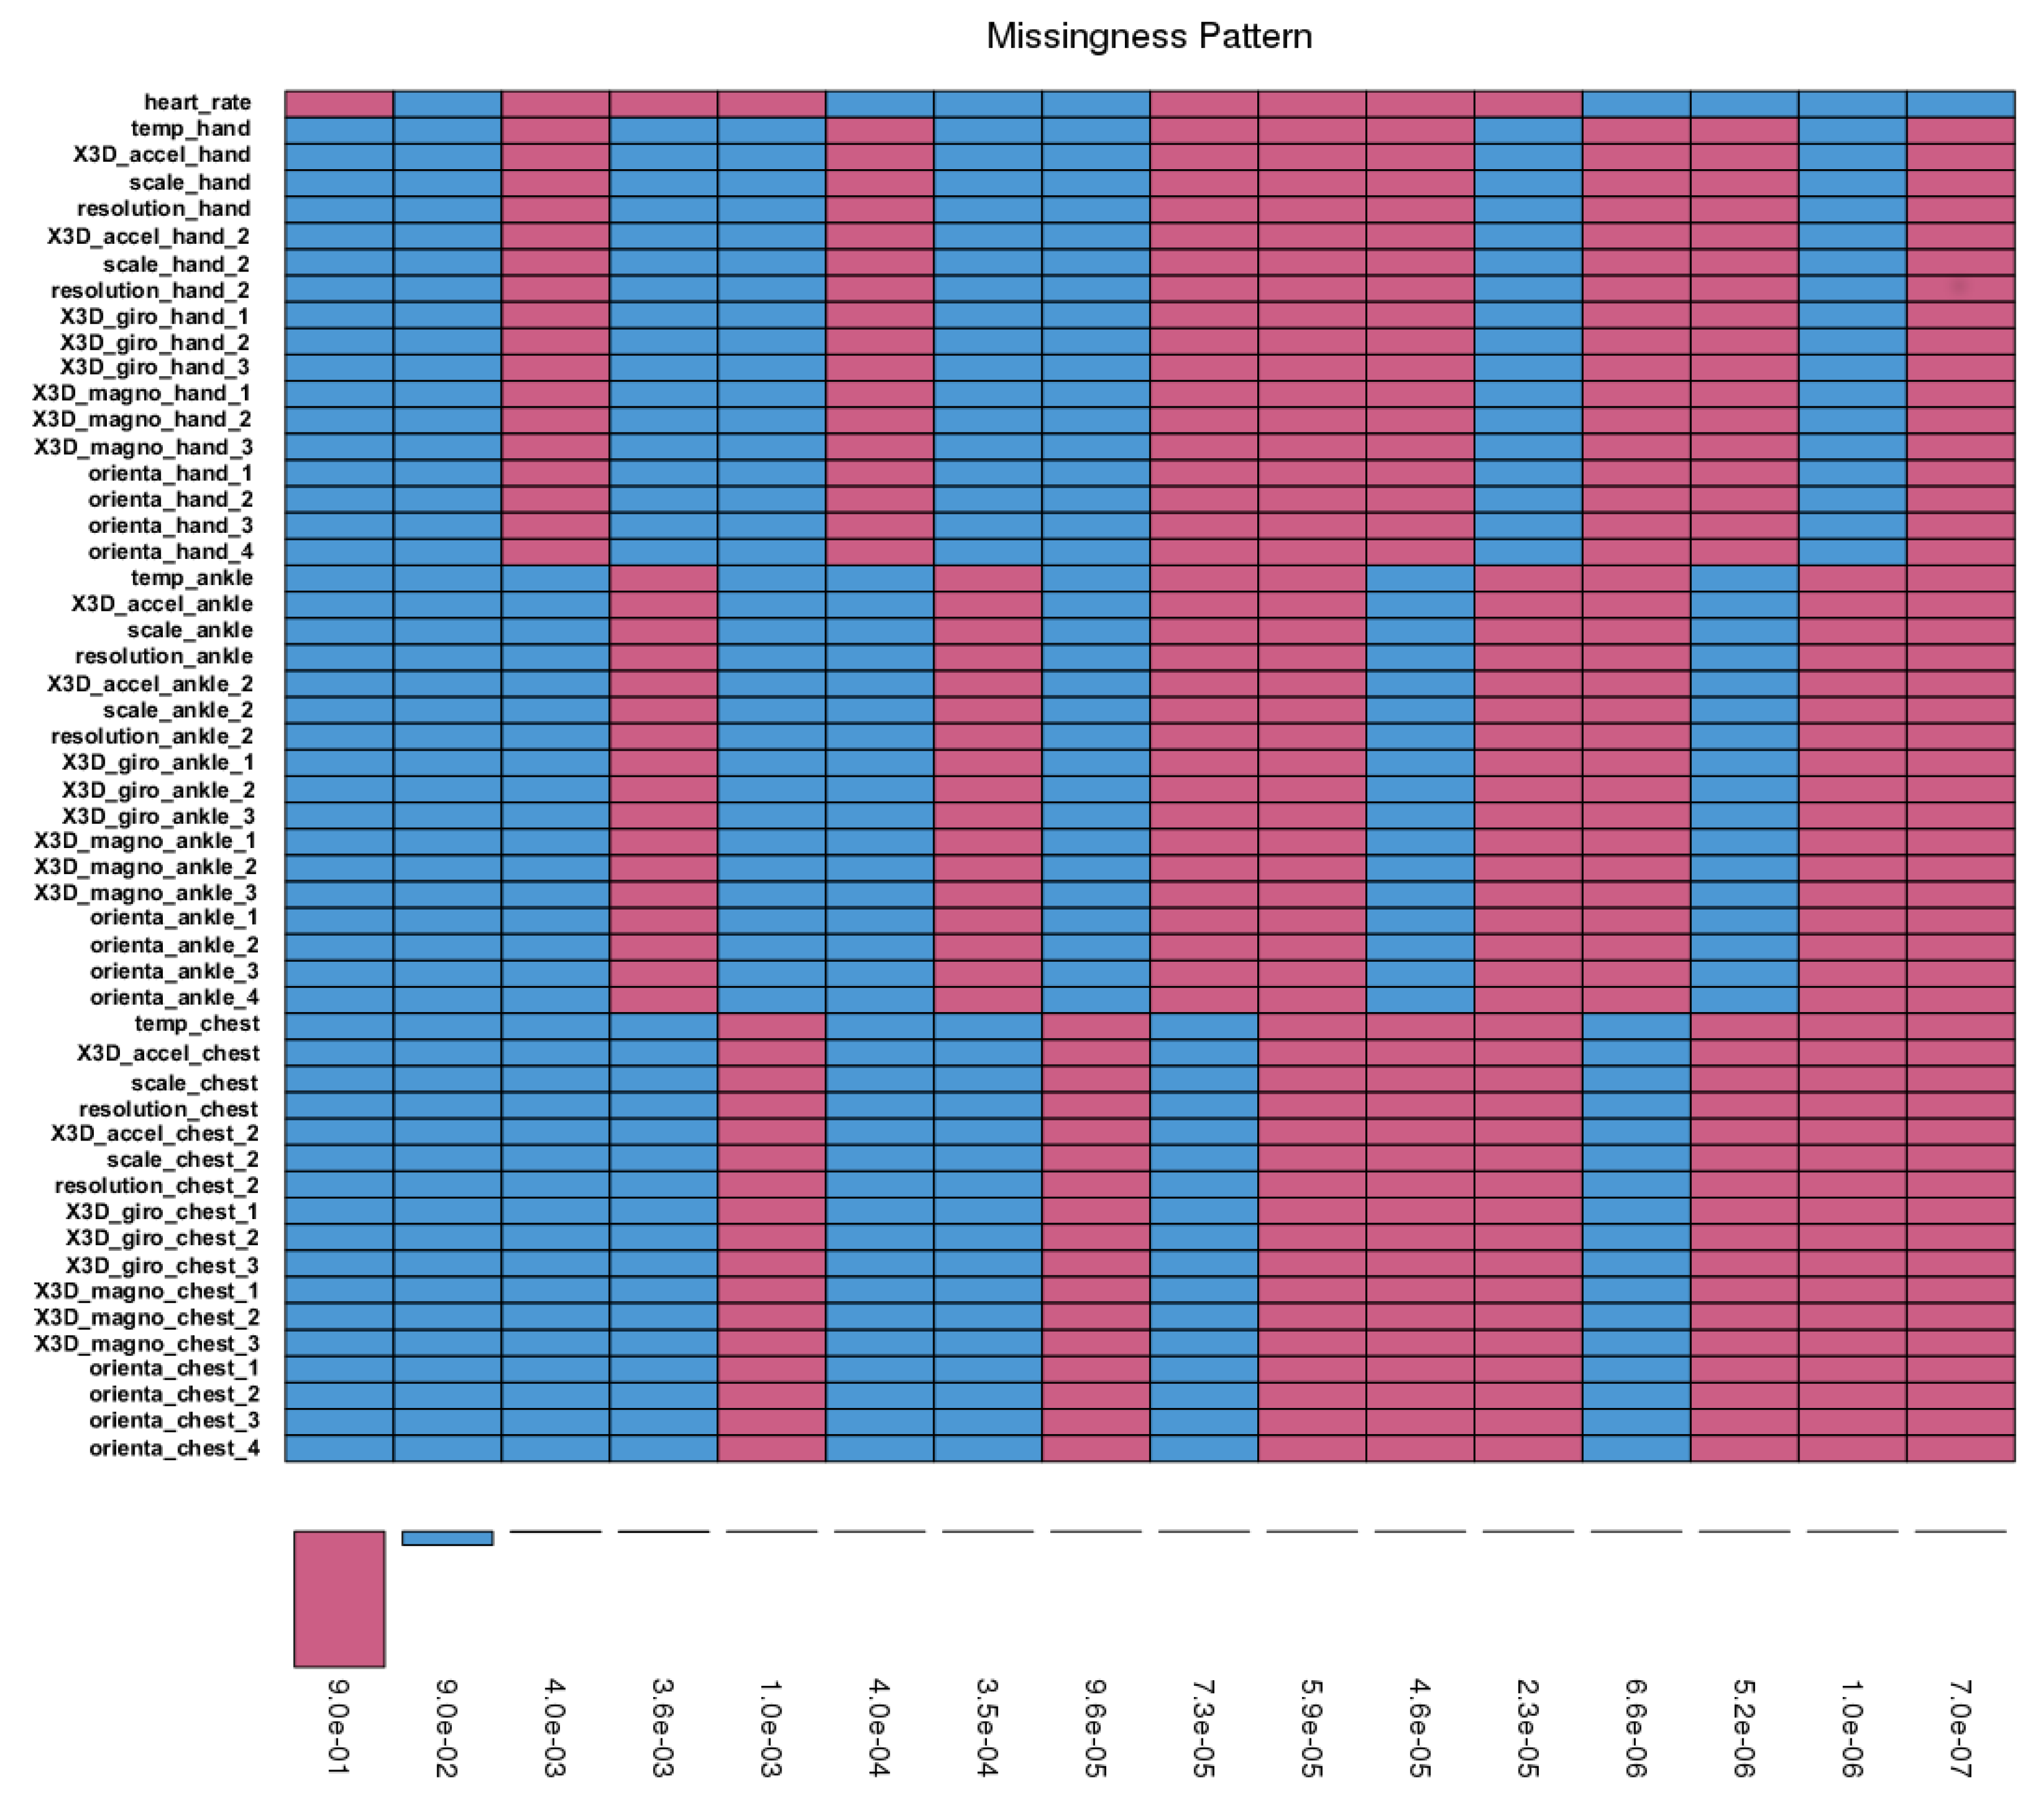
Figure 13.
Box plot of local outliers’ factors.

Figure 14.
Instance distribution per class: balanced vs. imbalanced.

Figure 15.
Top-15 of attributes with highest correlation.
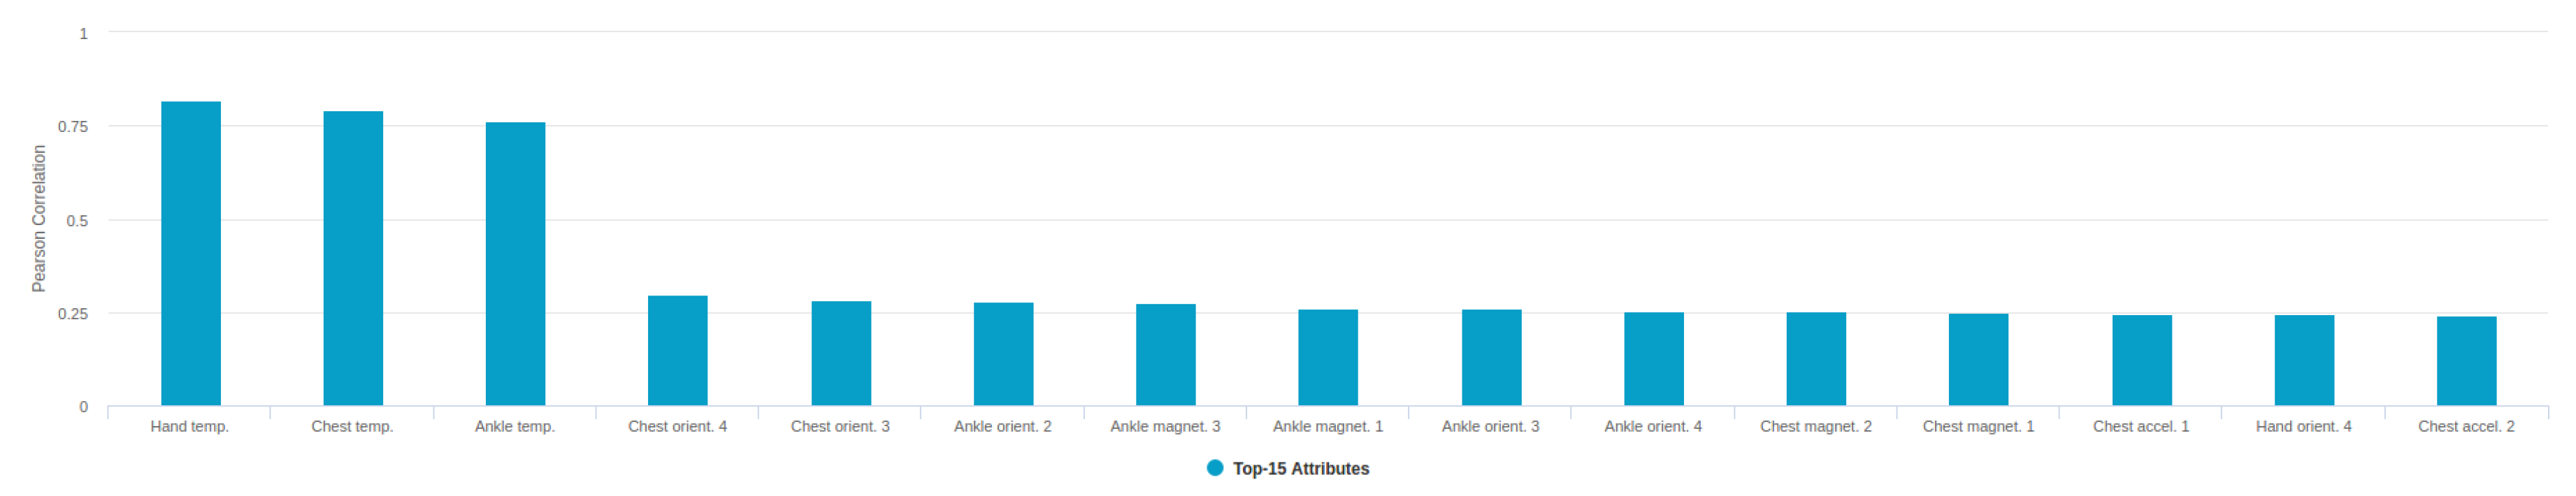
Figure 16.
Data cleaning process for the physical activity monitoring dataset.

Figure 17.
Instance distribution per class: balanced vs. imbalanced.

Table 1.
Data quality (DQ) frameworks.
| DQ Framework | Type | DQ Issues |
|---|---|---|
| [18,25,26,27,28,29] | Databases | Data freshness, integrity constraints, duplicate rows, missing values, inconsistencies, and overloaded table. |
| [30,31,32] | Databases in health systems | Illegible handwriting, incompleteness, unsuitable data format, heterogeneity. |
| [15,33,34,35,36,37] | Conceptual | Missing values, duplicate instances, outliers, high dimensionality, lack of meta-data and timeliness. |
| [38] | ESB | Heterogeneity, incompleteness, timeliness, and inconsistency. |
Table 2.
Data cleaning ontologies.
| Ontology | Type | DQ Issues |
|---|---|---|
| [41,42,43,44] | Databases | Typographical errors, synonymous record problem, missing data, inconsistent data entry format, domain violation, integrity constraint violation, semantic heterogeneity, invalid tuples. |
| [45,46,47] | Databases in health systems | Inconsistency, missing data |
| [47,48,49] | Reservoir models, cancer treatment, genotype-phenotype relationships | Missing values, spelling and format errors, heterogeneity data |
Table 3.
DQ issues in knowledge discovery methodologies.
| Methodology | Methodology Step | Data Quality Issue |
|---|---|---|
| KDD [7] | Noise | |
| Preprocessing, Data Cleaning | Missing Values | |
| Outliers | ||
| Data Reduction, Projecton | High Dimensionality | |
| CRISP-DM [8] | Verify Data Quality | Missing Values |
| Clean Data | Missing Values | |
| SEMMA [39] | Modify | Outliers |
| High Dimensionality | ||
| Data Science Process [40] | Clean Data | Missing Values |
| Duplicates | ||
| Outliers |
Table 4.
Summary of literature review [52] of DQ issues for classification tasks.
Table 4.
Summary of literature review [52] of DQ issues for classification tasks.
| Number of Papers | |||||
|---|---|---|---|---|---|
| Data Quality Issues | IEEE Xplore | Science Direct | Springer Link | Total | |
| Redundancy | 24 | 13 | 10 | 8 | 55 |
| Amount of data | 23 | 15 | 10 | 5 | 53 |
| Outliers | 28 | 10 | 7 | 2 | 47 |
| Missing values | 21 | 14 | 4 | 0 | 39 |
| Heterogeneity | 11 | 3 | 1 | 18 | 33 |
| Noise | 15 | 2 | 2 | 0 | 19 |
| Inconsistency | 9 | 5 | 0 | 2 | 16 |
| Timeliness | 2 | 0 | 1 | 1 | 4 |
Table 5.
Data cleaning tasks.
| Noise Issue | Data Cleaning Task |
|---|---|
| Missing values | Imputation |
| Outliers | Outlier detection |
| High dimensionality | Dimensionality reduction |
| Imbalanced classes | Balanced Classes |
| Mislabelled class | Label correction |
| Duplicate instances | Remove duplicate instances |
Table 6.
Glossary of terms: Classes of Data Cleaning Ontology.
| Name | Synonyms | Acronyms | Description |
|---|---|---|---|
| Dataset | – | – | Raw data used by classification tasks. |
| Attribute | Feature | Att | Feature of the application domain that belongs to dataset. |
| Data Quality Issue | – | DQ Issue | Problems presented in the data. |
| Data Cleaning Task | – | DC Task | Task for solving a data quality issue in the dataset. |
| Balanced Classes | – | – | Approach to address imbalanced classes. |
| Dimensionality Reduction | – | – | Approach to address high dimensional spaces. |
| Imputation | – | – | Approach to address missing values. |
| Label Correction | – | – | Approach to address mislabeled instances. |
| Outliers Detection | – | – | Approach to address outliers. |
| Removing of Duplicate Instances | – | – | Approach to address duplicate instances. |
Table 7.
Concept dictionary of: Imputation, Deletion, Hot Deck Imputation, Imputation Based on Missing Attributes and Imputation Based on Non-Missing Attributes.
Table 7.
Concept dictionary of: Imputation, Deletion, Hot Deck Imputation, Imputation Based on Missing Attributes and Imputation Based on Non-Missing Attributes.
| Class Name | Class Attributes | Instances |
|---|---|---|
| Imputation | – | – |
| Deletion | – | list wise deletion, pair wise deletion |
| Hot Deck Imputation | – | last observation carried forward |
| Imputation Based on Missing Attributes | – | mean, median, mode |
| Imputation Based on Non-Missing Attributes | – | Bayesian linear regression, linear regression, logistic regression |
Table 8.
Concept dictionary of: Outliers Detection, Density, High-Dimensional and Removing of Duplicate Instances.
Table 8.
Concept dictionary of: Outliers Detection, Density, High-Dimensional and Removing of Duplicate Instances.
| Class Name | Class Attributes | Instances |
|---|---|---|
| Outliers Detection | – | – |
| Density | – | dbscan, local outlier factor, optics |
| High Dimensional | – | angle based outlier degree, grid based subspace outlier, sub space outlier degree |
| Removing of Duplicate Instances | – | – |
Table 9.
Concept dictionary of: Balanced Classes, OverSampling, UnderSampling, LabelCorrection, Classification and Threshold.
Table 9.
Concept dictionary of: Balanced Classes, OverSampling, UnderSampling, LabelCorrection, Classification and Threshold.
| Class Name | Class Attributes | Instances |
|---|---|---|
| Balanced Classes | – | – |
| OverSampling | – | random over sampling, smote |
| UnderSampling | – | condensed nearest neighbor rule, edited nearest neighbor rule, neighborhood cleaning rule, one side selection, random under sampling, tome link |
| LabelCorrection | – | – |
| Classification | – | c4.5, k nearest neighbor, support vector machine |
| Threshold | – | entropy conditional distribution, least complex correct hypothesis |
Table 10.
Concept dictionary of: Dimensionality Reduction, Embedded, Filter, Projection and Wrapper.
Table 10.
Concept dictionary of: Dimensionality Reduction, Embedded, Filter, Projection and Wrapper.
| Class Name | Class Attributes | Instances |
|---|---|---|
| Dimensionality Reduction | – | – |
| Embedded | – | – |
| Filter | – | chi-squared test, gain ratio, information gain, Pearson correlation, spearman correlation |
| Projection | – | principal component analysis |
| Wrapper | – | sequential backward elimination, sequential forward selection |
Table 11.
Scenarios for the use of dimensionality reduction approaches.
| Scenario | Method |
|---|---|
| The data analyst has defined the learning algorithm to use in the classification task and he works with high computational resources. | Wrapper |
| The data analyst has defined the learning algorithm to use in the classification task. The computational resources are limited | Embedded |
| The data analyst has not defined the learning algorithm to use in the classification task and he works with low computational resources. | Filter |
Table 12.
Instances of Activity monitoring dataset.
| Subject | Instances |
|---|---|
| 1 | 376,383 |
| 2 | 446,908 |
| 3 | 252,805 |
| 4 | 329,506 |
| 5 | 374,679 |
| 6 | 361,746 |
| 7 | 313,545 |
| 8 | 407,867 |
| 9 | 8477 |
Table 13.
Missing values for subject.
| Subject | Missing Values Percentage | Attributes with Missing Values Percentages > 65% |
|---|---|---|
| 1 | 1.95 | heart_rate: 90.86 |
| 2 | 2.07 | heart_rate: 90.87 |
| 3 | 1.83 | heart_rate: 90.86 |
| 4 | 2.01 | heart_rate: 90.86 |
| 5 | 2.00 | heart_rate: 90.86 |
| 6 | 1.92 | heart_rate: 90.86 |
| 7 | 1.96 | heart_rate: 90.86 |
| 8 | 2.10 | heart_rate: 90.88 |
| 9 | 1.91 | heart_rate: 90.84 |
Table 14.
Candidate outliers based on Tukey Fences and LOF.
| Subjects | Potential Outliers | Lower Limit | Upper Limit |
|---|---|---|---|
| 1 | 50,961 | 0.956 | 1.059 |
| 2 | 38,454 | 0.878 | 1.203 |
| 3 | 20,706 | 0.884 | 1.191 |
| 4 | 27,618 | 0.881 | 1.198 |
| 5 | 32,607 | 0.888 | 1.182 |
| 6 | 31,079 | 0.873 | 1.214 |
| 7 | 25,329 | 0.879 | 1.204 |
| 8 | 34,068 | 0.876 | 1.209 |
| 9 | 830 | 0.875 | 1.206 |
Table 15.
Standard 9-fold cross-validation-accuracy.
| Classifier | Physical Activity Monitoring | Our Approach |
|---|---|---|
| Decision tree (C4.5) | 95.54 | 99.30 |
| Boosted C4.5 decision tree | 99.74 | 99.99 |
| Bagging C4.5 decision tree | 96.60 | 99.60 |
| Naive Bayes | 94.19 | 76.51 |
| K nearest neighbor | 99.46 | 99.97 |
Table 16.
Results of dataset: occupancy detection of an office room.
| Approach | Classifier | Test 1 | Test 2 |
|---|---|---|---|
| Our approach | RF | 94.90 | 99.25 |
| GBM | 94.78 | 96.68 | |
| CART | 97.75 | 98.70 | |
| LDA | 97.90 | 98.68 | |
| Occupancy detection (original attributes) | RF | 95.05 | 97.16 |
| GBM | 93.06 | 95.14 | |
| CART | 95.57 | 96.47 | |
| LDA | 97.90 | 98.76 | |
| Occupancy detection (preprocessing attributes) | RF | 95.53 | 98.06 |
| GBM | 95.76 | 96.10 | |
| CART | 94.52 | 96.52 | |
| LDA | 97.90 | 99.33 |
Table 17.
Precision and AUC of the classifiers processed by DQF4CT and datasets authors of UCI repository—Part I.
Table 17.
Precision and AUC of the classifiers processed by DQF4CT and datasets authors of UCI repository—Part I.
| Dataset | Work | Approach | Classifier | Value (%) | Measure |
|---|---|---|---|---|---|
| Anuran families calls | [99,100,101] | DQF4CT | MLP | 97.6 | Precision |
| Authors | MLP | 99.0 | |||
| Anuran species calls | [99,100,101] | DQF4CT | MLP | 98.9 | Precision |
| Authors | MLP | 99.0 | |||
| Autism spectrum disorder in adolescent | [102] | DQF4CT | RF | 99.8 | Precision |
| Authors | RF | 91.4 | |||
| Autism spectrum disorder in adult | [102] | DQF4CT | C4.5 | 99.1 | Precision |
| Authors | C4.5 | 89.8 | |||
| Autism spectrum disorder in child | [102] | DQF4CT | RF | 99.7 | Precision |
| Authors | RF | 85.6 | |||
| Breast tissue detection | [103] | DQF4CT | LDA | 92.2 | AUC |
| Authors | LDA | 87.3 | |||
| Cardiotocography | [104] | DQF4CT | C4.5 | 98.6 | Precision |
| Authors | C4.5 | 97.6 | |||
| Default of credit card clients | [105] | DQF4CT | KNN | 83.6 | AUC |
| Authors | KNN | 68.0 | |||
| Human activity recognition—smartphones | [106] | DQF4CT | SVM | 98.4 | Precision |
| Authors | SVM | 92.4 | |||
| Ozone level detection 1 h | [107] | DQF4CT | Bagging C4.5 | 94.1 | Precision |
| Authors | Bagging C4.5 | 18.5 | |||
| Ozone level detection 8 h | [107] | DQF4CT | Bagging C4.5 | 91.3 | Precision |
| Authors | Bagging C4.5 | 41.6 | |||
| Phishing detection | [108] | DQF4CT | CART | 83.8 | Precision |
| Authors | CART | 90.0 |
Table 18.
Precision and AUC of the classifiers processed by DQF4CT and datasets authors of UCI repository—Part II.
Table 18.
Precision and AUC of the classifiers processed by DQF4CT and datasets authors of UCI repository—Part II.
| Dataset | Work | Approach | Classifier | Value (%) | Measure |
|---|---|---|---|---|---|
| Polish companies bankruptcy 1 year | [109] | DQF4CT | C4.5 | 77.0 | AUC |
| Authors | C4.5 | 71.7 | |||
| Polish companies bankruptcy 2 years | [109] | DQF4CT | C4.5 | 79.3 | AUC |
| Authors | C4.5 | 65.3 | |||
| Polish companies bankruptcy 3 years | [109] | DQF4CT | C4.5 | 80.5 | AUC |
| Authors | C4.5 | 70.1 | |||
| Polish companies bankruptcy 4 years | [109] | DQF4CT | C4.5 | 80.2 | AUC |
| Authors | C4.5 | 69.1 | |||
| Polish companies bankruptcy 5 years | [109] | DQF4CT | C4.5 | 83.4 | AUC |
| Authors | C4.5 | 76.1 | |||
| Portuguese bank telemarketing | [110] | DQF4CT | MLP | 92.6 | AUC |
| Authors | MLP | 92.9 | |||
| Predicting phishing websites | [111] | DQF4CT | MLP | 98.0 | Precision |
| Authors | MLP | 94.0 | |||
| Ready biodegradability of chemicals | [112] | DQF4CT | Boosting C4.5 | 95.5 | AUC |
| Authors | Boosting C4.5 | 92.1 | |||
| Risk factors cervical cancer | [113,114] | DQF4CT | C4.5 | 93.2 | AUC |
| Authors | C4.5 | 53.3 | |||
| Seismic hazard prediction in coal mines | [115] | DQF4CT | CART | 93.7 | Precision |
| Authors | CART | 87.0 | |||
| Vertebral column diagnostic | [116,117] | DQF4CT | MLP | 85.5 | Precision |
| Authors | MLP | 83.0 | |||
| Vertebral column injury | [116,117] | DQF4CT | SVM | 88.2 | Precision |
| Authors | SVM | 82.1 | |||
| Voice rehabilitation treatment | [118] | DQF4CT | SVM | 88.1 | Precision |
| Authors | SVM | 74.8 |
© 2018 by the authors. Licensee MDPI, Basel, Switzerland. This article is an open access article distributed under the terms and conditions of the Creative Commons Attribution (CC BY) license (http://creativecommons.org/licenses/by/4.0/).
Share and Cite
MDPI and ACS Style
Corrales, D.C.; Ledezma, A.; Corrales, J.C. From Theory to Practice: A Data Quality Framework for Classification Tasks. Symmetry 2018, 10, 248. https://doi.org/10.3390/sym10070248
AMA Style
Corrales DC, Ledezma A, Corrales JC. From Theory to Practice: A Data Quality Framework for Classification Tasks. Symmetry. 2018; 10(7):248. https://doi.org/10.3390/sym10070248
Chicago/Turabian StyleCorrales, David Camilo, Agapito Ledezma, and Juan Carlos Corrales. 2018. "From Theory to Practice: A Data Quality Framework for Classification Tasks" Symmetry 10, no. 7: 248. https://doi.org/10.3390/sym10070248
Note that from the first issue of 2016, this journal uses article numbers instead of page numbers. See further details here.