Advanced Classification of Coffee Beans with Fatty Acids Profiling to Block Information Loss


1
Department of Mechatronic Engineering, Huafan University, New Taipei 223, Taiwan
2
Tea Science Department, Zhejiang University, Hangzhou 310058, China
3
Department of Biotechnology, Mingchuan University, Taoyuan 333, Taiwan
*
Author to whom correspondence should be addressed.
Symmetry 2018, 10(10), 529; https://doi.org/10.3390/sym10100529
Submission received: 7 September 2018
/
Revised: 17 October 2018
/
Accepted: 18 October 2018
/
Published: 22 October 2018
Abstract
:Classification is a kernel process in the standardization, grading, and sensory aspects of coffee industries. The chemometric data of fatty acids and crude fat are used to characterize the varieties of coffee. Two category classifiers were used to distinguish the species and roasting degree of coffee beans. However, the fatty acid profiling with normalized data gave a bad discriminant result in the classification study with mixed dimensions in species and roasted degree. The result of the predictive model is in conflict with the context of human cognition, since roasted coffee beans are easily visually distinguished from green coffee beans. By exploring the effects of error analysis and information processing technologies, the lost information was identified as a bias–variance tradeoff derived from the percentile normalization. The roasting degree as extensive information was attenuated by the percentile normalization, but the cultivars as intensive information were enhanced. An informational spiking technique is proposed to patch the dataset and block the information loss. The identified blocking of informational loss could be available for multidimensional classification systems based on the chemometric data.
1. Introduction
Various classification techniques are widely used in the identification of cultivars or species, as well as in the standardization and the grading of products for commercial and agricultural production [1,2,3]. Classification is also a kernel process for accurate decision-making after measurements in observation, survey, clinical diagnosis, and industrial quality management [4,5,6,7].
Green coffee is one of the most traded agricultural commodities in the world. The species of commercial coffee consist almost entirely of Coffea arabica (Arabica) and Coffea canephora (Robusta). Arabica is generally more prominent and expensive in the market [8].
Green beans of both species can be distinguished by featured appearances and different compositions that affect the sensory qualities of coffee products [5]. However, most commercial roasted and ground coffees are actually blends of the two species. The molecular genetics approach was applied to differentiate two coffee species in green beans for the quantification of any adulteration of Arabica with Robusta beans [9]. After roasting and grinding, more advanced analytical methods are required as indicators of subtle differentiation between the coffee species [10] because these biological features would be diminished after roasting at high temperature (>200 °C) [11].
Within this realm, several works have successfully distinguished the coffee varieties by using their chemometric data, such as amino acids, metals, sucrose, organic acids, and sterols [6,12,13]. However, acquisition of measured data should be readily available, assured, and inexpensive for a good predictive model. Otherwise, a good predictor derived from measured data must be associated with sensory evaluations [14,15,16,17]. The sensory descriptors could also be established using regression approaches based on the chemometric data [3,10,18]. Fatty acid profiling is most often evaluated to achieve discrimination among the varieties of coffee beans because the sensory qualities of coffee are complicated and affected by multiple factors [19].
Different types of compositional data have been applied to characterize green beans (cultivars as a nominal variable) or investigate the roasting degree of coffees (in a ratio scale). The first two principal components of visible micro-Raman spectra reveal different chlorogenic acid and lipid compositions when comparing Arabica and Robusta green coffee [20]. Dong et al. reported the effect of different drying techniques on the molecular composition of green Robusta [21]. Wei et al. used an NMR-based prediction model to evaluate roasted coffee bean extracts [22]. Han et al. and Frank et al. used specific chemical compounds to assess the toxic risk [23] and bitter taste [24] in roasted coffees, respectively. Romano et al. used the specific fatty acids ratio to determine the relative amounts of Arabica and Robusta in a green coffee blend [1]. Martin et al. obtained a classification result with residual errors for green and roasted Arabica and Robusta coffees by using linear discriminant analysis [25]. Recently, Dias and Benassi proposed a two-step discrimination among coffee species and roasted degrees carried out using heat-labile compounds [11]. All of these studies demonstrate that multidimensional discrimination would be a challenging task in classification.
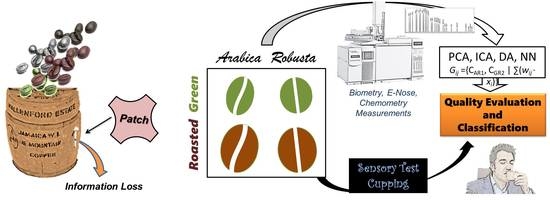
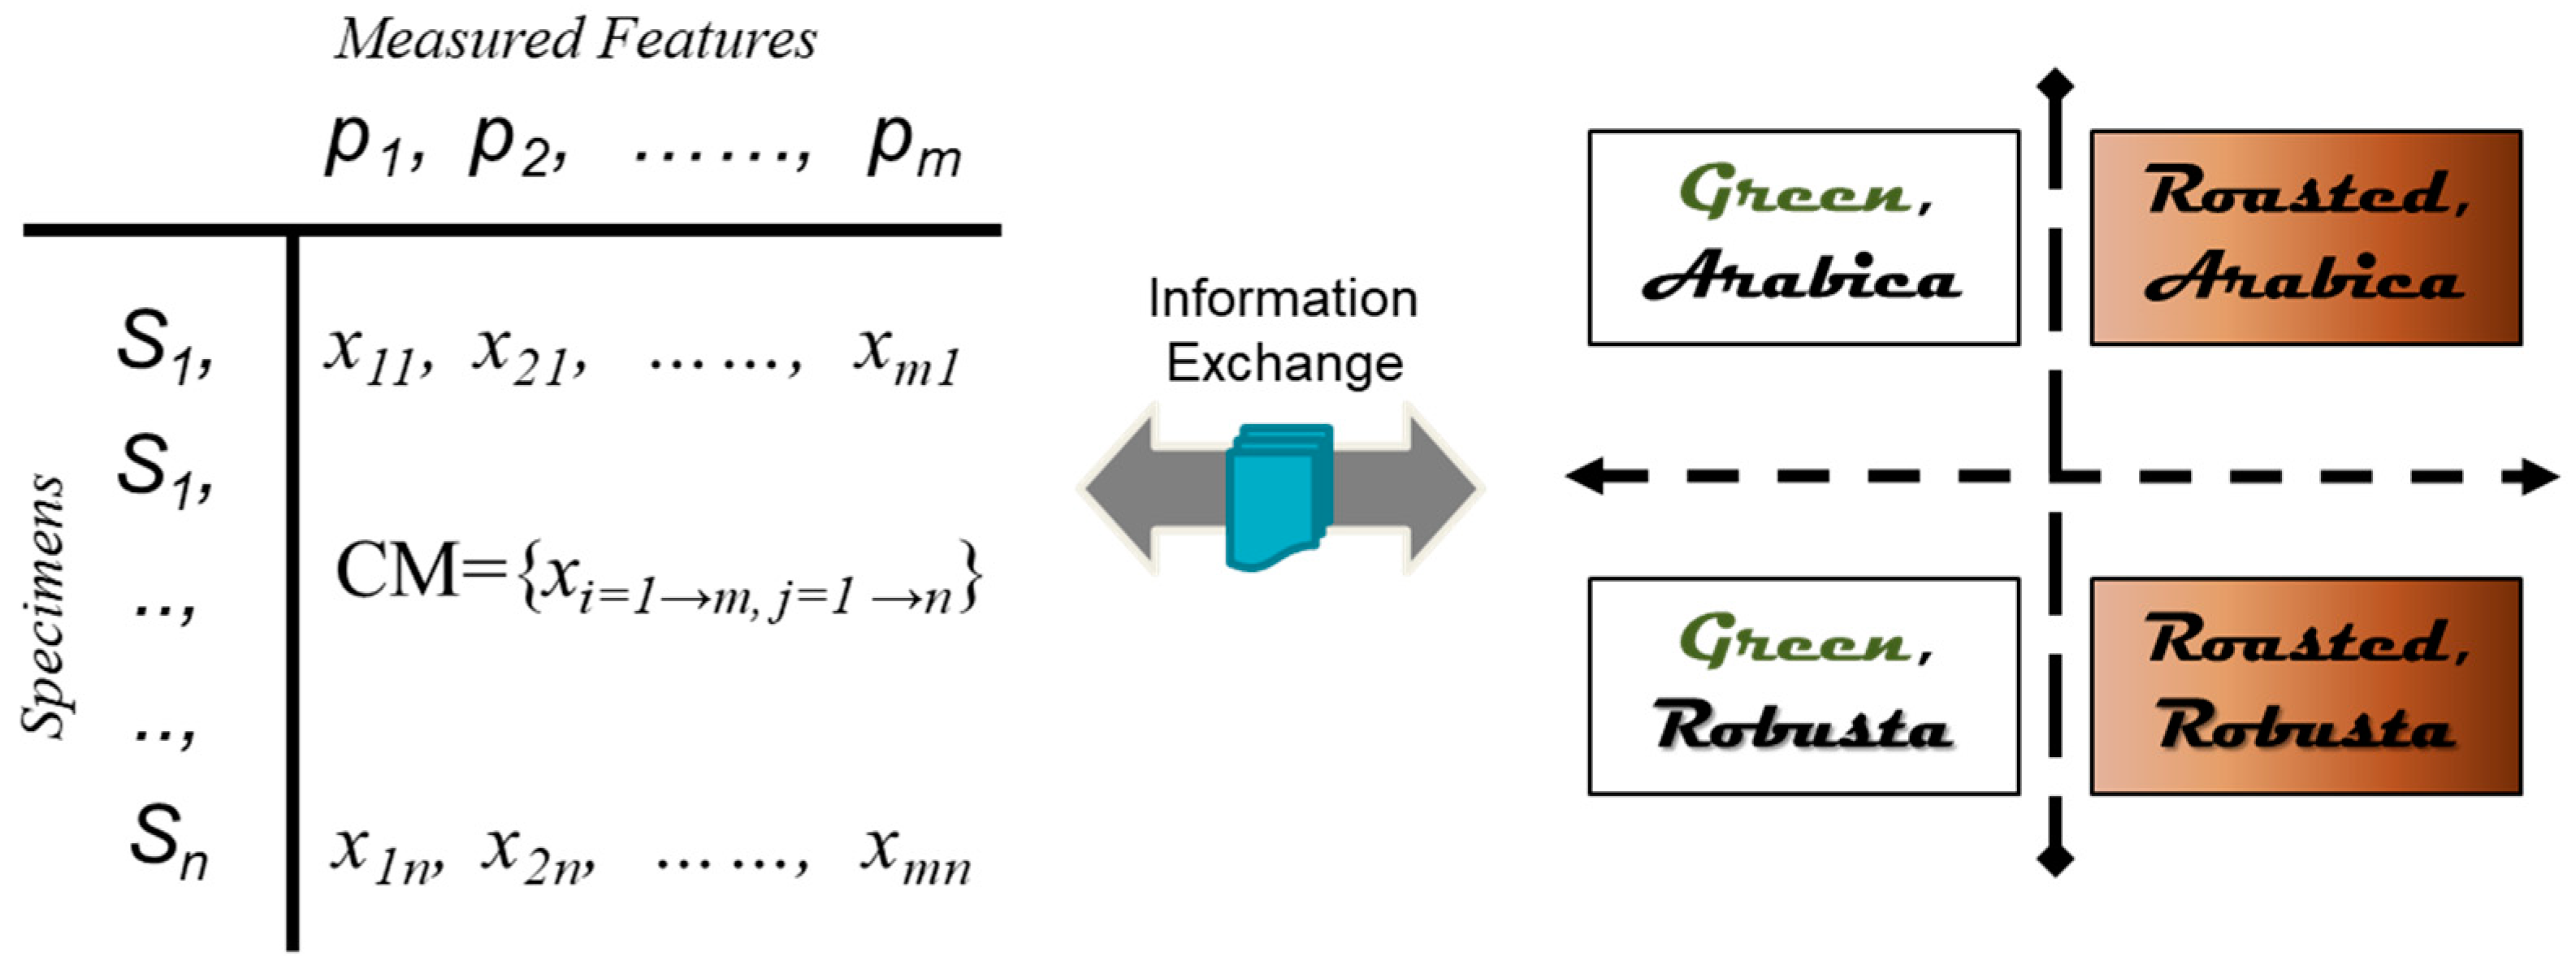
As shown in Figure 1, chemometric protocols applied to the fatty acid composition data of specimens provide an approach to extract information on coffee quality. In this study, a discriminant system was developed with a learning model to achieve predictive functions. Two linear classifiers—LCRG (roasted, green) and LCAR (Arabica, Robusta)—are used to establish four independent groups. Thus, any one specimen (Si) can be placed into one of the groups, as the logic expression Si {(Roasted ∪ Green) ∩ (Arabica ∪ Robusta)} indicates. The performances of the classifiers with chemometric data were evaluated and validated by their correctness.
However, information loss causing mislabeling was found when the reliability of the data processing was evaluated. The LCRG operator has poorer accuracy than LCAR, showing that the result of the prediction model is in conflict with the context of human cognition, since roasted coffee beans are easily distinguished from the green ones by their brown color. A similar bias–variance dilemma was also observed in the early classification study [25]. The bias–variance tradeoff has also been applied to explain the effectiveness of heuristics in human learning, even if it is a problem in supervised learning.
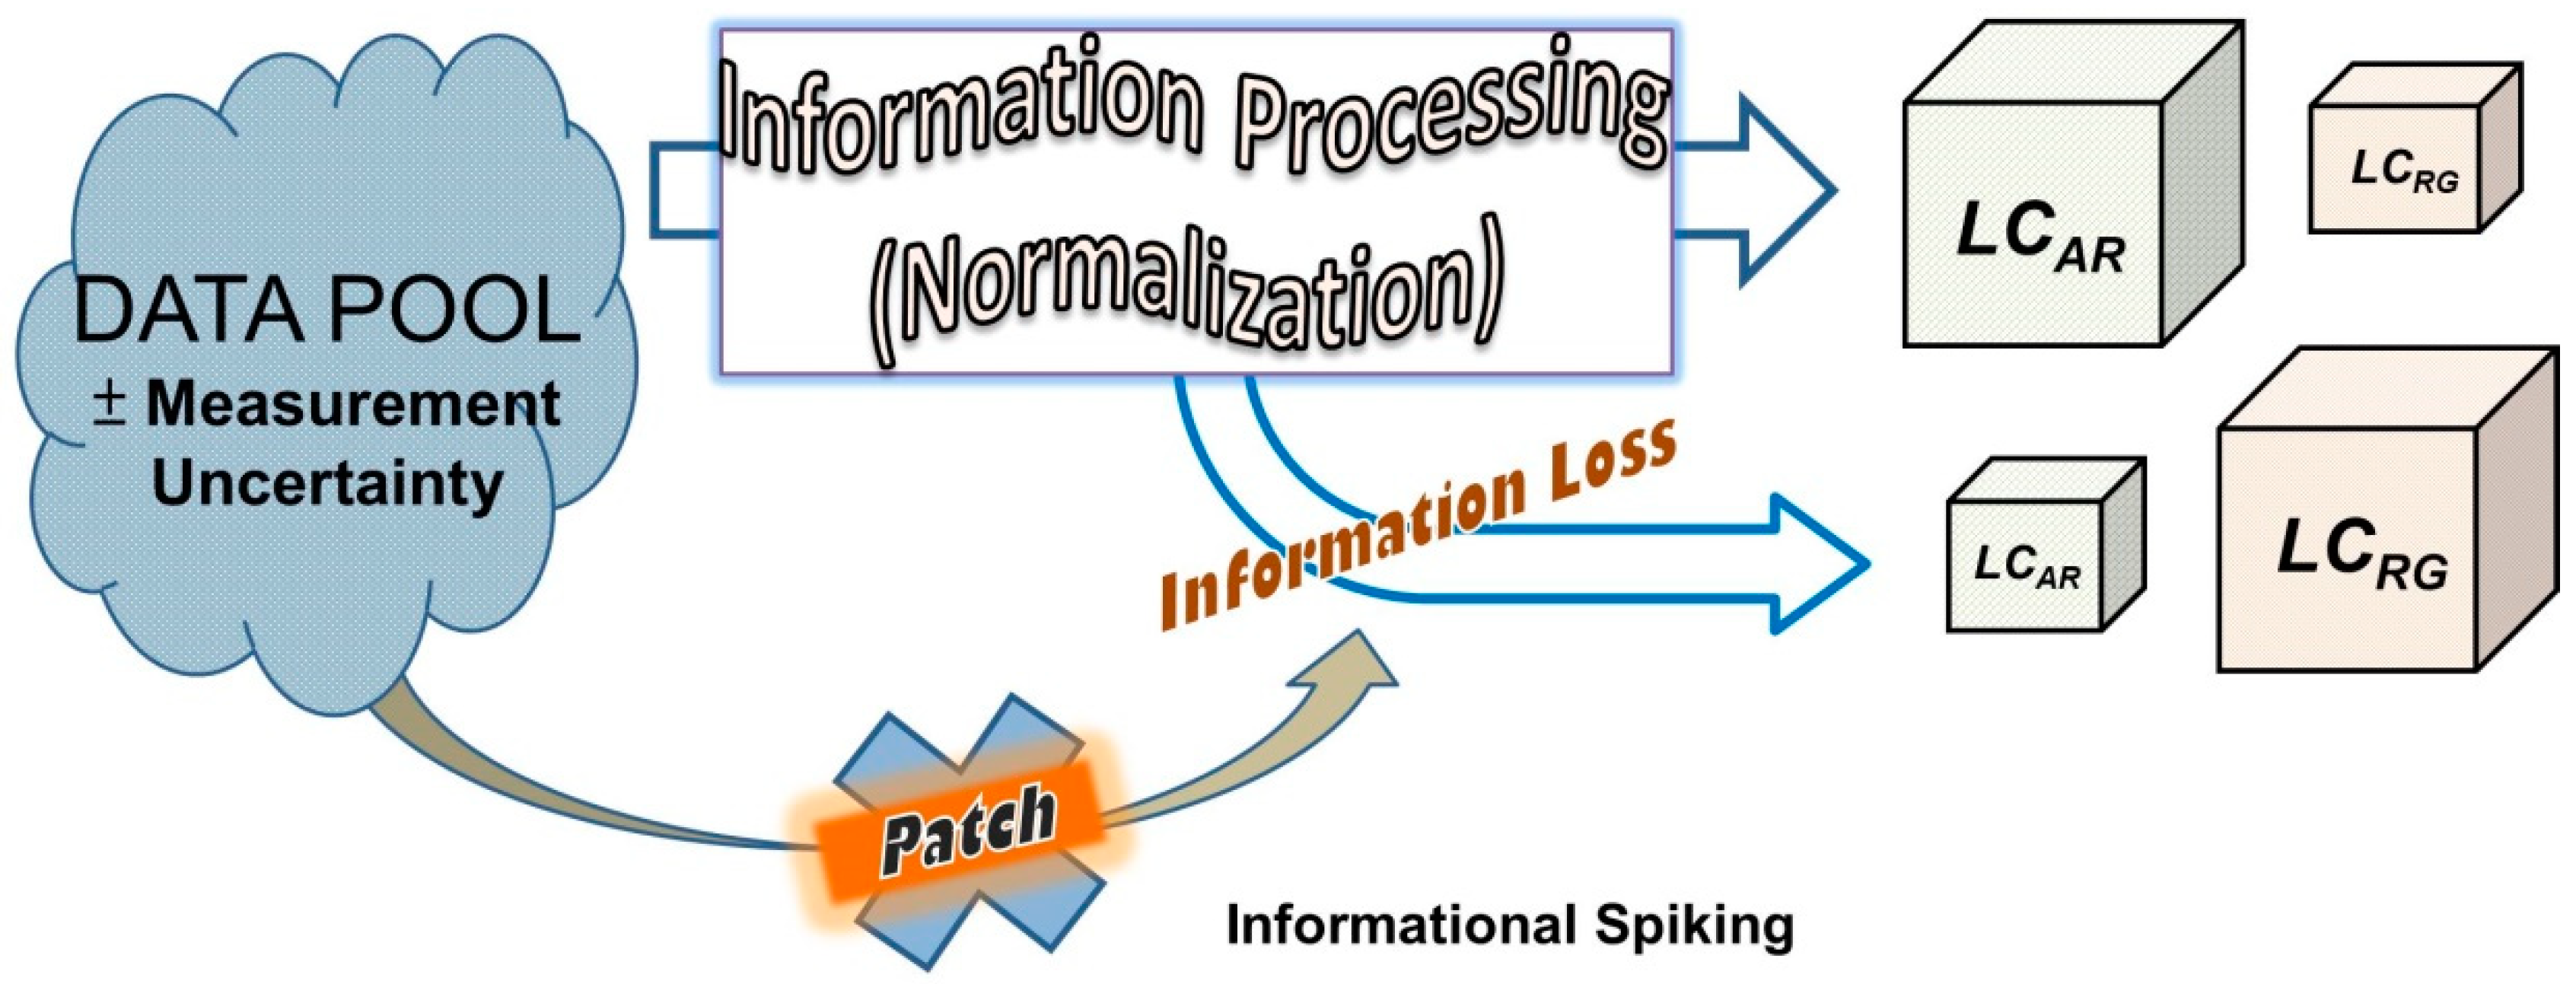
As technology progresses, classifications are used across every discipline, and the data structures are evolving into a more complex form [26,27]. In this study, the source of the information loss was identified as an obvious pattern of classification errors derived from percentile normalization. Further, the accuracy of the classification system would be successfully enhanced by patching of the breach using other featured data with the same properties as the lost information, as shown in Figure 2.
The use of regression analysis aims to find independent latent variables for advanced classification. Simultaneously, some leaks would be produced by the structural normalization of the dataset. Thus, the data integrity and quality must be considered in a preprocessing phase before extracting knowledge from raw data [28]. The preprocessing phase takes over half of the knowledge discovery process. Our study demonstrates informational extraction achieved based on the patching of data structures in a multimodal classification.
2. Materials and Methods
2.1. Sample Collection and Preparation
Green coffee beans of Arabica and Robusta cultivars were purchased from coffee suppliers who guaranteed the origins and were verified by our experts. Portions of green beans were roasted and collected for further analysis and cupping with reliable and traceable filing.
The roasting and grinding levels of these coffee beans were arbitrary and without specific requirements. We expect that the samples were similar to those obtained in daily life. All of the coffee beans, including green and roasted beans, were stored under steady conditions to avoid oxidation or compositional changes. Then, 200 g of each portion of ground coffee beans (powdered) was sampled and labelled as a specimen in this study.
2.2. Lipid Extraction and Crude Fat
The Soxhlet solid–liquid extraction method [29] (Association of Official Analytical Chemists (AOAC) Official Method 2003.05/920.39) was used to extract the lipid fraction from the ground coffee beans. All of the glass apparatus were rinsed using petroleum ether and dried in an oven at 102 °C. Ten grams of ground coffee sample were weighed and placed in the thimble. A quantity of 90 mL of petroleum ether was placed in a 150 mL round-bottom flask. We continued the extraction process for 5 h, and a defatted residue was obtained after distillation. Almost all the solvent was collected and placed in the oven and then removed using a desiccator. The weight of the sample was then noted. As a result, the crude fat (%) = (W − T)/S × 100% was calculated, where W, T, and S are the weights of the thimble with ether extract, the empty thimble, and the sample, respectively.
2.3. Preparation of Fatty Acid Methyl Esters
Fatty acid methyl esters (FAMEs) were prepared by a method modified from the IUPAC standard method [30,31]. Briefly, 200 mg of crude fat (lipid extraction) in a screw-capped glass tube was hydrolyzed with 1 mL of 1 M KOH in 70% ethanol (Sigma–Aldrich, St. Louis, MO, USA) at 90 °C for 1 h. The reaction mixture was acidified with 0.2 mL of 6 M HCl, and then 1 mL of water was added. The free fatty acids (FAs) were extracted with n-hexane to be methylated with 1 mL of 10% BF3 in methanol at 37 °C for 20 min. A quantity of 3 mL of 6% potassium carbonate solution was added to the solution, and then FAMEs were extracted with 1 mL of hexane. Of the n-hexane top layer, 200 μL was transferred into a vial and crimped.
2.4. Fatty Acids Profile by GC–FID Analysis
The FAMEs were determined using gas chromatography (TRACE GC Ultra, Thermo Fisher Scientific, Rodano-Milan, Italy) equipped with a flame ionization detector (FID) and liquid auto-injector (AI-3000, Thermo Fisher Scientific, Rodano-Milan, Italy). Separation was carried out in an Rtx-WAX capillary column (60 m × 0.53 mm id × 1 μm, Resteck Corporation, Bellefonte, PA, USA). Injection volume was 1 μL in split mode, and inlet temperature was 250 °C. Nitrogen was used as the carrier gas (flow rate of 1.2 mL/min), and the oven temperature was programmed as follows: initial temperature 50 °C, held for 2 min; then increased by 10 °C/min to 280 °C, where it was held for 5 min. All data of FAMEs were recorded and quantitatively integrated using Chrom-Card data system (version 2.3, Thermo Fisher Scientific, Rodano-Milan, Italy) with an external standards calibration curve.
In addition to this, the individual peaks of FAMEs were also identified using Agilent gas chromatography and mass spectrometric detector (models 6890N GC and 5973 MSD, Agilent Technologies, Santa Clara, CA, USA) under the same chromatographic conditions. Scan acquisition (m/z 45-550) for MSD in the EI mode was carried out using HP Chemistation B.04.03 (Agilent Technologies, Santa Clara, CA, USA) and the NIST 17 Mass Spectral Library (Scientific Instrument Services, Ringoes, NJ, USA).
2.5. Statistics Software and Calculations
Statistical calculations and analysis were performed using Excel 2010 (Microsoft Corporation, Santa Rosa, CA, USA) and PASW Statistics 18.0.3.25 (International Business Machines Corporation, Armonk, NY, USA). The normalized and standardized data are re-calculated to a new data matrix. The discriminant analysis was carried in the direct mode, and all variables passing the tolerance criteria (0.001) were entered simultaneously with equal prior probabilities. The discriminant displays a max variance pattern (and structure) matrix without rotated transformation.
3. Results and Discussion
3.1. Fatty Acids Analysis by GC–FID
Fats and oils are important ingredients in many foods. Fat contributes to the texture, flavor, mouthfeel, and aroma of foods. The fatty acid composition was determined by the GC–FID method with a calibration curve after methyl esterification and extraction. All quantitative data are listed in Table 1.
Regression analysis is widely used to estimate the relationships among variables for prediction models in the field of machine learning [32]. The performance of regression analysis methods in practice depends on the form of the data generating process and on the probability distributions of the dependent variables around the prediction of the regression function.
The majority of the composition of coffee beans is contributed by the fatty acids C18:2 and C16:0, and the smaller parts (<1%) were accounted for by C20:1 and C22:0. While the absolute measurement uncertainties are a constant value, the fatty acids of the smaller parts would have greater relative uncertainty than would those occurring in larger proportion. For instance, the relative deviation (RSD) of fatty acid C20:1 is 13.7%, greater than the 0.126% of fatty acid C18:2, since the limit of quantitation (LOQ) is 50 ppm (0.05 mg/g).
As the featured variables, the distributions of fatty acids were compared to fit the normally distributed populations in Figure 3. However, highly symmetrical variances are not sensitive to the varieties of coffee beans. The dataset was not directly used as input variables for the classification algorithm. The similar distributions among these variables imply that the variances of fatty acids are constrained patterns within the dataset. This pattern may refer to the relationship of continuous variables, as opposed to the discrete variables used in classification.
3.2. Normalization (Percentile) and Standardization (Z-Score)
Many data processing techniques were utilized to reformat the data framework as normalized, including percentages, standardization (Z-score), logarithms, and inverse measured data. Generally, normalization removes the physical units of a measured dataset to make it a dimensionless dataset.
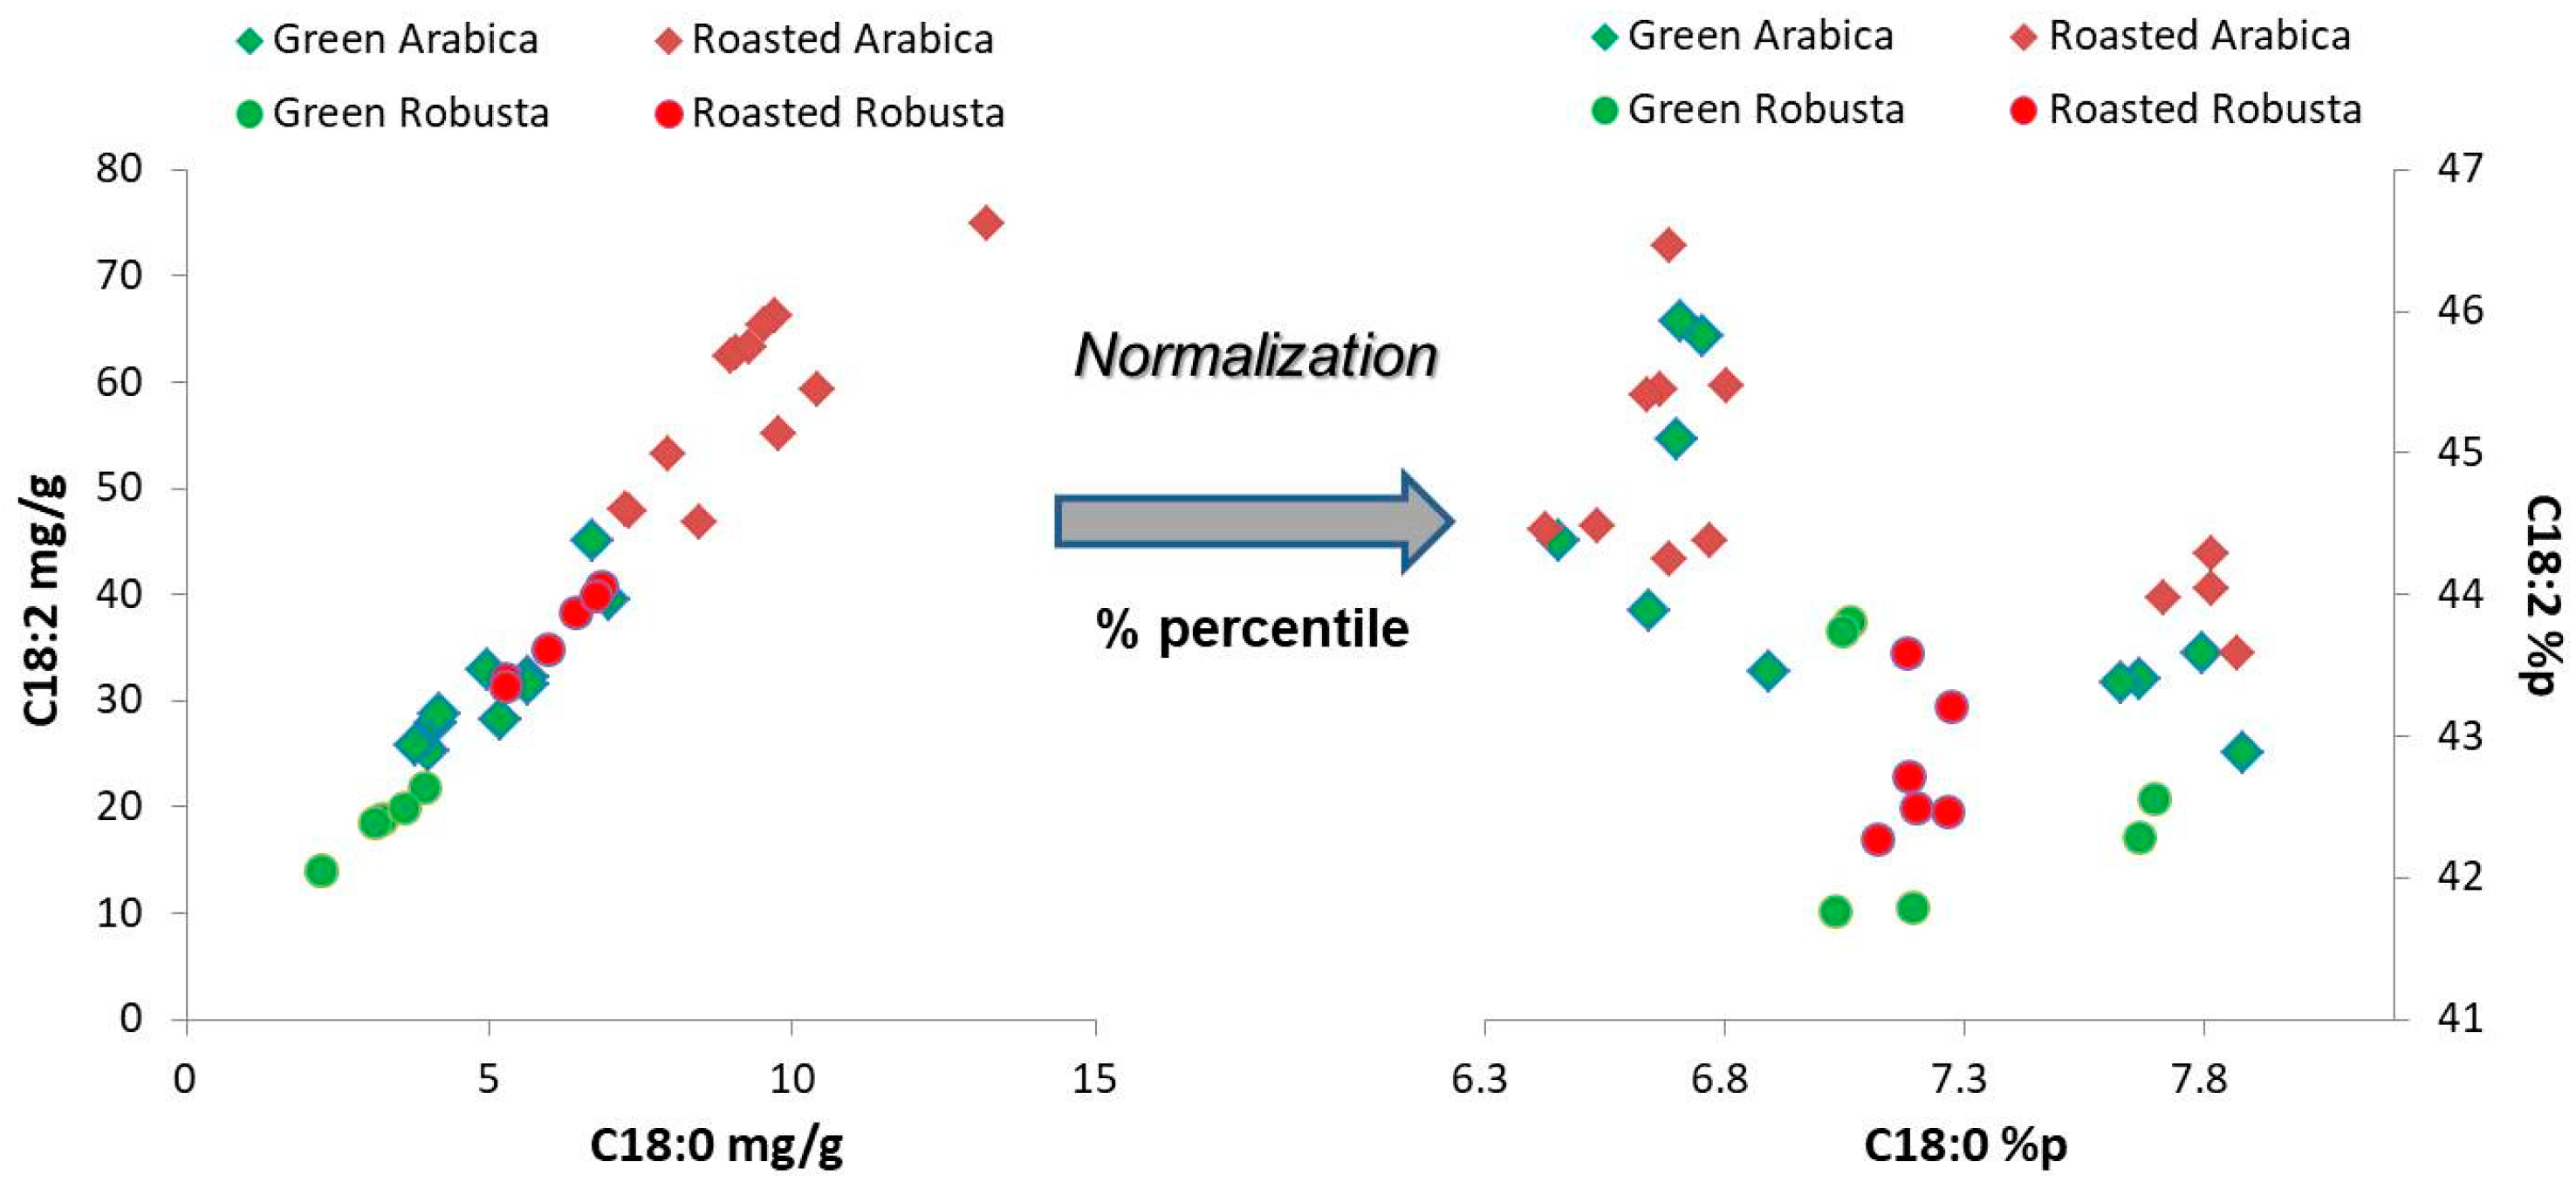
The fatty acids C18:0 and C18:2 are used to describe the structural characteristics of the system in Figure 4. The correlation with the original measured data has a strong linearity, which is 5 times the absolute quantities of fatty acids. The groups of roasted Arabica and green Robusta are at the ends of the line, and the other two groups are superposition in the middle zone of the line. The high correlation of two fatty acids implies the variables dependence in the quantitative data. Thus, the composition of fatty acids could be considered as an intensive property for individual specimens.
After normalization by percentiles, the percentile data shows a scattering pattern without an obvious correlation in six times the dimensional quantities of the fatty acids. The results indicate that the structures of the original dataset are ordered and become disrupted and more varied by normalization. Percentile normalization can enhance the variability of quantitative data, but it also amplifies the uncertainty (bias) to add on to the variances at the same time.
3.3. Discrimination Analysis
The raw data of pooled specimens were calculated using the linear classifiers (LCRG and LCAR) to obtain the scores dFRG and dFAR, respectively. Further, the discriminant scores were scattered into the groups (quadrants), as shown in Figure 5A. The target of classification was successfully achieved by the linear discriminant algorithm. The percentile data were also given scores by the linear classifiers, and the resulting scatter plot is shown in Figure 5B.
It is worth noting that there are five cases of error in the classification, which are noted in the confusion matrix in Table 2. The classifier of coffee species (LCAR) has perfect correctness, but the classifier of roasting degree (LCRG) only has 85% correctness. The classification errors in roasting degree occur in two ways: green mistaken as roasted or roasted mistaken as green. The LCRG has poorer discriminability than the LCAR in the training model; this is in conflict with the predictive model using human cognition.
In sensory testing, it is easier to differentiate the roasting degrees than to distinguish coffee species. Therefore, some information associated with the roasting categories must be attenuated in the percentile normalization. The dimensional reduction of the dataset matrix, which is rescaled as a reference standard, perhaps causes the information loss. For instance, the freedom of the eight fatty acids in percentage is 7 because the total composition must be 100%.
Discriminant analysis deals with the taxonomic classification (supervised learning) so that the cases are partitioned into the labeled groups. Partial least squares discriminant analysis has demonstrated great success in modelling high-dimensional datasets for versatility. Despite that, the user needs to optimize a wealth of parameters before reaching reliable and validated outcomes [26]. Unlike in principle component analysis and cluster analysis, the algorithms are used to explore unknown patterns in prior (unsupervised) learning.
3.4. Information Loss in Data Processing
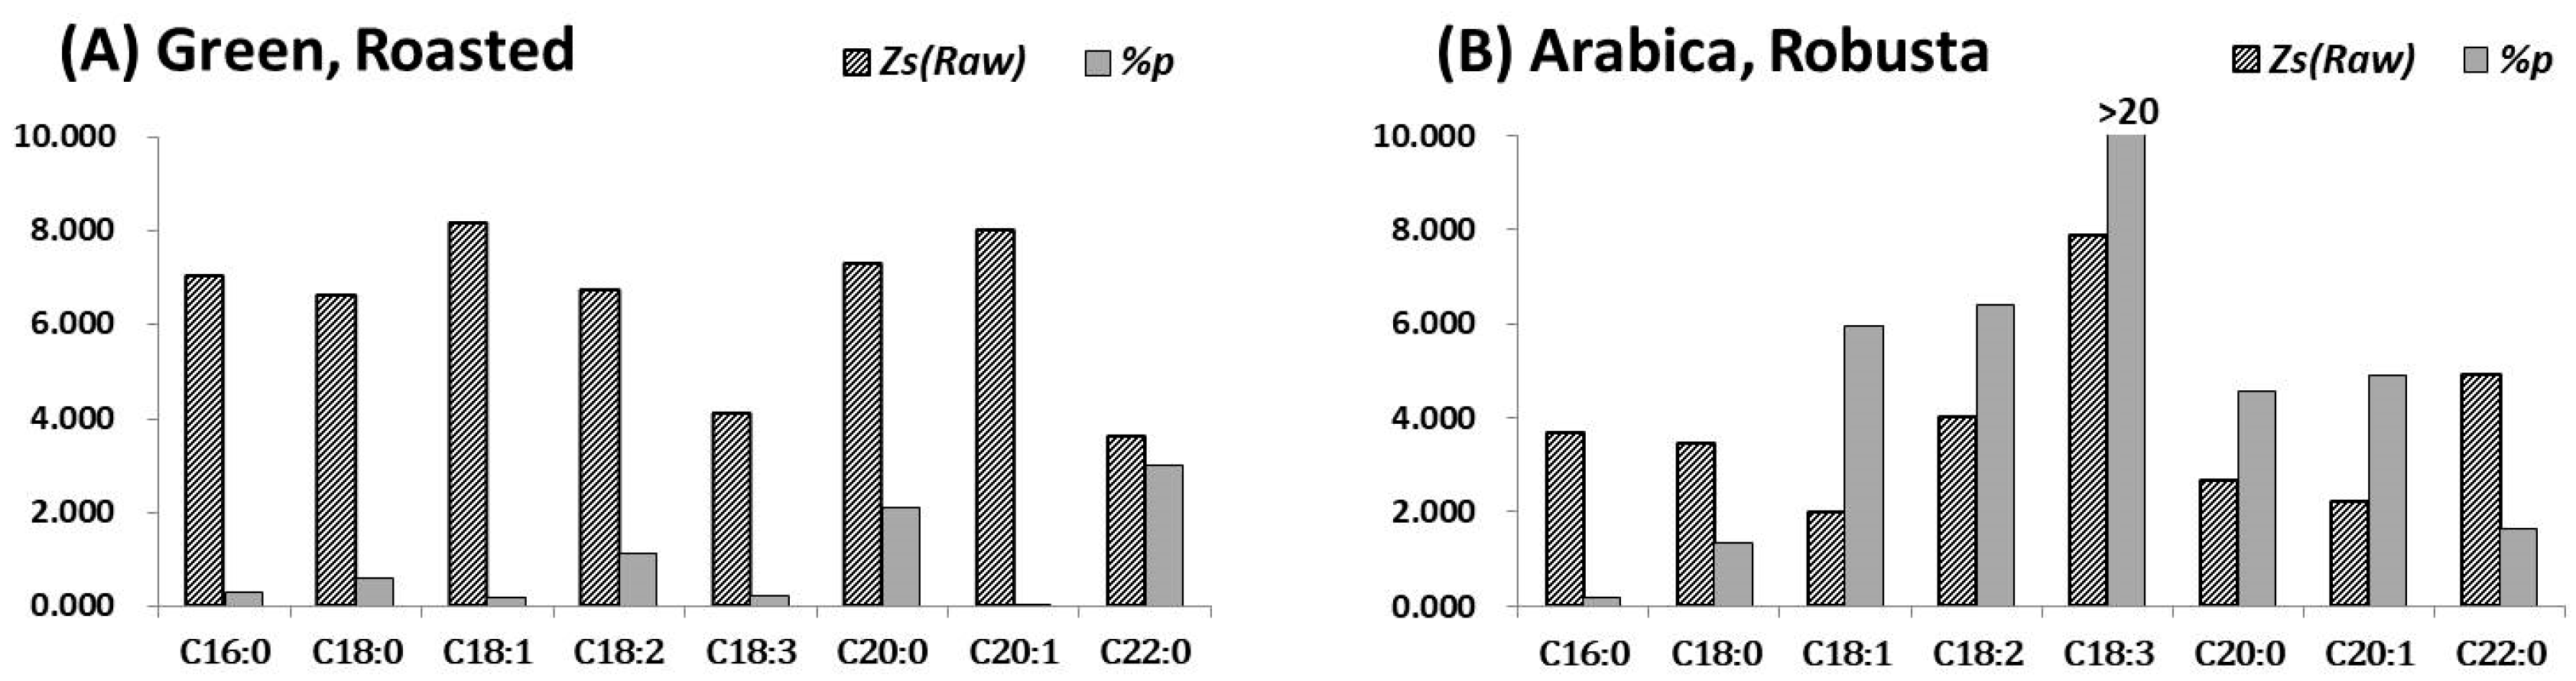
For supervised learning, the training dataset was reviewed according to the distributions of labeled categories. We examined the differences in labeled categories for each classifier using Student’s t-test, as shown in Figure 6. Interesting, the Z-scored data differed significantly for discrimination of green and roasted coffees, which is the function of LCRG. However, the percentile data suppressed the significant difference between the Arabica and Robusta coffees, as shown in Figure 6A. Only the percentile data of fatty acids C20:0 and C22:0 have significance (t value > 2) at the 95% confidence level because the fatty acid C22:0 is the smaller part in the composition of fatty acids with average levels less than 1.0 %, as shown in Figure 3. The bias–variance tradeoff is a serious problem in this classification.
Otherwise, the Z-scored data have significance for the discrimination of Arabica and Robusta coffees, and the percentile data are enhanced in significance for fatty acids C18:1, C18:2, C18:3, C20:0, and C20:1 in Figure 6B. Thus, the percentile normalization is better suited to distinguishing the Arabica and Robusta coffees.
These results demonstrate that the discrimination of roasting degree is dominated by the extensive property of the raw data, and the discrimination of coffee species is dominated by the intensive property of the percentile data, as it is relative scale invariant. The majority of the lost information has an extensive property within the raw data. The percentile normalization reduces the dimensions of the data matrix and shrinks the contained information by erasing part of the extensive information.
3.5. Patching the Breach in the Classification System
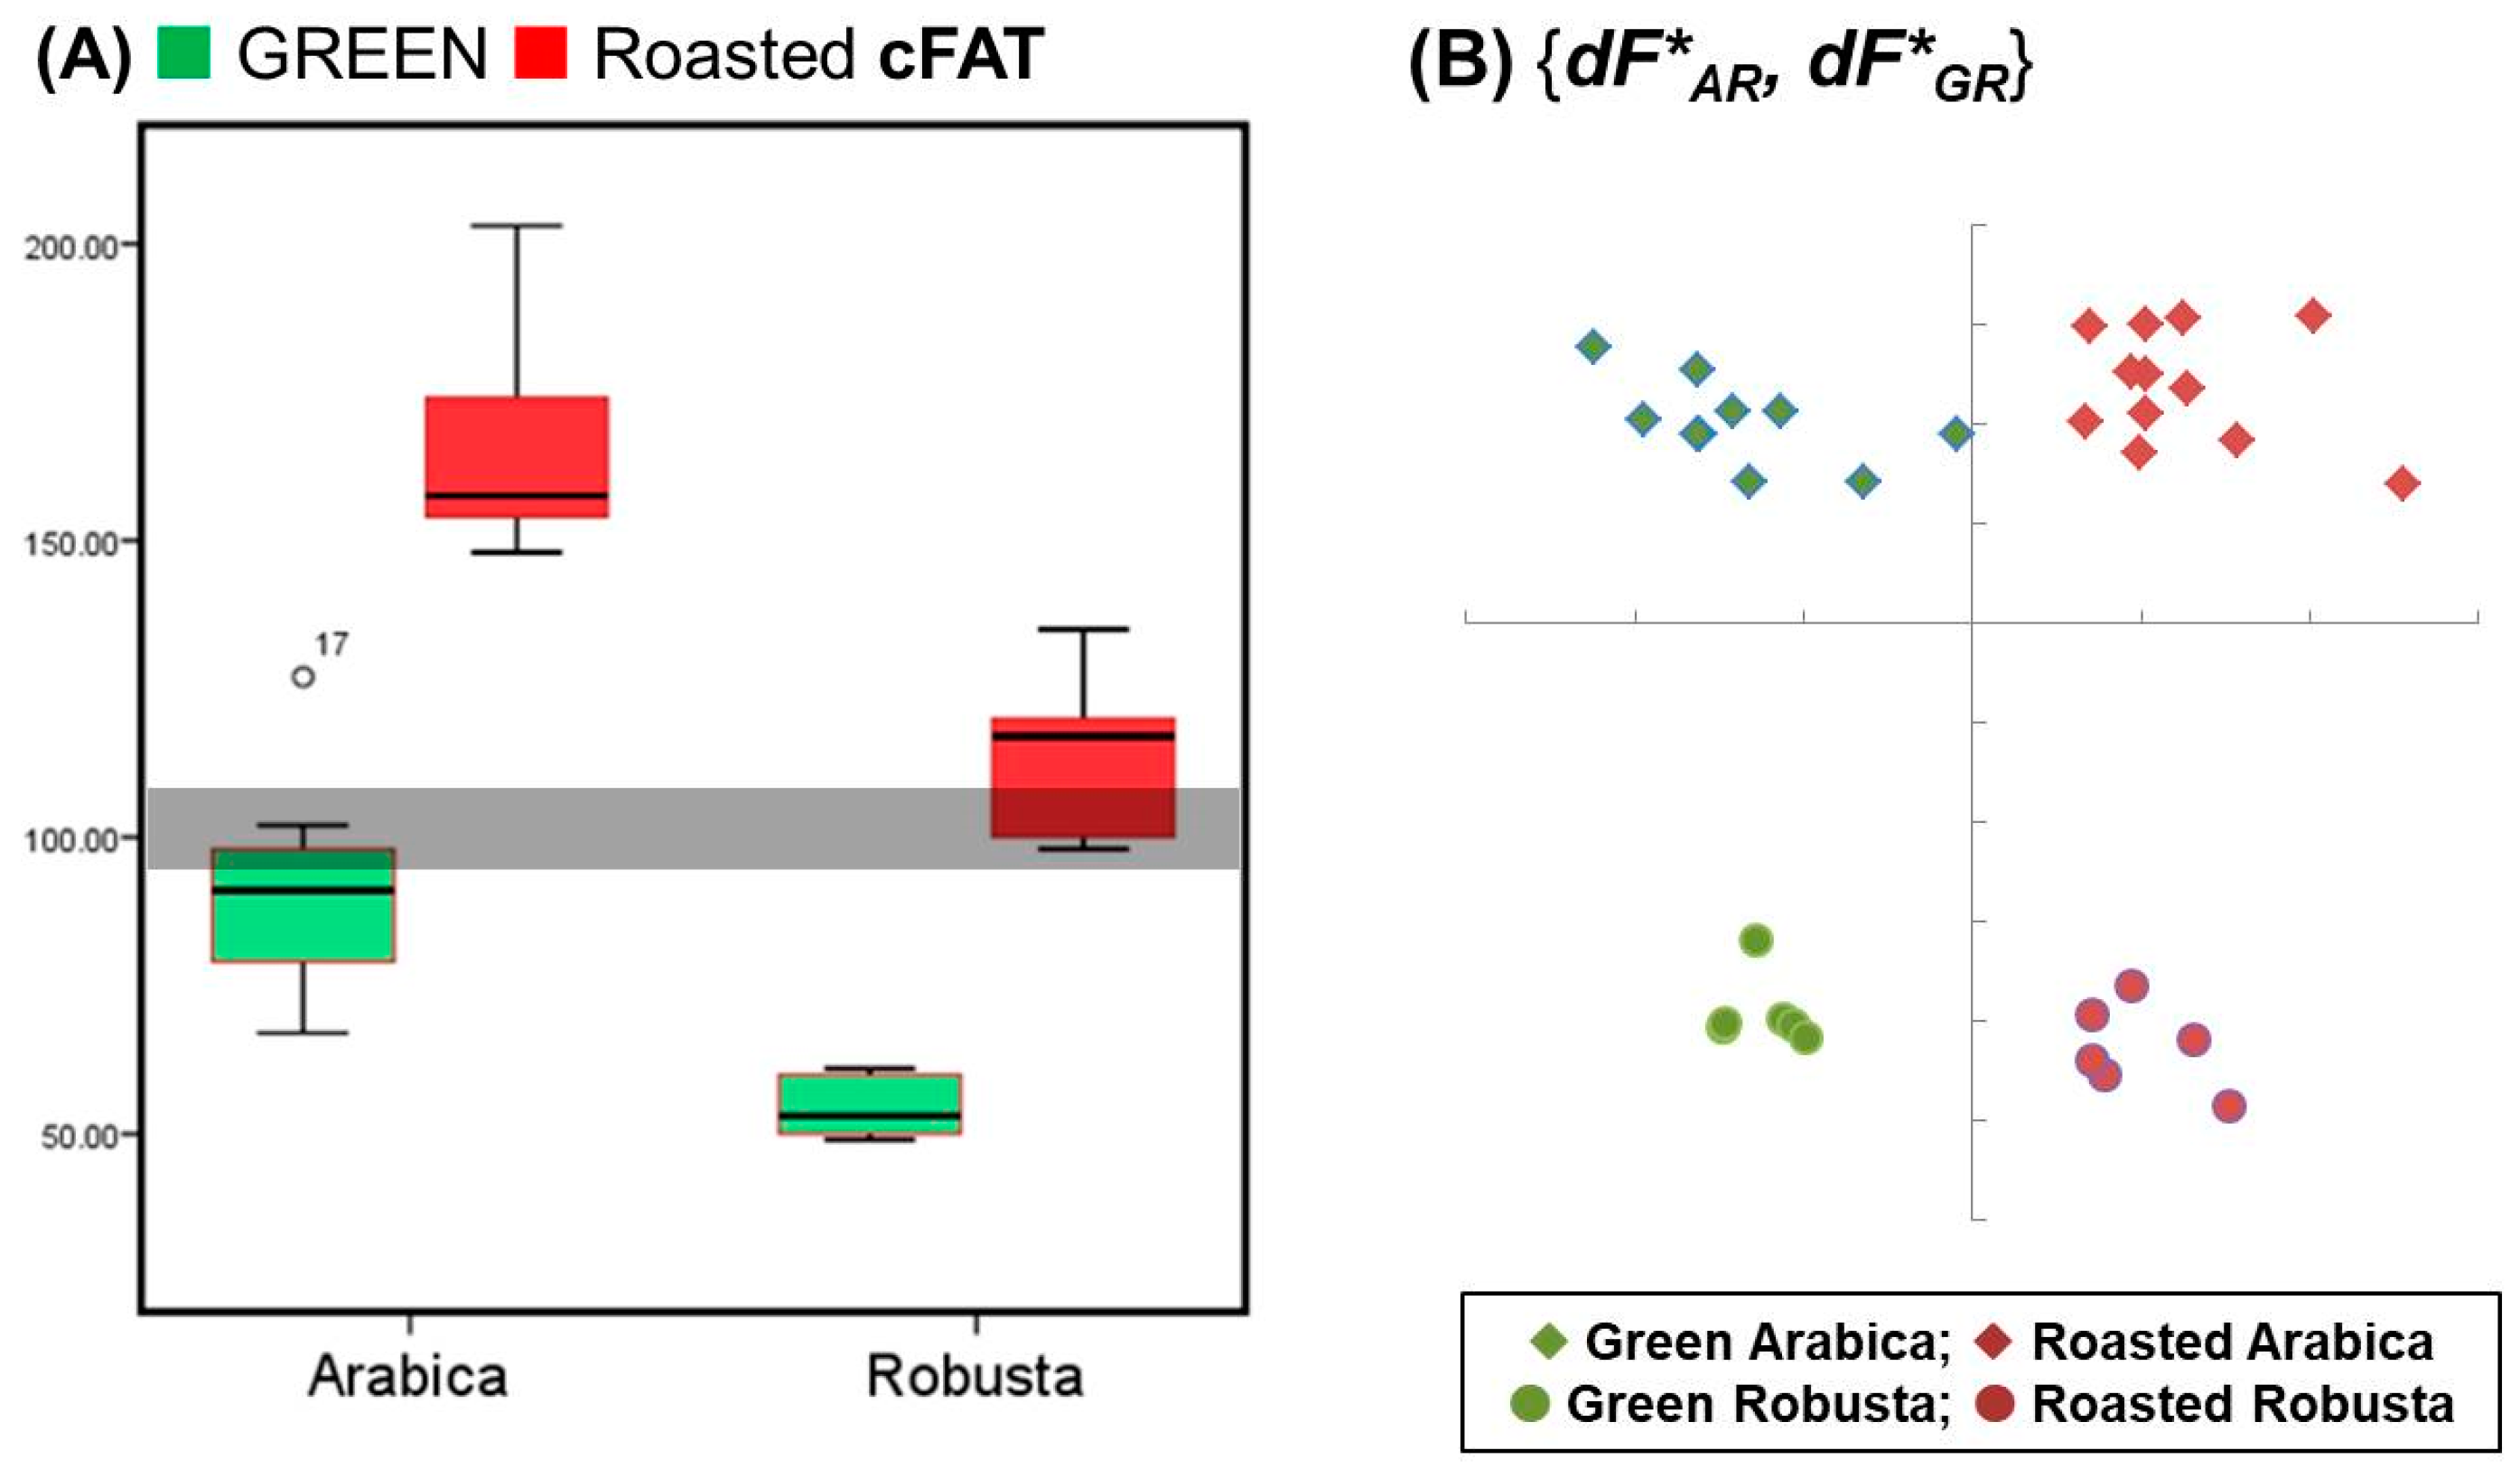
The lost information has the extensive property and is erased in data processing. If related data with extensive property was spiked into the smaller normalized data pool, the discrimination could be enhanced, allowing higher correctness. As shown in our proposal in Figure 2, the crude fat content was used to patch the informational breach, forming a patching process for the classification system with normalized data.
In Figure 7A, the crude fat contents without normalization are distributed into the four labelled groups, and the confusion errors are shown in the grey area. The crude fat content with the extensive property of specimen information was not associated with the percentile fatty acids in order to avoid artificial containment derived from the normalization.
Obviously, the patched dataset can be well partitioned by the two classifiers; the results are shown in Figure 7B. The source of information loss is evidenced by the informational spiking with the extensive property of crude fat content (cFAT). These results demonstrate that the system performance of machine learning depends on the input informational integrity and type. Data processing perhaps enhances one system function, but suppresses another.
4. Conclusions
All kinds of data are used as a medium for transmitting information in modern life. Different professional explanations are often added in the processes of data transfer and expression. We have shown that if there is no mutual crossover between the two sets of data, the percentile process will be more effective for the classification of coffee beans. The source and the property of information loss in this classification were identified as the normalization processing and the extensive quantity. The loss of information is noted in the quantitative features of coffee beans that have gone through the roasting process. The performance of this coffee classification is enhanced and validated by our patching technique with the traceable informational processing. Furthermore, our results will promote correctness and avoid the bias–variance tradeoff in classification systems with multiple classifiers. For industrial applications, effects of different processing and materials could be associated with the food quality and consumers’ preference by the accurate discriminant exploring based on chemometric data.
Author Contributions
Conceptualization and methodology: P.C. and L.-Y.C.; software, validation, formal analysis, and investigation: Y.-C.H. and L.-Y.C.; writing—original draft preparation: Y.-C.H.; writing—review and editing: P.C. and L.-Y.C.; supervision and project administration: L.-Y.C.; funding acquisition: Y.-C.H. and L.-Y.C.
Funding
This research received no external funding.
Acknowledgments
The authors thank the King-Car Group Company, Taiwan, where Liang-Yü Chen was an employee, for their supports with experimental materials and equipment.
Conflicts of Interest
The authors declare no conflict of interest.
References
- Romano, R.; Santini, A.; Le Grottaglie, L.; Manzo, N.; Visconti, A.; Ritieni, A. Identification markers based on fatty acid composition to differentiate between roasted Arabica and Canephora (Robusta) coffee varieties in mixtures. J. Food Compos. Anal. 2014, 35, 1–9. [Google Scholar] [CrossRef] [Green Version]
- Abad, M.; Abkar, A.; Mojaradi, B. Effect of the temporal gradient of vegetation indices on early-season wheat classification using the random forest classifier. Appl. Sci. 2018, 8, 1216. [Google Scholar] [CrossRef]
- Niimi, J.; Tomic, O.; Naes, T.; Jeffery, D.W.; Bastian, S.E.P.; Boss, P.K. Application of sequential and orthogonalised-partial least squares (SO-PLS) regression to predict sensory properties of Cabernet Sauvignon wines from grape chemical composition. Food Chem. 2018, 256, 195–202. [Google Scholar] [CrossRef] [PubMed]
- Pramudya, R.C.; Seo, H.S. Influences of product temperature on emotional responses to, and sensory attributes of, coffee and green tea beverages. Front. Psychol. 2017, 8, 2264. [Google Scholar] [CrossRef] [PubMed]
- Lange, C.; Combris, P.; Issanchou, S.; Schlich, P. Impact of information and in-home sensory exposure on liking and willingness to pay: The beginning of Fairtrade labeled coffee in France. Food Res. Int. 2015, 76, 317–324. [Google Scholar] [CrossRef] [PubMed]
- Lindinger, C.; Labbe, D.; Pollien, P.; Rytz, A.; Juillerat, M.A.; Yeretzian, C.; Blank, I. When machine tastes coffee: Instrumental approach to predict the sensory profile of espresso coffee. Anal. Chem. 2008, 80, 1574–1581. [Google Scholar] [CrossRef] [PubMed]
- Zia ur Rehman, M.; Gilani, S.; Waris, A.; Niazi, I.; Slabaugh, G.; Farina, D.; Kamavuako, E. Stacked Sparse Autoencoders for EMG-Based Classification of Hand Motions: A Comparative Multi Day Analyses between Surface and Intramuscular EMG. Appl. Sci. 2018, 8, 1126. [Google Scholar] [CrossRef]
- Masi, C.; Dinnella, C.; Barnaba, M.; Navarini, L.; Monteleone, E. Sensory properties of under-roasted coffee beverages. J. Food Sci. 2013, 78, S1290–S1300. [Google Scholar] [CrossRef] [PubMed]
- Spaniolas, S.; May, S.T.; Bennett, M.J.; Tucker, G.A. Authentication of coffee by means of PCR-RFLP analysis and lab-on-a-chip capillary electrophoresis. J. Agric. Food Chem. 2006, 54, 7466–7470. [Google Scholar] [CrossRef] [PubMed]
- Ribeiro, J.S.; Ferreira, M.M.; Salva, T.J. Chemometric models for the quantitative descriptive sensory analysis of Arabica coffee beverages using near infrared spectroscopy. Talanta 2011, 83, 1352–1358. [Google Scholar] [CrossRef] [PubMed]
- Dias, R.; Benassi, M. Discrimination between Arabica and Robusta Coffees Using Hydrosoluble Compounds: Is the Efficiency of the Parameters Dependent on the Roast Degree? Beverages 2015, 1, 127–139. [Google Scholar] [CrossRef] [Green Version]
- Dong, W.; Tan, L.; Zhao, J.; Hu, R.; Lu, M. Characterization of Fatty Acid, Amino Acid and Volatile Compound Compositions and Bioactive Components of Seven Coffee (Coffea robusta) Cultivars Grown in Hainan Province, China. Molecules 2015, 20, 16687–16708. [Google Scholar] [CrossRef] [PubMed]
- Villarreal, D.; Laffargue, A.; Posada, H.; Bertrand, B.; Lashermes, P.; Dussert, S. Genotypic and environmental effects on coffee (Coffea arabica L.) bean fatty acid profile: Impact on variety and origin chemometric determination. J. Agric. Food Chem. 2009, 57, 11321–11327. [Google Scholar] [CrossRef] [PubMed]
- Kalschne, D.L.; Viegas, M.C.; De Conti, A.J.; Corso, M.P.; Benassi, M.T. Steam pressure treatment of defective Coffea canephora beans improves the volatile profile and sensory acceptance of roasted coffee blends. Food Res. Int. 2018, 105, 393–402. [Google Scholar] [CrossRef] [PubMed]
- Marx, Í.; Rodrigues, N.; Dias, L.G.; Veloso, A.C.A.; Pereira, J.A.; Drunkler, D.A.; Peres, A.M. Sensory classification of table olives using an electronic tongue: Analysis of aqueous pastes and brines. Talanta 2017, 162, 98–106. [Google Scholar] [CrossRef] [PubMed] [Green Version]
- Rendon, M.Y.; de Jesus Garcia Salva, T.; Bragagnolo, N. Impact of chemical changes on the sensory characteristics of coffee beans during storage. Food Chem. 2014, 147, 279–286. [Google Scholar] [CrossRef] [PubMed]
- Bicho, N.C.; Leitao, A.E.; Ramalho, J.C.; de Alvarenga, N.B.; Lidon, F.C. Impact of roasting time on the sensory profile of arabica and robusta coffee. Ecol. Food Nutr. 2013, 52, 163–177. [Google Scholar] [CrossRef] [PubMed]
- Borras, E.; Ferre, J.; Boque, R.; Mestres, M.; Acena, L.; Calvo, A.; Busto, O. Prediction of olive oil sensory descriptors using instrumental data fusion and partial least squares (PLS) regression. Talanta 2016, 155, 116–123. [Google Scholar] [CrossRef] [PubMed]
- Shin, E.C.; Hwang, C.E.; Lee, B.W.; Kim, H.T.; Ko, J.M.; Baek, I.Y.; Lee, Y.B.; Choi, J.S.; Cho, E.J.; Seo, W.T.; et al. Chemometric Approach to Fatty Acid Profiles in Soybean Cultivars by Principal Component Analysis (PCA). Prev. Nutr. Food Sci. 2012, 17, 184–191. [Google Scholar] [CrossRef] [PubMed] [Green Version]
- El-Abassy, R.M.; Donfack, P.; Materny, A. Discrimination between Arabica and Robusta green coffee using visible micro Raman spectroscopy and chemometric analysis. Food Chem. 2011, 126, 1443–1448. [Google Scholar] [CrossRef]
- Dong, W.; Hu, R.; Chu, Z.; Zhao, J.; Tan, L. Effect of different drying techniques on bioactive components, fatty acid composition, and volatile profile of robusta coffee beans. Food Chem. 2017, 234, 121–130. [Google Scholar] [CrossRef] [PubMed]
- Wei, F.; Furihata, K.; Miyakawa, T.; Tanokura, M. A pilot study of NMR-based sensory prediction of roasted coffee bean extracts. Food Chem. 2014, 152, 363–369. [Google Scholar] [CrossRef] [PubMed]
- Han, J.; Kim, M.K.; Lee, K.G. Furan Levels and Sensory Profiles of Commercial Coffee Products Under Various Handling Conditions. J. Food Sci. 2017, 82, 2759–2766. [Google Scholar] [CrossRef] [PubMed]
- Frank, O.; Blumberg, S.; Kunert, C.; Zehentbauer, G.; Hofmann, T. Structure determination and sensory analysis of bitter-tasting 4-vinylcatechol oligomers and their identification in roasted coffee by means of LC-MS/MS. J. Agric. Food Chem. 2007, 55, 1945–1954. [Google Scholar] [CrossRef] [PubMed]
- Martin, M.X.; Pablos, F.; Gonzalez, A.G.; Valdenebro, M.X.; Leon-Camacho, M. Fatty acid profiles as discriminant parameters for coffee varieties differentiation. Talanta 2001, 54, 291–297. [Google Scholar] [CrossRef]
- Lee, L.C.; Liong, C.Y.; Jemain, A.A. Partial least squares-discriminant analysis (PLS-DA) for classification of high-dimensional (HD) data: A review of contemporary practice strategies and knowledge gaps. Analyst 2018, 143, 3526–3539. [Google Scholar] [CrossRef] [PubMed]
- Corrales, D.; Ledezma, A.; Corrales, J. From Theory to Practice: A Data Quality Framework for Classification Tasks. Symmetry 2018, 10, 248. [Google Scholar] [CrossRef]
- Pacheco, F.; Rangel, C.; Aguilar, J.; Cerrada, M.; Altamiranda, J. Methodological framework for data processing based on the Data Science paradigm. In Proceedings of the 2014 XL Latin American Computing Conference (CLEI), Montevideo, Uruguay, 15–19 September 2014; pp. 1–12. [Google Scholar]
- Thiex, N.J.; Anderson, S.; Gildemeister, B. Crude fat, diethyl ether extraction, in feed, cereal grain, and forage (Randall/Soxtec/submersion method): Collaborative study. J. AOAC Int. 2003, 86, 888–898. [Google Scholar] [PubMed]
- Eder, K. Gas chromatographic analysis of fatty acid methyl esters. J. Chromatogr. B Biomed. Appl. 1995, 671, 113–131. [Google Scholar] [CrossRef]
- Carvalho, A.P.; Malcata, F.X. Preparation of fatty acid methyl esters for gas-chromatographic analysis of marine lipids: Insight studies. J. Agric. Food Chem. 2005, 53, 5049–5059. [Google Scholar] [CrossRef] [PubMed]
- Bishop, C.M. Pattern Recognition and Machine Learning (Information Science and Statistics); Springer-Verlag: Berlin, Germany, 2006. [Google Scholar]
Figure 1.
Information conversion frames are associated with the real individuals, the chemometric data, and the sensory recognitions in this study.
Figure 1.
Information conversion frames are associated with the real individuals, the chemometric data, and the sensory recognitions in this study.

Figure 2.
Conceptual diagram showing the informational flows, leaks, and blocking in this 2D classification.
Figure 2.
Conceptual diagram showing the informational flows, leaks, and blocking in this 2D classification.

Figure 3.
The measured data of 34 coffee samples were pooled and profiled for the variances of cFAT and fatty acids, as unsupervised data. The boxes and lines present as the mean ±2s (standard deviations, 95%), the median, and the quartiles (Q1 and Q3) for specific variables after standardization. The numbers below (underlined) present the average composition for each fatty acid as a percentage of total free fatty acids (100%).
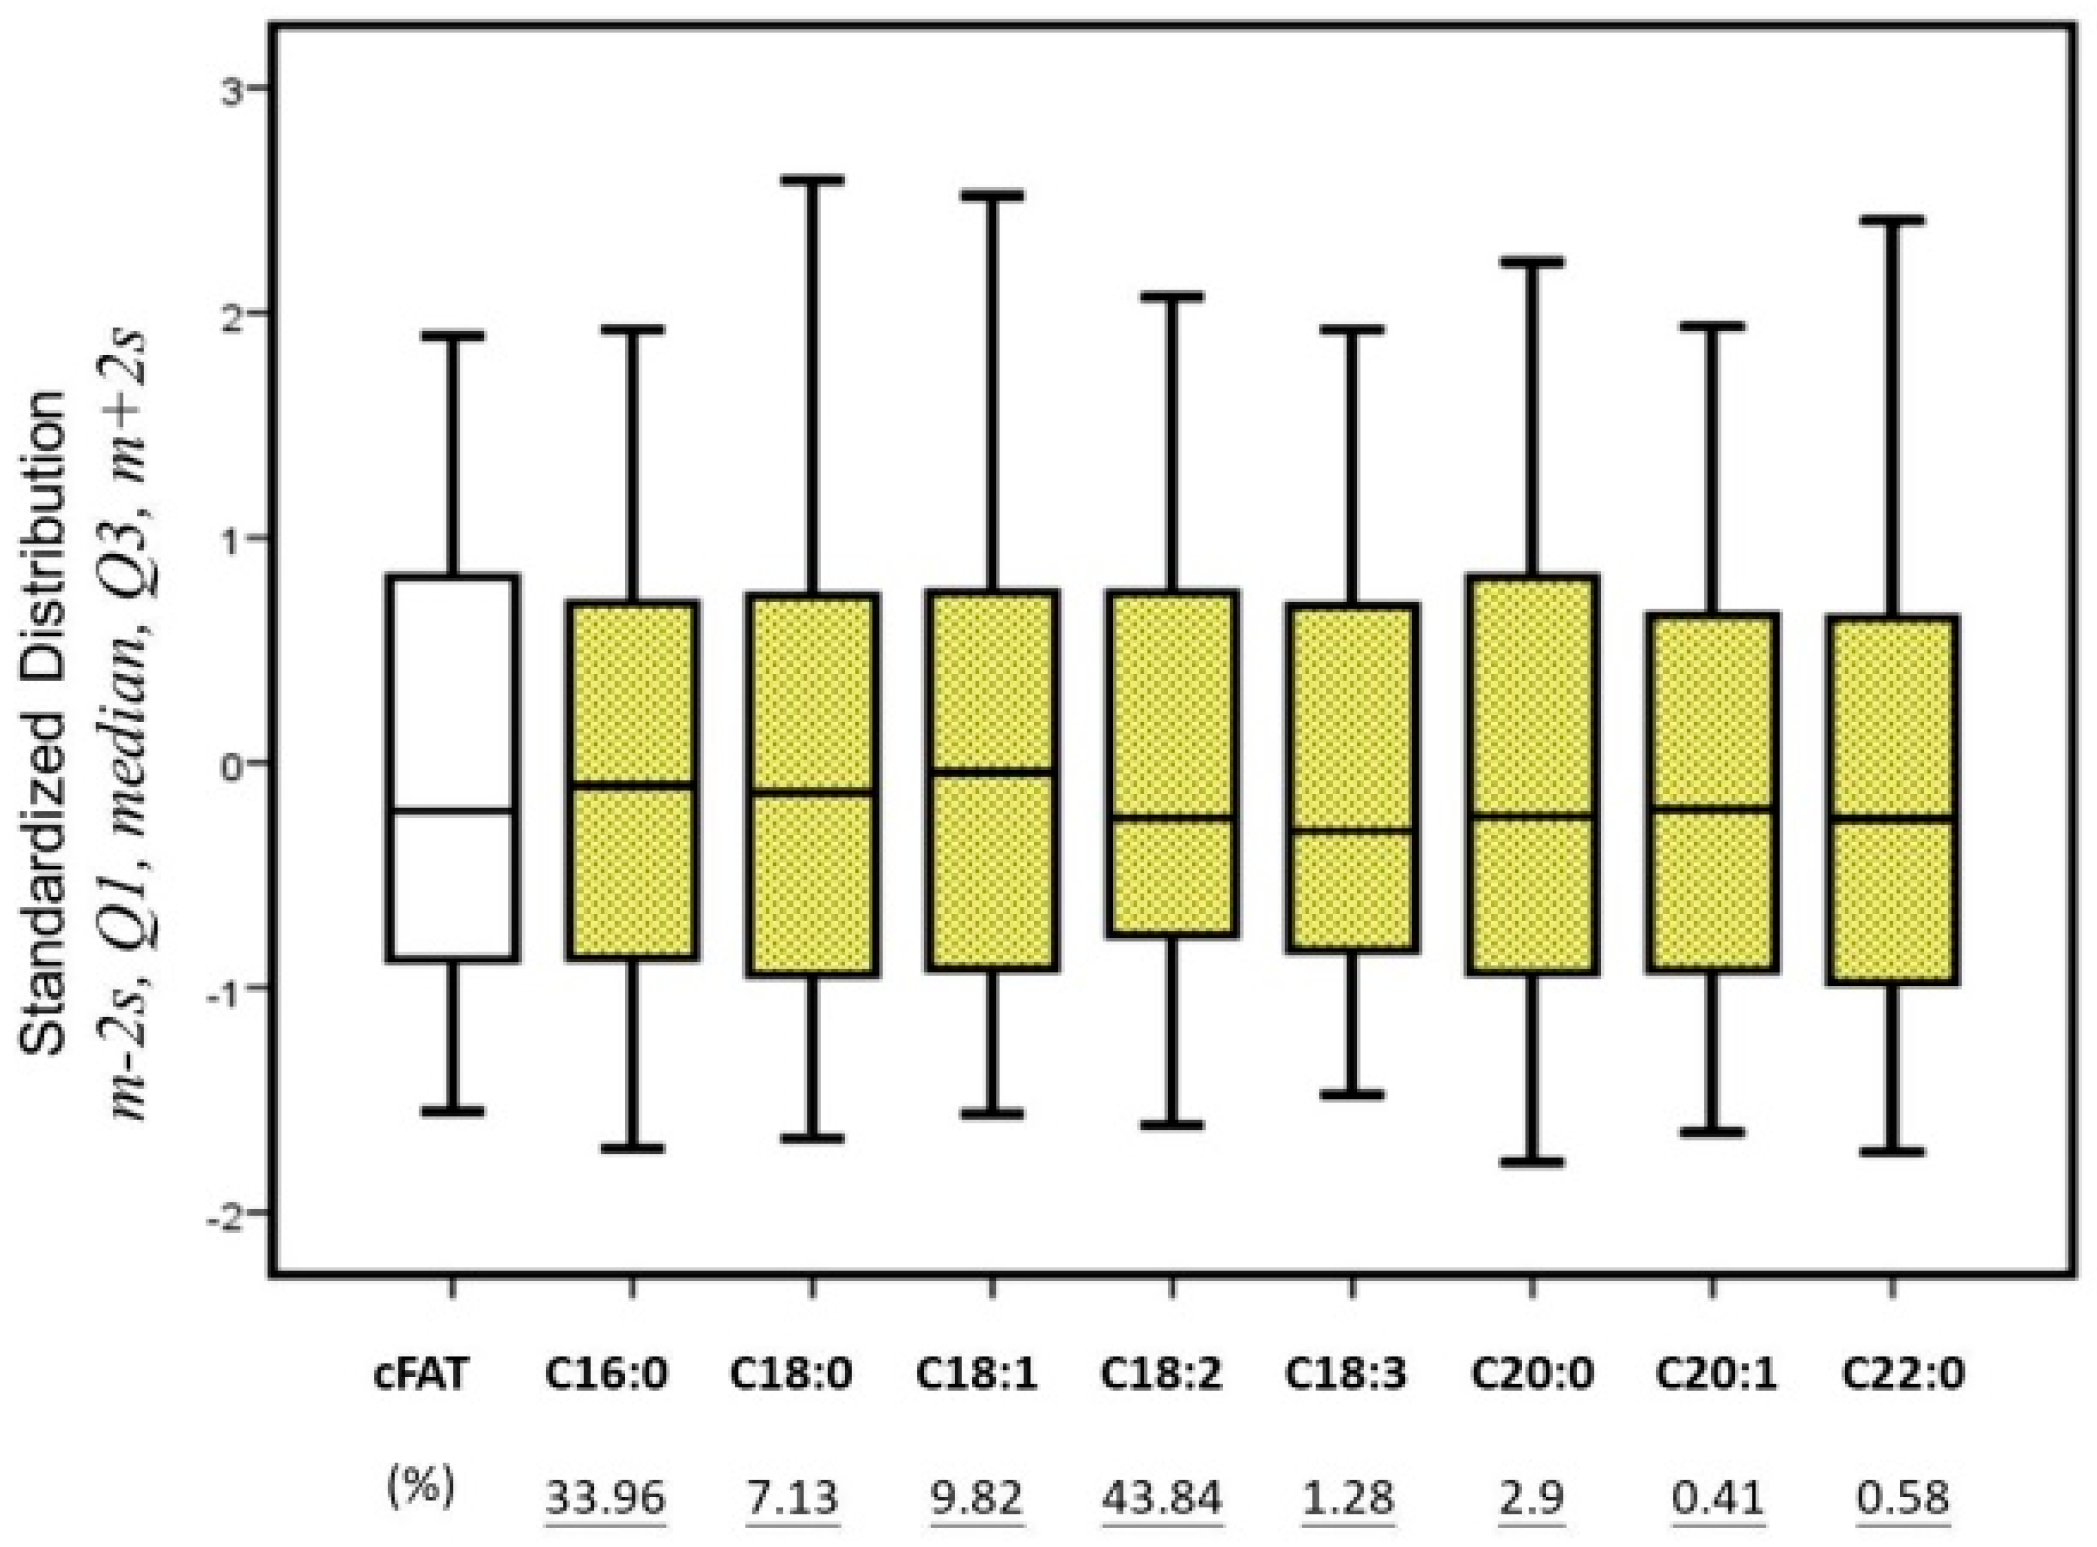
Figure 4.
A restructured correlation of fatty acids (C18:0 and C18:2) is presented with the normalized data in percentiles and juxtaposed with the correlation of fatty acids with the pooled measured data.
Figure 4.
A restructured correlation of fatty acids (C18:0 and C18:2) is presented with the normalized data in percentiles and juxtaposed with the correlation of fatty acids with the pooled measured data.

Figure 5.
Linear discriminant analysis plotted with the raw data (A) or the percentile data (%) (B) of the fatty acids in 34 coffee beans.
Figure 5.
Linear discriminant analysis plotted with the raw data (A) or the percentile data (%) (B) of the fatty acids in 34 coffee beans.
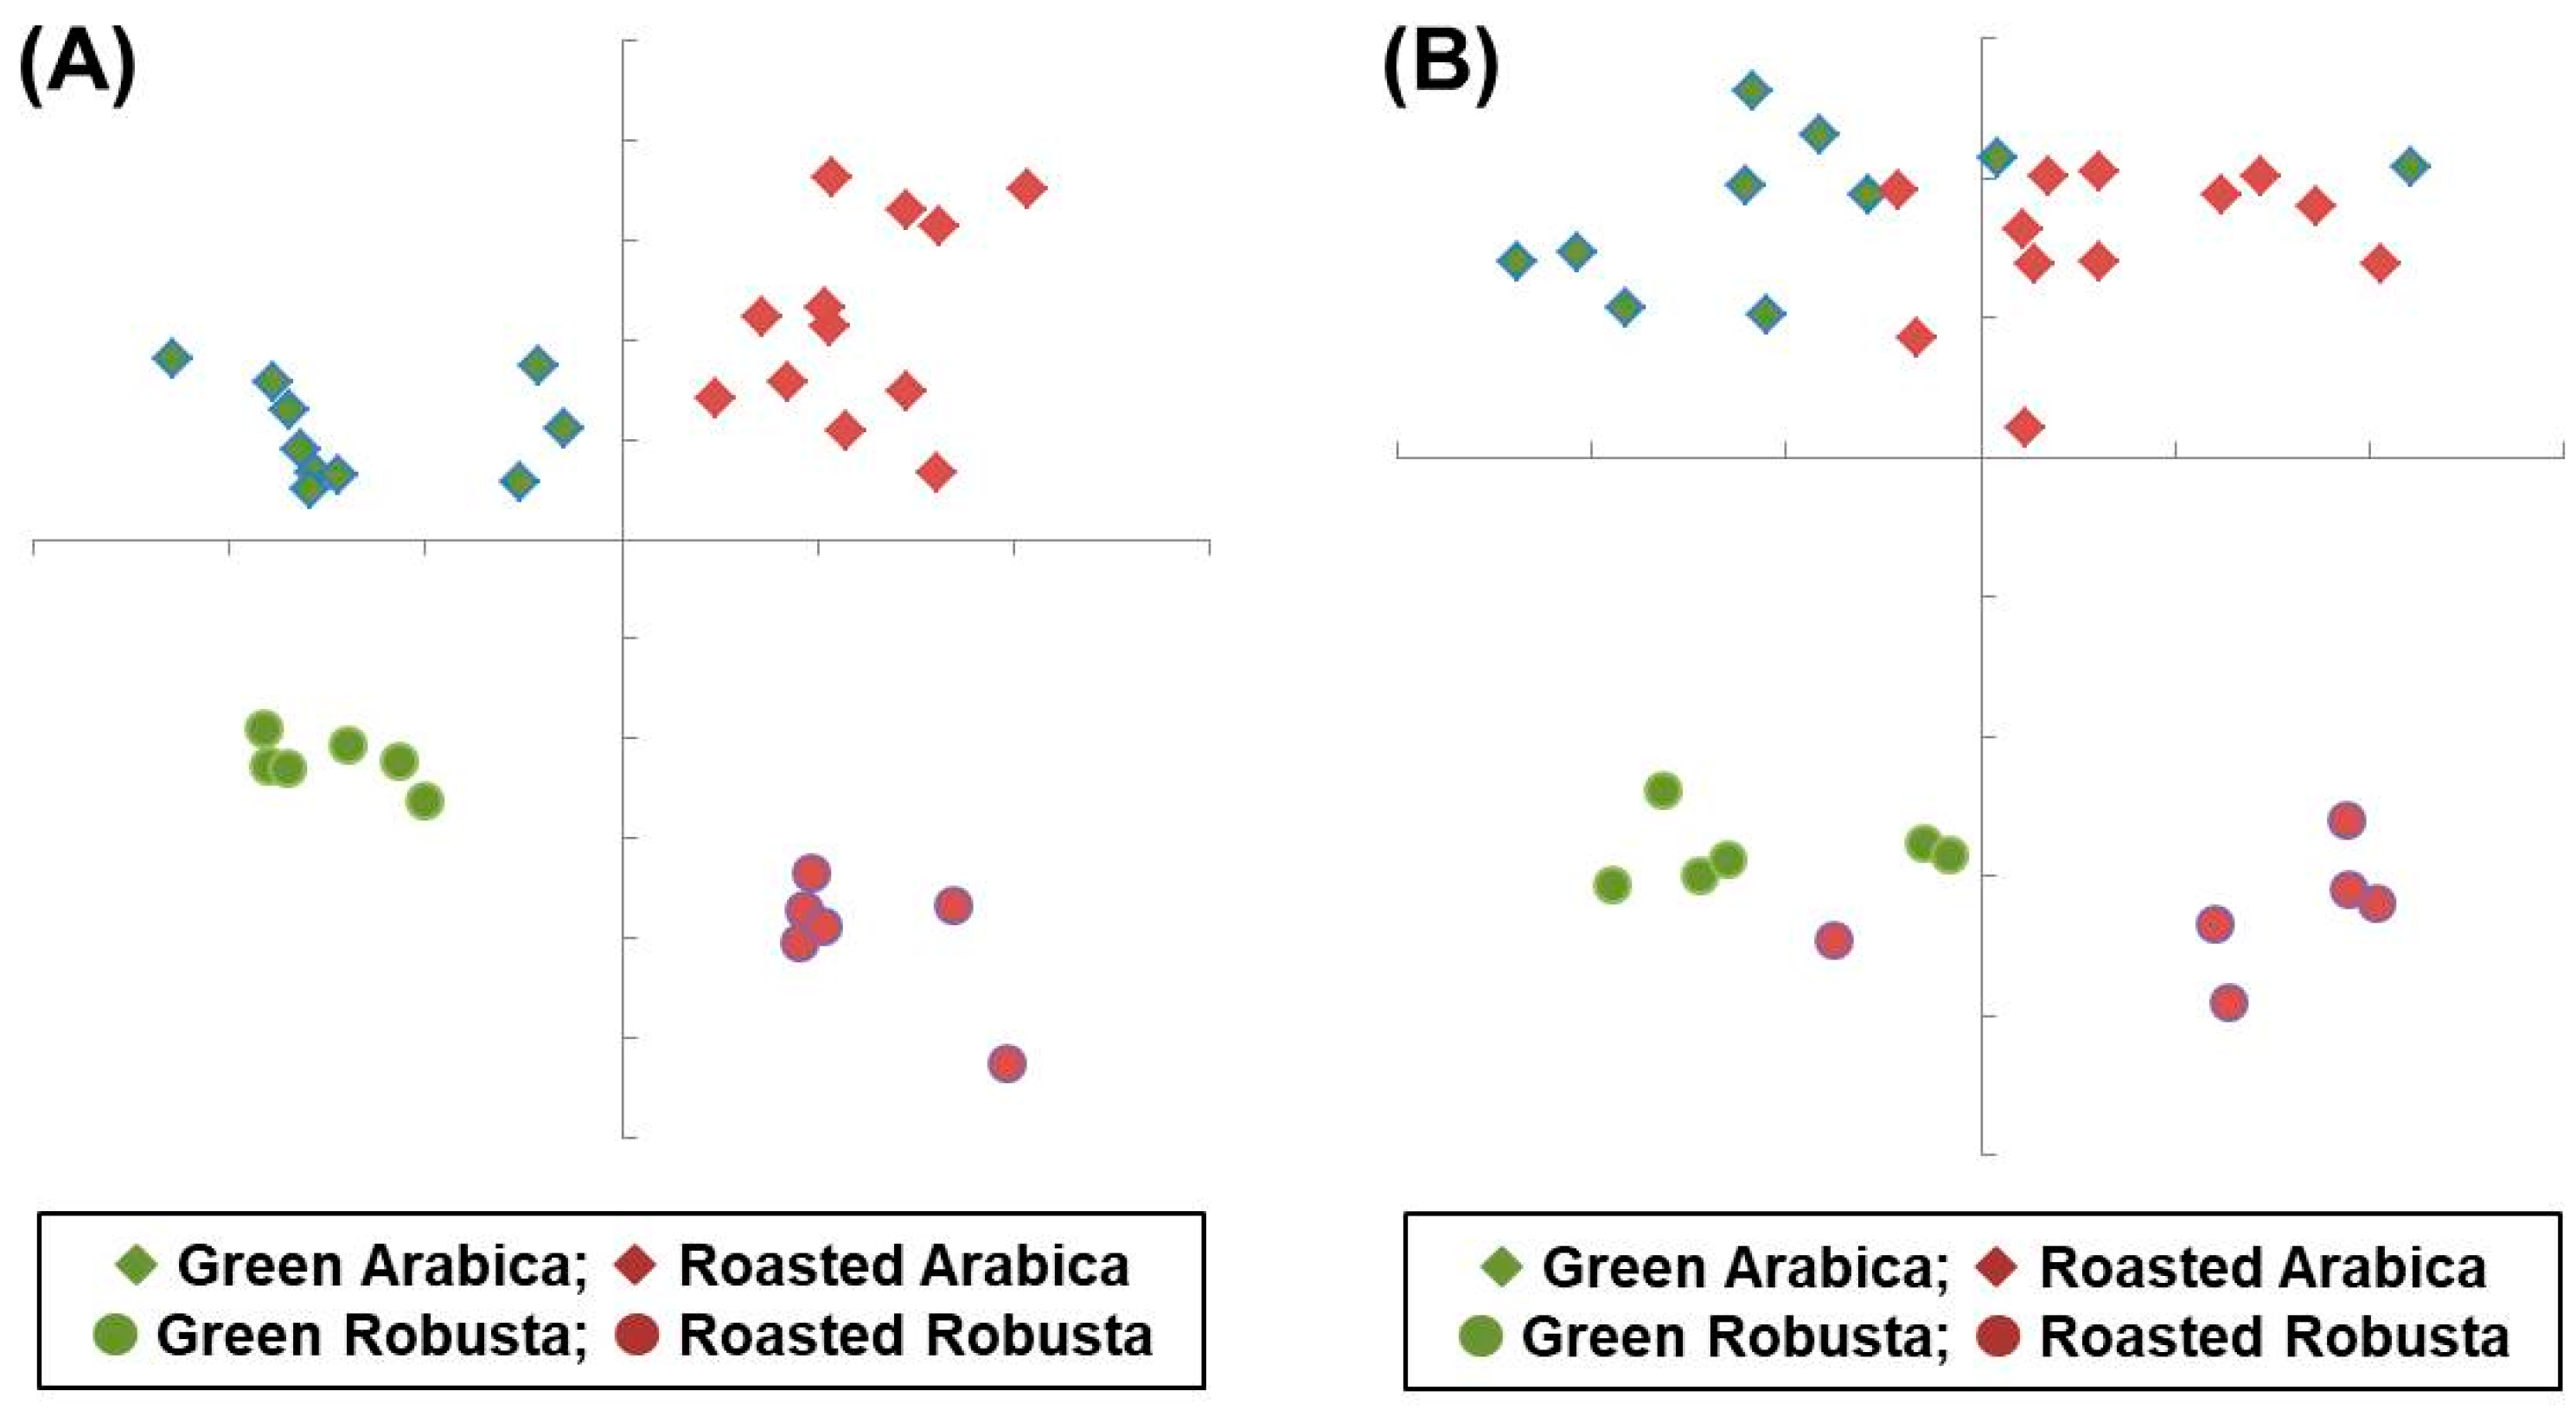
Figure 6.
Comparison of the effects of the Z-scored or percentile (%) data on the t values of fatty acids for discrimination of (A) Green and Roasted or (B) Arabica and Robusta coffees.
Figure 6.
Comparison of the effects of the Z-scored or percentile (%) data on the t values of fatty acids for discrimination of (A) Green and Roasted or (B) Arabica and Robusta coffees.

Figure 7.
Group distributions of the crude fat contents (A) in green and roasted coffee beans are compared using raw data. Further, linear discriminant analysis (B) is plotted with the percentile data of the fatty acids patched with the crude fat content (cFAT) of the 34 coffee bean samples.
Figure 7.
Group distributions of the crude fat contents (A) in green and roasted coffee beans are compared using raw data. Further, linear discriminant analysis (B) is plotted with the percentile data of the fatty acids patched with the crude fat content (cFAT) of the 34 coffee bean samples.

Table 1.
The measured data of the contents of crude fat (cFAT) and eight fatty acids (FAs) listed for 34 samples of coffee beans.
Table 1.
The measured data of the contents of crude fat (cFAT) and eight fatty acids (FAs) listed for 34 samples of coffee beans.
| ID | GR | AR | cFAT | C16:0 | C18:0 | C18:1 | C18:2 | C18:3 | C20:0 | C20:1 | C22:0 |
|---|---|---|---|---|---|---|---|---|---|---|---|
| mg/g | |||||||||||
| 01 | Roasted | Arabica | 159 | 45.342 | 8.985 | 10.610 | 62.466 | 2.109 | 3.691 | 0.508 | 0.714 |
| 02 | Green | Arabica | 67 | 20.736 | 4.118 | 4.792 | 27.942 | 0.947 | 1.797 | 0.232 | 0.408 |
| 03 | Roasted | Arabica | 155 | 37.909 | 7.301 | 9.247 | 47.871 | 1.603 | 2.952 | 0.427 | 0.563 |
| 04 | Green | Arabica | 88 | 20.512 | 4.002 | 4.848 | 25.234 | 0.911 | 1.921 | 0.245 | 0.399 |
| 05 | Roasted | Arabica | 153 | 36.507 | 7.242 | 11.355 | 47.960 | 1.552 | 2.788 | 0.414 | 0.556 |
| 06 | Green | Arabica | 102 | 25.639 | 4.984 | 7.582 | 32.942 | 1.116 | 2.075 | 0.299 | 0.425 |
| 07 | Roasted | Arabica | 148 | 36.101 | 8.461 | 10.067 | 46.857 | 1.539 | 3.436 | 0.412 | 0.644 |
| 08 | Green | Arabica | 94 | 30.897 | 6.971 | 8.341 | 39.461 | 1.257 | 2.967 | 0.345 | 0.675 |
| 09 | Roasted | Arabica | 203 | 44.440 | 10.410 | 13.355 | 59.340 | 1.683 | 4.243 | 0.554 | 0.905 |
| 10 | Green | Arabica | 98 | 25.490 | 5.650 | 6.501 | 32.136 | 1.023 | 2.366 | 0.280 | 0.631 |
| 11 | Roasted | Arabica | 203 | 54.853 | 13.219 | 17.271 | 74.899 | 2.461 | 4.691 | 0.647 | 1.060 |
| 12 | Green | Arabica | 88 | 23.757 | 5.644 | 7.224 | 31.549 | 1.113 | 2.169 | 0.288 | 0.636 |
| 13 | Roasted | Arabica | 173 | 41.413 | 9.778 | 12.421 | 55.083 | 1.777 | 3.408 | 0.451 | 0.749 |
| 14 | Green | Arabica | 98 | 22.405 | 5.184 | 6.245 | 28.209 | 1.000 | 2.012 | 0.243 | 0.476 |
| 15 | Roasted | Arabica | 175 | 50.168 | 9.712 | 12.828 | 66.230 | 2.067 | 3.439 | 0.564 | 0.713 |
| 16 | Roasted | Arabica | 166 | 49.224 | 9.548 | 12.642 | 65.296 | 2.168 | 3.579 | 0.587 | 0.771 |
| 17 | Green | Arabica | 127 | 34.747 | 6.697 | 8.720 | 45.076 | 1.524 | 2.336 | 0.383 | 0.471 |
| 18 | Roasted | Arabica | 156 | 40.016 | 7.953 | 9.955 | 53.152 | 1.727 | 3.051 | 0.411 | 0.606 |
| 19 | Green | Arabica | 79 | 19.075 | 3.779 | 4.780 | 25.878 | 0.852 | 1.466 | 0.194 | 0.321 |
| 20 | Roasted | Arabica | 150 | 49.182 | 9.066 | 12.606 | 62.721 | 2.259 | 3.807 | 0.587 | 0.850 |
| 21 | Roasted | Arabica | 156 | 49.529 | 9.303 | 12.610 | 63.325 | 2.308 | 3.890 | 0.599 | 0.789 |
| 22 | Green | Arabica | 79 | 22.622 | 4.185 | 5.751 | 28.787 | 1.078 | 1.794 | 0.278 | 0.368 |
| 23 | Roasted | Robusta | 135 | 33.076 | 6.439 | 8.844 | 38.228 | 0.694 | 2.510 | 0.340 | 0.306 |
| 24 | Roasted | Robusta | 119 | 29.308 | 5.971 | 8.068 | 34.897 | 0.756 | 2.503 | 0.353 | 0.316 |
| 25 | Green | Robusta | 55 | 16.041 | 3.236 | 4.584 | 18.805 | 0.391 | 1.482 | 0.188 | 0.271 |
| 26 | Green | Robusta | 50 | 15.729 | 3.129 | 4.634 | 18.589 | 0.436 | 1.555 | 0.205 | 0.239 |
| 27 | Roasted | Robusta | 100 | 23.971 | 5.272 | 8.634 | 31.999 | 0.656 | 2.247 | 0.343 | 0.288 |
| 28 | Green | Robusta | 49 | 10.410 | 2.248 | 3.598 | 13.947 | 0.310 | 1.026 | 0.141 | 0.157 |
| 29 | Roasted | Robusta | 120 | 31.304 | 6.863 | 11.588 | 40.807 | 0.796 | 3.198 | 0.500 | 0.484 |
| 30 | Roasted | Robusta | 115 | 30.900 | 6.753 | 11.288 | 39.856 | 0.793 | 3.111 | 0.466 | 0.633 |
| 31 | Green | Robusta | 61 | 16.730 | 3.943 | 5.936 | 21.800 | 0.466 | 1.792 | 0.243 | 0.322 |
| 32 | Green | Robusta | 60 | 15.400 | 3.598 | 5.472 | 19.844 | 0.404 | 1.620 | 0.223 | 0.363 |
| 33 | Roasted | Robusta | 98 | 23.786 | 5.277 | 8.634 | 31.356 | 0.665 | 2.247 | 0.333 | 0.269 |
| 34 | Green | Robusta | 51 | 10.46 | 2.248 | 3.598 | 13.958 | 0.325 | 1.021 | 0.131 | 0.171 |
Table 2.
Classification accuracy is assessed using a confusion matrix based on the discriminant functions with the normalized (percentile) data and classification into the four groups (2 × 2). The correctness is used to describe the performance of the individual classifiers (LCRG or LCAR).
Table 2.
Classification accuracy is assessed using a confusion matrix based on the discriminant functions with the normalized (percentile) data and classification into the four groups (2 × 2). The correctness is used to describe the performance of the individual classifiers (LCRG or LCAR).
| Categories | Green | Roasted | LCAR |
|---|---|---|---|
| Arabica | 8/10 | 10/12 | 22/22 (100) |
| Robusta | 6/6 | 5/6 | 12/12 (100) |
| LCRG | 14/16 (87.5) | 15/18 (83.3) | Correct (%) |
© 2018 by the authors. Licensee MDPI, Basel, Switzerland. This article is an open access article distributed under the terms and conditions of the Creative Commons Attribution (CC BY) license (http://creativecommons.org/licenses/by/4.0/).
Share and Cite
MDPI and ACS Style
Hung, Y.-C.; Chen, P.; Chen, L.-Y. Advanced Classification of Coffee Beans with Fatty Acids Profiling to Block Information Loss. Symmetry 2018, 10, 529. https://doi.org/10.3390/sym10100529
AMA Style
Hung Y-C, Chen P, Chen L-Y. Advanced Classification of Coffee Beans with Fatty Acids Profiling to Block Information Loss. Symmetry. 2018; 10(10):529. https://doi.org/10.3390/sym10100529
Chicago/Turabian StyleHung, Ying-Che, Ping Chen, and Liang-Yü Chen. 2018. "Advanced Classification of Coffee Beans with Fatty Acids Profiling to Block Information Loss" Symmetry 10, no. 10: 529. https://doi.org/10.3390/sym10100529
Note that from the first issue of 2016, this journal uses article numbers instead of page numbers. See further details here.