Complexity, Regularity and Non-Linear Behavior in Human Eye Movements: Analyzing the Dynamics of Gaze in Virtual Sailing Programs


1
Teacher Training College, University of Extremadura, Avda. de la Universidad, s/n, 10071 Cáceres, Spain
2
Faculty of Sport, San Antonio Catholic University, Avda. de los Jerónimos, 135, 30107 Murcia, Spain
*
Author to whom correspondence should be addressed.
Symmetry 2018, 10(10), 528; https://doi.org/10.3390/sym10100528
Submission received: 9 August 2018
/
Revised: 15 October 2018
/
Accepted: 15 October 2018
/
Published: 22 October 2018
Abstract
:The non-linear analysis of the behavior of biological signals in humans is studied from different scientific disciplines. The aim of this study was to analyze the possible non-linear behavior present in eye movements during eye-tracking tasks in simulated sailing. Thirty young sailors were selected. Fuzzy entropy and detrended fluctuation analyses were applied to quantify the regularity and complexity of eye movements. The results show that neither experience nor ranking affect the regularity or the complexity of eye movement positions or velocities. Younger age is related to more regular visual behavior. At younger ages, eye positions present more complex behavior. Eye positions show more complex behavior than eye velocities. This complexity would allow for a more functional exploration of the environment by sailors. Eye movement velocity presents the greatest irregularity, with significantly higher values than eye movement position. This irregularity would facilitate the visual perception of the environment. All these findings could be related to the sailors’ functional behavior, based on complexity and stability, which has been associated with the ability of human beings to adapt to the environment.
1. Introduction
Non-linear biological signal analysis is evident across many scientific disciplines. We have found recent research on electroencephalography [1,2,3], electrocardiography [3,4,5], electromyography [6], and on movement of the center of pressure [7]. All these studies have aimed to determine the complex structure of these signals by applying non-linear tools. With non-linear analysis, it is possible to state that complexity in a time series is related to the functional behavior of the system from which the signal is extracted [8]. The aim of these tools has been to characterize the signals, make dynamic patterns clear, and obtain information about their behavior and relationship with pathological conditions or motor and neural performance. Biological signals with high levels of irregularities or complexities seem to be cues for motor skill performance, exploratory or adaptive behaviors [9,10,11,12,13,14], and the optimal function of the cardiovascular system [15].
The complex dynamic behavior of individuals emerges during the interaction between the environment and the organism. This behavior is characterized by continuous fluctuations over time [16], and requires the use of different non-linear tools that are able to uncover this apparently chaotic or random dynamic [17], which is hidden behind different degrees of complexities or consistencies.
Authors such as Harezlak and Kasprowsky [18] have deduced the existence of signs of chaotic or non-linear behavior in eye movements studied in a laboratory environment.
Continuing this line of research, in the context of sports practice in general and sailing in particular, we consider that the objective of this study is to identify whether the discoveries found in the analysis of other biological signals, which associate complexity and irregularity with desirable states of operation, can also be observed in eye movements during the perception of stimuli in sports practice conditions.
A visual search, understood as the skill of extracting information from a perceived scene and its subsequent use in the execution of motion response, is very important in sports research to attain desired performance levels. A visual strategy determines the amount of attention and information collected from the environment, enabling the motor response to be based on the information extracted.
Although the importance of analyzing these factors to understand visual behavior is clear, observations made in the reviewed literature suggest that there are deficiencies in relation to the availability of information on the patterns of eye movements in response to the stimuli present in the observed scene. We found contributions along this line in the research by Manzanares et al. [19] who applied Markov’s chains to study the sequence of visual fixations performed by sailors in an environment of simulated sailing. This probabilistic technique provided verification that the highest-ranked sailors carried out a more active and broader search for relevant visual information than lower-ranked sailors. A technique which is also based on hidden Markov models and scanpath modelling with discriminant analysis, was applied to the analysis of eye movements by Coutrot, Hsiao and Chan (2018). In this study, the authors propose a solution for the modelling and classification of the gaze. When applied to different sets of data, it is shown that this approach can capture patterns with different mechanisms related to visual search operations.
This study takes the approach of understanding gaze behavior as a dynamic mechanism, away from the static analysis of fixations and saccades used in other research. However, the aim of this research is not to model the gaze, but to discover a non-linear behavior in the movements of the eye, which has already been discovered in other biological signals. Nevertheless, without side-lining the usefulness of Markov models and scanpath modelling with discriminant analysis, we emphasize that it does not address the possibility of determining the exploratory and/or functional nature of eye movements. For this reason, measures of its complexity and regularity would be of great interest in the area of perceived visual performance in sports, since having a high capacity to explore the environment is crucial to the success of the required actions. Although visual search has typically been studied based on the quantitative analyses of saccadic eye movements and visual fixations [20], recent studies point to the possibility of eye movements having a non-linear nature. Eye movements have been analyzed using non-linear tools, such as the Lyapunov or Hurst exponent, concluding that they present chaos-based behavior [21,22].
However, despite the incipient interest shown in the latest research, these non-linear measures have not yet been applied in real or simulated sports practice situations. To advance in this line of research, from among the multitude of tools for non-linear analysis typically used and described in the scientific literature, this work will examine two methods: detrended fluctuation analysis (DFA) and fuzzy entropy (FuzzyEn).
Based on this approach, a decision was made to apply non-linear analysis to the visual behavior of adolescent sailors during a simulated start of a regatta. The choice of this sport was based on its open nature and on the wealth of visual behavior associated with its practice. The start of the regatta is crucial to the success of the race, as placing the boat in the best position on the start line is fundamental to starting the regatta and provides an important advantage over rivals [23]. Undertaking an active visual search that permits exploring the environment at this time seems to be a performance factor to be borne in mind [23]. Nevertheless, the difficulties of recording this information during real navigational conditions have prevented the analysis of visual behavior up to now. To address this problem, a sailing simulator, previously used in other research studies [24], has been used, reproducing the navigation conditions and the boat manoeuvres in a controlled environment.
In this light, an analysis of non-linear behavior in human eye movements during virtual sailing is carried out with teenagers, with the following aims: (i) to analyze whether visual behavior presents a complex and irregular structure, and (ii) to determine whether the participants’ rank and sailing experience relate to the complexity of their visual behavior.
According to these objectives, we present three hypotheses: (i) the visual behavior of teenage sailors is complex and irregular; (ii) the visual behavior of top-ranking and experienced sailors is more complex and irregular than bottom-ranking sailors’ visual behavior; (iii) the greater the age of sailors, the less regular and more complex their visual behavior will be.
2. Materials and Methods
Thirty sailors (N = 30) from the Optimist sailing class were selected as participants, with an age of 11.9 ± 1.9 years old and sailing experience of 3.3 ± 1.9 years. All participants, as well as their parents or legal guardians, gave their consent to participate in the research. The research was approved by the Ethics Committee of the Catholic University of Murcia.
The sailors’ eye movements were recorded using the eye-tracking system (MobileEyeTM) created by Applied Sciences Laboratories (ASL®). The eye tracker is a head-mounted, monocular eye-tracking device that computes the point of gaze within a scene by calculating the vector (angle and distance) between the individual’s pupil and cornea. Gaze behavior data were collected at 30 frames per second (30 Hz).
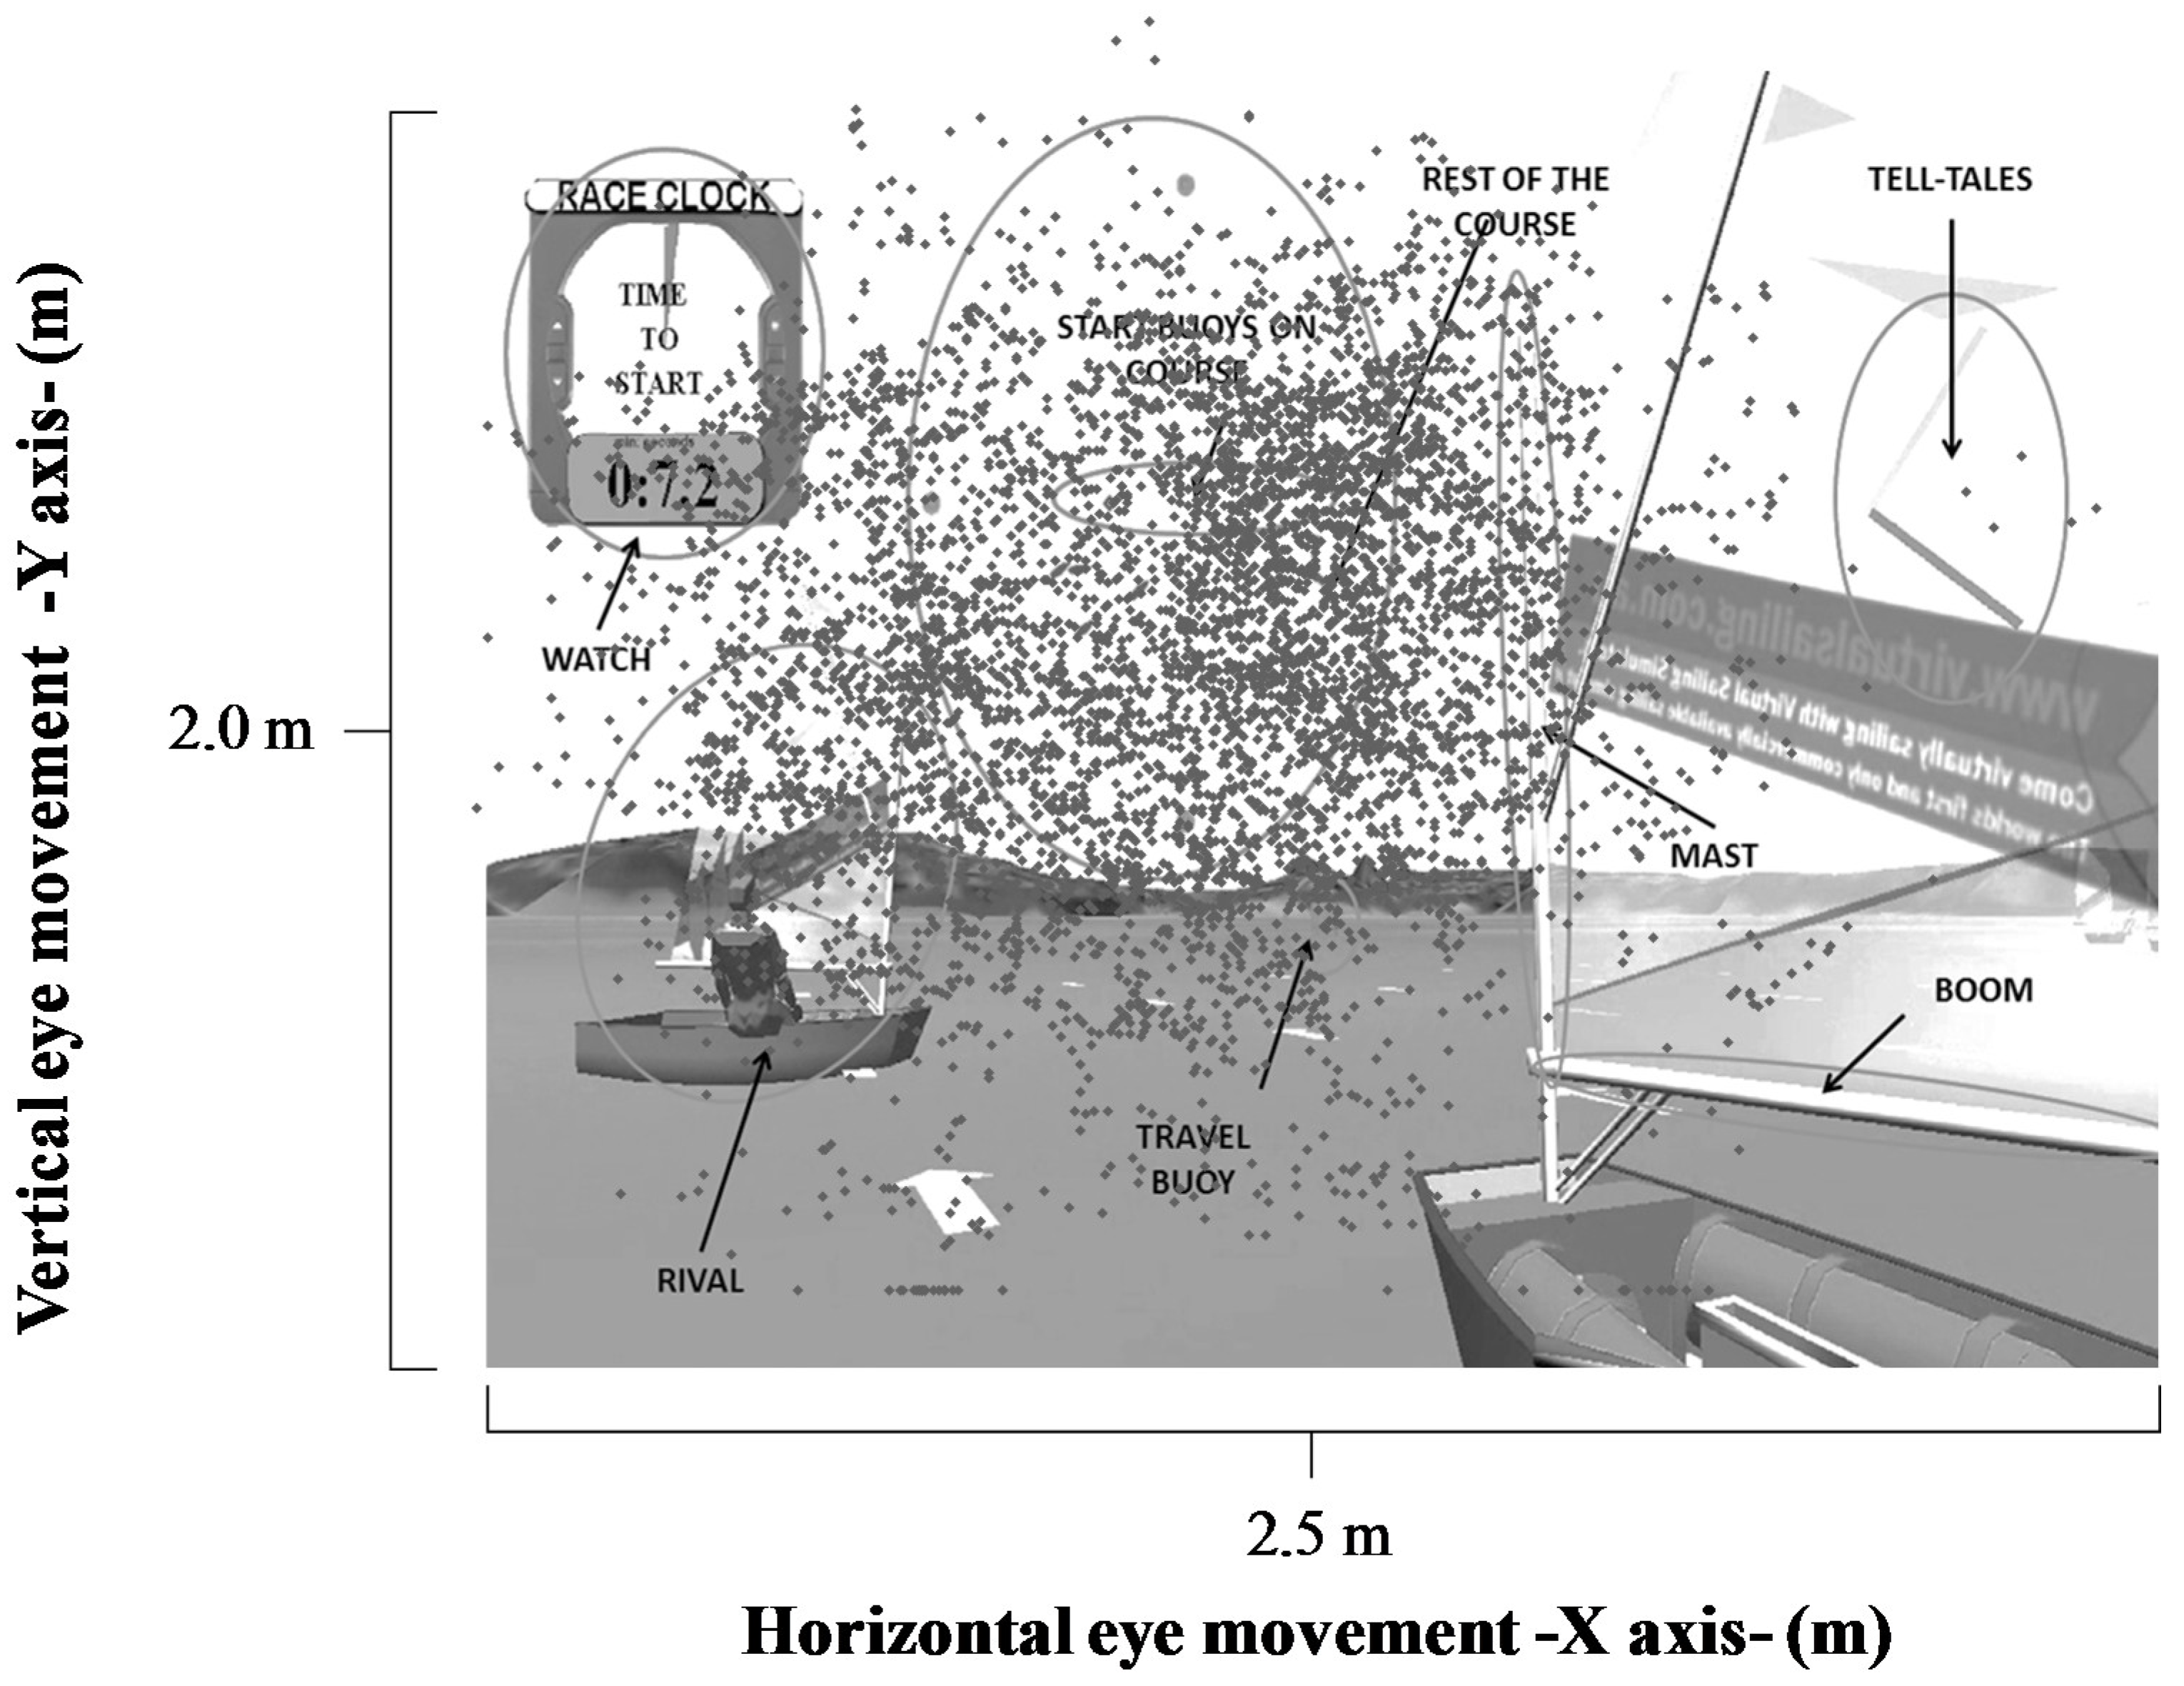
The visual stimuli present in the race were start buoys, wind direction, prow, tack, watch, telltales and opponents, start buoys on maps, the rest of the map, the rest of the sail, boom, mast, travel buoys, and the rest of the boat.
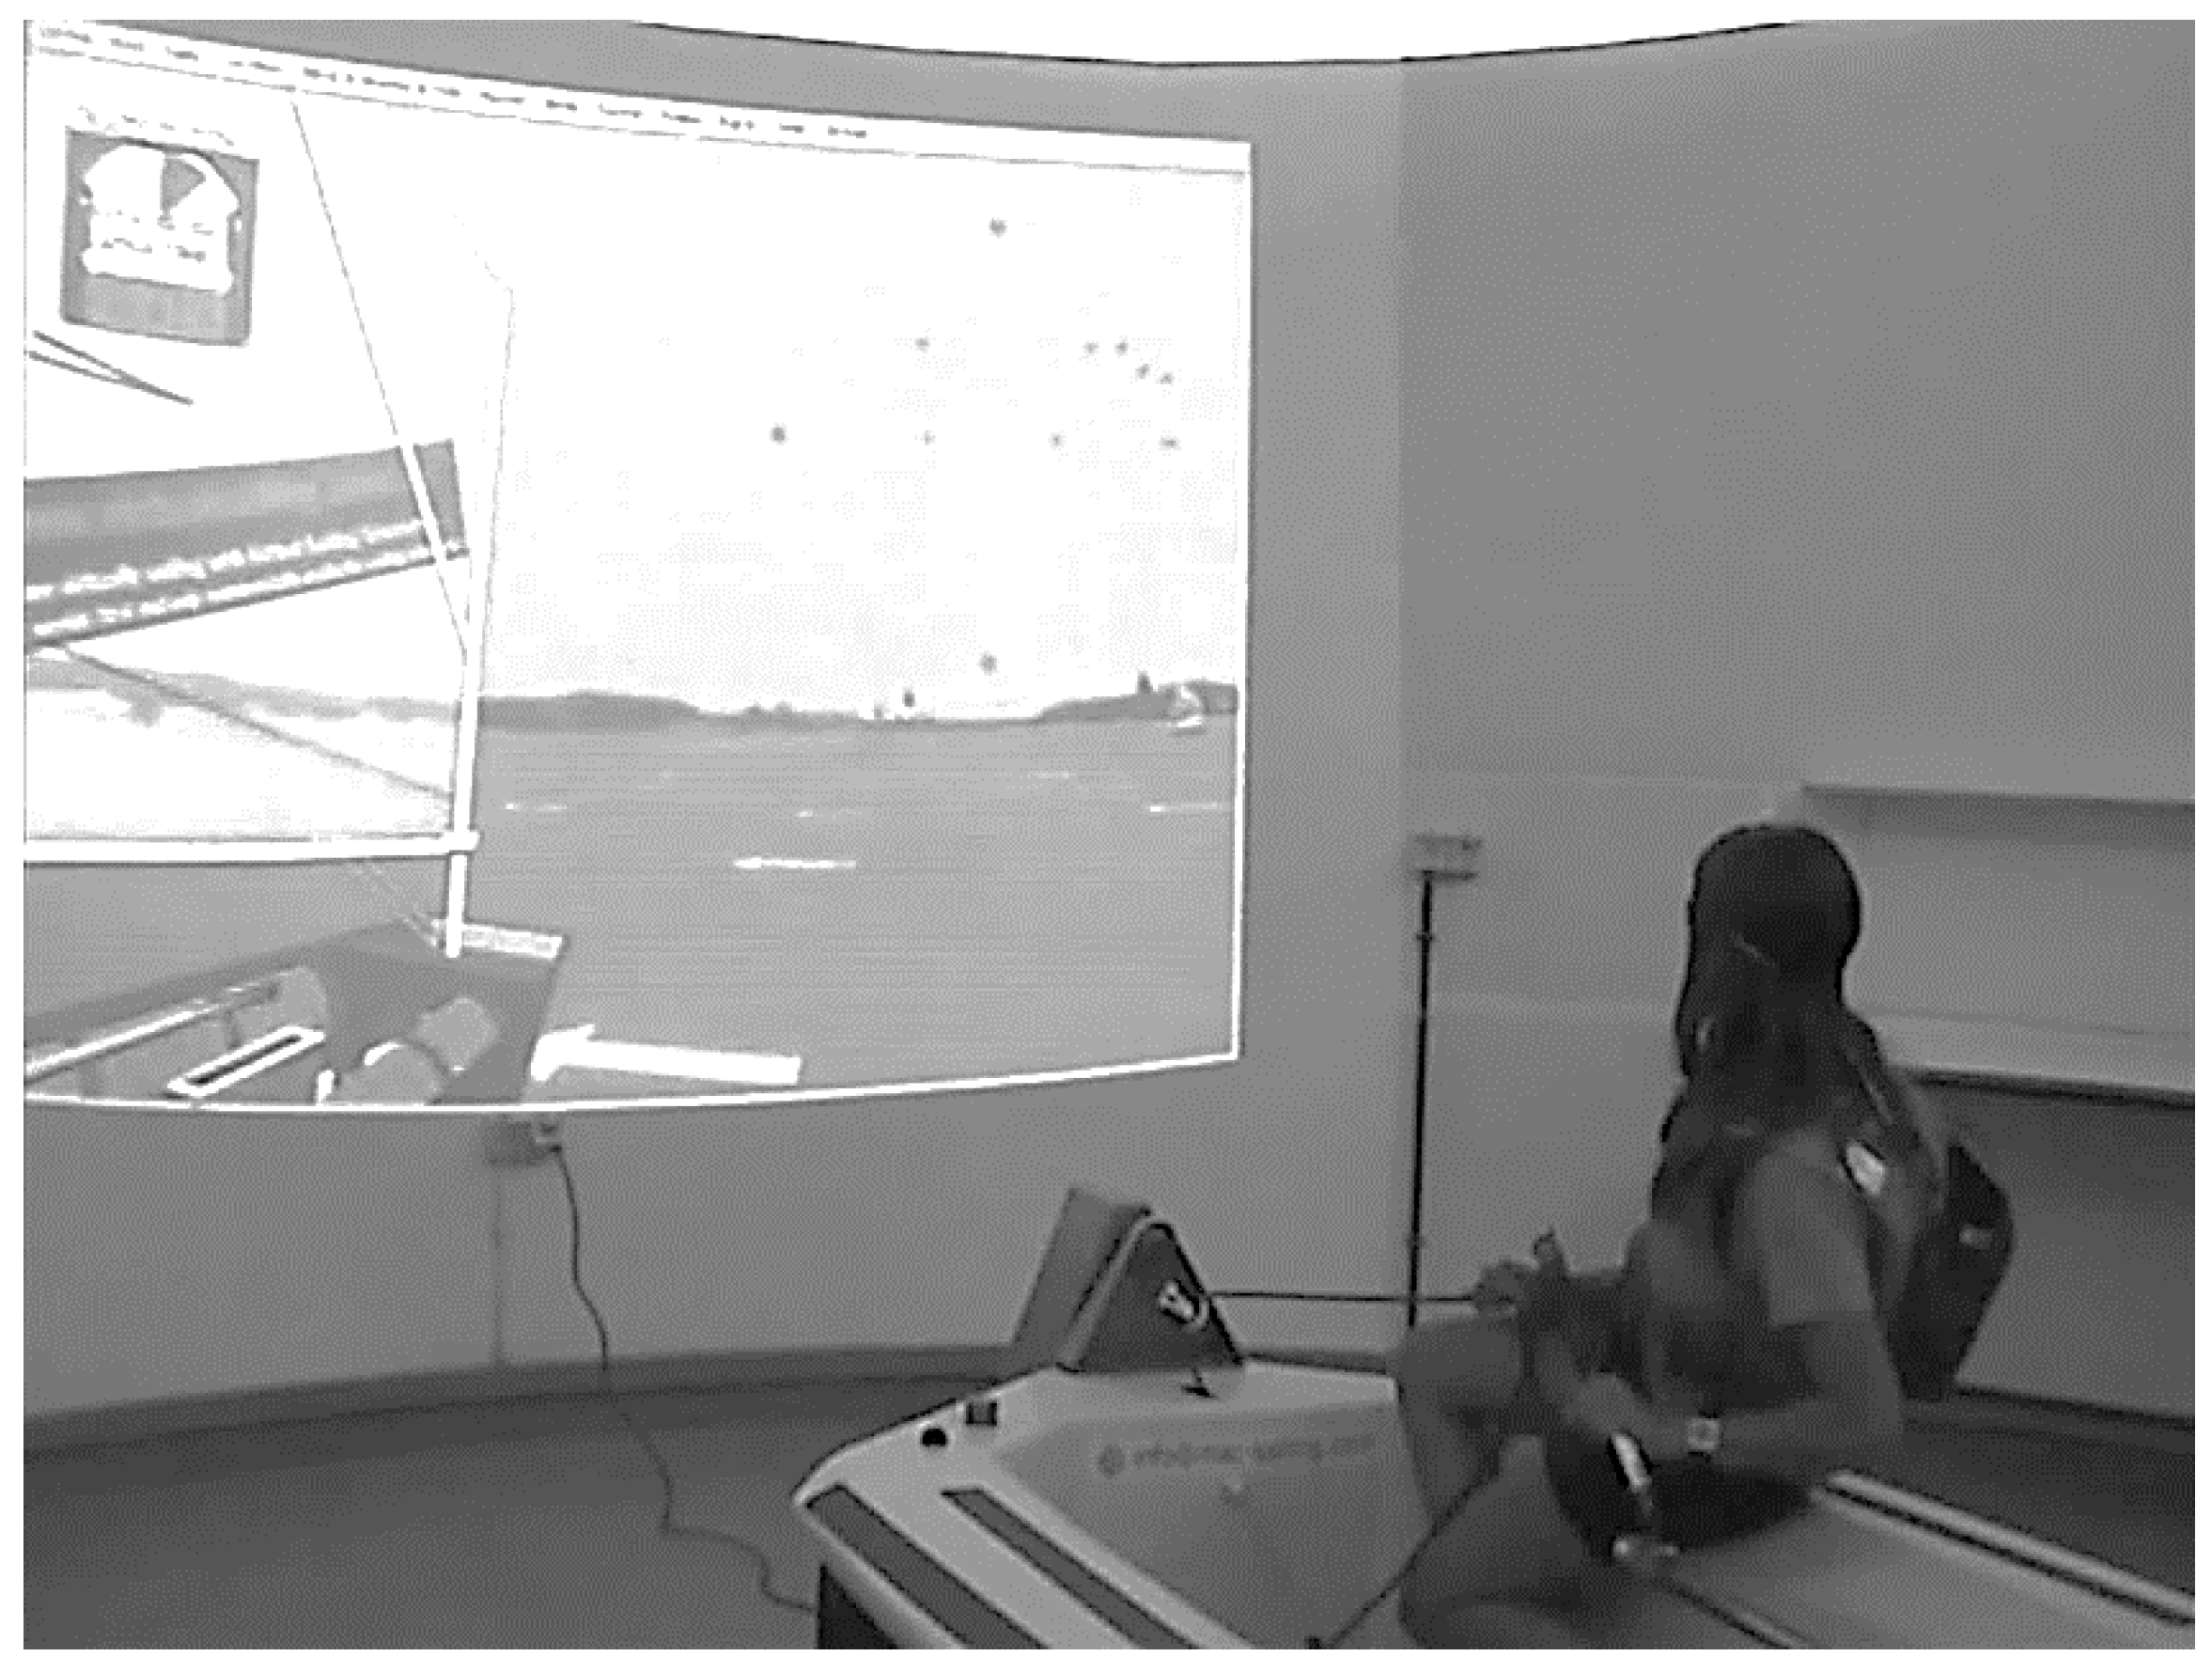
The sailors participated in a familiarization session with the vSail-Trainer® simulator (Figure 1). This session consisted of a three-minute free navigation session and a guided navigation session, which included three minutes of directive audio that the sailors were required to follow.
The measurement protocols were defined following this familiarization process. The sailors controlled the simulator in the same way as they would an actual boat, using the rudder to control the course/direction and a mainsheet to control the mainsail (Figure 1). Sailors had to control the heeling of the boat, changing their body position. The scene simulation was shown to the sailors using a multimedia projector (Toshiba EX21, Barcelona, Spain) and a loudspeaker system (Logitech Z623, Murcia, Spain), through which the sounds of the race—the wind, sea, sail movements and start signal—were reproduced. The image size (2.00 × 2.50 m) was designed to simulate a real situation [25]. The virtual situation was controlled by the simulator software (Virtual Sailing Pty Ltd, Melbourne, Australia), which can establish a wind strength of 12 knots, stable winds, and unfavorable starts. During the race, the participants competed against five rivals of different skill levels. Skill levels were predetermined using the time taken to cross the start line after the start signal was given.
The experimental setup reproduced an actual race start. The start was characterized by a pre-start procedure. During this time, sailors had to begin the race by searching for the best position on the start line before the start signal was given. The gaze measurement was taken for two race starts. Each race lasted for 5 min.
FuzzyEn and DFA Analysis
The time series corresponding to eye movement and eye velocity was analyzed during the 5 min the race lasted. The eye velocity was computed from the calculation of the first temporal derivative of the eye position signal. Gaze behavior data were collected at 30 Hz. The size of the time series in all cases was greater than N = 3500 samples, guaranteeing a good size for FuzzyEn’s calculation and the application of the DFA [26]. An application within Labview 2017 (Mathworks, Natick, MA, USA), developed in our laboratory, was used to perform the data analysis.
FuzzyEn is part of a set of entropy measures such as ApEn, SampEn, multiscale entropy, Shannon entropy or permutation entropy which, applied to different biological signals, have demonstrated their usefulness in detecting losses of regularity in the biological signals associated with changes in the performance of the motor skills required to maintain balance [27].
In order to find the FuzzyEn for a sample time series , a given m forms vector sequences as follows :
where represents m consecutive u values, commencing with the ith point and generalized by removing a baseline:
For a certain vector , define the distance between and as the maximum absolute difference of the corresponding scalar components:
Given n and r, calculate the similarity degree of to through a fuzzy function :
where the fuzzy function is the exponential function:
Define the function as as:
Similarly, form and get the function :
Finally, we can define the parameter FuzzyEn(m, n, r) of the sequence as the negative natural logarithm of the deviation of from :
Which, for finite datasets, can be estimated by the statistic:
For FuzzyEn, we used the following parameters: vector length, m = 2; tolerance window, r = 0.2 × standard deviation; and gradient, n = 2. According to different authors, these parameter values show high consistency and hardiness for noise and a larger margin for the establishment of the parameters that it uses for the calculation and are thus the most frequently used [28,29,30].
DFA was initially proposed to detect long-range correlations in DNA sequences [31], although it has also been applied to other biological signals, mainly in analyzing the positions of the center of pressures and body balance. Long-range correlations are detected by the quantitative index, called scale α, that represents the properties of signal correlation [32].
Different DFA values indicate the following: α > 0.5 implies persistence (i.e., the trajectory tends to continue in its current direction); α < 0.5 implies anti-persistence (i.e., the trajectory tends to return to where it came from [33]). DFA has an advantage in that it eliminates local trends in a non-stationary time series, reporting on long-term variations and on the large-scale relationships that exist in it [34]. The method is used to eliminate trends in the signal that would not be related to its properties of correlation, but with external conditions that would be generating noise in the signal (for example, physiological processes). In this way, the DFA can help identify different conditions of the same system with different scale behaviors.
To analyze the temporal series of N points, {Zt, t = 1, …, N} the following steps are followed:
The accumulated series is calculated:
where:
is the global average.
Before setting the serial Z(t), a certain number Nb of boxes contain all of the Nτ points and their temporary size is τ. These boxes may or may not overlap with each other. In each box, the trend of the points that form it is eliminated. These trends involve eliminating constant and linear trends in the original signal, respectively.
Local trends are labelled as Zkfit (t), where the index k indicates the box number, and from them the detrended fluctuation function is obtained in the following way:
For each value of τ, the function is calculated:
which measures the fluctuation of the root mean square.
If the signal has a scale behavior, then:
where the scale or correlation exponent provides information about the correlation properties of the signal.
Thus, the DFA applied to the time series obtained for eye movements would permit the detection of the existence of long-range correlations, which would reflect the influence of past events on the future evolution of the signal [35,36].
The slope α of DFA was obtained from the window range 4 ≤ N ≤ N/10 to maximize the long-range correlations and reduce the errors incurred by α estimation [30,37]. All variables were calculated for the position and velocity of eye movements.
The Saphiro–Wilk test showed a normal data distribution. The Multivariate Analysis of Variance test with variance homogeneity (F-statistic) and p-value was applied. Bonferroni adjustments was applied to identify if the spatial axis of movement, experience and ranking have significant effects on the complexity and regularity of the visual behavior and their degree of association. Effect sizes were estimated with partial eta squared (η2p). Pearson correlation coefficients were estimated to analyze the link between the complexity of visual behavior and a sailor’s ranking and experience.
3. Results
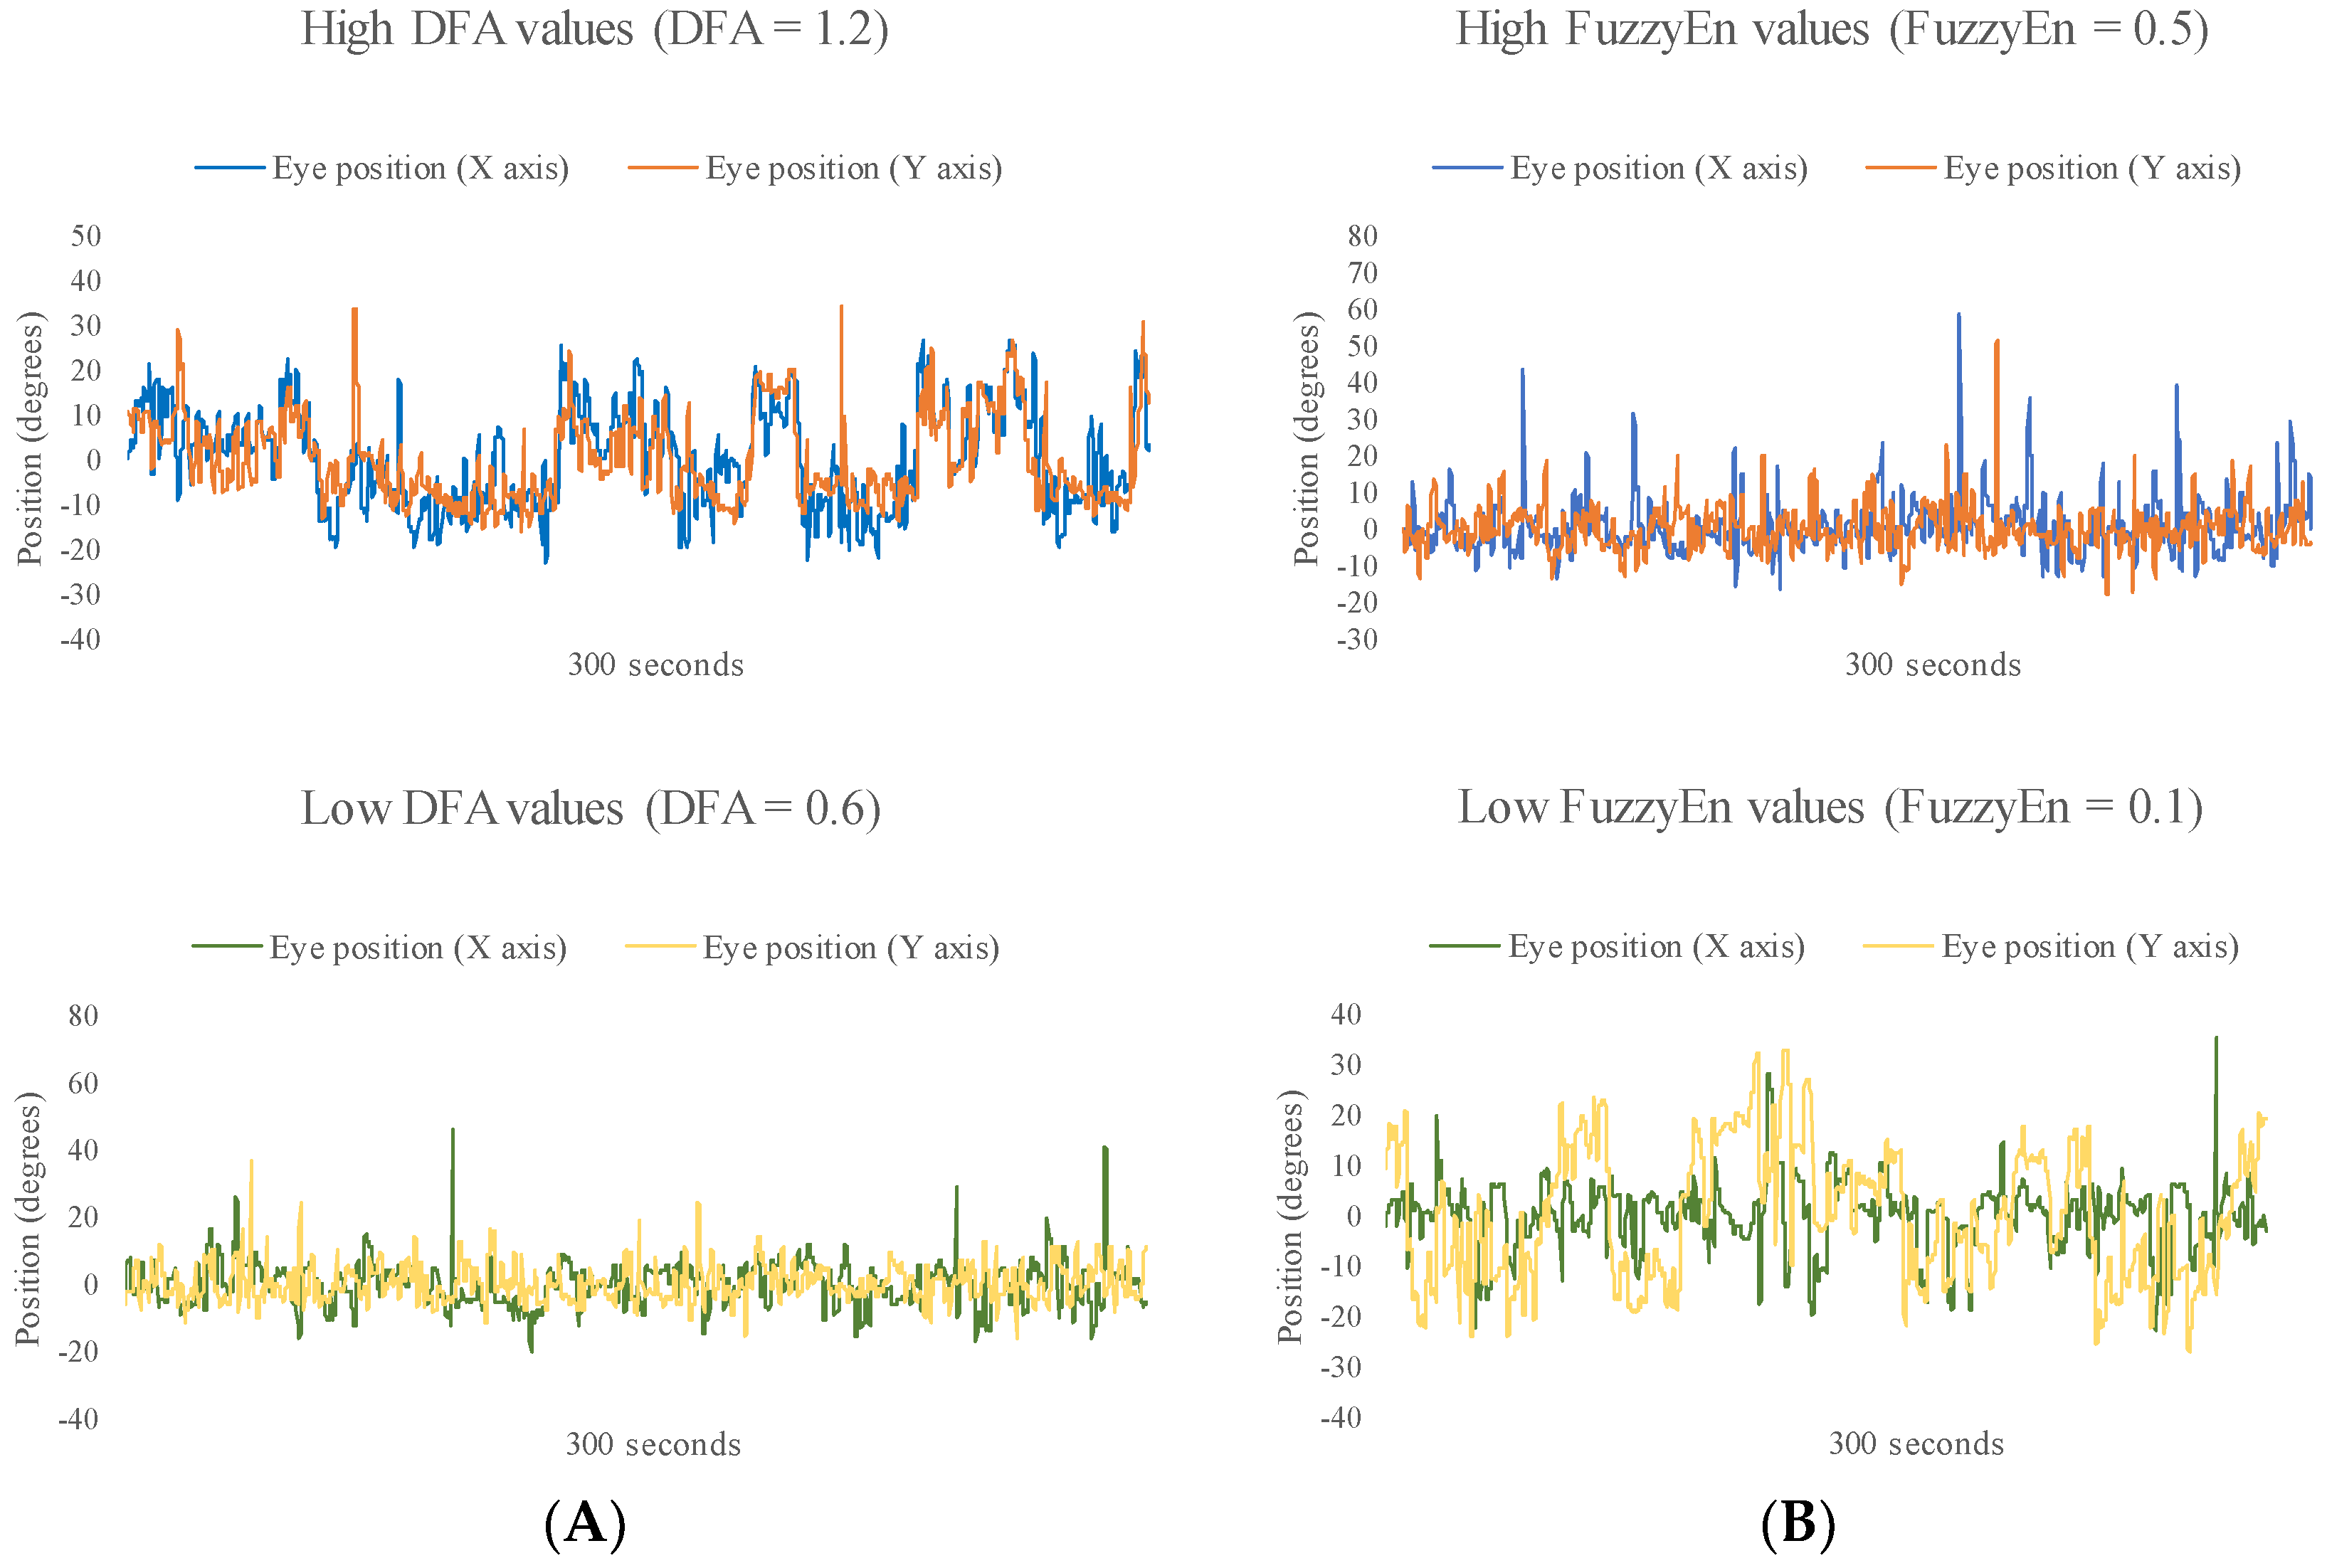
Based on the information compiled from eye movements, the irregularity and complexity of the sailors’ visual behavior were analyzed for learning ages across FuzzyEn and DFA. Figure 2, presented to understand the data analyzed, shows one example of the eye movement signals with low and high values of DFA and FuzzyEn during eye movements at the scene of the race starts.
Figure 3 is also presented to understand the analyzed data. Figure 3 reflects a sailor’s eye movements at the race start for horizontal and vertical spatial axes. It is observed that the eye movements cover the whole projected scene, with some horizontal movements towards external stimuli.
For p-values ≥ 0.05 and F-values with equality of variances, there are no significant differences according to ranking or experience (Table 1). FuzzyEn values for eye position are lower than the eye movement velocity values. Neither the position in the ranking, nor the years of sailing experience are variables that affect the regularity of eye movements in a simulated navigation situation (p-values ≥ 0.05; Table 1). There were no differences in FuzzyEn on the horizontal or vertical axes, nor in the eye position velocity with respect to the movement axes—X horizontal and Y vertical axes—nor between the first and the second regatta (p-values ≥ 0.05; Table 1).
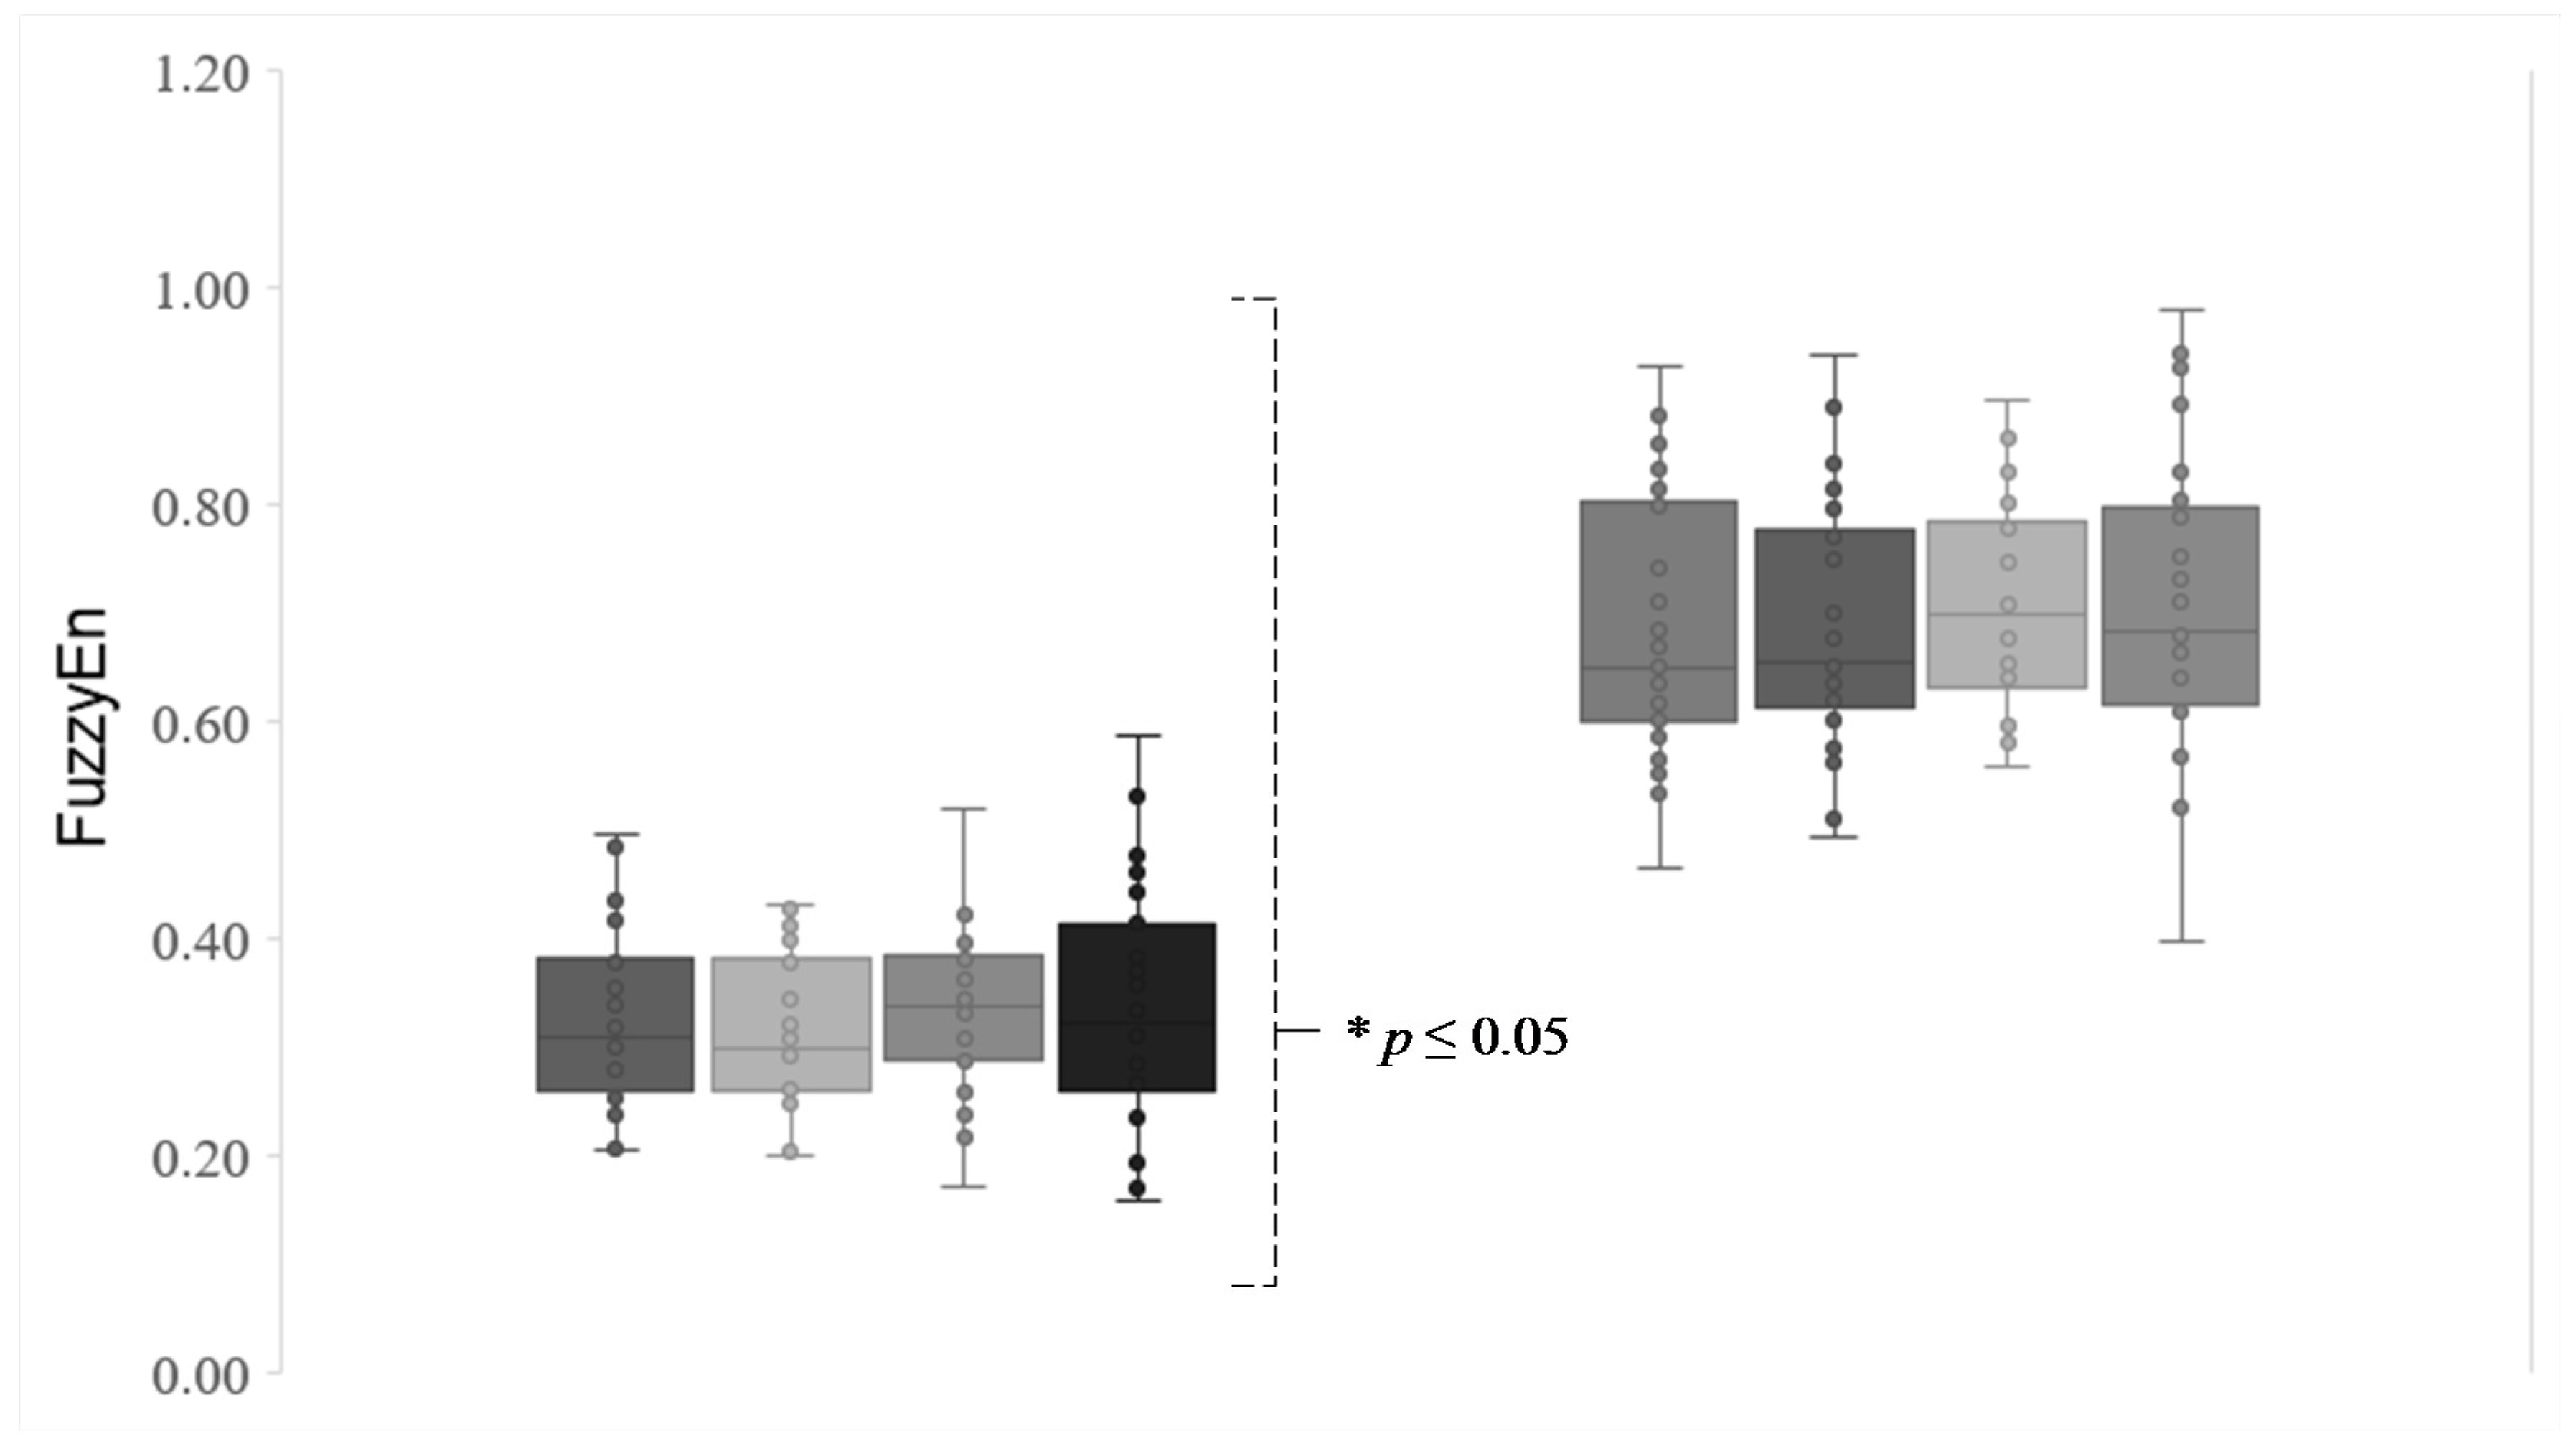
Regarding eye motion, all sailors show more regular visual behavior or periodic eye position (p-values ≤ 0.05) and more irregular visual behavior in eye movement velocity (p-values ≤ 0.05) (Figure 4).
A significant but low correlation has been found between the regularity of the eye movements and the age of sailors, establishing an inverse relationship between these variables (Figure 5). At the first regatta start, it can be seen that all younger sailors demonstrated major regularity in their eye velocity along the vertical axis (r = −0.42, p = 0.019). In the second regatta, the younger sailors presented a major regularity in the position of the eyes (r = −0.36, p = 0.049) and velocity of movement in the vertical axis (r = −0.36, p = 0.047). This result is also observable in the horizontal axis (r = −0.38, p = 0.038).
The p-values ≥ 0.05 and F-values indicate that, with equality of variances, there are no significant differences according to ranking or experience (Table 2). The DFA alpha values applied to eye position are higher than the eye movement velocity values. Neither the ranking position nor the years of sailing experience are variables that affect the complexity of eye movements (p-values ≥ 0.05; Table 2). There are no differences in DFA alpha values for position or for eye movement velocity, depending on the axis of —X horizontal and Y vertical axes—nor between the first and the second regatta (p-values ≥ 0.05; Table 2).
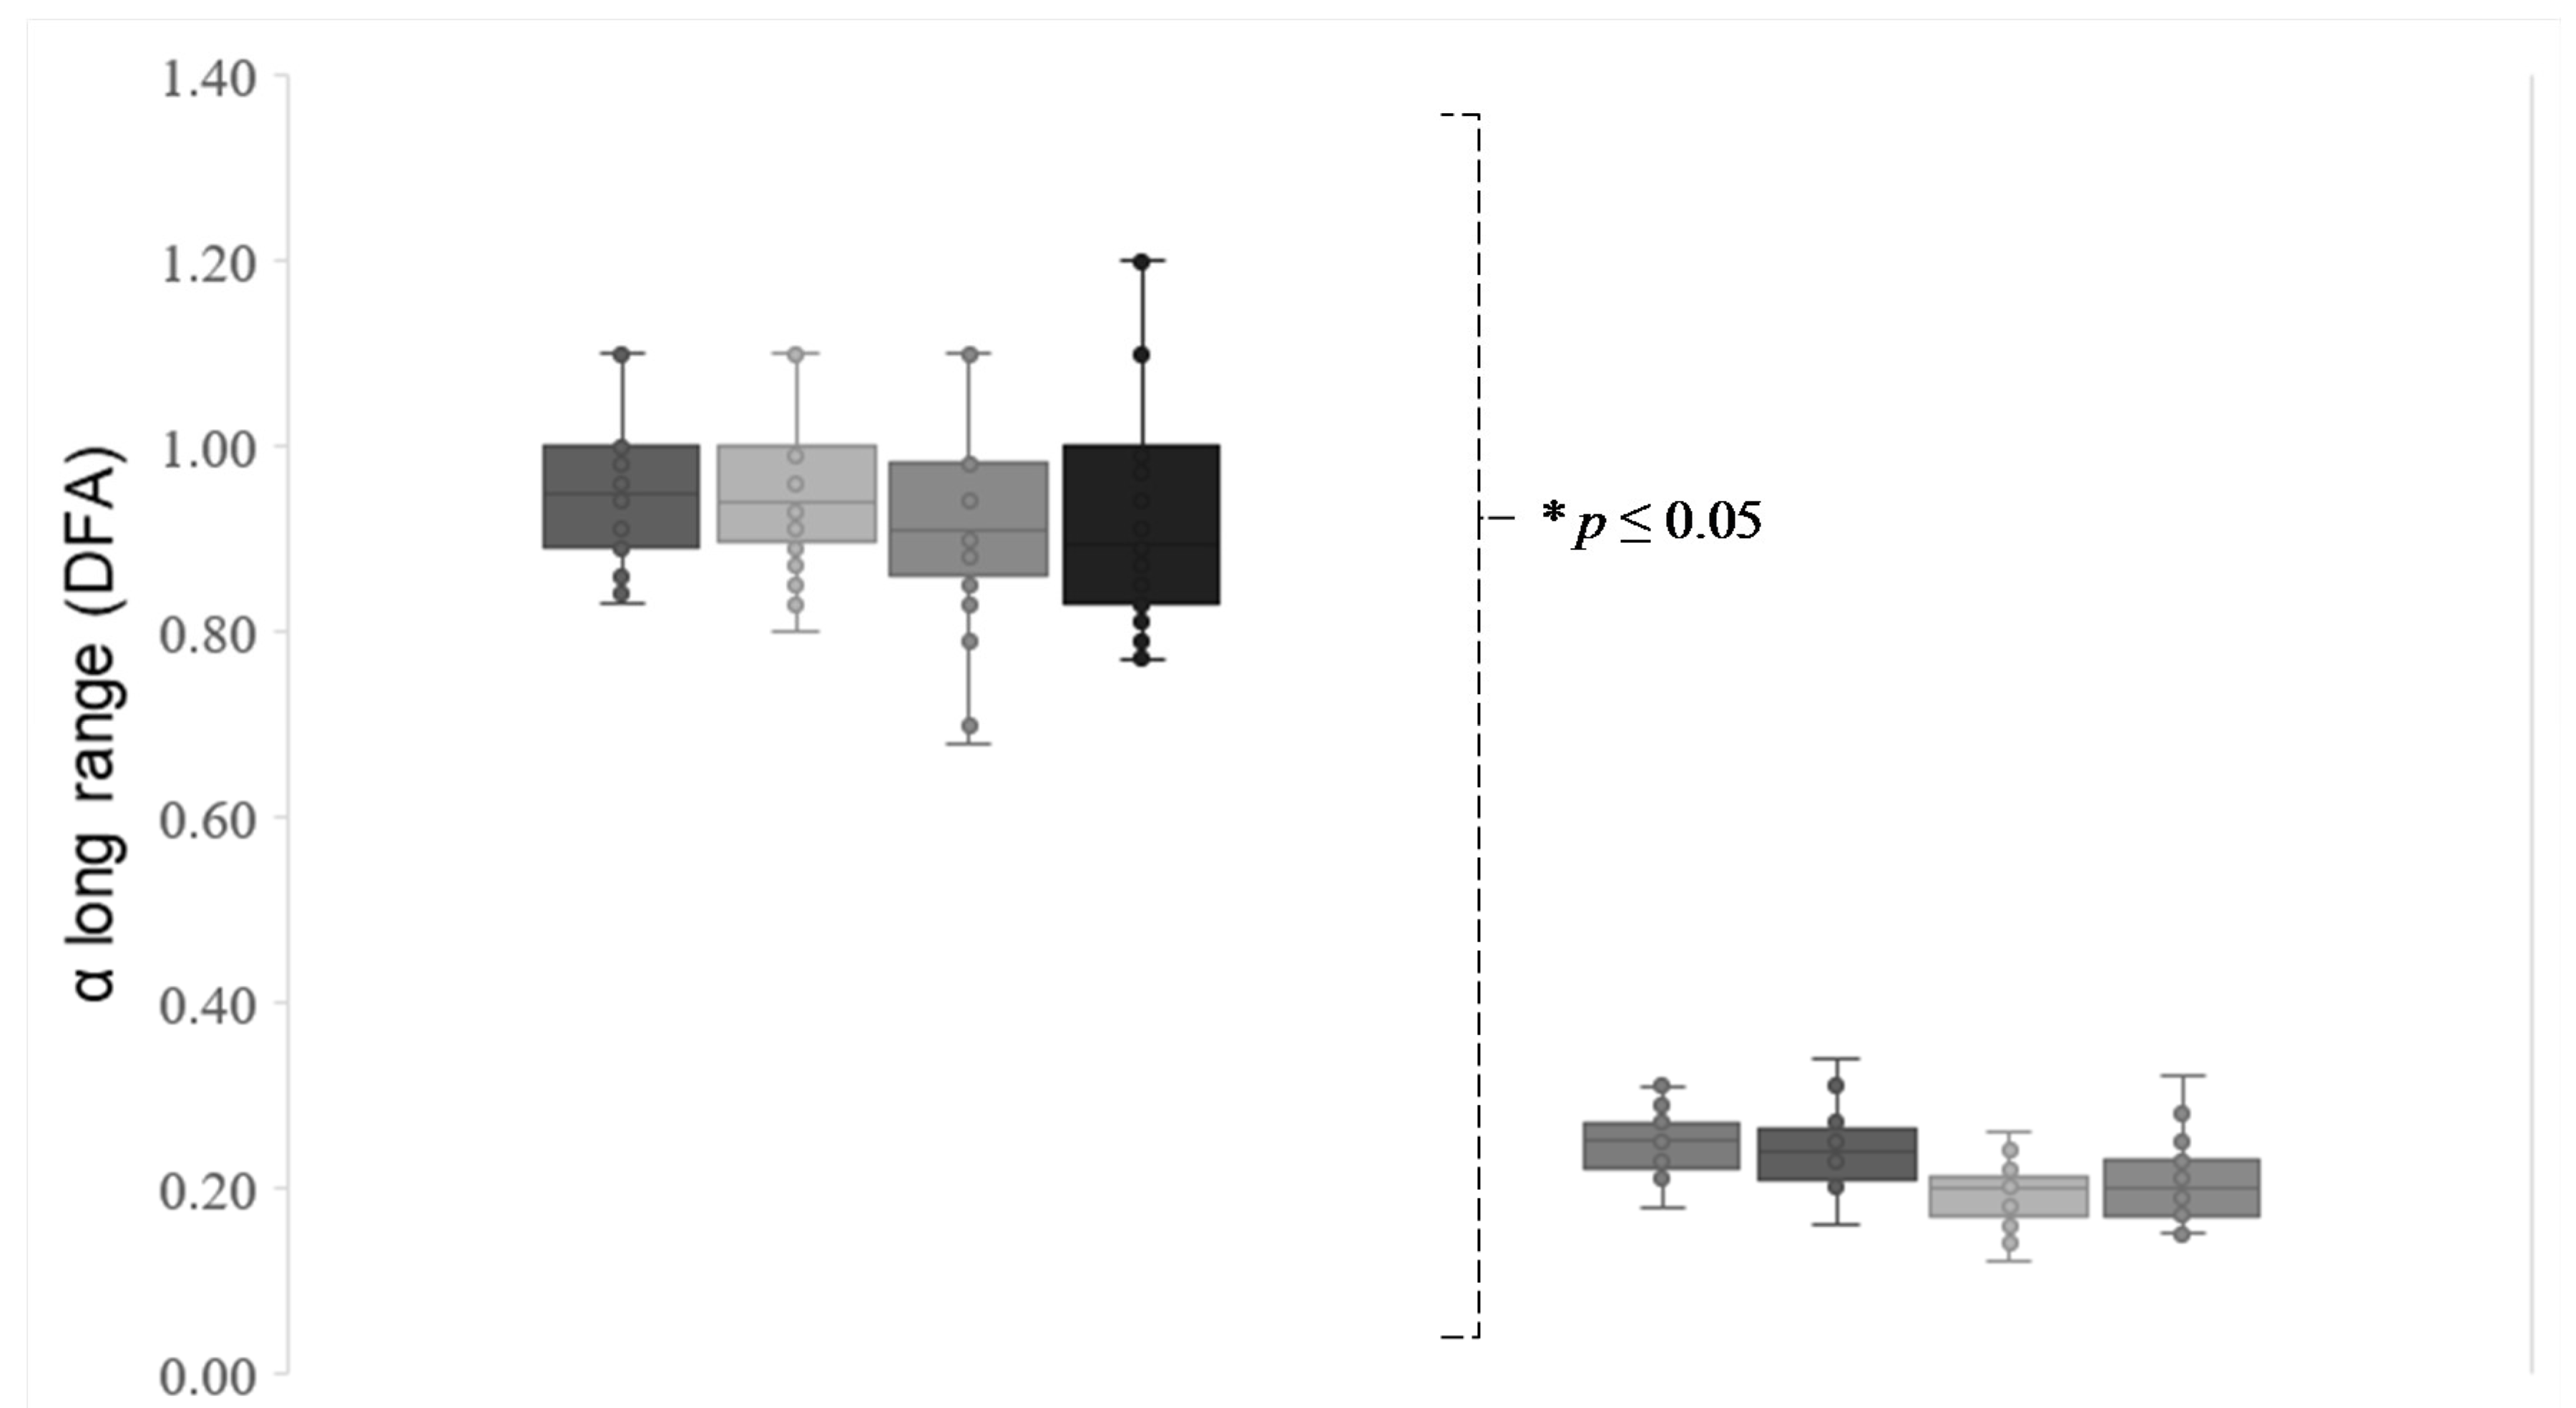
With regard to eye movement, all the sailors showed a significantly more complex visual behavior in eye position (p-values ≤ 0.05) and less complex visual behavior in eye movement velocity (p-values ≤ 0.05) (Figure 6).
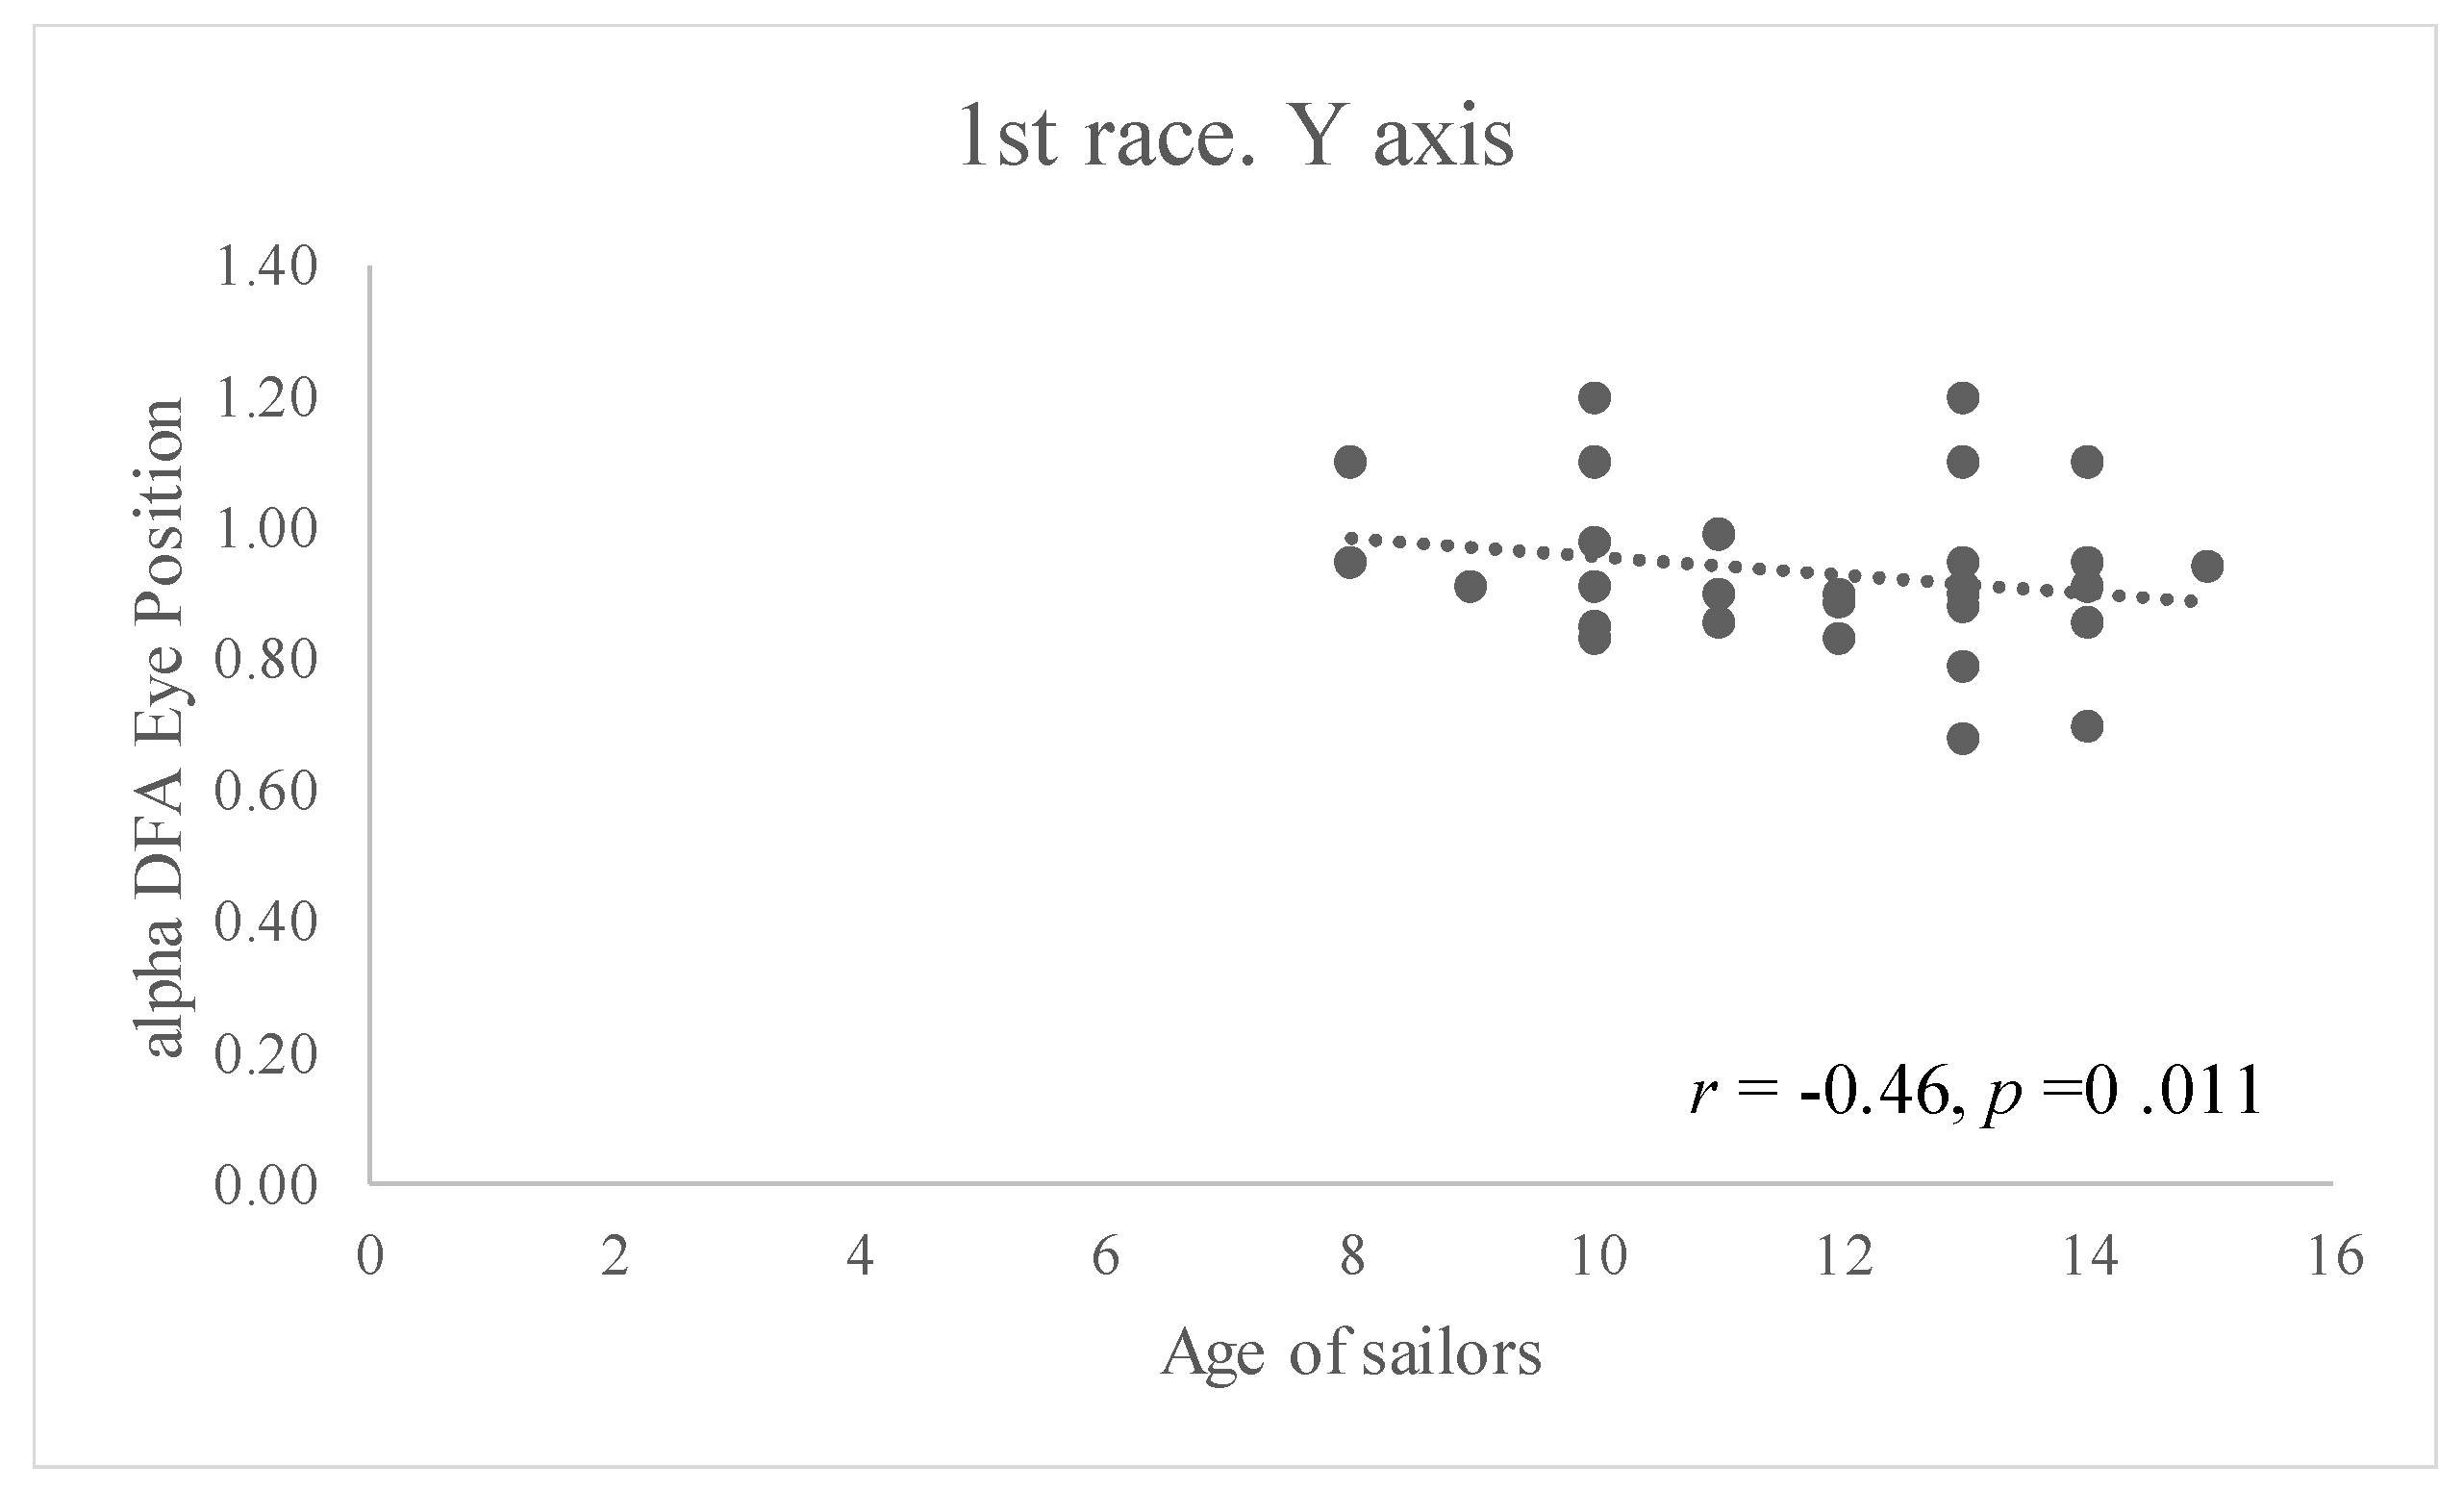
In the case of the DFA values obtained, a significant correlation has only been found between eye movement complexity and the sailors’ age, showing an inverse relationship between these variables (Figure 7). In the first regatta, it can be seen that all younger sailors demonstrated major complexity in their eye position along the vertical axis (r = −0.46, p = 0.011).
4. Discussion
Regarding the analysis of visual behavior in sailors during simulated navigation, it has been stated that neither experience nor ranking affect the regularity or the complexity of eye movement positions or velocities. The movement directions—horizontal and/or vertical—show no differences in eye position or velocity in terms of regularity, but this is not true in terms of complexity.
Eye movement velocity presents the greatest irregularity, with significantly higher values than eye movement position. These differences coincide with the results found in other biological signals studied in previous research studies. Caballero, Barbado, and Moreno [37], who analyze the behavior of the center of pressure (COP) in balance tasks, conclude that the behavior of COP velocities was more irregular than positions.
These results seem to indicate that the biological signals of velocity registered in different human body systems would show, with a pre-established form, irregular functioning. According to several authors, this behavior can be related to healthy or functional conditions of the central nervous system, which would facilitate ideal functioning of the above-mentioned systems [9].
Thus, the irregularity observed in eye movement velocity would effectively facilitate the visual perception of the environment, increasing the possibilities of discovering a greater quantity of relevant information to achieve good results in the action and to reject less-relevant information in a shorter period of time.
This characteristic of visual behavior would be decisive to execute anticipation skills in many situations such as driving a car, some sports practices or the start of a regatta with unstable environmental conditions, having a positive effect on motor skills.
With regard to the analysis of complexity, it is only clear that eye positions show a more complex behavior than the eye velocities registered. This result contrasts with that observed in the analysis of regularity, and coincides once again with other previous results [37]. In this case, the greatest complexity observed in eye position would allow for a more functional exploration of the environment by sailors, optimizing the extraction of information and contributing to an increase in perceived visual performance.
The contradictory result shown between FuzzyEn and DFA is remarkable. FuzzyEn shows greater irregularity in terms of its velocity variability whereas DFA shows greater complexity in terms of position variability. Irregularity in a biological signal is related to its predictability, and complexity seems to be related to functional health or performance status [27,38]. Therefore, greater irregularity means that eye movement velocity signal would be more unpredictable and would not necessarily represent an increase in complexity. Being more unpredictable could relate to more random behavior.
On the other hand, DFA would be an appropriate tool to identify the complexity of biological signals [35,36] and therefore of eye movements. Thus, the greater complexity detected in eye position, in a search for the stimuli that exist in the race scene, would indicate an exploratory or functional behavior more associated with a better visual perception strategy.
It is also necessary to emphasize the relationship encountered between age, complexity, and regularity in the visual behavior of low-ranking sailors. It seems that a younger age would relate to more regular visual behavior and, therefore, be more associated with a predictable functioning of the visual system in young individuals. On the other hand, at younger ages, eye positions present a more complex behavior. This result might be associated with the need to direct the eyes to more present indexes of information in the environment and still not having the necessary experience to select the significant information directly. This would be a result to be taken into account, since we would then see a functional visual behavior, as indicated in other studies [19], which could allow sailors to optimize their visual search strategy. Further, these results are in line with those obtained by Manzanares et al. [39], which showed that bottom-ranking sailors, who have a lower level of experience, performed fewer recurrent fixations on locations than top-ranking sailors. This more erratic visual behavior may be related to a higher complexity index, although this was not analyzed in that research study.
In view of the results obtained, and considering the human body as a dynamic complex system which is energetically opened and in constant interaction with the environment, we raise the possibility that the human eye could function based on irregular and complex properties that coexist during the processes of visual perception of the environment, showing greater irregularity in eye position and greater complexity in the velocities reached. These characteristics are related to a functional behavior of the central nervous system based on complexity and stability, and, in addition, are associated with the aptitude of humans to adapt to the environment [13,14].
In this sense, although research in different scientific areas proposes the human being as a complex dynamic system in mutual interaction with the environment, characterized by a non-linear behavior (e.g., standing balance [7,40], muscular activity [6], brain and heart behavior [1,2,3,4,5]), we believe that, to date, we do not have the necessary knowledge to generalize the results of all the biological signals registered in different contexts. Although dynamic and complex behavior is observed in this study on visual behavior, research must continue, without discarding the combination of linear and non-linear analyses that can be combined to increase knowledge. In our case, we have approached this perspective from sports practice in order to use a tool that can provide more information about how young sailors’ gaze behavior presents during a simulated regatta. We do not want to conclude that the observed results explain the visual behavior of the human being in a generalized way, but to establish a starting point that, coinciding with the proposals of other investigations about the complex and dynamic behavior of biological systems, allows us to raise new investigations in order to guide coaches in the visual perceptive training of their athletes.
5. Conclusions
Neither experience nor ranking affect the regularity or the complexity of eye movement positions or velocities. Younger age is related to more regular visual behavior. At younger ages, eye positions present a more complex behavior. Eye positions show a more complex behavior than eye velocities.
Eye movement velocity presents the greatest irregularity, with significantly higher values than eye movement position.
The results of this research leave a series of questions that might lay the foundations for future investigations. Firstly, it will be necessary to investigate the regularity and complexity of the visual behavior of human beings in other contexts in order to state that visual human behavior is irregular in terms of eye position and complex in terms of eye velocity. Along with the incorporation of a nonlinear analysis of the visual behavior of adults during the handling of the boat, the generalization of the results could contribute to this.
Secondly, it would be interesting to provide more results about the absence of a difference in the regularity and complexity of visual behavior due to the age, experience or performance level of the participants. The non-linear tools used in this study—FuzzyEn and DFA—do not seem to discriminate between these variables and the level of the perceptive-visual performance of the participants. Even so, it would be interesting to analyze the characteristics of the previous constraints of the task present in the environment of practice, since, as shown by Caballero et al. [7], the complexity of biological signals may be altered by this variable.
It is also necessary to emphasize the progress in the state of the field of this work, having characterized visual behavior based on recording and analyzing time series and applying non-linear tools. This research permits continuing with a topic of research, already advanced in other biological signals, that is demonstrating highly relevant conclusions in terms of human behavior in sports.
In the same way, we believe that the results obtained contribute in a very relevant way to the scientific advances in research area that could generate very valuable knowledge to interpret, in a holistic way, visual behavior during the perception of stimuli in sports tasks and extrapolated to other situations of life (e.g., car drivers or air traffic controllers).
Finally, it would also be important to incorporate movement capture systems that are able to register head movements as these affect visual behavior. Zu, Ji and Bennett [41] proposed a mapping function for tracking eye gaze that allows for natural head movement. In addition, currently, different portable systems of eye-tracker glasses incorporate inertial sensors that integrate, in a single device, the capture of the movements of the head and visual behavior. Similarly, it would be essential to use ocular movement capture systems that use sampling frequencies higher than 120 Hz, or more than the one used in this research (30 Hz). The aim would be to avoid a possible loss of information related to the velocity of the eye during movements, which directly influences the dynamics of eye movement.
Finally, it should be noted that knowledge of the sport of sailing leads us to think that the strategies of visual exploration do not fluctuate over time, although there are no data on this in the scientific literature reviewed to confirm our position. It would be very interesting to use other analytical tools in future research to generate knowledge on this issue.
Author Contributions
Conceptualization, R.M.; Methodology, R.M., A.M. and F.S.; Software, R.M. and A.M.; Validation, R.M. and A.M.; Formal Analysis, R.M.; Investigation, A.M., F.S. and R.M.; Resources, F.S.; Data Curation, R.M. and A.M.; Writing—Original Draft Preparation, R.M.; Writing—Review & Editing, R.M. and A.M.; Visualization, F.S.; Supervision, F.S. and R.M.; Project Administration, F.S.; Funding Acquisition, F.S.
Acknowledgments
We thank Francisco J. Moreno, head of the research group APCOM, Research Centre of Sports, University Miguel Hernández, for providing his cooperation in this investigation. We thank Mark Habgood and Norman Saunders, professors at the University of Melbourne (Australia), and Virtual Sailing Pty Ltd., creators of VSail-Trainer® simulator, for all of the help they provided.
Conflicts of Interest
The authors declare no conflict of interest.
References
- Hekim, M. The classification of EEG signals using discretization-based entropy and the adaptive neuro-fuzzy inference system. Turk. J. Electr. Eng. Comput. Sci. 2016, 24, 285–297. [Google Scholar] [CrossRef]
- Euler, M.J.; Wiltshire, T.J.; Niermeyer, M.A.; Butner, J.E. Working memory performance inversely predicts spontaneous delta and theta-band scaling relations. Brain Res. 2016, 1637, 22–33. [Google Scholar] [CrossRef] [PubMed]
- Simons, S.; Espino, P.; Abásolo, D. Fuzzy Entropy Analysis of the Electroencephalogram in Patients with Alzheimer’s Disease: Is the Method Superior to Sample Entropy? Entropy 2018, 20, 21. [Google Scholar] [CrossRef]
- Soliński, M.; Gierałtowski, J.; Żebrowski, J. Modeling heart rate variability including the effect of sleep stages. Chaos 2016, 26, 023101. [Google Scholar] [CrossRef] [PubMed]
- Germán-Salló, Z.; Germán-Salló, M. Non-linear Methods in HRV Analysis. Procedia Technol. 2016, 22, 645–651. [Google Scholar] [CrossRef]
- Xie, H.B.; Sivakumar, B.; Boonstra, T.W.; Mengersen, K. Fuzzy entropy and its application for enhanced subspace filtering. IEEE Trans. Fuzzy Syst. 2018, 26, 1970–1982. [Google Scholar] [CrossRef]
- Caballero, C.; Barbado Davids, K.; Moreno, F.J. Variations in task constraints shape emergent performance outcomes and complexity levels in balancing. Exp. Brain Res. 2016, 234, 1611–1622. [Google Scholar] [CrossRef] [PubMed] [Green Version]
- Menayo, R.; Encarnación, A.; Gea, G.M.; Marcos, P.J. Sample entropy-based analysis of differential and traditional training effects on dynamic balance in healthy people. J. Mot. Behav. 2014, 46, 73–82. [Google Scholar] [CrossRef] [PubMed]
- Renart, A.; Machens, C.K. Variability in neural activity and behavior. Curr. Opin. Neurobiol. 2014, 25, 211–220. [Google Scholar] [CrossRef] [PubMed]
- Manor, B.; Lipsitz, L.A. Physiologic complexity and aging: Implications for physical function and rehabilitation. Prog. Neuro-Psychopharmacol. Biol. Psychiatry 2013, 45, 287–293. [Google Scholar] [CrossRef] [PubMed] [Green Version]
- Lipsitz, L.A.; Goldberger, A.L. Loss of ‘complexity’ and aging: Potential applications of fractals and chaos theory to senescence. J. Am. Med. Assoc. 1992, 267, 1806–1809. [Google Scholar] [CrossRef]
- Goldberger, A.L. Non-linear dynamics for clinicians: Chaos theory, fractals, and complexity at the bedside. Lancet 1996, 347, 1312–1314. [Google Scholar] [CrossRef]
- Riley, M.A.; Turvey, M.T. Variability and determinism in motor behavior. J. Mot. Behav. 2002, 34, 99–125. [Google Scholar] [CrossRef] [PubMed]
- Davids, K.; Glazier, P.; Araujo, D.; Bartlett, R. Movement systems as dynamical systems: The functional role of variability and its implications for sports medicine. Sports Med. 2003, 33, 245–260. [Google Scholar] [CrossRef] [PubMed]
- Chiang, J.Y.; Huang, J.W.; Lin, L.Y.; Chang, C.H.; Chu, F.Y.; Lin, Y.H.; Chiang, F.T. Detrended fluctuation analysis of heart rate dynamics is an important prognostic factor in patients with end-stage renal disease receiving peritoneal dialysis. PLoS ONE 2016, 11, e0147282. [Google Scholar] [CrossRef] [PubMed]
- Glass, L. Synchronization and rhythmic processes in physiology. Nature 2001, 410, 277–284. [Google Scholar] [CrossRef] [PubMed]
- Turchetti, C.; Crippa, P.; Pirani, M.; Biagetti, G. Representation of nonlinear random transformations by non-Gaussian stochastic neural networks. IEEE Trans. Neural Netw. 2008, 19, 1033–1060. [Google Scholar] [CrossRef] [PubMed]
- Harezlak, K.; Kasprowski, P. Searching for Chaos Evidence in Eye Movement Signals. Entropy 2018, 20, 32. [Google Scholar] [CrossRef]
- Manzanares, A.; Menayo, R.; Segado, F.; Salmerón, D.; Cano, J.A. A probabilistic model for analysing the effect of performance levels on visual behaviour patterns of young sailors in simulated navigation. Eur. J. Sport Sci. 2015, 15, 203–212. [Google Scholar] [CrossRef] [PubMed]
- Williams, A.M.; Davids, K.; Williams, J.G. Visual Perception and Action in Sports; E & FN Spon: London, UK, 1999. [Google Scholar]
- Aştefănoaei, C.; Pretegiani, E.; Optican, L.M.; Creangă, D.; Rufa, A. Eye movement recording and nonlinear dynamics analysis—The case of saccades. Romanian J. Biophys. 2013, 23, 81–92. [Google Scholar] [PubMed]
- Murata, A.; Matsuura, T. Nonlinear dynamical analysis of eye movement characteristics using attractor plot and first lyapunov exponent. In Proceedings of the International Conference on Human-Computer Interaction, Los Angeles, CA, USA, 2–4 August 2015; Springer: Cham, Switzerland, 2015; pp. 78–85. [Google Scholar]
- Santos, J. Análise do Desempenho na Largada em Regatas à Vela Perante Diferentes Tipos de Intervenção. Unpublished Ph.D. Thesis, Universidade de Coimbra, Coimbra, Portugal, 2013. [Google Scholar]
- Manzanares, A.; Segado, F.; Menayo, R. Development of a protocol of recording the visual and motor behavior for scientific support in the teaching and training of sail in simulator. J. Navig. 2016, 69, 582–592. [Google Scholar] [CrossRef]
- Reina, R.; Luis, V.; Sanz, D.; Sabido, R.; García, J.A.; Moreno, F.J. The effect of the server perform-side on the visual behavior of tennis and wheelchair tennis players. J. Hum. Mov. Stud. 2004, 47, 25–46. [Google Scholar]
- Yentes, J.M.; Hunt, N.; Schmid, K.K.; Kaipust, J.P.; McGrath, D.; Stergiou, N. The appropriate use of approximate entropy and sample entropy with short data sets. Ann. Biomed. Eng. 2013, 41, 349–365. [Google Scholar] [CrossRef] [PubMed]
- Barbado, D.; Sabido, R.; Vera-García, F.J.; Gusi, N.; Moreno, F.J. Effect of increasing difficulty in standing balance tasks with visual feedback on postural sway and EMG: Complexity and performance. Hum. Mov. Sci. 2012, 31, 1224–1237. [Google Scholar] [CrossRef] [PubMed]
- Chen, W.; Zhuang, J.; Yu, W.; Wang, Z. Messuring complexity using FuzzyEn, ApEn and SampEn. Med. Eng. Phys. 2009, 31, 61–68. [Google Scholar] [CrossRef] [PubMed]
- Lake, D.E.; Richman, J.S.; Griffin, M.P.; Moorman, J.R. Sample entropy analysis of neonatal heart rate variability. Am. J. Physiol. Regul. Integr. Comp. Physiol. 2002, 283, R789–R797. [Google Scholar] [CrossRef] [PubMed]
- Chen, Z.; Ivanov, P.C.; Hu, K.; Stanley, H.E. Effect of nonstationarities on detrended fluctuation analysis. Phys. Rev. E 2002, 65, 041107. [Google Scholar] [CrossRef] [PubMed]
- Peng, C.K.; Buldyrev, S.V.; Havlin, S.; Simons, M.; Stanley, H.E.; Goldberger, A.L. Mosaic organization of DNA nucleotides. Phys. Rev. Stud. 1994, 49, 1685–1689. [Google Scholar] [CrossRef]
- Bashan, A.; Bartsch, R.; Kantelhardt, J.W.; Havlin, S. Comparation of detrending methods for fluctuation analysis. Phys. A Stat. Mech. Appl. 2008, 387, 5080–5090. [Google Scholar] [CrossRef]
- Roerdink, M.; De Haart, M.; Daffertshofer, A.; Donker, S.F.; Geurts, A.C.H.; Beek, P.J. Dynamical structure of center-of-pressure trajectories in patients recovering from stroke. Exp. Brain Res. 2006, 174, 256–269. [Google Scholar] [CrossRef] [PubMed] [Green Version]
- Heneghan, C.; McDarby, G. Establishing the relation between detrended fluctuation analysis and power spectral density analysis for stochastic processes. Phys. Rev. E 2000, 62, 6103. [Google Scholar] [CrossRef]
- Kantelhardt, J.W.; Koscielny-Bunde, E.; Rego, H.H.; Havlin, S.; Bunde, A. Detecting long-range correlations with detrended fluctuation analysis. Phys. A Stat. Mech. Appl. 2001, 295, 441–454. [Google Scholar] [CrossRef] [Green Version]
- Vjushin, D.; Govindan, R.B.; Monetti, R.A.; Havlin, S.; Bunde, A. Scaling analysis of trends using DFA. Phys. A Stat. Mech. Appl. 2001, 302, 234–243. [Google Scholar] [CrossRef]
- Caballero, C.; Barbado, D.; Moreno, F.J. What COP and Kinematic Parameters better Characterize Postural Control in Standing Balance Tasks? J. Mot. Behav. 2015, 47, 550–562. [Google Scholar] [CrossRef] [PubMed]
- Goldberger, A.L.; Peng, C.K.; Lipsitz, L.A. What is physiologic complexity and how does it change with aging and disease? Neurobiol. Aging 2002, 23, 23–26. [Google Scholar] [CrossRef]
- Manzanares, A.; Menayo, R.; Segado, F. Visual Search Strategy during Regatta Starts in a Sailing Simulation. Mot. Control 2017, 21, 413–424. [Google Scholar] [CrossRef] [PubMed]
- Barbado, D.; Caballero, C.; Moreside, J.M.; Vera-García, F.J.; Moreno, F.J. Can be the structure of motor variability predict learning rate? J. Exp. Psychol. Hum. Percept. Perform. 2017, 43, 596–607. [Google Scholar] [CrossRef] [PubMed]
- Zhu, Z.; Ji, Q.; Bennett, K.P. Nonlinear eye gaze mapping function estimation via support vector regression. In Proceedings of the 18th International Conference on Pattern Recognition ICPR, Hong Kong, China, 20–24 August 2006; Volume 1, pp. 1132–1135. [Google Scholar]
Figure 1.
Experimental setup and vSail-Trainer®.

Figure 2.
Low and high values of detrended fluctuation analysis (DFA) (A) and fuzzy entropy (FuzzyEn) (B) selected from the sample.
Figure 2.
Low and high values of detrended fluctuation analysis (DFA) (A) and fuzzy entropy (FuzzyEn) (B) selected from the sample.

Figure 3.
Eye movements of one sailor during the race, and scene with stimuli (randomly selected from the sample).
Figure 3.
Eye movements of one sailor during the race, and scene with stimuli (randomly selected from the sample).
Figure 4.
FuzzyEn values for eye positions and velocity at the first and second regatta start. * Significant differences in FuzzyEn values between regularity of eye position and velocity.
Figure 4.
FuzzyEn values for eye positions and velocity at the first and second regatta start. * Significant differences in FuzzyEn values between regularity of eye position and velocity.

Figure 5.
Correlations found between the regularity—FuzzyEn—of the eye movements and the age of sailors.
Figure 5.
Correlations found between the regularity—FuzzyEn—of the eye movements and the age of sailors.

Figure 6.
DFA alpha values in eye positions and velocity at the first and second regatta start. * Significant differences (p ≤ 0.05) in DFA alpha values between the complexity of eye position and velocity.
Figure 6.
DFA alpha values in eye positions and velocity at the first and second regatta start. * Significant differences (p ≤ 0.05) in DFA alpha values between the complexity of eye position and velocity.

Figure 7.
Correlation found between the regularity—alpha DFA values—of the eye movements and the age of sailors.
Figure 7.
Correlation found between the regularity—alpha DFA values—of the eye movements and the age of sailors.


Table 1.
Effects of the sailors’ ranking position and experience, as well as the spatial axis of eye movement, on the regularity of eye movements (FuzzyEn).
Table 1.
Effects of the sailors’ ranking position and experience, as well as the spatial axis of eye movement, on the regularity of eye movements (FuzzyEn).
| Ranking | Years’ Experience | ||||||||
|---|---|---|---|---|---|---|---|---|---|
| Race | Axis | FuzzyEn | F(1,29) | p | η2p | F(1,29) | p | η2p | |
| Eye position | 1st | X | 0.32 ± 0.08 | 0.523 | 0.599 | 0.037 | 0.524 | 0.784 | 0.120 |
| 1st | Y | 0.31 ± 0.07 | 0.541 | 0.588 | 0.039 | 0.442 | 0.843 | 0.103 | |
| 2nd | X | 0.33 ± 0.07 | 0.838 | 0.443 | 0.058 | 1.874 | 0.129 | 0.328 | |
| 2nd | Y | 0.34 ± 0.11 | 0.204 | 0.817 | 0.015 | 0.272 | 0.945 | 0.066 | |
| Eye velocity | 1st | X | 0.69 ± 0.12 | 0.896 | 0.420 | 0.062 | 1.133 | 0.375 | 0.228 |
| 1st | Y | 0.69 ± 0.13 | 0.937 | 0.404 | 0.065 | 0.427 | 0.853 | 0.100 | |
| 2nd | X | 0.69 ± 0.13 | 1.110 | 0.344 | 0.076 | 0.702 | 0.651 | 0.155 | |
| 2nd | Y | 0.69 ± 0.15 | 0.229 | 0.797 | 0.017 | 0.368 | 0.892 | 0.088 | |
F(1,29) = F-value (degrees of freedom); p-value ≤ 0.05; η2p = partial eta squared -effect size-.
Table 2.
Effects of the sailors’ ranking position, experience and of the spatial axis of eye movement on the complexity of eye movements (DFA).
Table 2.
Effects of the sailors’ ranking position, experience and of the spatial axis of eye movement on the complexity of eye movements (DFA).
| Ranking | Experience | ||||||||
|---|---|---|---|---|---|---|---|---|---|
| Race | Axis | DFA | F(1,29) | p | η2p | F(1,29) | p | η2p | |
| Eye position | 1st | X | 0.96 ± 0.09 | 1.722 | 0.198 | 0.113 | 1.166 | 0.342 | 0.119 |
| 1st | Y | 0.96 ± 0.09 | 2.494 | 0.101 | 0.156 | 2.335 | 0.097 | 0.212 | |
| 2nd | X | 0.93 ± 0.12 | 0.859 | 0.435 | 0.060 | 0.269 | 0.847 | 0.030 | |
| 2nd | Y | 0.93 ± 0.13 | 1.015 | 0.376 | 0.070 | 1.294 | 0.297 | 0.130 | |
| Eye velocity | 1st | X | 0.25 ± 0.03 | 1.794 | 0.186 | 0.117 | 1.140 | 0.352 | 0.116 |
| 1st | Y | 0.24 ± 0.04 | 2.971 | 0.068 | 0.180 | 2.308 | 0.100 | 0.210 | |
| 2nd | X | 0.20 ± 0.04 | 1.339 | 0.279 | 0.090 | 0.947 | 0.432 | 0.098 | |
| 2nd | Y | 0.20 ± 0.04 | 0.094 | 0.911 | 0.007 | 0.834 | 0.487 | 0.088 | |
F(1,29) = F-value (degrees of freedom); p-value ≤ 0.05; η2p = partial eta squared -effect size-.
© 2018 by the authors. Licensee MDPI, Basel, Switzerland. This article is an open access article distributed under the terms and conditions of the Creative Commons Attribution (CC BY) license (http://creativecommons.org/licenses/by/4.0/).
Share and Cite
MDPI and ACS Style
Menayo, R.; Manzanares, A.; Segado, F. Complexity, Regularity and Non-Linear Behavior in Human Eye Movements: Analyzing the Dynamics of Gaze in Virtual Sailing Programs. Symmetry 2018, 10, 528. https://doi.org/10.3390/sym10100528
AMA Style
Menayo R, Manzanares A, Segado F. Complexity, Regularity and Non-Linear Behavior in Human Eye Movements: Analyzing the Dynamics of Gaze in Virtual Sailing Programs. Symmetry. 2018; 10(10):528. https://doi.org/10.3390/sym10100528
Chicago/Turabian StyleMenayo, Ruperto, Aarón Manzanares, and Francisco Segado. 2018. "Complexity, Regularity and Non-Linear Behavior in Human Eye Movements: Analyzing the Dynamics of Gaze in Virtual Sailing Programs" Symmetry 10, no. 10: 528. https://doi.org/10.3390/sym10100528
Note that from the first issue of 2016, this journal uses article numbers instead of page numbers. See further details here.