Article

Soil Carbon, Nitrogen and Phosphorus Contents along a Gradient of Agricultural Intensity in the Kilombero Valley, Tanzania

1
Department of Physical Geography, Stockholm University, 106 91 Stockholm, Sweden
2
Bolin Centre for Climate Research, Stockholm University, 106 91 Stockholm, Sweden
3
Institute of Resource Assessment, University of Dar es Salaam, Dar es Salaam 35097, Tanzania
4
School of Environment and Natural Resources, Ohio State University, Columbus, OH 43210, USA
5
Department of Statistical Sciences, University of Padova, 35121 Padua, Italy
*
Author to whom correspondence should be addressed.
Land 2020, 9(4), 121; https://doi.org/10.3390/land9040121
Submission received: 12 March 2020 / Revised: 15 April 2020 / Accepted: 16 April 2020 / Published: 18 April 2020
(This article belongs to the Special Issue Soil Management for Sustainability)

Abstract

:
The preservation of soils which provide many important services to society is a pressing global issue. This is particularly the case in countries like Tanzania, which will experience rapid population growth over coming decades. The country is also currently experiencing rapid land-use change and increasing intensification of its agricultural systems to ensure sufficient food production. However, little is known regarding what the long term effects of this land use change will be, especially concerning soil quality. Therefore, we assessed the effect of irrigation and fertilization in agricultural systems, going from low intensity smallholder to high intensity commercial production, on soil organic carbon (SOC), total nitrogen (TN), and total phosphorous (TP) concentrations and stocks. Soil sampling was conducted within Kilombero Plantations Ltd. (KPL), a high intensity commercial farm located in Kilombero, Tanzania, and also on surrounding smallholder farms, capturing a gradient of agricultural intensity. We found that irrigation had a positive effect on SOC concentrations and stocks while fertilization had a negative effect. Rain-fed non-fertilized production had no effect on soil properties when compared to native vegetation. No difference was found in concentrations of TN or TP across the intensity gradient. However, TN stocks were significantly larger in the surface soils (0–30 cm) of the most intensive production system when compared to native vegetation and smallholder production.

1. Introduction

The preservation of soils is central to many of the challenges facing society. These challenges include ensuring food and energy security, climate change mitigation, biodiversity protection and the continued provision of numerous ecosystem services [1]. The most important role that soils play for society is in the provision of food. Large quantities of the earth’s topsoil have been directly altered for anthropogenic land-use, with one third of all land cover (excluding Greenland and Antarctica) being dedicated to agriculture [2]. Therefore, sustaining global food production represents both a challenge for soils and an opportunity to ensure soil preservation through proper soil management.
With the global population expected to reach 9 billion by 2050, an increasing demand for food will place a significant pressure on land and soil. However, the expansion of global population will not be homogeneous. Due to regional differences in birth rates and mortality, population related pressures will be greater in some places than others. Sub-Saharan Africa will be the greatest contributor to the expansion of the world’s population over coming decades, with the region becoming the world’s most populous by 2100 [3]. Therefore, the importance of ensuring enough food is locally produced is one of the greatest challenges for nations within this region, placing pressure on the region’s soils.
Tanzania is one such country, given that its population is expected to increase from 56 million in 2018 to 129 million by 2050 [3]. Food security is thus a critical challenge for the nation. This is further complicated by climate change, which will likely have negative effects on crop yields as a result of increased incidence of pest [4], changes in the availability of water resources [5], and heat stress [6]. While agriculture experiences the negative effects of climate change, it plays an important role as a contributor to greenhouse gas (GHG) emissions [7]. Agriculture is also increasingly being discussed as a potential mitigator of GHG emissions [8] through initiatives such as “4 per 1000” [9]. Due to the rapidly expanding population and increase in agricultural area, increases in GHG emissions from Tanzanian agriculture are among the fastest growing in the world [10].
Despite these challenges, Tanzania has great potential to succeed in meeting future production demands locally. Providing 78% of employment and contributing to 29% of the nation’s gross domestic product [11], the country’s agriculture sector is dominated by low intensity smallholder farming. Further, only 15% of nation’s potential arable land is currently utilized for crop production, and the majority of this cropland is rain-fed. Therefore, the country has opportunities to both expand its production area and increase its production intensity. To meet future production needs, the country has embarked upon a modernization process to commercialize its smallholder dominated agricultural sector, via the Kilimo Kwanza (Agriculture First) initiative, and programs such as Southern Agricultural Growth Corridor of Tanzania [12]. But to ensure food security and improve livelihoods, this development of the sector needs to be achieved in a sustainable way.
The intensification of agriculture, through mechanization, crop selection, and the use of inorganic inputs has increased production [13], but often at the expense of other ecosystem services. Within Sub-Saharan Africa, where increased production has often been made possible through the conversion of forest to agricultural land, agricultural intensification has increased threats to biodiversity [14] and resulted in habitat loss and fragmentation [15]. This loss of biodiversity, coupled with the use of pesticides, may have indirect negative consequences for crop production through detrimentally effecting pollinators [16] and the loss of predators that feed on agricultural pests [17]. It may also lead to lower inherent soil fertility [18], potentially resulting in negative effects on yields. However, the significance of these effects is dependent on the original status of the soil and the land management practices (LMPs) that are implemented.
A loss of soil organic carbon (SOC) is often noted as a consequence of agricultural production. Winowiecki et al. [19] found that cultivation has a negative effect on soil organic carbon concentrations when compared to non-cultivated land in Tanzania. Similar effects have been seen globally, with the conversion of native forests to agriculture resulting, on average, in a 24% reduction in SOC stocks [20]. Yet, certain systems may also result in increased SOC. For example, the production of paddy rice has been responsible for SOC accumulation [21,22], although at the expense of relatively higher methane emissions, due to flooded fields limiting the degradation of organic matter [23]. However, the global trend in SOC, as a result of agriculture, has been a net loss [24]. Changes in SOC are also associated with changes in macronutrients, such as nitrogen (N) and phosphorus (P), which are chemically bound to carbon (C) in organic compounds [25]. Thus, SOC reductions caused by agricultural activities may result in loss of the soil nutrient capital. As well as being related to soil nutrient status, SOC also affects soil compaction, with bulk density (BD) commonly being inversely related to SOC content [26]. This makes changes in SOC a common indicator of soil fertility.
Considering that increased soil organic matter (including C, N, and P) may have yield benefits [27], it is important to both quantify and mitigate any loss that may occur as a result of agricultural intensification globally, particularly in countries like Tanzania that need to dramatically increase agricultural output to meet the needs of their rapidly expanding population. However, little focus has been put on assessing the effect on soils of land-use change for agriculture in Eastern Africa. In a recent review [28], Namirembe et al. identified only 15 studies which assessed changes in SOC as a result of bushland, woodland or forest conversion to agriculture in Ethiopia, Kenya, Rwanda, Tanzania, Uganda, or Burundi. The average sampling depth of the identified studies was 32 cm. Further, less focus has been put on comparing the effect of land-use conversion across a gradient of production intensities. Therefore, in this under-represented area, there is a need to assess changes in soil properties (and thus fertility) both along gradients of agricultural intensity, and at a depth in the soil profile where such changes have largely been neglected so far.
The long-term effects of land-use change and agricultural intensification should be urgently assessed in areas of Tanzania that are anticipated to experience a significant increase in both. In this study, we aim to identify the effects of agricultural management along a gradient of agricultural intensification within the Kilombero Valley, Tanzania. While the valley is dominated by smallholder production, it is also the location of Kilombero Plantations Ltd. (KPL), an industrial producer of rice and maize. Therefore, we consider the effect of agriculture management across a range of intensities, from unfertilized and rain-fed smallholder (low intensity) to fertilized and irrigated industrial (high intensity). We also compare agriculture to soil conditions under native vegetation. Specifically, we ask how does agricultural intensity affect concentrations and stocks of soil organic carbon, soil nitrogen and soil phosphorous?

2. Materials and Methods

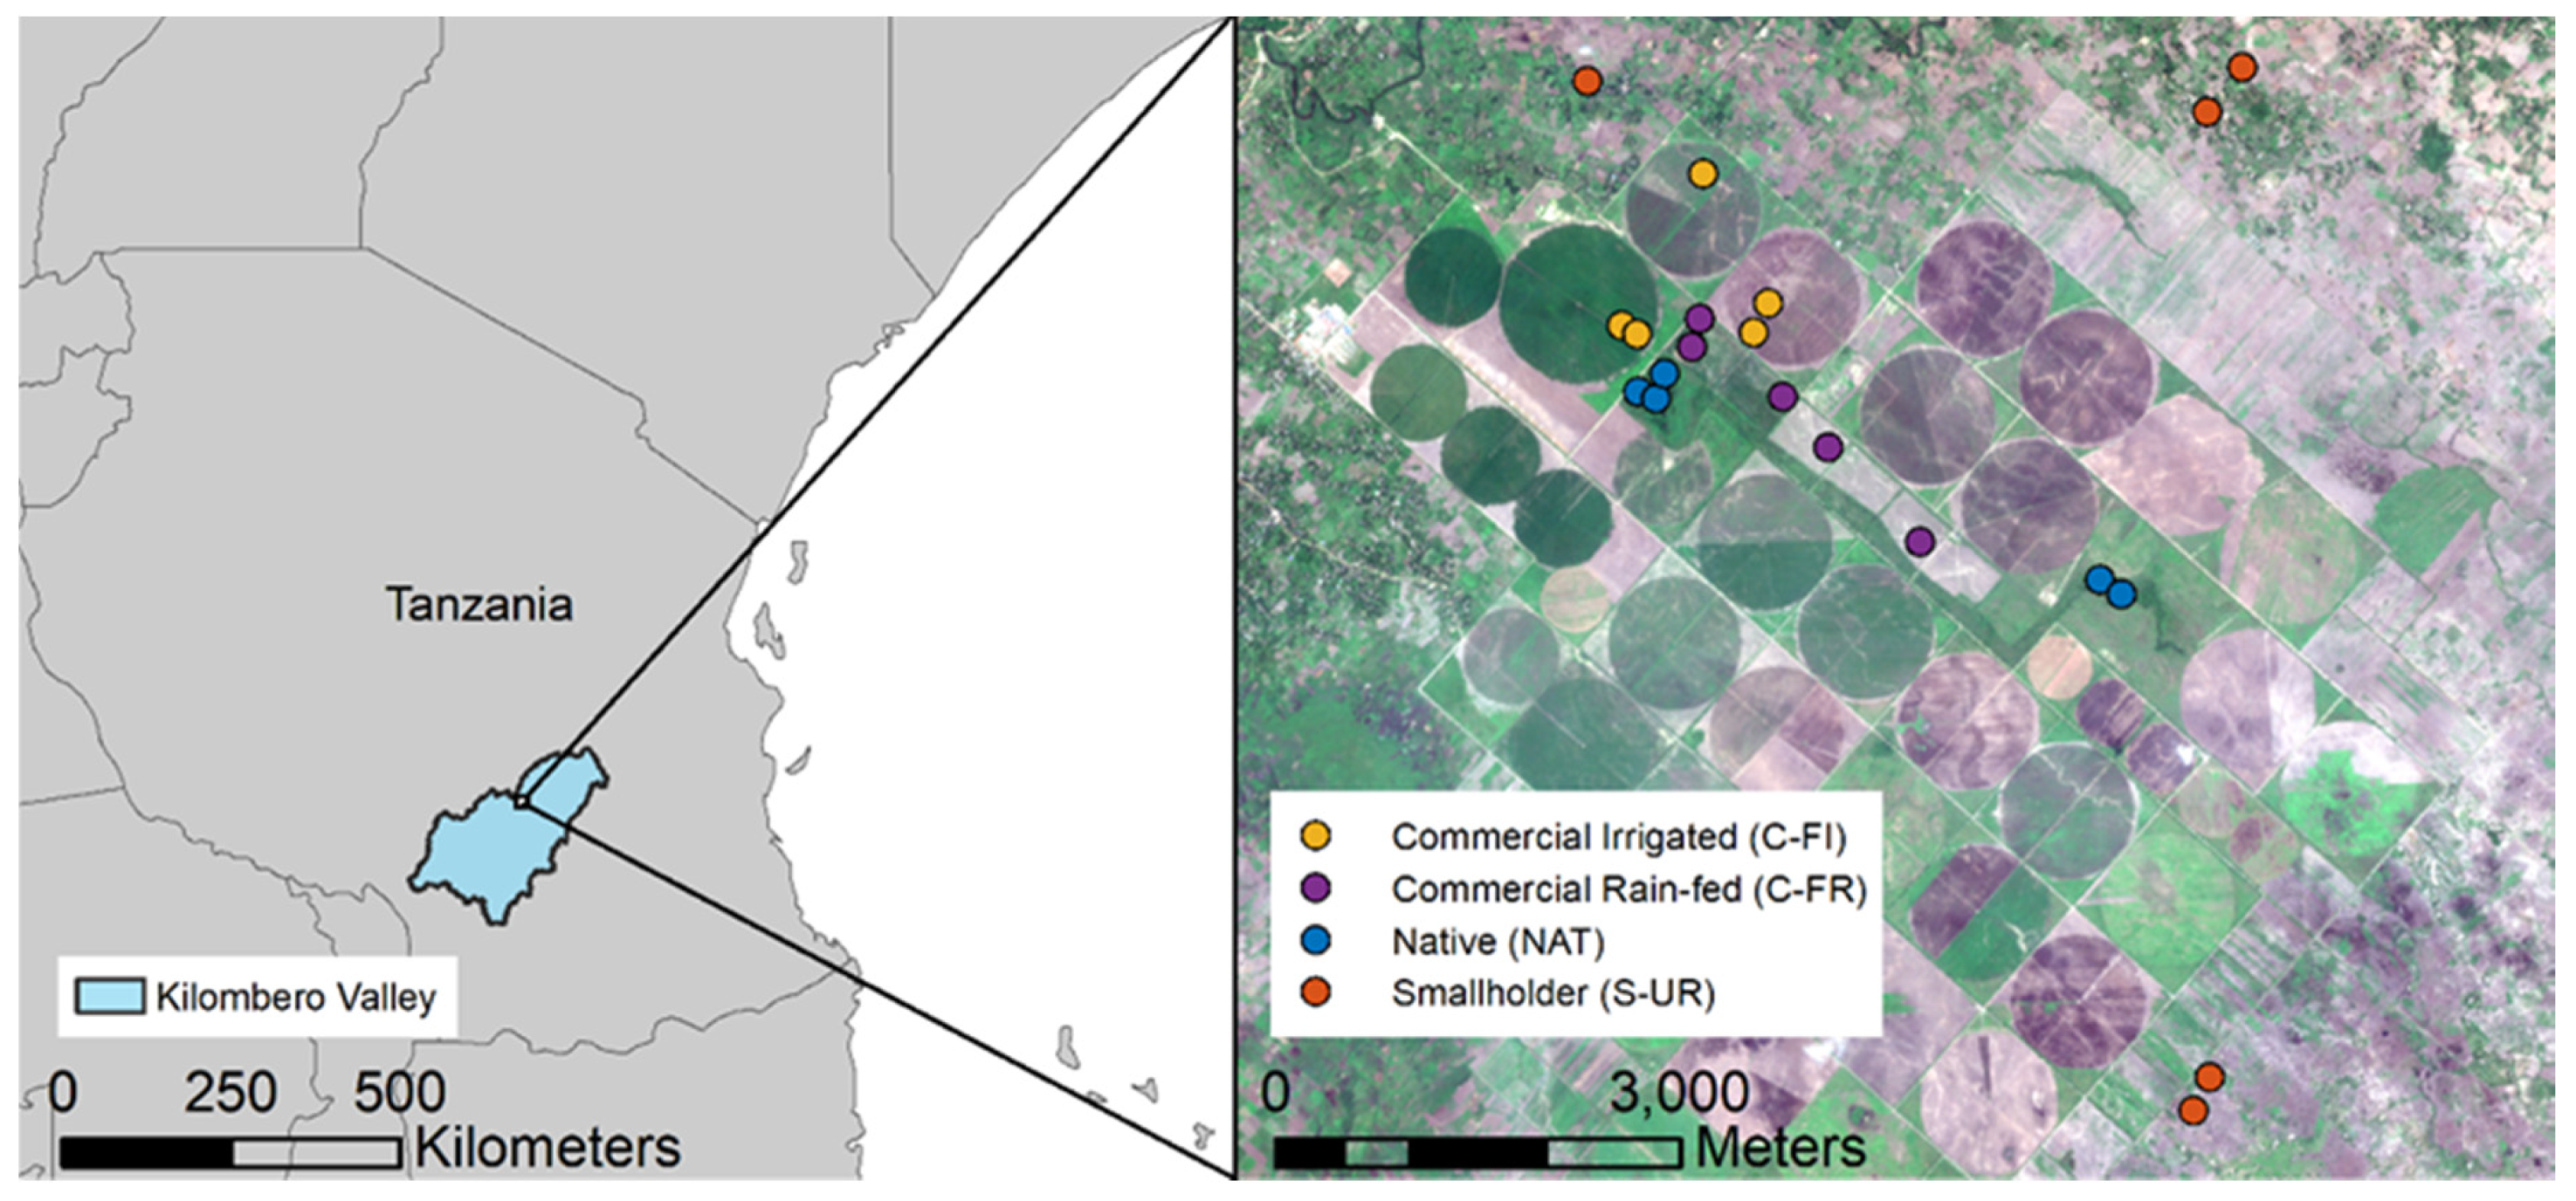
2.1. Site Description

The Kilombero Valley is located in the Morogoro Region of southern central Tanzania. The valley covers approximately 39,000 km2, with a complex network of streams moving down from the surrounding mountains and joining to form Kilombero River. The northern and western sides of the valley are bordered by the Udzungwa mountains, and the eastern side by the Mahenge highlands [29,30]. Annual precipitation ranges between 1200 and 1400 mm, falling mainly in the November to April wet season. Mean daily temperature is 22–23 ℃, with a relative humidity between 70% and 87% in forest and highland areas, and 58% and 85% in the lowlands. Soils surrounding the study location, within the catchment’s lowlands, are characterized as fluvisols [31].
The valley is home to both smallholder and commercial farms, with rice, maize and sugar cane being major produced crops. There are nine small-to-medium scale irrigation schemes with well-established irrigation infrastructure and two prominent commercial irrigation schemes in Msolwa (sugar plantation) and Mngeta (rice and maize plantation).
Sampling for this research was conducted on and around Mngeta farm, operated by KPL. The farm is an industrial rice and maize producer situated approximately 62 km west south west of Ifakara. Purchased in 2006, the farm sits on the site of a former Tanzania–North Korean agricultural operation which cleared the land for production during the 1980’s but was then later abandoned. Covering over 5000 ha, the farm grows both center-pivot irrigated and rain-fed rice during the wet season and maize during the dry season. The farm fertilizes the rain-fed and irrigated areas using a combination of DAP, MOP, Urea and Nitrabor as basal and top dressings, with total application rates of approximately 90–125 kg N ha−1 and 15–25 kg P ha−1 per crop. Rice yields on the commercial farm are typically between 3 and 4 t ha−1, but with a large degree of variability between years and fields.
The land surrounding KPL is resident to smallholder farmers who also produce rice and maize. Whilst the number of large scale production activities within Kilombero is increasing [32], agriculture within the valley is dominated by smallholder and subsistence farming [33]. Yields on the surrounding smallholder farms can be as low as 1 t ha−1 in unfertilized rain-fed areas, up to 6 t ha−1 in fields where System of Rice Intensification practices have been implemented. In both the KPL farm and surrounding smallholder farms, land is ploughed prior to crop planting. Ploughing is conducted using tractor drawn plough or, on smallholder land, using a power tiller. Although variable, plough depth is between 15 and 30 cm.
As a result of migration to the valley, its agricultural area has increased by 3430 km2 (11.3%) between 1990 and 2016 [33] mainly through the conversion of bushland and forest. The increasing production area and intensity has led to increased crop production, but has resulted in changes in river chemistry and biota [29], and also species loss and habitat fragmentation [34].

2.2. Sampling Methods

Field sampling was conducted between June and July 2018, after the harvesting of the wet season rice crop and before the planting of maize, on and around the KPL farm. Four land management practices (LMPs), detailed in Figure 1 and Table 1, were selected for comparison of soil properties. We consider these LMPs to represent a gradient of production intensity, with mechanization and increasing use of chemical inputs being markers of production intensity. We considered fields in the commercial farm KPL (denoted by ‘C-’ in the LMP codes) and in the surrounding small holder farms (denoted by ‘S-’). Moreover, we identified fields that were either fertilized or left unfertilized (‘F’ vs. ‘U’), and either irrigated or rain-fed (‘I’ vs. ‘R’). Soil samples were obtained at five sites within each LMP (Figure 1). All sites had been consistently managed in the same way for at least 10 years, excluding the C-FI sites where irrigation was introduced in the 2014–2015 growing season. Sites within C-FR were randomly selected from within the area, covering 120 ha, reported by the KPL farm management as being solely used for rain-fed rice production. Similarly, C-FI sites were randomly selected from within the pivot irrigated areas installed in 2014, which cover an area of 250 ha, within the KPL farm. The selection of smallholder fields that were neither irrigated or fertilized (S-UR) was limited to five small fields (between 0.5 and 1.5 ha) that were found to be appropriate after interviewing a local extension officer and farmers in the area. Therefore, for this LMP, a random site selection was not possible. However, the sampled sites were scattered over a wide area and are thus regarded as representative of this land management (Figure 1). Further, access to sites with native land cover (NAT) within the KPL farm was restricted by the density of the vegetation within these areas. This meant that NAT sites were selected by walking through the forest, on a path dictated by accessibility, and then digging at the location reached after thirty minutes, this time equated to a distance that was deemed sufficient to ensure that the sampled sites were representative of relatively undisturbed forest. The forest area within the farm had been set aside as a wildlife refuge, and no signs of anthropogenic disturbance were observed.
The sampling protocol was adapted from Alavaisha et al. (2019) [32] to allow integration of the current new dataset with previous soil analyses in the Kilombero Valley. For analysis of soil texture, pH, SOC, total nitrogen (TN), and total phosphorous (TP), soil samples were taken at five points for each site. One point was located at the center of the site and four at equidistant locations around a 10 m radius circle around the center point. Soils from each point were collected at six depths (0–20, 20–30, 30–40, 40–50, 50–60, and 60–80 cm) using a soil auger (Unoson Environment AB). The samples from each of the five points were then homogenized, with visible roots removed, and stored in sealed plastic bags. A single BD sample was taken, for each depth, at the center point of each site, with the bulk density ring driven horizontally into the soil profile at each depth’s mid-point.

2.3. Soil Analysis

Laboratory analyses were conducted at the Department of Soil and Geological Science, Sokoine University of Agriculture, Morogoro. Samples were air dried and passed through a 2 mm sieve, with large particles not passing through being crushed and then passed through the sieve again [35]. Texture was measured using the hydrometer bouyoucos method, pH with a Oakton Ion 700 bench meter using a 1:2.5 soil-distilled water solution, and TN with a Foss Tecato Kjeltec™ 2100 Auto Distillation Digestion system using the Kjeldahl method, as described by Klute (1986). SOC was measured via the Walkley–Black method [36], and TP using the dry combustion method [37] measured with a Biomate 6 UV Spectrophotometer.

2.4. Statistical Procedure

The effects of land management practices, on concentrations of SOC, TN and TP, and on C:N and C:P ratios, were analyzed with a mixed-effect model [38] accounting for the dependence of the measurements taken in the same field. For each soil element, we determined the value of the logarithm of the concentration (yij) in crop j = 1,...,20 at the i-th depth with i = 1,...,6 and then fit a model such that:
y i j = α 0 + X β + Z θ + γ j + δ j d i j + ϵ i j ,
where α represents an intercept term, X is a matrix of dummy variables labelling the crop type as reported in Table S1 with β the related vector of regression coefficients measuring the additive effect (on a log scale) of the land-use. The matrix Z contains additional confounders (the percentage of silt and depth) with θ the related regression coefficients. Finally, γj and δj are crop-specific random effect parameters representing crop-specific intercept and regression coefficient associated to the depth dij of measurement i in crop j. The model specification is completed assuming εij represents a random Gaussian noise. The mixed effect model was fitted in R utilizing the nlme package and using the restricted maximum likelihood approach.
Stocks of SOC, TN and TP (Mg ha−1) were calculated for each soil sampling depth from the percent concentrations at that depth (x):
S t o c k m n = C m n × B D m n × D m n
where m is the element (SOC, TN, TP), n the sampling depth, C and BD are the element concentration (expressed as percentages on a dry weight basis) and soil bulk density (g cm−3) derived from the laboratory analysis, respectively, and D the thickness of the sampling depth (cm). Stocks through the profile were summed to calculate the stock of each element in the total soil profile, as well as for the root zone (0–30 cm) and the subsoil (30–80 cm).
One-way analysis of variance (ANOVA) with Tukey’s honestly significant difference (HSD) post hoc test was used to assess for significant difference (p < 0.05) in element stocks in root zone, subsoil and full profile, and also in concentrations of SOC, TN, TP and C:N and C:P ratios at each sampling depth.

3. Results

We first present the observed concentrations of SOC and soil nutrients along vertical soil profiles, comparing trends seen between land-use types; second, nutrient stocks are presented, and finally soil C:N and C:P ratios. Variability in soil texture can also be found in the Supplementary Figure S1. The complete original data file (Data S1) can also be found in the Supplementary Materials.

3.1. Observed Soil Organic Carbon and Nutrient Concentrations

3.1.1. Vertical Profiles of Soil Organic Carbon and Nutrient Concentrations

Depth had a significantly negative effect on SOC, TN and TP (p < 0.01) (Table 2). Percent SOC and TN consistently decreased with increasing depth below the land surface within all LMPs (Table 3). Reductions in TP concentrations were milder than for SOC and TP, and concentrations between 20 and 60 cm were more variable between sites within the two commercial LMPs, C-FR and C-FI, compared to the two non-commercial LMPs (Table 3). In all LMPs, bulk density consistently increased with depth (Table 3).
While SOC concentrations decreased with increasing depth below the soil surface, the decrease was more pronounced in the agricultural LMPs than the NAT sites. This can be seen in the larger absolute values of the slope coefficients for the three agricultural LMPs compared against that of the NAT sites in Figure 2a. TN concentration profiles were also less steep in NAT sites compared to two of the agricultural LMPs (Figure 2b). Compared to SOC and TN, the concentration profiles for TP were more variable between sites and LMPs, demonstrated by the larger standard errors in Figure 2c.

3.1.2. Differences in Soil Organic Carbon and Nutrient Concentrations between LMPs

We found some statistical differences between SOC concentrations in the four LMPs, seen in the estimates of β and their marginal significance t-tests, reported in Table 2. Land management within the irrigated C-FI sites had a mild but significantly positive effect on log % SOC (p = 0.048), while fertilization had a significantly negative effect only at the 10% level (p = 0.085). Also, no difference was detected between SOC concentrations between the native vegetation and the smallholder producers. Analysis of SOC concentrations within individual soil layers found that between 40 and 60 cm, concentrations of C-FR sites were significantly smaller (p < 0.05) than those of NAT sites (Table 3).
While fertilization had a significant effect on TP concentrations at the 10% level (p = 0.092), no significant difference was found in concentrations of TN and TP between any of the four LMPs. Silt content was also found to be significantly related to SOC and nutrient concentrations. Clay content (Figure S1) and pH, which ranged from 5.05 and 6.49 between all sites and depths (mean 5.72), had no significant effect and did not improve the model fit.

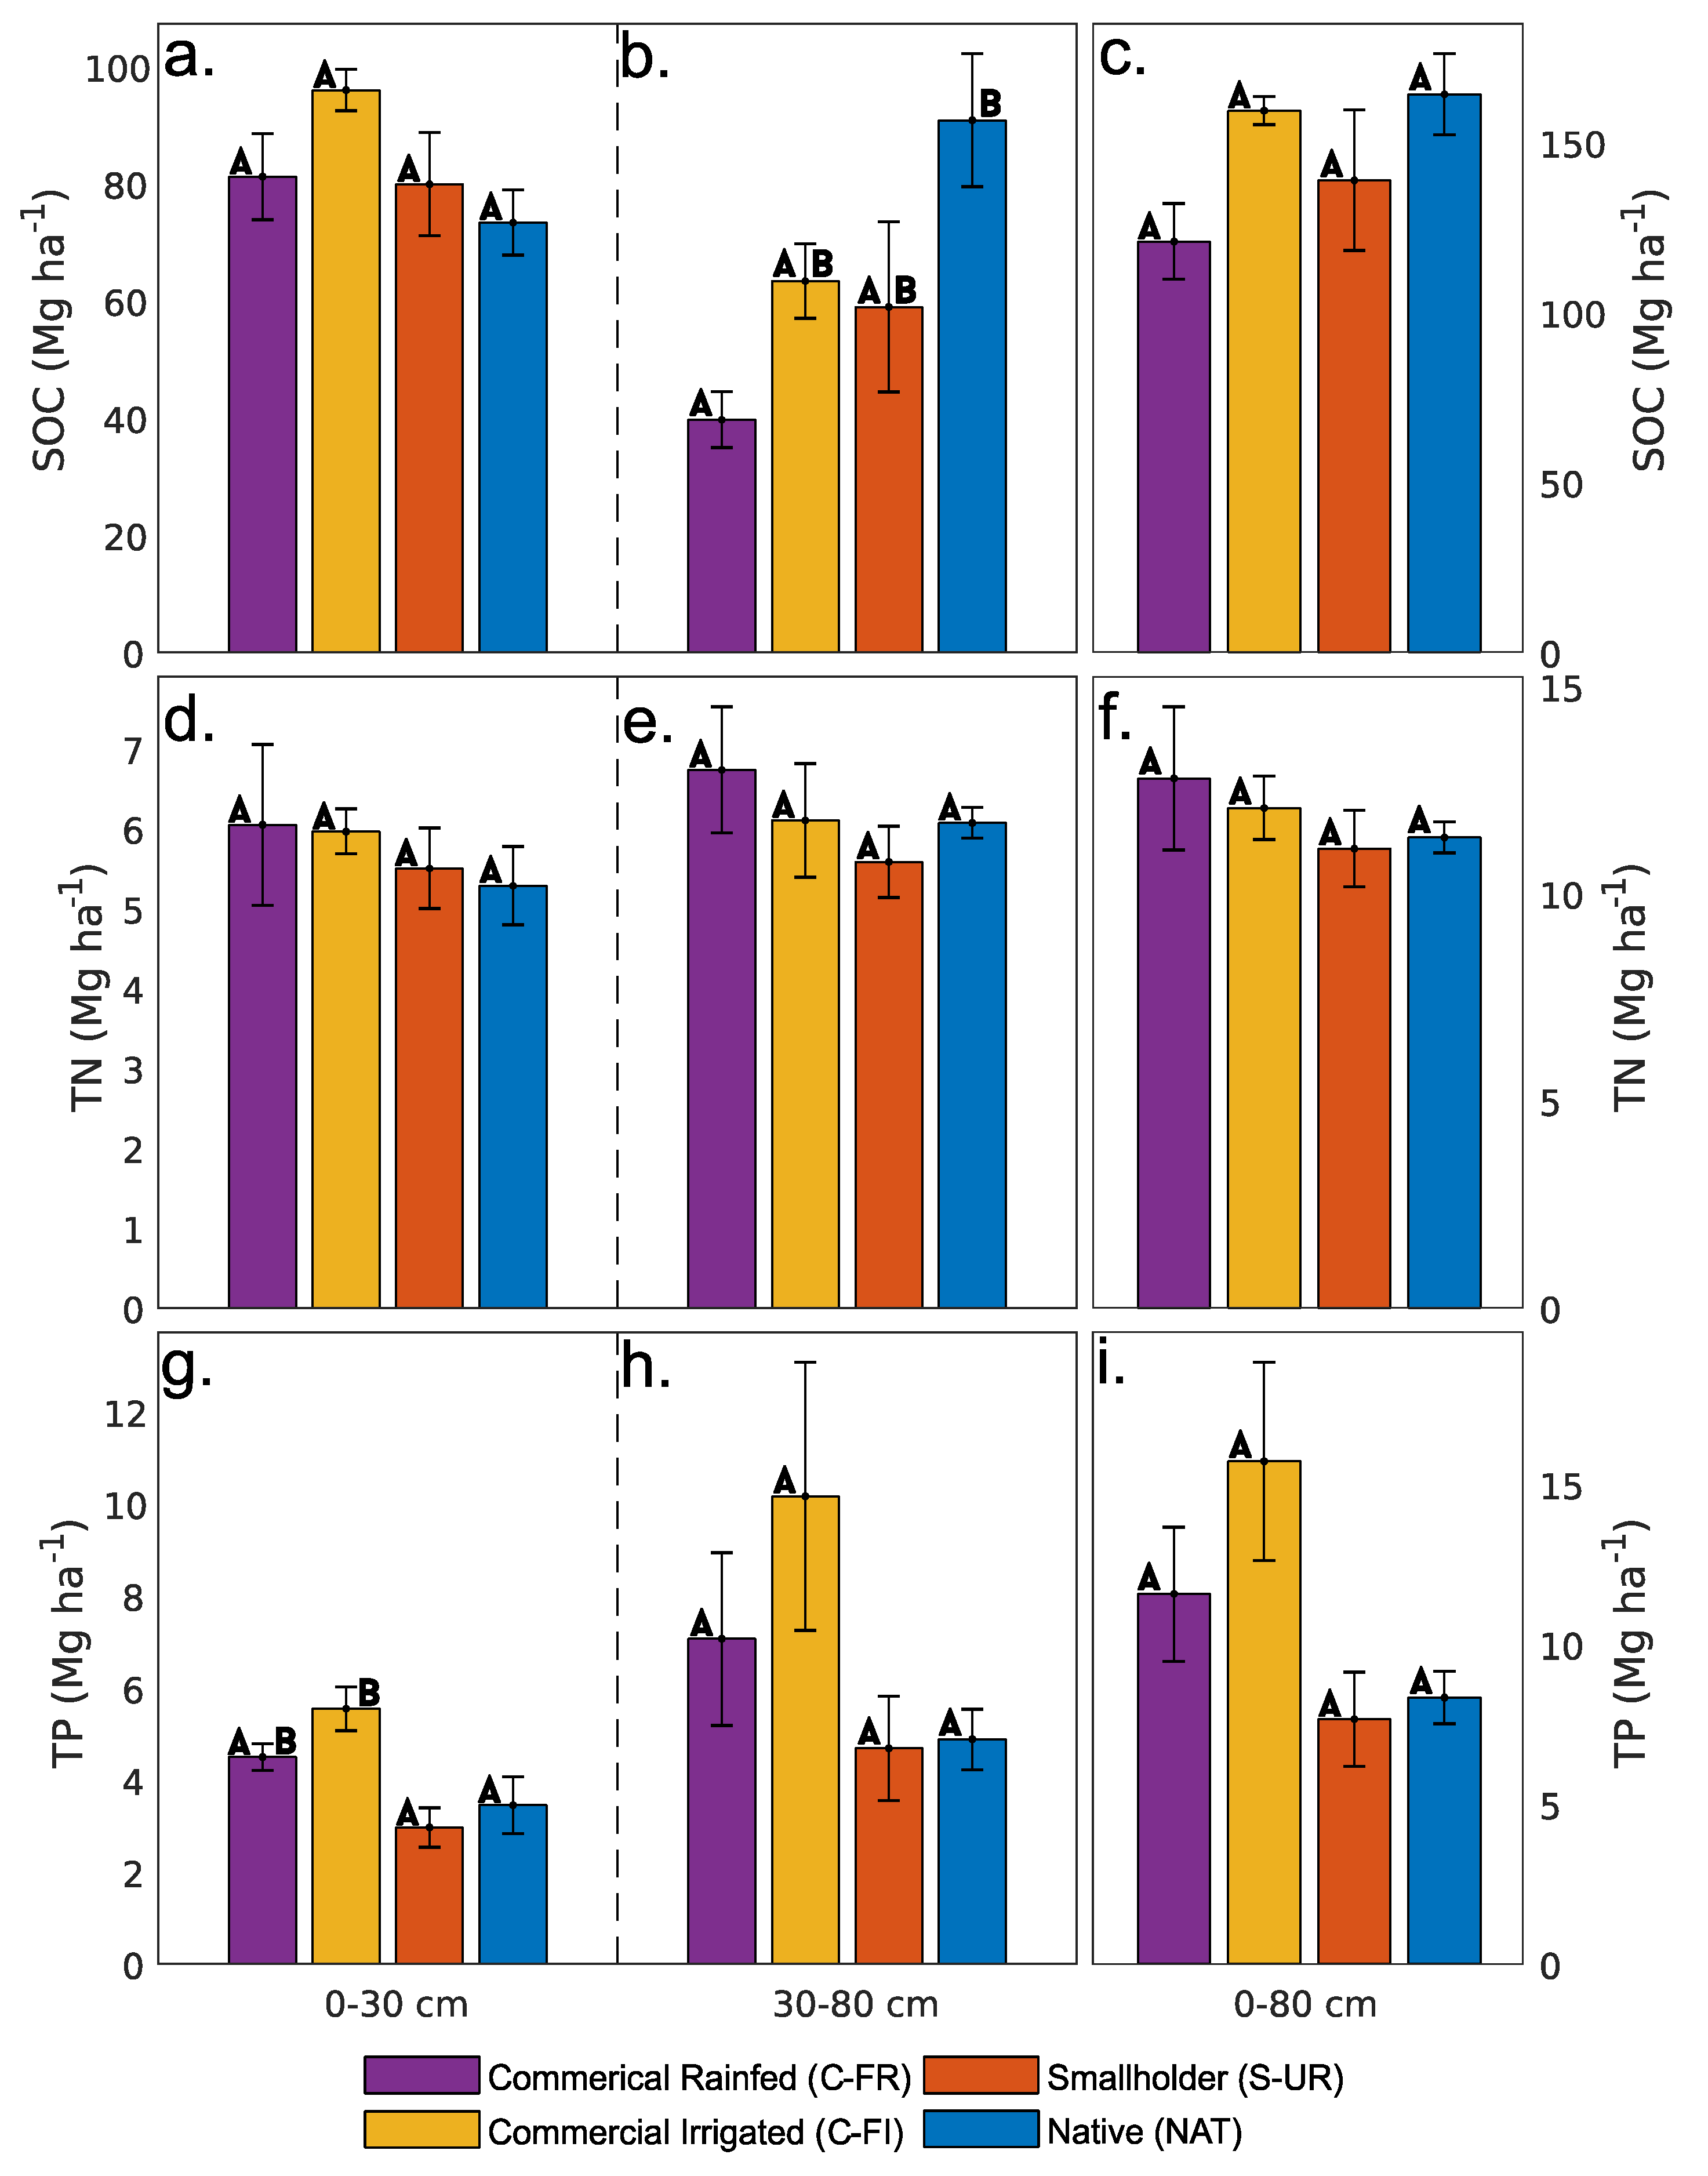
3.2. Carbon and Nutrient Stocks

Observed stocks of SOC across the entire sampled soil profile were highest within the NAT sites with a mean value of 177 Mg ha−1 (Figure 3c). Similarly, SOC stocks were also higher in the NAT sites between 30 and 80 cm than they were in the other LMPs (Figure 3b). However, only C-FR was significantly different (p < 0.05) from NAT between 30–80 cm (Figure 3b). Conversely, while not significantly different, NAT sites had the lowest mean SOC stocks in the surface soils (Figure 3a). Stocks of TN were similar between all LMPs, with the mean values being marginally, but not significantly, higher in the two fertilized LMPs (C-FR and C-FI) than in the non-fertilized ones (S-UR and NAT) at all depths (Figure 3d–f). For TP, mean observed stocks were greater in the two fertilized LMPs than in the non-fertilized LMPs when comparing stocks in the surface soils (Figure 3g), the subsurface (Figure 3h), and the total soil profile (Figure 3i). The difference in TP stocks was significant in C-FI compared to S-UR and NAT at 0–30 cm (Figure 3g).

3.3. C:N and C:P Ratios

There was a diverging trend in C:N and C:P ratios with increasing depth (Table 4), the difference in mean values was more constrained in the surface layer (0–20 cm) than in any other soil layer. The most pronounced difference in C:N ratios occurred between the C-FR and NAT, which were significantly different (p < 0.05) between 30–60 cm (Table 4). Below 30 cm, mean C:N markedly decreases in C-FR. For NAT, despite an increase at intermediate soil depths, the ratio was relatively consistent between soil layers. Depth had a mild but significantly negative effect on both the C:N (p = 0.009) and C:P ratio (p = 0.001) (Table 2). With regard to management practices, irrigation had a significantly positive effect on the C:N ratio (p < 0.009), and fertilization had a significantly negative effect on the C:N (p = 0.026) and C:P ratios (p = 0.018) (Table 2).

4. Discussion

The conversion of native vegetation to agricultural land affects the physical, chemical, and biological properties of soil, with the extent of these effects being controlled by the agricultural practices implemented [39]. In turn, changes in soil properties may have positive or negative effects on crop yields. For example, SOC has been shown to be positively correlated with yields of wheat and maize [40]. However, little work has been done to investigate the effect of land-use change on soil properties and nutrient stocks within Africa [41]. Given that the Sub-Saharan Africa population will rapidly increase over coming decades, and this will likely lead to increasing conversion of native vegetation to make room for agriculture, the effects of land-use change on soil properties and their related ecosystem services should not be ignored. As such, this study provides valuable insights into changes in soil properties in a data limited area which is currently undergoing significant land-use conversion and agricultural intensification.
SOC concentrations seen across all sampling locations within this study agree with both in situ measurements [32] and SOC values interpolated from a broad-scale survey [42] elsewhere in the Kilombero Valley. Also, the concentrations of SOC and TN consistently decrease with soil depth—a well-known pattern occurring in most ecosystems and attributed to the higher inputs of C and nutrients at the soil surface compared to deeper soil layers [43,44]. As concentrations decrease with depth, organic matter becomes progressively enriched in N and P, leading to lower C:N and C:P ratios at depth, as also found in previous studies [45]. The increase in soil bulk density seen with depth (Table 3) is not surprising. The opposing trends of SOC and bulk density are a common signal in soil profiles due to the importance of SOC in regulating soil compressibility [46]. Changes among vertical profiles and carbon or nutrient stocks along our agricultural intensity gradient are more subtle, as discussed in the following sections.

4.1. Comparison of Soil Organic Carbon and Nutrient Concentrations between LMPs

We found that agricultural intensification has a significant positive effect on SOC concentrations at our study location. No difference was detected between NAT and S-UR, suggesting that low intensity smallholder production had little effect on SOC when compared to native vegetation. However, irrigation was found to have a mild but significantly positive effect on SOC concentrations, and fertilization had a significantly negative effect. The positive effect of irrigation on SOC concentrations is likely due to the use of pivot irrigation systems allowing for the production of two crops (rice and maize) on the C-FI sites. Irrigation in arid and semi-arid areas commonly increases SOC concentrations, but irrigation’s effect in humid or sub-humid areas is not consistently positive [47]. Here, the growth of two crops increases the production of below ground biomass compared to single crop systems which, when not balanced by higher C mineralization, will lead to increasing SOC concentrations. Elsewhere in the Kilombero Valley, maize production has been found to increase SOC concentrations when compared to rice production [32]. This result is consistent with our findings, because maize produces more biomass than rice, and thus more residues that provide organic matter to the soil.
The negative effect of fertilization on SOC concentrations is likely not a direct consequence of chemical fertilizer use. Fertilization generally increases SOC concentrations when compared to unfertilized agriculture [48], because fertilization promotes plant growth. However, in the present study, the use of fertilizer is noted as an indicator of production intensity, and only implemented on the commercial farm sites. Therefore, the negative effect of fertilization on SOC concentrations may actually be an indication of other land management practices, such as higher intensity tillage on the commercial farm sampling locations (C-FI and C-FR) compared to the smallholder locations (S-UR). Both no-till and intermediate intensity tillage may promote SOC retention compared to high intensity tillage [49]. Previous studies in the Kilombero Valley found that fertilization had no effect on SOC [32]. However, their study looked solely at smallholder production systems. Here, due to a lack of intermediate LMPs between S-UR (non-irrigated and unfertilized smallholder) and C-FR (commercial fertilized and non-irrigated), it is not possible to state whether this negative effect on SOC is actually due to fertilization, or due to some other factor which is also associated with production on the commercial farm.
No significant difference was seen in concentrations of TN or TP between any of the land-uses. While this lack of difference may partially be due to the small number of plots sampled for each land-use, due to the explorative nature of the study, it is also clear that there is little difference in the TN and TP concentration profiles (Figure 2b,c). The three agricultural LMPs appear to have elevated SOC concentrations in the surface soils and reduced concentrations in the deep soil layers when compared to the native vegetation, resulting in a more negative slope coefficient for the agricultural soils (Figure 2a). However, TN and TP do not follow a similar trend. Therefore, agriculture may have little effect on soil nitrogen and phosphorous between the LMPs sampled within this study.

4.2. Comparison of Soil Organic Carbon and Nutrient Stocks between LMPs

Soil organic matter is a principal regulator of bulk density [26]. Our results are consistent with this known relationship, with native vegetation having the lowest mean SOC concentrations and highest bulk density in the upper sampling depths, and the highest SOC and lowest bulk density in the deeper sampling depths, when compared to the agricultural LMPs (Table 3). Changes in SOC concentrations affect soil quality, but it is also important to consider changes in SOC stocks to understand the net C flux between soils and the atmosphere. While no significant difference in total SOC stocks was found between the four LMPs, the higher mean SOC stocks in the sub-surface soils of the NAT sites compared to the agricultural LMPs (Figure 3b) warrants further investigation to understand the effect of land conversion on SOC storage at depth.
SOC in subsoils is often assumed to be more stable than within topsoils [50]—this has resulted in the dynamics of subsoil SOC often being ignored [51]. However, knowledge of land conversion impacts on subsoil SOC is increasing. Loss of SOC has been seen up to 1 m as a result of forest conversion for crop production [52]. Loss of deep SOC is probably larger where native vegetation has deeper roots than crops, such as in seasonally-dry forests like the Miombo woodland of Kilombero Valley. Woodland species with deep roots might have contributed C to deep layers that are not reached by crop roots after conversion—without fresh inputs, this deep SOC can be lost. The conversion of tropical forest to cropland has, on average, been reported to reduce SOC stocks by 25% [41], with soil sampling conducted to a mean depth of 36 cm (mostly overlapping with the plough layer). Such shallow sampling depth likely skews attempts to quantify the effects of agriculture on nutrient stocks. Therefore, the effect of agriculture on soils is not limited to only those depths which are subject to direct physical disturbance. In the Kilombero Valley, where additional native land is not only likely to be converted to agriculture given current trends, but also where this ”new” agriculture will become increasingly intensive, soil surveys should consider the role of deep soil layers in carbon stock accounting.
Agricultural intensity has been positively correlated with phosphorous content [53], and is seen here (Figure 3) with mean TP stocks increasing with increasing management intensity (S-UR < C-FR < C-FI). However, the trend seen within this study was not significant. For TP, as well as SOC and TN, this lack of significance may be due to the time scale on which intensified production has taken place within the industrial farm. Sampling within the C-FI sites was conducted on the three oldest pivot irrigation fields found within the farm. These pivots became operational during the 2014–2015 growing season, compared to other LMPs being implemented for at least 10 years. Changes in soil properties are generally slow, and respond to land-use change over periods of decades [54]. Given the short time since the initiation of the pivot irrigation system, and the growing of two crops on the C-FI land, a more marked effect may be visible in future sampling on and around the farm.

4.3. Comparison of C:N and C:P Ratios between LMPs

Even though we do not see significant effects of irrigation and fertilization on TN and TP, the effect of irrigation on C:N, and fertilization on both the C:N and C:P ratio (Table 2), as well as differences at specific depths between LMPs (Table 4), may be evidence of changes that are not clear in the assessment of individual elements. Conversion of grasslands to agricultural fields is known to lower the soil organic matter C:N and C:P ratios, at least in the topsoil [55]. This nutrient enrichment of soil organic matter can be explained by the accelerated decomposition occurring in agricultural fields, which tends to release more C compared to N and P, especially in the plough layer. Here, we find larger changes in C:N and C:P ratios at depth, which could be due to the removal of C-rich inputs from the deep roots of the native vegetation. In particular, fertilization negatively affected the C:N and C:P ratios, indicating a relatively larger enrichment in N and P in fertilized fields. This result is not unexpected, as fertilization is likely increasing N and P concentrations in the crop biomass, which in turn promotes the formation of organic matter with correspondingly higher N and P concentrations and lower C:nutrient ratios. Moreover, the negative effect of fertilization on SOC (Table 2) suggests a second mechanism—C might be preferentially removed via respiration, while nutrients are immobilized by soil microorganisms and retained in the organic matter.

5. Conclusions

We studied the effect of agricultural production intensity on the concentration and stocks of soil carbon and nutrients. Our results suggest that the concentrations of SOC, and stocks of SOC and TP, are mildly affected by the conversion of native forest to agriculture and by the intensity of production systems. While no consistent trend was seen across the whole gradient of intensity, we did find a significant negative effect of fertilization and a significant positive effect of irrigation on SOC concentrations. Despite the small effects on C and nutrient stocks, fertilization significantly decreased organic matter C:N and C:P ratios, and irrigation increased the C:N ratio, suggesting that soil properties are changing along the agricultural intensity gradient.
Concentrations of SOC in surface soils are presently greater than the thresholds below which crop production is negatively impacted as reported in other studies. For example, maize yields can be negatively affected as SOC concentrations decline below 2% in surface soils [40]. Our results also suggest that it is unlikely that surface SOC concentrations would rapidly decrease below this threshold in these relatively organic matter-rich soils. However, to further assess the effect of agricultural intensity on yields, it would be valuable to look at changes in plant available forms of macro and micro nutrients. This would require repeat sampling, as these forms are prone to large temporal variation, which is a potential way forward for research within the Kilombero Valley.
Whilst not statistically significant, all three agricultural LMPs point in the direction of increased SOC stocks in surface soils and reduced SOC stocks in the subsoils, compared to native vegetation. While often unaccounted for, the potential reduction in subsoil SOC stocks is an important factor to consider with regard to climate change, as SOC loss at depth may reduce benefits gained from increasing SOC stocks in surface soil.

Supplementary Materials

The following are available online at https://www.mdpi.com/2073-445X/9/4/121/s1, Figure S1: Soil texture ternary plot for each soil layer, for: (a) 0–20 cm; (b) 20–30; (c) 30–40 cm; (d) 40–50 cm; (e) 50–60 cm; (f) 60–80 cm. Points consisting of an outer ring of a different color to its center represent points with identical results between two LMPs. Table S1: Dummy variable values. A 1 denotes the presences of a specific property, Data S1; the original data file containing all sampling results.

Author Contributions

Conceptualization, J.L. and S.M.; methodology, J.L., S.M. and E.A.; formal analysis, J.L., A.C., M.C.; writing—original draft preparation, J.L.; writing—review and editing, J.L., E.A., M.T., S.W.L., A.C., M.C., R.L., and S.M.; visualization, J.L. All authors have read and agreed to the published version of the manuscript.

Funding

This research was funded by Vetenskapsrådet, grant number VR 2016-06313; the Bolin Centre for Climate Research; and Swedish International Development Agency (Sida), grant number SWE-2011-066 and Sida Decision 2015-000032 Contribution 51170071 Sub-project 2239.

Acknowledgments

The authors would like to thank all the farmers who allowed access to their land, the management of Kilombero Plantation Ltd. for local assistance and logistics, and all support workers who provided assistance during sampling. The authors also thank three reviewers for their constructive comments.

Conflicts of Interest

The authors declare no conflict of interest.

References

  1. McBratney, A.; Field, D.J.; Koch, A. The dimensions of soil security. Geoderma 2014, 213, 203–213. [Google Scholar] [CrossRef] [Green Version]
  2. UNCCD. The Global Land Outlook, 1st ed.; UNCCD: Bonn, Germany, 2017. [Google Scholar]
  3. United Nations. Department of Economic and Social Affairs, Population Division. World Population Prospects 2019: Data Booklet; United Nations: New York, NY, USA, 2019. [Google Scholar]
  4. Deutsch, C.A.; Tewksbury, J.J.; Tigchelaar, M.; Battisti, D.S.; Merrill, S.C.; Huey, R.B.; Naylor, R.L. Increase in crop losses to insect pests in a warming climate. Science (80-.) 2018, 361, 916–919. [Google Scholar] [CrossRef] [PubMed] [Green Version]
  5. Piemontese, L.; Fetzer, I.; Rockström, J.; Jaramillo, F. Future hydroclimatic impacts on Africa: Beyond the Paris Agreement. Earth’s Future 2019, 7, 748–761. [Google Scholar] [CrossRef] [Green Version]
  6. Teixeira, E.I.; Fischer, G.; Van Velthuizen, H.; Walter, C.; Ewert, F. Global hot-spots of heat stress on agricultural crops due to climate change. Agric. For. Meteorol. 2013, 170, 206–215. [Google Scholar] [CrossRef]
  7. Tubiello, F.N.; Salvatore, M.; Ferrara, A.F.; House, J.; Federici, S.; Rossi, S.; Biancalani, R.; Condor Golec, R.D.; Jacobs, H.; Flammini, A.; et al. The Contribution of Agriculture, Forestry and other Land Use activities to Global Warming, 1990–2012. Glob. Chang. Biol. 2015, 21, 2655–2660. [Google Scholar] [CrossRef] [Green Version]
  8. Paustian, K.; Lehmann, J.; Ogle, S.; Reay, D.; Robertson, G.P.; Smith, P. Climate-smart soils. Nature 2016, 532, 49–57. [Google Scholar] [CrossRef] [Green Version]
  9. Minasny, B.; Malone, B.P.; McBratney, A.B.; Angers, D.A.; Arrouays, D.; Chambers, A.; Chaplot, V.; Chen, Z.; Cheng, K.; Das, B.S.; et al. Soil carbon 4 per mille. Geoderma 2017, 292, 59–86. [Google Scholar] [CrossRef]
  10. Tongwane, M.I.; Moeletsi, M.E. A review of greenhouse gas emissions from the agriculture sector in Africa. Agric. Syst. 2018, 166, 124–134. [Google Scholar] [CrossRef]
  11. URT. Agricultural Sector Development Programme Phase II (ASDP-II); The United Republic of Tanzania Ministry of Agriculture: Dodoma, Tanzania, 2017. [Google Scholar]
  12. World Bank. Tanzania-Southern Agriculture Growth Corridor Investment Project: Environmental Assessment (Vol. 3): Strategic Regional Environmental and Social Assessment: Final Report (English); World Bank: Tanzania, South Africa, 2013. [Google Scholar]
  13. Evans, L.T. Feeding the Ten Billion: Plants and Population Growth; Cambridge University Press: Cambridge, UK, 1998; ISBN 0-521-64685-5. [Google Scholar]
  14. Perrings, C.; Halkos, G. Agriculture and the threat to biodiversity in sub-saharan Africa. Environ. Res. Lett. 2015, 10, 095015. [Google Scholar] [CrossRef]
  15. Zabel, F.; Delzeit, R.; Schneider, J.M.; Seppelt, R.; Mauser, W.; Václavík, T. Global impacts of future cropland expansion and intensification on agricultural markets and biodiversity. Nat. Commun. 2019, 10, 1–10. [Google Scholar] [CrossRef] [Green Version]
  16. Potts, S.G.; Imperatriz-Fonseca, V.; Ngo, H.T.; Aizen, M.A.; Biesmeijer, J.C.; Breeze, T.D.; Dicks, L.V.; Garibaldi, L.A.; Hill, R.; Settele, J.; et al. Safeguarding pollinators and their values to human well-being. Nature 2016, 540, 220–229. [Google Scholar] [CrossRef] [PubMed]
  17. Zhao, Z.H.; Hui, C.; He, D.H.; Li, B.L. Effects of agricultural intensification on ability of natural enemies to control aphids. Sci. Rep. 2015, 5, 8024. [Google Scholar] [CrossRef] [PubMed] [Green Version]
  18. Matson, P.A.; Parton, W.J.; Power, A.G.; Swift, M.J. Agricultural intensification and ecosystem properties. Science (80-.) 1997, 277, 504–509. [Google Scholar] [CrossRef] [PubMed] [Green Version]
  19. Winowiecki, L.; Vågen, T.G.; Massawe, B.; Jelinski, N.A.; Lyamchai, C.; Sayula, G.; Msoka, E. Landscape-scale variability of soil health indicators: Effects of cultivation on soil organic carbon in the Usambara Mountains of Tanzania. Nutr. Cycl. Agroecosystems 2016, 105, 263–274. [Google Scholar] [CrossRef] [Green Version]
  20. Murty, D.; Kirschbaum, M.U.F.; Mcmurtrie, R.E.; Mcgilvray, H. Does conversion of forest to agricultural land change soil carbon and nitrogen? A review of the literature. Glob. Chang. Biol. 2002, 8, 105–123. [Google Scholar] [CrossRef]
  21. Huang, S.; Sun, Y.; Zhang, W. Changes in soil organic carbon stocks as affected by cropping systems and cropping duration in China’s paddy fields: A meta-analysis. Clim. Chang. 2012, 112, 847–858. [Google Scholar] [CrossRef]
  22. Chiti, T.; Gardin, L.; Perugini, L.; Quaratino, R.; Vaccari, F.P.; Miglietta, F.; Valentini, R. Soil organic carbon stock assessment for the different cropland land uses in Italy. Biol. Fertil. Soils 2012, 48, 9–17. [Google Scholar] [CrossRef]
  23. Livsey, J.; Kätterer, T.; Vico, G.; Lyon, S.W.; Lindborg, R.; Scaini, A.; Da, C.T.; Manzoni, S. Do alternative irrigation strategies for rice cultivation decrease water footprints at the cost of long-term soil health? Environ. Res. Lett. 2019, 14, 74011. [Google Scholar] [CrossRef]
  24. Sanderman, J.; Hengl, T.; Fiske, G.J. Soil carbon debt of 12,000 years of human land use. Proc. Natl. Acad. Sci. USA 2017, 114, 9575–9580. [Google Scholar] [CrossRef] [Green Version]
  25. Cleveland, C.C.; Liptzin, D. C:N:P stoichiometry in soil: Is there a “Redfield ratio” for the microbial biomass? Biogeochemistry 2007, 85, 235–252. [Google Scholar] [CrossRef]
  26. Williams, R.J.B. Relationships Between the Composition of Soils and Physical Measurements Made on Them. Rothamsted Experimental Station Report for 1970; Rothamsted Research: Harpenden, UK, 1971; Volume 2. [Google Scholar]
  27. Lal, R. Enhancing crop yields in the developing countries through restoration of the soil organic carbon pool in agricultural lands. Land Degrad. Dev. 2006, 17, 197–209. [Google Scholar] [CrossRef]
  28. Namirembe, S.; Piikki, K.; Sommer, R.; Söderström, M.; Tessema, B.; Nyawira, S.S. Soil organic carbon in agricultural systems of six countries in East Africa—A literature review of status and carbon sequestration potential. S. Afr. J. Plant Soil 2020, 1862, 1–15. [Google Scholar] [CrossRef]
  29. Alavaisha, E.; Lyon, S.W.; Lindborg, R. Assessment of water quality across irrigation schemes: A case study of wetland agriculture impacts in Kilombero Valley, Tanzania. Water 2019, 11, 671. [Google Scholar] [CrossRef] [Green Version]
  30. RAMSAR Information Sheet on Ramsar Wetland: The Kilombero Valley Floodplain. Available online: https://rsis.ramsar.org/RISapp/files/RISrep/TZ1173RIS.pdf (accessed on 20 September 2019).
  31. Dewitte, O.; Jones, A.; Spaargaren, O.; Breuning-Madsen, H.; Brossard, M.; Dampha, A.; Deckers, J.; Gallali, T.; Hallett, S.; Jones, R.; et al. Harmonisation of the soil map of africa at the continental scale. Geoderma 2013, 211–212, 138–153. [Google Scholar] [CrossRef] [Green Version]
  32. Alavaisha, E.; Manzoni, S.; Lindborg, R. Different agricultural practices affect soil carbon, nitrogen and phosphorous in Kilombero -Tanzania. J. Environ. Manag. 2019, 234, 159–166. [Google Scholar] [CrossRef]
  33. Msofe, N.K.; Sheng, L.; Lyimo, J. Land use change trends and their driving forces in the Kilombero Valley Floodplain, Southeastern Tanzania. Sustainability 2019, 11, 505. [Google Scholar] [CrossRef] [Green Version]
  34. Seki, H.A.; Shirima, D.D.; Courtney Mustaphi, C.J.; Marchant, R.; Munishi, P.K.T. The impact of land use and land cover change on biodiversity within and adjacent to Kibasira Swamp in Kilombero Valley, Tanzania. Afr. J. Ecol. 2018, 56, 518–527. [Google Scholar] [CrossRef]
  35. Methods of Soil Analysis: Part. One-Physical and Minerological Methods, 2nd ed.; Klute, A. (Ed.) American Society of Agronomy, Inc. and Soil Science Society of America, Inc.: Madison, WI, USA, 1986; ISBN 0-89118-811-8. [Google Scholar]
  36. Walkey, A.; Black, I.A. An examination of the Degtjareff method for determining soil organic matter and a proposed modification of the chromic acid titration method. Soil Sci. 1934, 37, 29–38. [Google Scholar] [CrossRef]
  37. Bray, R.; Kurtz, L. Determination of total, organic, and available forms of phosphorus in soils. Soil Sci. 1945, 59, 39–46. [Google Scholar] [CrossRef]
  38. Davidson, A.C. Statistical Models; Cambridge University Press: Cambridge, UK, 2003; ISBN 9780511672996. [Google Scholar]
  39. Tully, K.; Sullivan, C.; Weil, R.; Sanchez, P. The State of soil degradation in sub-Saharan Africa: Baselines, trajectories, and solutions. Sustainability 2015, 7, 6523–6552. [Google Scholar] [CrossRef] [Green Version]
  40. Oldfield, E.E.; Bradford, M.A.; Wood, S.A. Global meta-analysis of the relationship between soil organic matter and crop yields. Soil 2019, 5, 15–32. [Google Scholar] [CrossRef] [Green Version]
  41. Don, A.; Schumacher, J.; Freibauer, A. Impact of tropical land-use change on soil organic carbon stocks—A meta-analysis. Glob. Chang. Biol. 2011, 17, 1658–1670. [Google Scholar] [CrossRef] [Green Version]
  42. Kempen, B.; Dalsgaard, S.; Kaaya, A.K.; Chamuya, N.; Ruipérez-González, M.; Pekkarinen, A.; Walsh, M.G. Mapping topsoil organic carbon concentrations and stocks for Tanzania. Geoderma 2019, 337, 164–180. [Google Scholar] [CrossRef]
  43. Jobbágy, E.G.; Jackson, R.B.; Biogeochemistry, S.; Mar, N. The Distribution of Soil Nutrients with Depth: Global Patterns and the Imprint of Plants. Biogeochemistry 2001, 53, 51–77. [Google Scholar] [CrossRef]
  44. Jobbágy, E.G.; Jackson, R.B. The vertical distribution of soil organic carbon and its relation to climate and vegetation. Ecol. Appl. 2000, 10, 423–436. [Google Scholar] [CrossRef]
  45. Tipping, E.; Somerville, C.J.; Luster, J. The C:N:P:S stoichiometry of soil organic matter. Biogeochemistry 2016, 130, 117–131. [Google Scholar] [CrossRef] [Green Version]
  46. Ruehlmann, J.; Körschens, M. Calculating the effect of soil organic matter concentration on soil bulk density. Soil Sci. Soc. Am. J. 2009, 73, 876–885. [Google Scholar] [CrossRef]
  47. Trost, B.; Prochnow, A.; Drastig, K.; Meyer-Aurich, A.; Ellmer, F.; Baumecker, M. Irrigation, soil organic carbon and N2O emissions. A review. Agron. Sustain. Dev. 2013, 33, 733–749. [Google Scholar] [CrossRef] [Green Version]
  48. Han, P.; Zhang, W.; Wang, G.; Sun, W.; Huang, Y. Changes in soil organic carbon in croplands subjected to fertilizer management: A global meta-analysis. Sci. Rep. 2016, 6, 1–13. [Google Scholar]
  49. Haddaway, N.R.; Hedlund, K.; Jackson, L.E.; Kätterer, T.; Lugato, E.; Thomsen, I.K.; Jørgensen, H.B.; Isberg, P.-E. How does tillage intensity affect soil organic carbon? A systematic review. Environ. Evid. 2017, 6, 30. [Google Scholar] [CrossRef] [Green Version]
  50. Hobley, E.; Baldock, J.; Hua, Q.; Wilson, B. Land-use contrasts reveal instability of subsoil organic carbon. Glob. Chang. Biol. 2017, 23, 955–965. [Google Scholar] [CrossRef] [PubMed] [Green Version]
  51. Rumpel, C.; Kögel-Knabner, I. Deep soil organic matter—A key but poorly understood component of terrestrial C cycle. Plant Soil 2011, 338, 143–158. [Google Scholar] [CrossRef]
  52. Osinaga, N.A.; Álvarez, C.R.; Taboada, A.M. Effect of deforestation and subsequent land use management on soil carbon stocks in the South American Chaco. Soil 2018, 4, 251–257. [Google Scholar] [CrossRef] [Green Version]
  53. De Neve, S.; Van Den Bossche, A.; Sleutel, S.; Hofman, G. Soil nutrient status of organic farms in flanders: An overview and a comparison with the conventional situation. Biol. Agric. Hortic. 2006, 24, 217–235. [Google Scholar] [CrossRef]
  54. Hartemink, A.E.; McSweeney, K. (Eds.) Soil Carbon; Springer International Publishing: Cham, Switzerland, 2014; ISBN 978-3-319-04083-7. [Google Scholar]
  55. Li, S.; Xu, J.; Tang, S.; Zhan, Q.; Gao, Q.; Ren, L.; Shao, Q.; Chen, L.; Du, J.; Hao, B. A meta-analysis of carbon, nitrogen and phosphorus change in response to conversion of grassland to agricultural land. Geoderma 2020, 363, 114149. [Google Scholar] [CrossRef]
Figure 1. Soil sampling locations (sites) on and around the Kilombero Plantations Ltd. farm.
Land 09 00121 g001
Figure 2. Slope coefficients (β) for a fitted single term exponential model (y = aeβx) for: (a), % SOC; (b), % TN; (c), % TP. More negative values indicate steeper vertical declines in element concentrations. Colored circles along the x-axis of each pane denote the results for each LMP, circles represent the estimated β values for each LMP, black whiskers are the related standard errors (n = 5).
Land 09 00121 g002
Figure 3. Stocks of SOC (a–c), TN (d–f) and TP (g–i) for: left, 0–30 cm, center 30–80 cm from the soil surface; right, 0–80 cm from the soil surface. Note the different vertical scales between the two left columns and the right one; black whiskers are standard errors (n = 5). Different letters (A or B) above bars represent significant difference (p < 0.05) between LMPs determined using one-way analysis of variance and Tukey’s honestly significant difference post hoc test.
Land 09 00121 g003
Table 1. Land management practices on the locations selected for soil sampling.
Land Management PracticeDescriptionLabelFigure Label ColorAgricultural Intensity
On-farm irrigated (C-FI)Fields within the industrial farm on which irrigated and chemically fertilized rice is grown in the wet season. Irrigated maize is grown in the dry season. Fertilizer application is provided primarily via pivot irrigation systemsC-FI Land 09 00121 i001High intensity
Land 09 00121 i002
Low intensity
On-farm non irrigated (C-FR)Fields within the industrial farm on which rain-fed and chemically fertilized rice is grown in the wet season. Fields are not utilized in the dry season.C-FR Land 09 00121 i003
Off-farm non irrigated (S-UR)Smallholder fields outside, but located close to, the industrial farm. Fields are used for rice production, and are neither irrigated or fertilized.S-UR Land 09 00121 i004
Native (NAT)Undisturbed forest and shrubland within the industrial farm which has been set aside as a green spaceNAT Land 09 00121 i005
Table 2. Estimates and regression using the mixed effect model for soil organic carbon (SOC), total nitrogen (TN), total phosphorus (TP), and carbon to nitrogen ratio (C:N) and carbon to phosphorus ratio (C:P) ratios.
ParameterSOCTNTPC:NC:P
EstimateSEp-ValueEstimateSEp-ValueEstimateSEp-ValueEstimateSEp-ValueEstimateSEp-Value
α(Intercept)1.16330.29900.0002−1.63290.13130.0000−2.13600.22650.00002.75170.26820.00003.19790.35200.0000
β1(Irrigated)0.57520.26910.0483−0.02830.11580.81020.12700.20760.54950.62960.21300.00930.30750.29540.3135
β2(Fertilized)−0.49490.26940.08480.01510.11590.89780.37240.20760.0918−0.52050.21320.0267−0.78210.29560.0176
β3(Non−natural)−0.28070.27630.32490.10060.11710.40270.05290.20760.8021−0.33400.21960.1478−0.19020.29830.5328
θ1(Percent Silt)0.02790.00890.00210.01280.00440.0044−0.00030.00910.97580.01550.00860.07330.02740.01230.0277
θ2(Depth)−0.02170.00250.0000−0.01470.00130.0000−0.00860.00270.0022−0.00700.00260.0085−0.01320.00390.0011
Note: soil organic carbon (SOC); total nitrogen (TN); total phosphorous (TP); carbon to nitrogen ratio (C:N) and carbon to phosphorus ratio (C:P); standard error (SE).
Table 3. Mean percentages of: soil organic carbon (SOC; top rows); total nitrogen (TN; middle top); total phosphorous (TP; middle bottom); and bulk density (BD, bottom) at each sampling depth for the four land management practices (LMPs). Bracketed numbers are standard errors (n = 5). Different letters in the same column indicate significant difference (p < 0.05) between LMPs determined using one-way analysis of variance and Tukey’s honestly significant difference post hoc test.
LMP0–20 cm20–30 cm30–40 cm40–50 cm50–60 cm60–80 cm
% SOC
NAT2.54(0.3)a2.24(0.22)a2.07(0.24)a2.18(0.44) b1.41(0.10) b1.10(0.06)a
S-UR3.64(0.53)a2.34(0.62)a1.67(0.39)a1.34(0.25)ab0.90(0.26)ab0.74(0.24)a
C-FR2.89(0.19)a2.48(0.39)a1.25(0.16)a0.50(0.11) a0.53(0.15) a0.54(0.10)a
C-FI3.81(0.27)a2.69(0.27)a1.46(0.19)a1.00(0.16) a0.83(0.12)ab1.06(0.27)a
% TN
NAT0.19(0.02)a0.14(0.01)a0.12(0.01)a0.12(0.01)a0.11(0.01)a0.09(<0.00)a
S-UR0.23(0.03)a0.19(0.03)a0.14(0.02)a0.12(0.02)a0.10(0.02)a0.08(0.01)a
C-FR0.20(0.02)a0.21(0.05)a0.13(0.01)a0.13(0.02)a0.11(0.02)a0.09(0.02)a
C-FI0.23(0.01)a0.18(0.02)a0.15(0.01)a0.11(0.02)a0.09(0.01)a0.09(0.01)a
% TP
NAT0.12(0.02)a0.10(0.02)ab0.09(0.02)a0.08(0.01)a0.07(0.01)a0.09(0.02)a
S-UR0.13(0.01)a0.09(0.02) b0.10(0.02)a0.09(0.02)a0.08(0.02)a0.08(0.03)a
C-FR0.16(0.02)a0.14(0.03)ab0.18(0.05)a0.12(0.06)a0.13(0.03)a0.07(0.02)a
C-FI0.19(0.03)a0.22(0.04) a0.14(0.03)a0.11(0.03)a0.25(0.12)a0.17(0.05)a
BD (g cm−3)
NAT0.99(0.05)a1.07(0.05)a1.16(0.04)a1.11(0.06)a1.16(0.04)a1.17(0.03)a
S-UR0.84(0.06)a0.94(0.08)a1.01(0.1)a1.10(0.09)a1.13(0.05)a1.21(0.08)a
C-FR0.96(0.04)a1.03(0.06)a1.09(0.08)a1.23(0.07)a1.24(0.08)a1.31(0.07)a
C-FI0.93(0.06)a0.98(0.09)a1.10(0.09)a1.14(0.06)a1.17(0.05)a1.26(0.05)a
Table 4. Means of the observed soil C:N (top) and C:P (bottom) ratios through the sampled depths for each LMP. Bracketed numbers are standard error (n = 5). Different letters in the same column indicate significant difference (p < 0.05) between LMPs determined using one-way analysis of variance and Tukey’s honestly significant difference post hoc test.
0–20 cm20–30 cm30–40 cm40–50 cm50–60 cm60–80 cm
C:N
NAT14.6(3.24)a15.9(1.34)a16.6(1.35)b18.2(2.96)b13.3(0.61)b12.4(1.02)a
S-UR15.7(0.88)a11.8(1.09)a11.5(1.63)ab11.4(1.79)ab9.48(2.49)ab9.37(2.64)a
C-FR14.5(0.94)a14.7(3.91)a9.68(0.77)a3.77(0.65)a4.54(0.86)a6.09(1.08)a
C-FI16.7(0.64)a14.8(0.73)a10.1(1.13)a9.39(1.50)a9.09(0.72)ab14.6(6.13)a
C:P
NAT24.4(6.51)a24.6(2.59)a28.4(6.79)b34.2(12.0)b19.9(1.34)a13.3(1.84)a
S-UR30.0(5.70)a32.4(11.41)a19.9(4.69)ab15.7(3.41)ab19.7(11.3)a26.7(19.5)a
C-FR18.5(1.17)a22.7(6.50)a8.68(1.67)a6.53(2.13)a4.83(1.65)a8.10(2.01)a
C-FI21.5(1.99)a13.9(2.34)a13.5(4.46)ab12.1(3.26)ab5.90(1.89)a9.89(3.54)a

