
Analysis of Urban Green Spaces Based on Sentinel-2A: Case Studies from Slovakia †


Abstract
:
1. Introduction
- Apply a methodical procedure of UGS extraction from S2A satellite imagery to selected study areas.
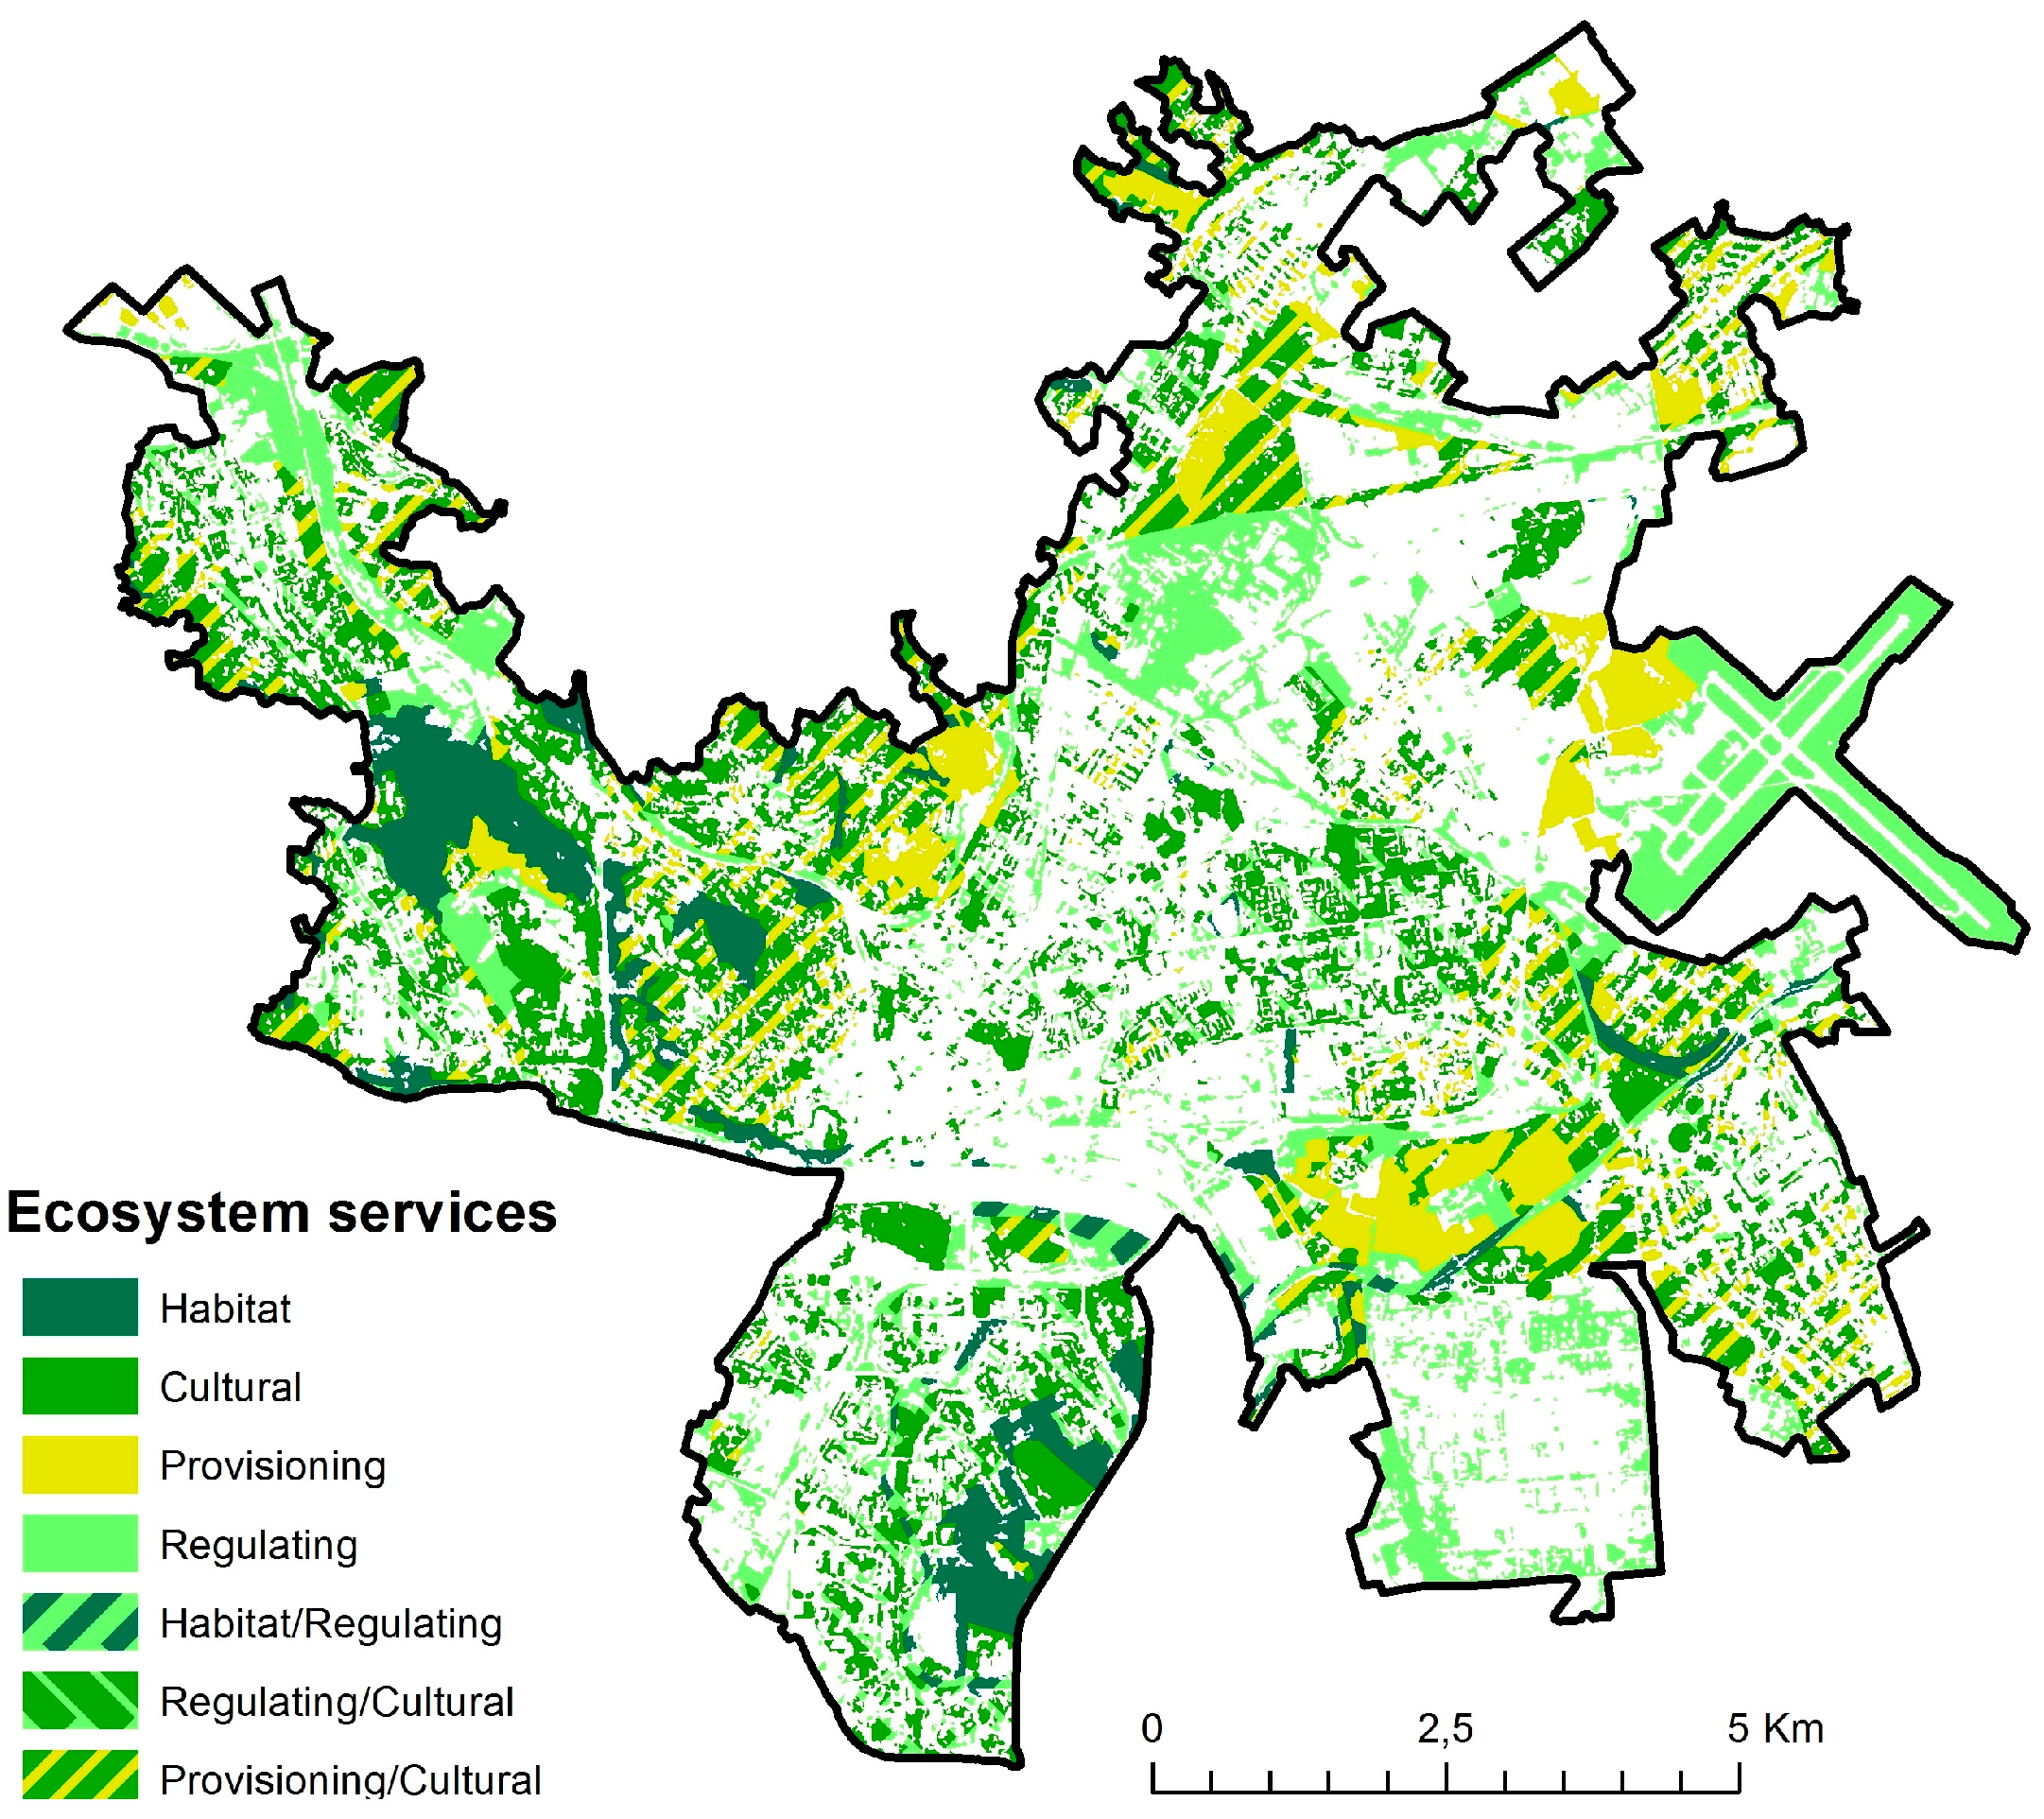
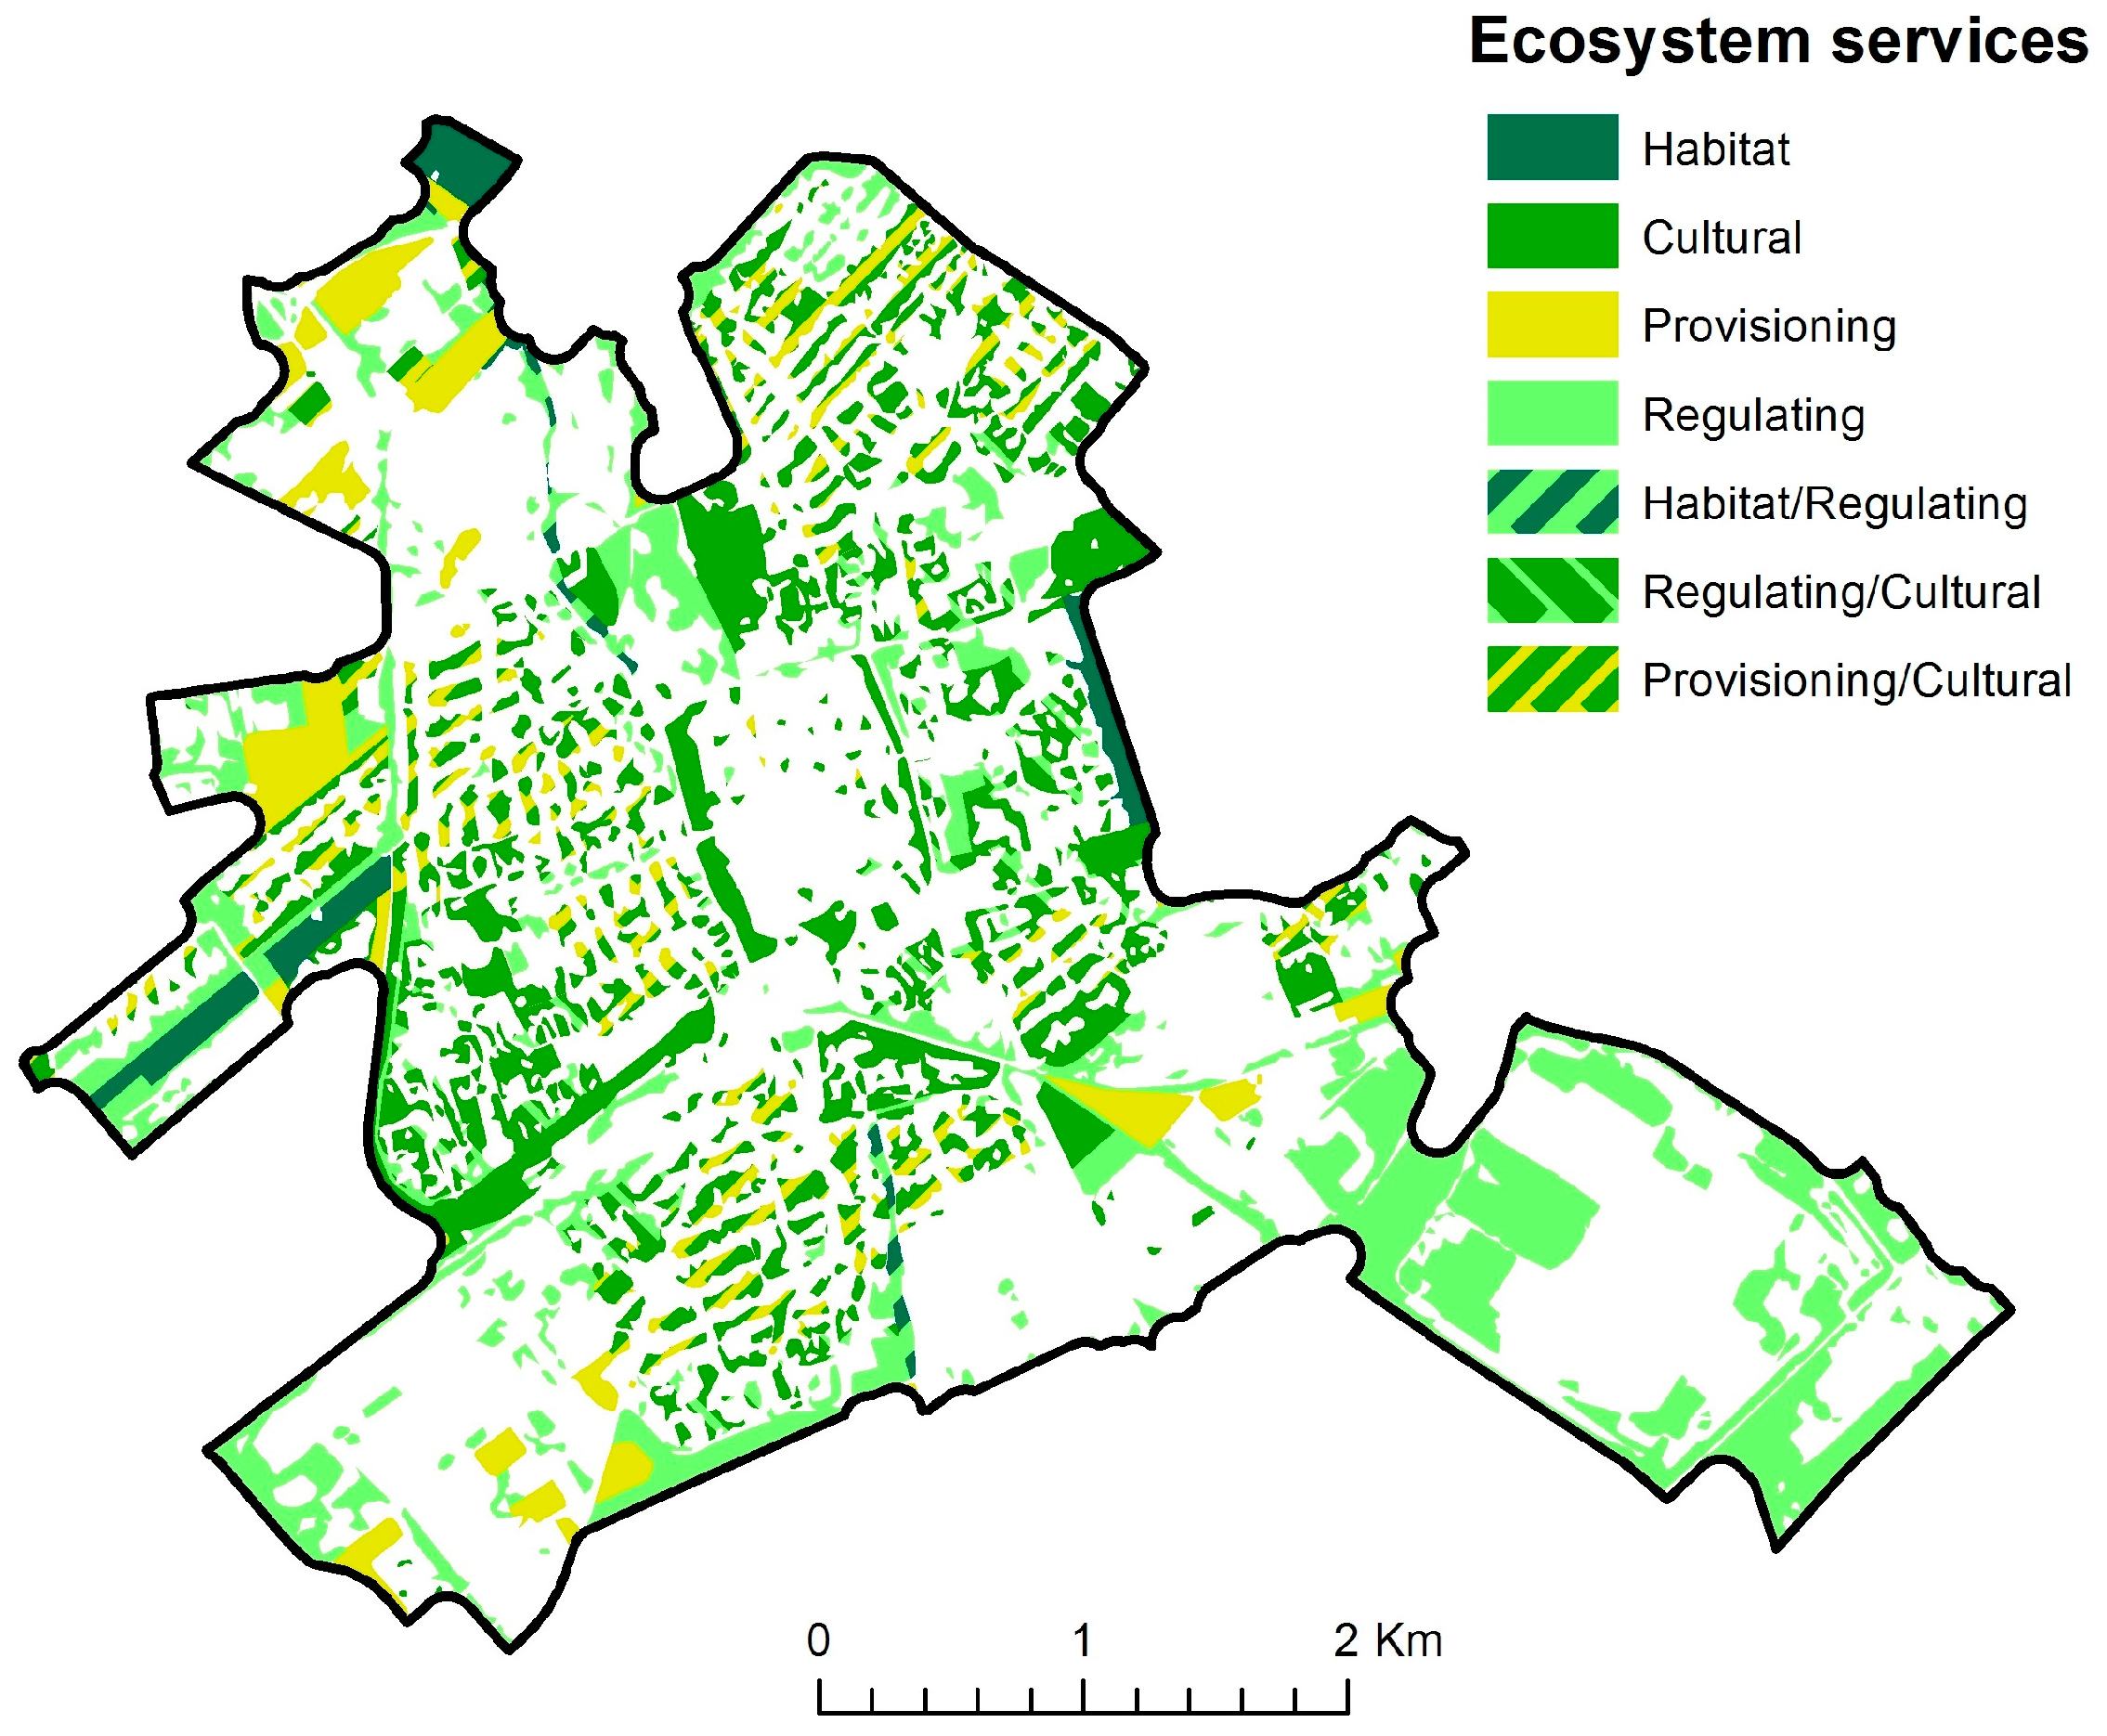
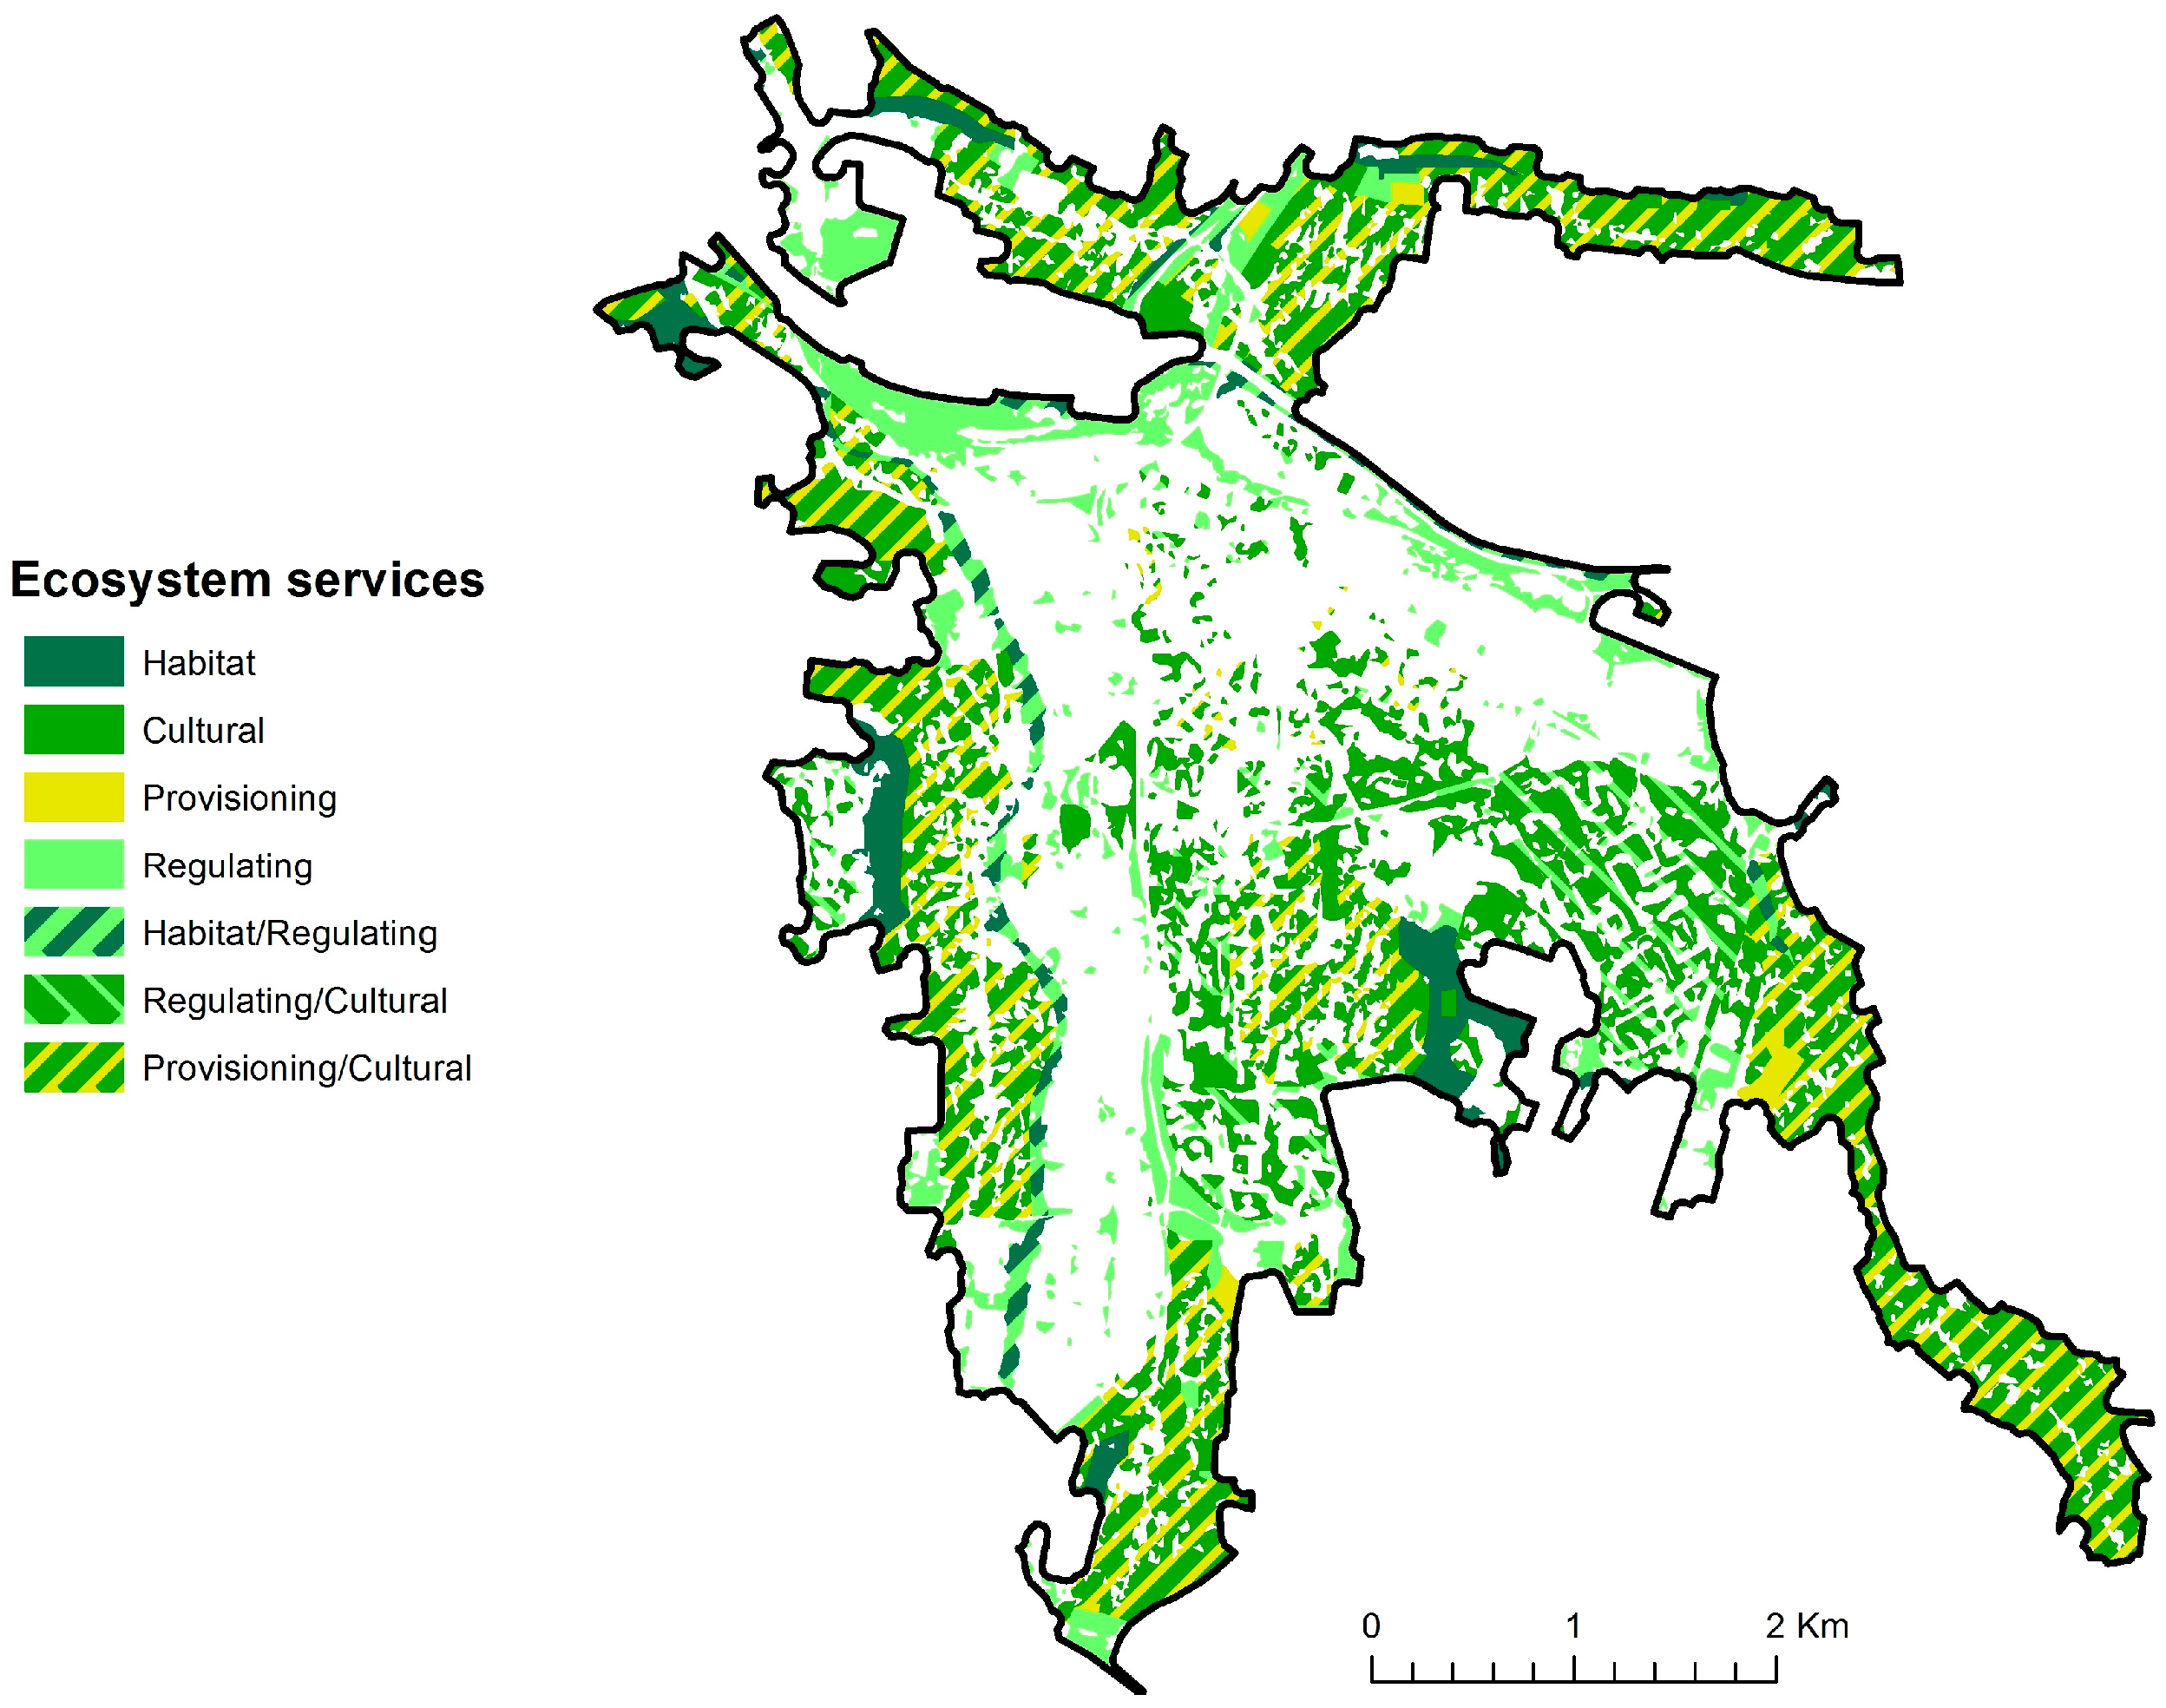
- Analyse the UGS composition in the context of ecosystem services and identify UGS major components typical for cities in Slovakia.
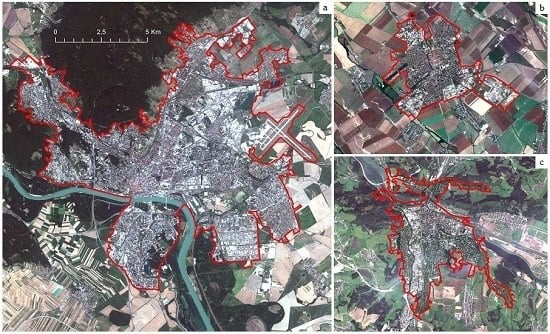
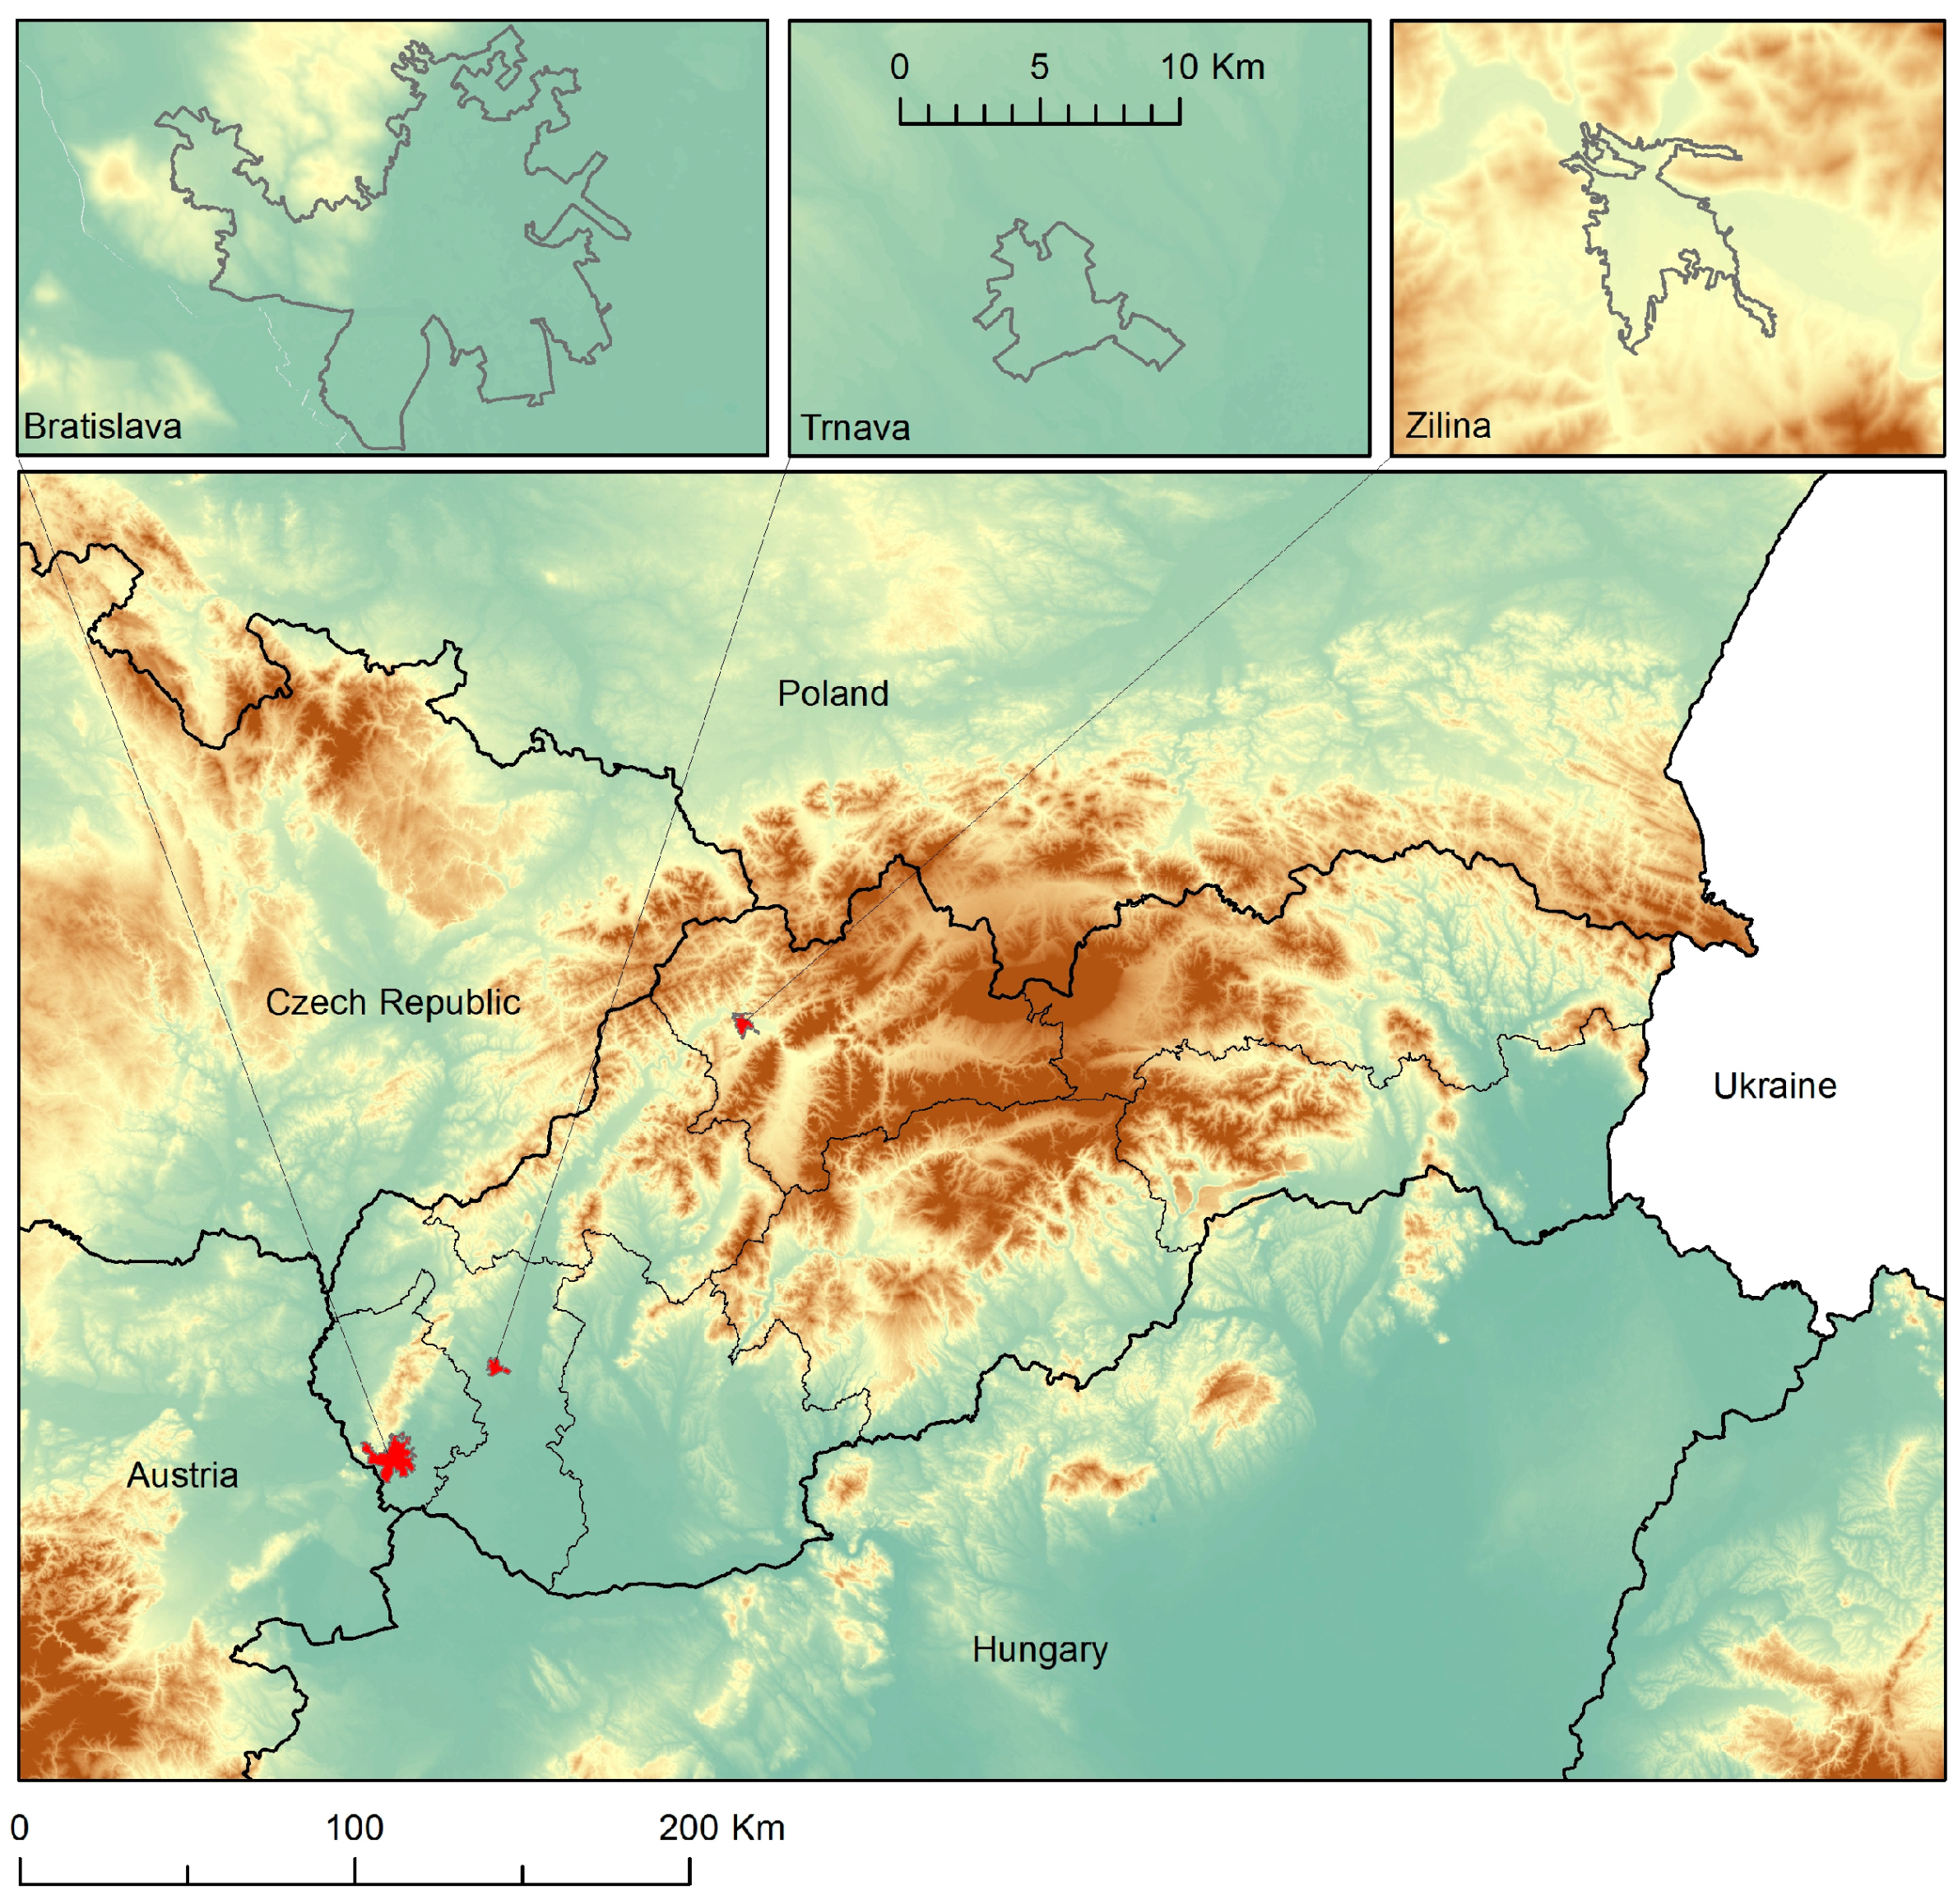
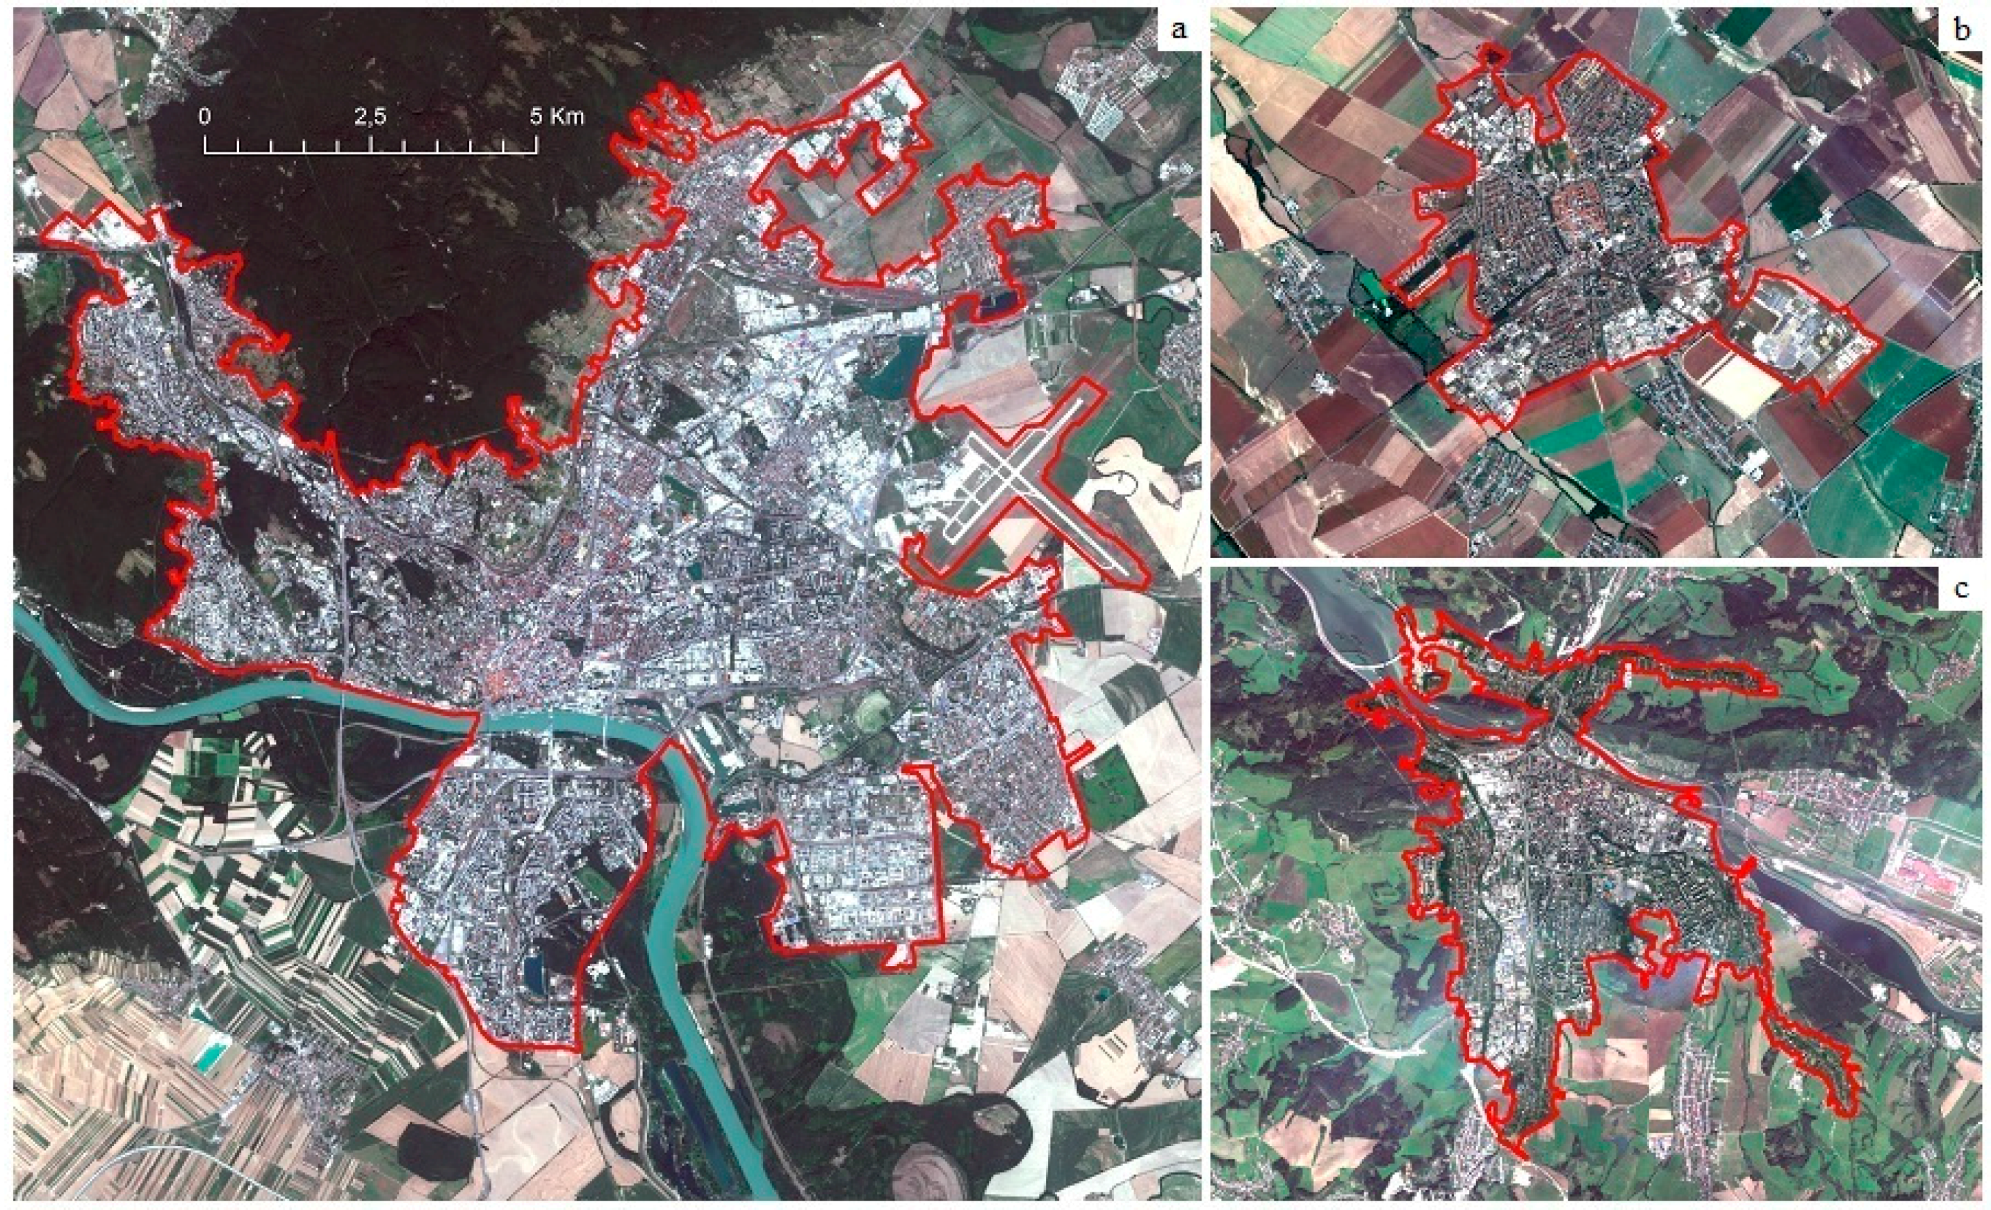
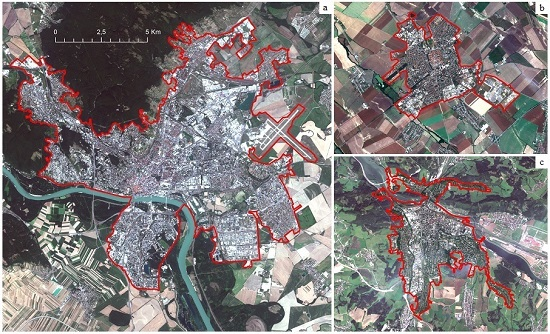
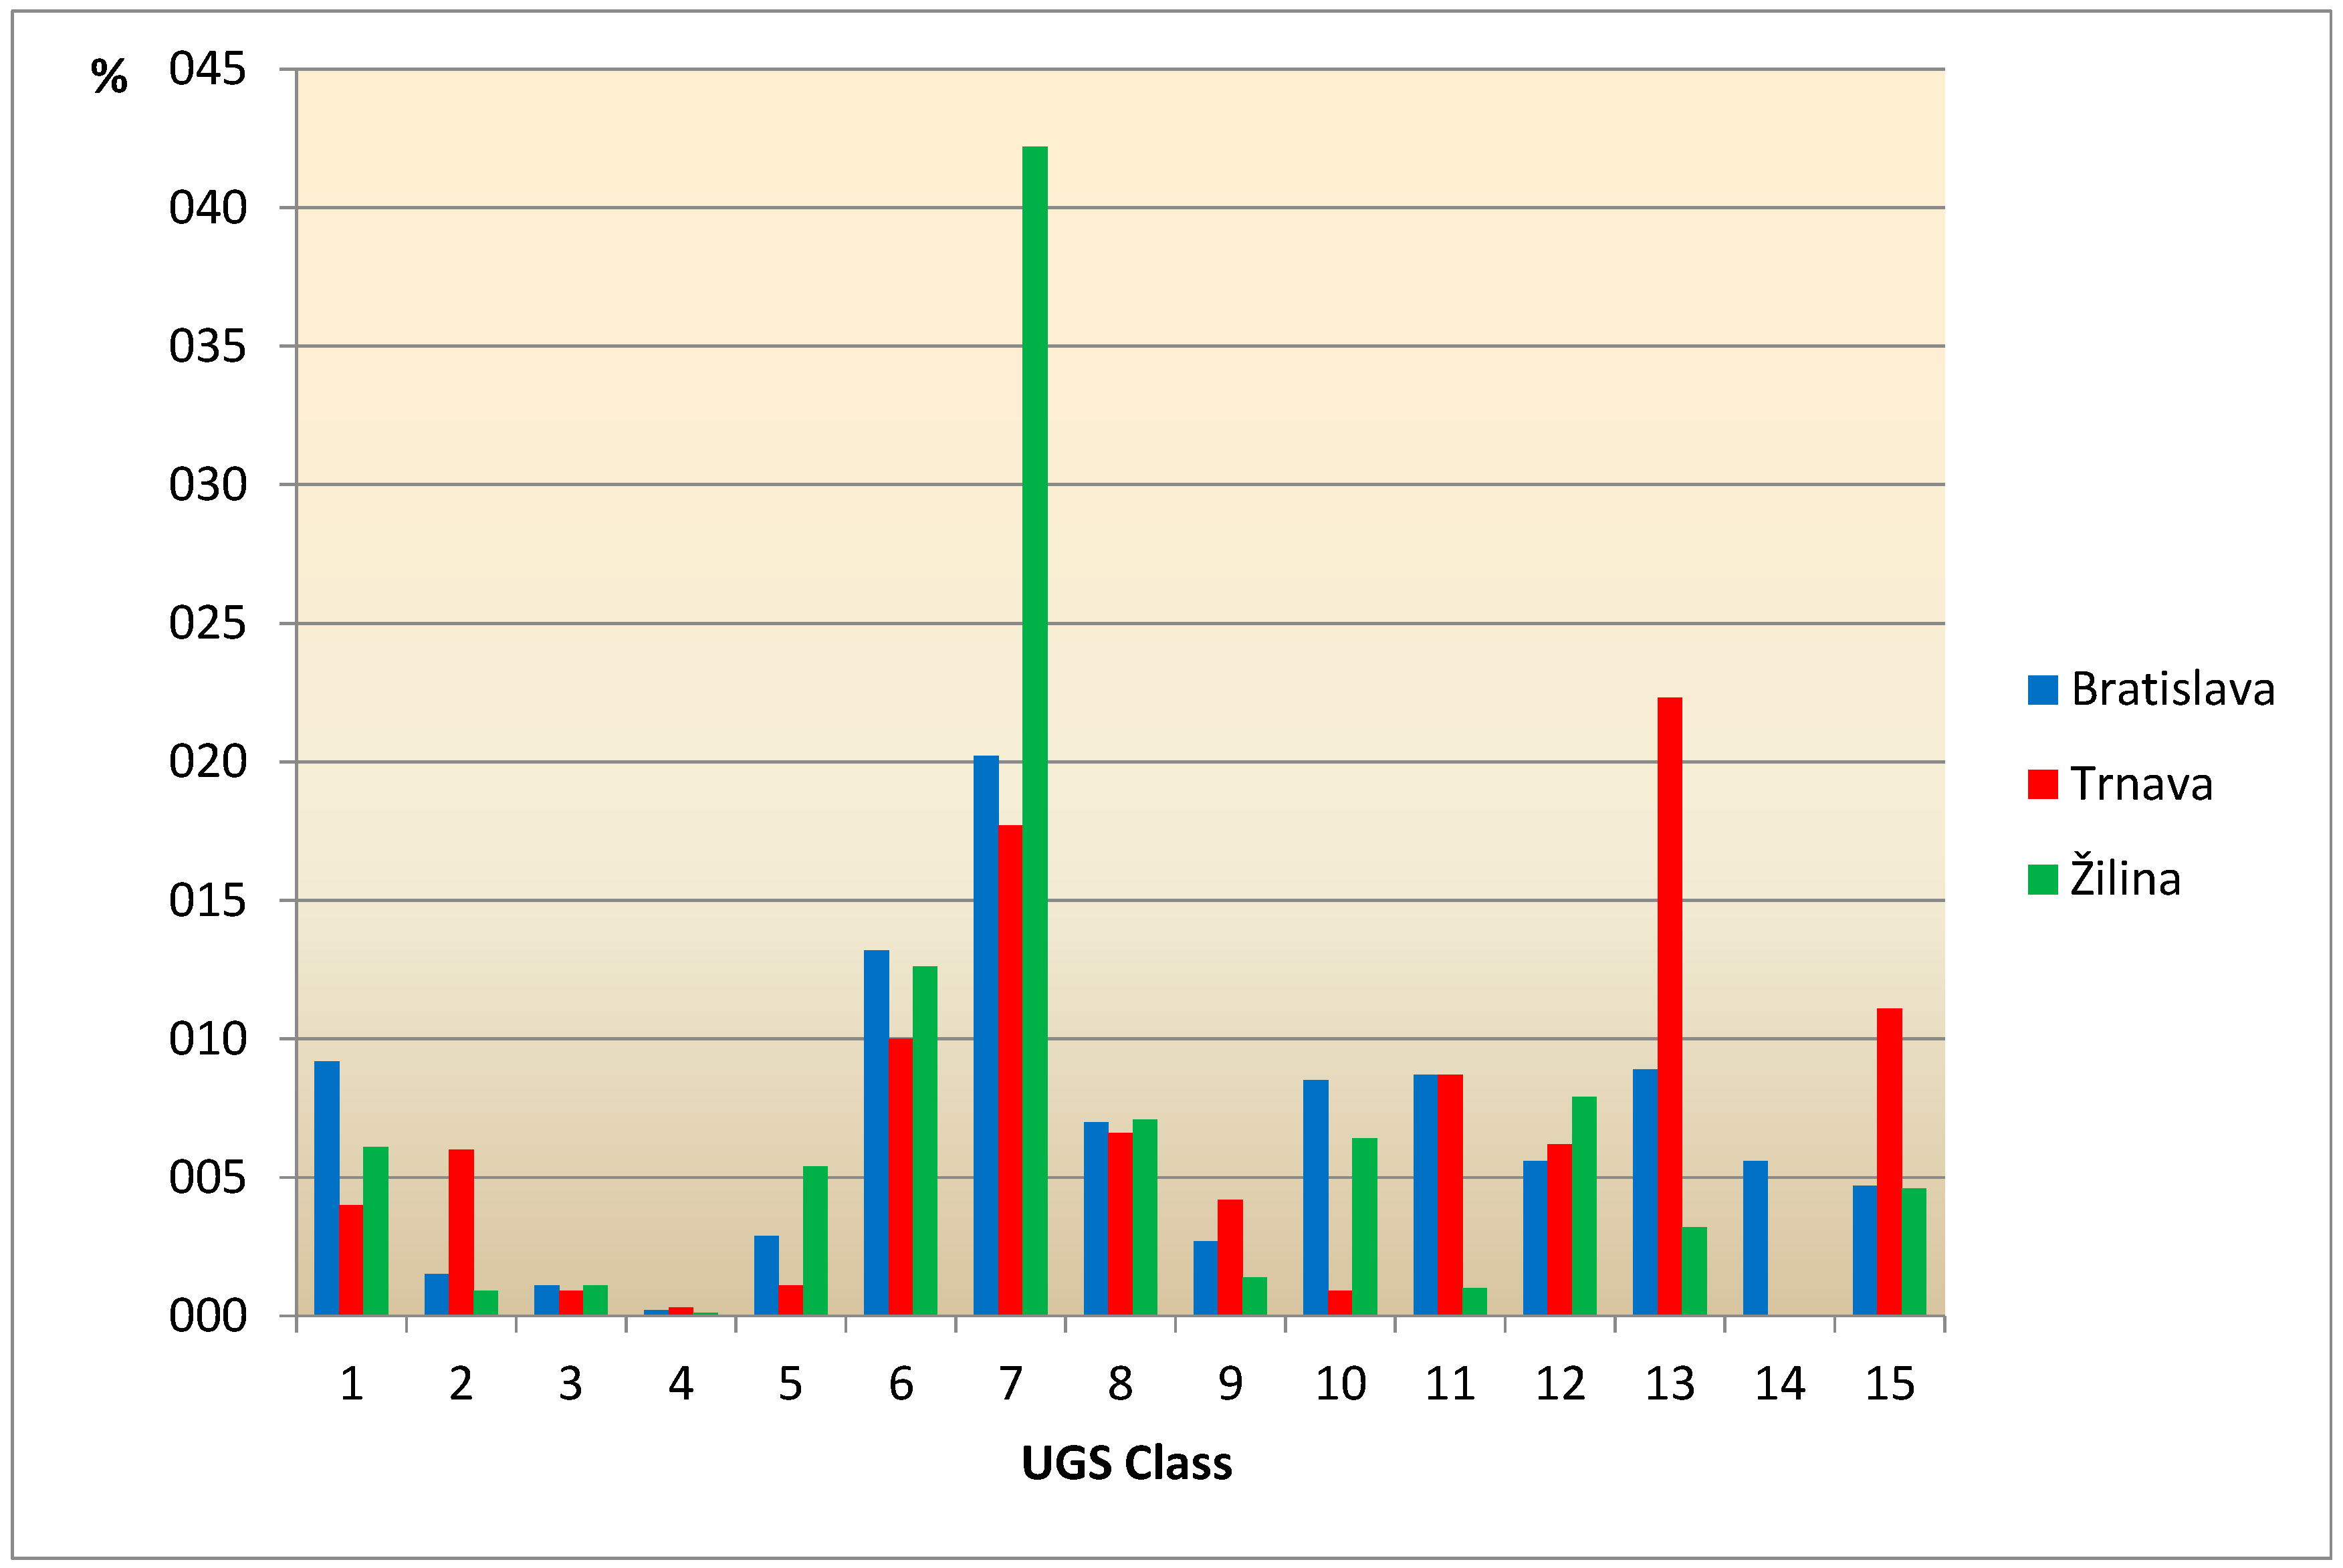
- Present the results of UGS comparative analysis in three regional cities in Slovakia: Bratislava, Trnava and Žilina.
2. Materials and Methods
2.1. Data
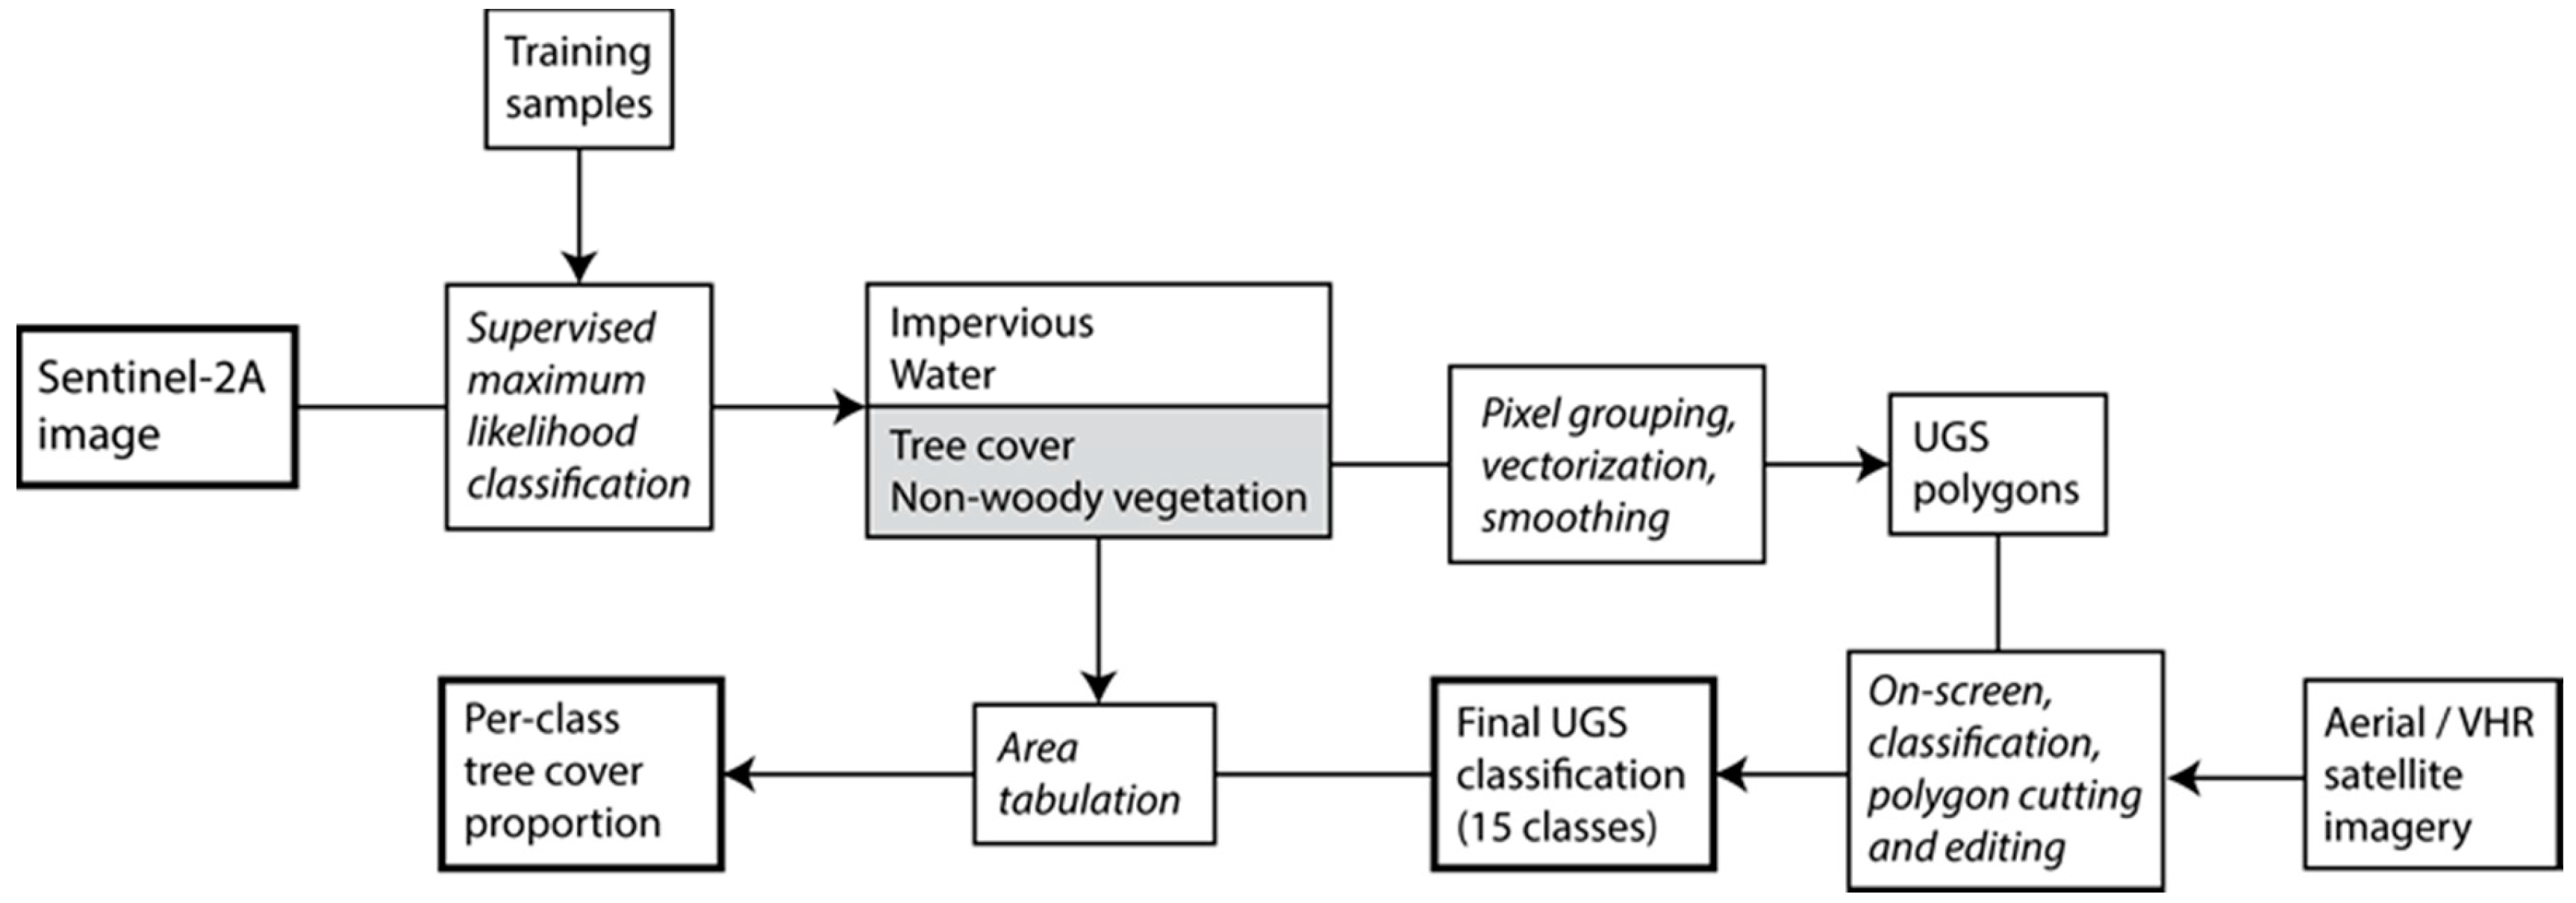
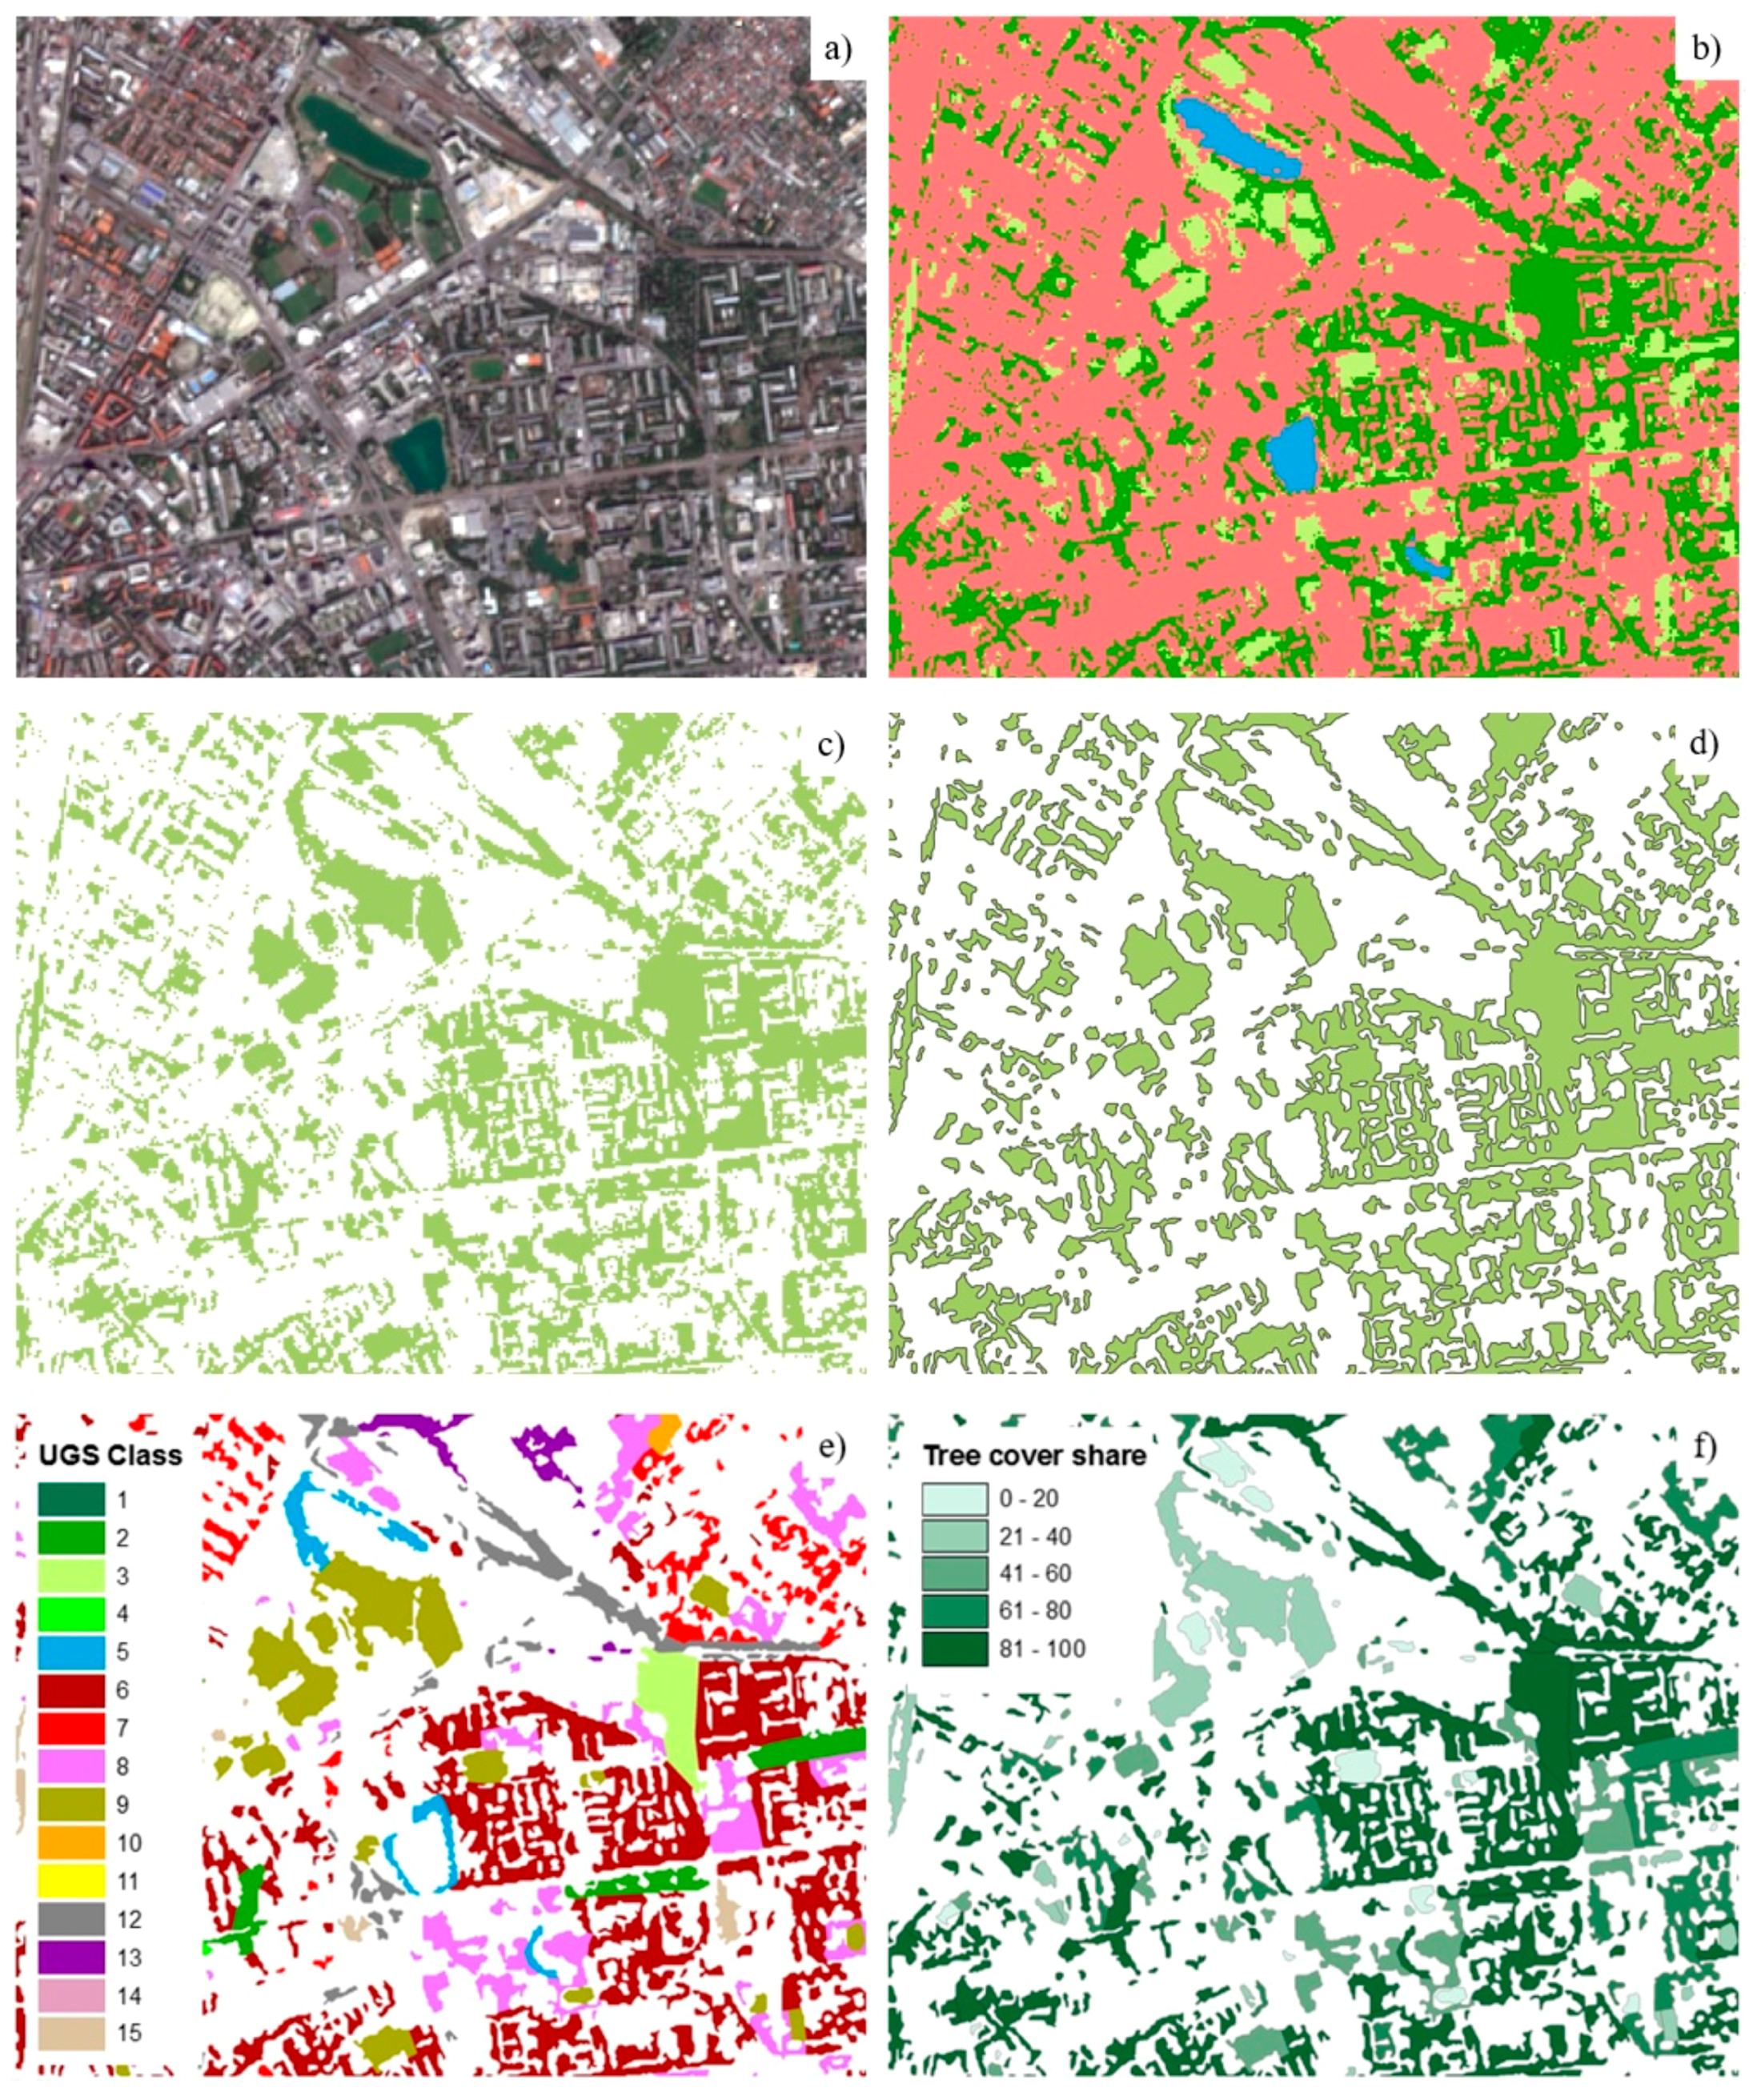
2.2. Methodology
- Provisioning services are ecosystem services that describe the material or energy outputs from ecosystems. They include providing raw materials, fresh water, food and medicinal resources.
- Regulating services are the services that ecosystems provide by acting as regulators of local climate and air quality, carbon sequestration and storage, moderation of extreme events, wastewater treatment, erosion prevention and maintenance of soil fertility, pollination and biological control.
- Cultural services include the nonmaterial, socio-ecological benefits (including psychological and cognitive benefits) people obtain from contact with the environment. They include recreation, physical and mental health (for example walking or playing sports in green areas), tourism, aesthetic appreciation and inspiration for culture, art and design, spiritual experience and sense of place (different sacred places or places with a religious meaning).
- Habitat and supporting services underpin almost all other services by providing living spaces for organisms. They provide habitats for species and contribute to the maintenance of genetic diversity.
2.3. Study Areas
3. Results
4. Discussion
4.1. Processing of Sentinel-2A Data
4.2. Assessment of Urban Ecosystem Services
5. Conclusions
Acknowledgments
Author Contributions
Conflicts of Interest
References
- European Environmental Agency. Urban Sprawl in Europe. The Ignored Challenge; EEA Report No. 10/2006; Office for Official Publications of the European Communities: Luxembourg, 2006; p. 56. [Google Scholar]
- Soukup, T.; Feranec, J.; Hazeu, G.; Jaffrain, G.; Jindrova, M.; Kopecky, M.; Orlitova, E. Corine Land Cover 1990 (CLC 1990): Analysis and Assessment. In European Landscape Dynamics: Corine Land Cover Data; Feranec, J., Soukup, T., Hazeu, G., Jaffrain, G., Eds.; CRC Press: Boca Raton, FL, USA, 2016; pp. 69–76. [Google Scholar]
- Grimm, N.B.; Faeth, S.H.; Golubiewski, N.E.; Redman, C.L.; Wu, J.; Bai, X.; Briggs, J.M. Global change and the ecology of cities. Science 2008, 319, 756–760. [Google Scholar] [CrossRef] [PubMed]
- Müller, N.; Ignatieva, M.; Nilon, C.H.; Werner, P.; Zipperer, W.C. Patterns and Trends in Urban Biodiversity and Landscape Design. In Urbanization, Biodiversity and Ecosystem Services: Challenges and Opportunities: A Global Assessment; Elmqvist, T., Fragkias, M., Goodness, J., Güneralp, B., Marcotullio, P.J., McDonald, R.I., Parnell, S., Schewenius, M., Sendstad, M., Seto, K.C., et al., Eds.; Springer: Dordrecht, The Netherlands; Heidelberg, Germany; New York, NY, USA; London, UK, 2013; pp. 123–174. [Google Scholar]
- Schmid, J.A. Urban Vegetation: A Review and Chicago Case Study; Department of Geography Research Paper No. 161; University of Chicago: Chicago, IL, USA, 1975; p. 266. [Google Scholar]
- Whitney, G.G.; Adams, S.D. Man as a maker of new plant communities. J. Appl. Ecol. 1980, 17, 431–448. [Google Scholar] [CrossRef]
- Hard, G. Vegetationsgeographie and Sozialökologie einer Stadt. Ein Vergleich zweier, Städtplane am Beispiel von Osnabrück. Geographische Zeitschrift 1985, 73, 125–144. [Google Scholar]
- Lehman, I.; Mathey, J.; Rößler, S.; Bräuer, A.; Goldberg, V. Urban vegetation structure types as a methodological approach for identifying ecosystem services—Application to the analysis of micro-climatic effects. Ecol. Indic. 2014, 42, 58–72. [Google Scholar] [CrossRef]
- Wolch, J.R.; Byrne, J.; Newell, J.P. Urban green space, public health and environmental justice: The challenge of making cities just green enough. Landsc. Urban Plan. 2014, 125, 234–244. [Google Scholar] [CrossRef]
- Tzoulas, K.; Korpela, K.; Venn, S.; Yli-Pelkonen, V.; Kazmiercak, A.; Niemelä, J.; James, P. Promoting ecosystem and human health in urban areas using Green infrastructure. A literature review. Landsc. Urban Plan. 2007, 81, 167–178. [Google Scholar] [CrossRef]
- Niemela, J. Ecology of urban green spaces: The way forward in answering major research questions. Landsc. Urban Plan. 2014, 125, 298–303. [Google Scholar] [CrossRef]
- Maas, J.; Verheij, R.A.; Groenewegen, P.P.; Vries, S.; Spreeuwenberg, P. Green space, urbanity, and health: How strong is the relation? J. Epidemiol. Community Health 2006, 60, 587–592. [Google Scholar] [CrossRef] [PubMed]
- TEEB—The Economics of Ecosystems and Biodiversity. TEEB Manual for Cities: Ecosystem Services in Urban Management; TEEB: Geneva, Switzerland, 2011; p. 43. Available online: www.teebweb.org (accessed on 20 February 2017).
- Cheng, C.; Li, B.; Ma, T. The application of very high resolution satellite image in urban vegetation cover investigation: A case study of Xiamen City. J. Geogr. Sci. 2003, 13, 265–270. [Google Scholar]
- Nichol, J.; Lee, C.M. Urban vegetation monitoring in Hong Kong using high resolution multispectral images. Int. J. Remote Sens. 2005, 26, 903–918. [Google Scholar] [CrossRef]
- Tigges, J.; Lakes, T.; Hostert, P. Urban vegetation classification: Benefits of multitemporal RapidEye satellite data. Remote Sens. Environ. 2013, 136, 66–75. [Google Scholar] [CrossRef]
- Rosina, K.; Kopecká, M. Mapping of urban green spaces using Sentinel-2A data: Methodical aspects. In Proceedings of the 6th International conference on cartography and GIS, Albena, Bulgaria, 13–17 June 2016. [Google Scholar]
- Ulrich, R.S. Natural versus urban sciences: Some psycho-physiological effects. Environ. Behav. 1981, 13, 523–556. [Google Scholar] [CrossRef]
- Kaplan, R. The analysis of perception via preference: A strategy for studying how the environment is experienced. Landsc. Urban Plan. 1983, 12, 161–176. [Google Scholar] [CrossRef]
- Gómez-Baggethun, E.; Gren, A.; Barton, D.N.; Langemeyer, J.; McPhearson, T.; O’Farrell, P.; Andersson, E.; Hamstead, Z.; Kremer, P. Urban Ecosystem Services. In Urbanization, Biodiversity and Ecosystem Services: Challenges and Opportunities: A Global Assessment; Elmqvist, T., Fragkias, M., Goodness, J., Güneralp, B., Marcotullio, P.J., McDonald, R.I., Parnell, S., Schewenius, M., Sendstad, M., Seto, K.C., et al., Eds.; Springer: Dordrecht, The Netherlands; Heidelberg, Germany; New York, NY, USA; London, UK, 2013; pp. 175–252. [Google Scholar]
- Moreno-Garcia, M.C. Intensity and form of the urban heat island in Barcelona. Int. J. Climatol. 1994, 14, 705–710. [Google Scholar] [CrossRef]
- Nowak, D.J.; Crane, D.E. Carbon storage and sequestration by urban trees in the USA. Environ. Pollut. 2002, 116, 381–389. [Google Scholar] [CrossRef]
- Wang, Y.; Bakker, F.; de Groot, R.; Wortche, H.; Leemans, R. Effects of urban trees on local outdoor microclimate: Synthesizing field measurements by numerical modelling. Urban Ecosyst. 2015, 18, 1305–1331. [Google Scholar] [CrossRef]
- Ulrich, R.S. View through a window may influence recovery from surgery. Science 1984, 224, 420–421. [Google Scholar] [CrossRef] [PubMed]
- Van den Berg, A.E.; van Winsum-Westra, M.; de Vries, S.; van Dillen, S.M.E. Allotment gardening and health: A comparative survey among allotment gardeners and their neighbors without an allotment. Environ. Health 2010, 9, 74. [Google Scholar] [CrossRef] [PubMed]
- Kiss, M.; Takács, A.; Pogacsas, R.; Gulyas, A. The role of ecosystem services in climate and air quality in urban areas: Evaluating carbon sequestration and air pollution removal by street and park trees in Szeged (Hungary). Morav. Geogr. Rep. 2015, 23, 36–46. [Google Scholar] [CrossRef]
- Vatseva, R.; Kopecká, M.; Otahel, J.; Rosina, K.; Kitev, A.; Genchev, S. Mapping urban green spaces based on remote sensing data: Case studies in Bulgaria and Slovakia. In Proceedings of the 6th International Conference on Cartography and GIS, Albena, Bulgaria, 13–17 June 2016. [Google Scholar]
- European Commission: Mapping Guide for a European Urban Atlas. Available online: https://cws-download.eea.europa.eu/local/ua2006/Urban_Atlas_2006_mapping_guide_v2_final.pdf (accessed on 19 February 2017).
- Hurbanek, P.; Atkinson, P.M.; Chockalingam, J.; Pazúr, R.; Rosina, K. Accuracy of Built-up Area Mapping in Europe at Varying Scales and Thresholds. In Proceedings of the Accuracy 2010: Ninth International Symposium on Spatial Accuracy Assessment in Natural Resources and Environmental Sciences, Leicester, UK, 20–23 July 2010; pp. 385–388. [Google Scholar]
- Pesaresi, M.; Corbane, C.; Julea, A.; Florczyk, A.J.; Syrris, V.; Soille, P. Assessment of the added-value of Sentinel-2 for detecting built-up areas. Remote Sens. 2016, 8, 299. [Google Scholar] [CrossRef]
- Elmqvist, T.; Fragkias, M.; Goodness, J.; Güneralp, B.; Marcotullio, P.J.; McDonald, R.I.; Parnell, S.; Schewenius, M.; Sendstad, M.; Seto, K.C.; et al. (Eds.) Urbanization, Biodiversity and Ecosystem Services: Challenges and Opportunities: A Global Assessment; Springer: Dordrecht, The Netherlands; Heidelberg, Germany; New York, NY, USA; London, UK, 2013; p. 755. [Google Scholar]
- Goddard, M.A.; Dougill, A.J.; Benton, T.G. Scaling up from gardens: Biodiversity conservation in urban environments. Trends Ecol. Evol. 2009, 25, 90–98. [Google Scholar] [CrossRef] [PubMed]
- Andersson, E.; Barthel, S.; Ahrné, K. Measuring social-ecological dynamics behind the generation of ecosystem services. Ecol. Appl. 2007, 17, 1267–1278. [Google Scholar] [CrossRef] [PubMed]
- Bolund, P.; Hunhammar, S. Ecosystem services in urban areas. Ecol. Econ. 1999, 29, 293–301. [Google Scholar] [CrossRef]
- Chiesura, A. The role of urban parks for the sustainable city. Landsc. Urban Plan. 2004, 68, 129–138. [Google Scholar] [CrossRef]
- Cornelis, J.; Hermy, M. Biodiversity relationships in urban and suburban parks in Flanders. Landsc. Urban Plan. 2004, 69, 385–401. [Google Scholar] [CrossRef]
- Kopecká, M.; Rosina, K. Identifikácia zmien urbanizovanej krajiny na báze satelitných dát s veľmi vysokým rozlíšením (VHR): Záujmové územie Trnava. Geografický časopis 2014, 66, 247–267. [Google Scholar]
- Fan, C.; Myint, S.W.; Zheng, B. Measuring the spatial arrangement of urban vegetation and its impacts on seasonal surface temperatures. Prog. Phys. Geogr. 2015, 39, 199–219. [Google Scholar] [CrossRef]
- Stewart, I.D.; Oke, T.R. Local Climate Zones for urban temperature studies. Bull. Am. Meteorol. Soc. 2012, 93, 1879–1900. [Google Scholar] [CrossRef]
- Sievers, U.; Zdunkowski, W. A microscale urban climate model. Contributions to atmospheric physics/Beiträge Zur Physik Der Atmosphäre 1986, 59, 13–40. [Google Scholar]
- Geletic, J.; Lehnert, M.; Dobrovolný, M. Modelled spatio-temporal variability of air temperature in an urban climate and its validation: A case study of Brno, Czech Republic. Hung. Geogr. Bull. 2016, 65, 169–180. [Google Scholar] [CrossRef]


| Class Name | Water | Impervious | Tree Cover | Non-Woody Vegetation | Total | U Accuracy (%) | P Accuracy (%) |
|---|---|---|---|---|---|---|---|
| Water | 20 | 0 | 0 | 0 | 20 | 100.00 | 100.00 |
| Bratislava | 10 | 0 | 0 | 0 | 10 | 100.00 | 100.00 |
| Trnava | 0 | 0 | 0 | 0 | 0 | - | - |
| Žilina | 10 | 0 | 0 | 0 | 10 | 100.00 | 100.00 |
| Impervious | 0 | 107 | 1 | 5 | 113 | 94.69 | 94.69 |
| Bratislava | 0 | 51 | 0 | 1 | 52 | 98.08 | 96.23 |
| Trnava | 0 | 33 | 1 | 2 | 36 | 91.67 | 94.29 |
| Žilina | 0 | 23 | 0 | 2 | 25 | 92.00 | 92.00 |
| Tree cover | 0 | 2 | 39 | 4 | 45 | 86.67 | 84.78 |
| Bratislava | 0 | 2 | 19 | 4 | 25 | 76.00 | 95.00 |
| Trnava | 0 | 0 | 10 | 0 | 10 | 100.00 | 83.33 |
| Žilina | 0 | 0 | 10 | 0 | 10 | 100.00 | 71.43 |
| Non-woody vegetation | 0 | 4 | 6 | 51 | 61 | 83.61 | 85.00 |
| Bratislava | 0 | 0 | 1 | 20 | 21 | 95.24 | 80.00 |
| Trnava | 0 | 2 | 1 | 14 | 17 | 82.35 | 87.50 |
| Žilina | 0 | 2 | 4 | 17 | 23 | 73.91 | 89.47 |
| Total | 20 | 113 | 46 | 60 | 239 | ||
| Bratislava | 10 | 53 | 20 | 25 | 108 | ||
| Trnava | 0 | 35 | 12 | 16 | 63 | ||
| Žilina | 10 | 25 | 14 | 19 | 68 | ||
| Overall classification Accuracy (%): | 90.79 | ||||||
| Overall Kappa coefficient: | 0.862 | ||||||
| No. | UGS Class | Description | Example | Ecosystem Services |
|---|---|---|---|---|
| 1. | Urban forest/Uncultivated park | Areas characterised by more than 50% woody vegetation with no signs of cultivation and without paved roads/paths |  | Habitat |
| 2. | Cultivated park | Areas characterised by more than 50% woody vegetation with paved paths and scattered lawns |  | Cultural |
| 3. | Cemetery | Areas of cemeteries with dominant vegetation |  | Cultural |
| 4. | Urban public garden | Areas characterised by the regular shape of lawns, flowerbeds, shrubs, paths and scattered trees |  | Cultural |
| 5. | Stream bank/lake shore vegetation | Green areas adjacent to ponds, lakes, rivers, or canals |  | Habitat/Regulating |
| 6. | Urban greenery in apartment housing areas | Public greenery in residential zones between multi-flat houses and/or small commercial buildings | 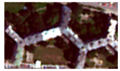 | Regulating/Cultural |
| 7. | Urban greenery in family housing areas | Greenery in residential zones between family houses, mostly comprising private horticultural gardens | 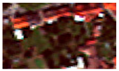 | Provisioning/Cultural |
| 8. | Urban greenery in public facilities | Greenery in compact areas with particular public services, like hospitals, universities, school campus, ZOO etc. Sports facilities are not included in this class | 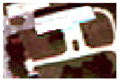 | Cultural |
| 9. | Greenery in sports facilities | Green areas used for sports and leisure mainly covered by grass, such as football field, golf course, playground, and horse race circuit | 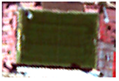 | Cultural |
| 10. | Allotments | Area with small parcels of annual crops, pastures, fallow land and/or permanent crops, with scattered garden cabins |  | Provisioning/ Cultural |
| 11. | Cropland/pastures | Agricultural areas with signs of cultivation (e.g., tracks from ploughing or tractor use). This class contains both cropped areas and areas with grass in rotation, as well as orchards and vineyards | 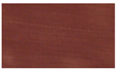 | Provisioning |
| 12. | Railway and roadside greenery | Verge with grass or other vegetation accompanying a railway, road or motorway | 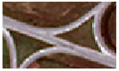 | Regulating |
| 13. | Green areas in industrial units | Areas covered by vegetation in factories with industrial production, storage facilities, logistic centres, etc. | 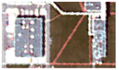 | Regulating |
| 14. | Airport greenery | Grass areas of airports associated with runways | 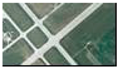 | Regulating |
| 15. | Ruderal vegetation | Areas with grass, herbaceous, shrub and/or scattered woody vegetation with no signs of recent cultivation. Usually heterogeneous in texture and colour. Fallow land and brownfields can also be part of this class |  | Regulating |
| UGS Class | Polygon Count | Class Area (Ha) | Class Abundance (%) | ||||||
|---|---|---|---|---|---|---|---|---|---|
| Bratislava | Trnava | Žilina | Bratislava | Trnava | Žilina | Bratislava | Trnava | Žilina | |
| 1 | 36 | 6 | 13 | 469.55 | 29.71 | 67.06 | 9.2 | 4.0 | 6.1 |
| 2 | 39 | 19 | 3 | 74.63 | 43.94 | 9.82 | 1.5 | 6.0 | 0.9 |
| 3 | 10 | 7 | 12 | 58.57 | 6.51 | 11.97 | 1.1 | 0.9 | 1.1 |
| 4 | 7 | 3 | 2 | 12.43 | 2.54 | 1.22 | 0.2 | 0.3 | 0.1 |
| 5 | 64 | 5 | 29 | 149.54 | 8.29 | 59.87 | 2.9 | 1.1 | 5.4 |
| 6 | 823 | 151 | 112 | 679.34 | 73.96 | 139.27 | 13.2 | 10.0 | 12.6 |
| 7 | 589 | 215 | 120 | 1035.07 | 130.67 | 466.27 | 20.2 | 17.7 | 42.2 |
| 8 | 292 | 99 | 90 | 358.40 | 48.40 | 78.54 | 7.0 | 6.6 | 7.1 |
| 9 | 67 | 16 | 11 | 136.92 | 30.65 | 15.61 | 2.7 | 4.2 | 1.4 |
| 10 | 53 | 5 | 15 | 434.44 | 6.78 | 71.19 | 8.5 | 0.9 | 6.4 |
| 11 | 58 | 30 | 5 | 446.98 | 64.25 | 11.49 | 8.7 | 8.7 | 1.0 |
| 12 | 305 | 64 | 63 | 285.94 | 45.57 | 86.99 | 5.6 | 6.2 | 7.9 |
| 13 | 442 | 129 | 97 | 454.23 | 164.48 | 35.15 | 8.9 | 22.3 | 3.2 |
| 14 | 27 | 0 | 0 | 287.82 | 0.00 | 0.00 | 5.6 | 0.0 | 0.0 |
| 15 | 97 | 47 | 41 | 243.48 | 82.06 | 51.37 | 4.7 | 11.1 | 4.6 |
| Total | 2909 | 796 | 613 | 5127.34 | 737.82 | 1105.82 | 100.0 | 100.0 | 100.0 |
| UGS Class | Tree Cover Percentage (%) | Average Patch Size (Ha) | ||||
|---|---|---|---|---|---|---|
| Bratislava | Trnava | Žilina | Bratislava | Trnava | Žilina | |
| 1 | 92.9 | 74.6 | 65.7 | 13.04 | 4.95 | 5.16 |
| 2 | 84.9 | 59.0 | 49.9 | 1.91 | 2.31 | 3.27 |
| 3 | 88.4 | 58.9 | 19.0 | 5.86 | 0.93 | 1.00 |
| 4 | 71.5 | 42.4 | 0.0 | 1.78 | 0.85 | 0.61 |
| 5 | 81.7 | 22.4 | 8.7 | 2.34 | 1.66 | 2.06 |
| 6 | 67.2 | 38.0 | 2.4 | 0.83 | 0.49 | 1.24 |
| 7 | 57.5 | 19.3 | 3.2 | 1.76 | 0.61 | 3.89 |
| 8 | 57.5 | 34.4 | 2.9 | 1.23 | 0.49 | 0.87 |
| 9 | 33.4 | 7.9 | 2.4 | 2.04 | 1.92 | 1.42 |
| 10 | 51.4 | 2.7 | 23.3 | 8.20 | 1.36 | 4.75 |
| 11 | 13.0 | 3.4 | 1.6 | 7.71 | 2.14 | 2.30 |
| 12 | 66.0 | 29.2 | 1.9 | 0.94 | 0.71 | 1.38 |
| 13 | 36.7 | 8.0 | 0.3 | 1.03 | 1.28 | 0.36 |
| 14 | 0.5 | 0.0 | 0.0 | 10.66 | 0.00 | 0.00 |
| 15 | 43.0 | 8.7 | 8.4 | 2.51 | 1.75 | 1.25 |
| Total | 53.2 | 22.1 | 9.0 | 1.76 | 0.93 | 1.80 |
© 2017 by the authors. Licensee MDPI, Basel, Switzerland. This article is an open access article distributed under the terms and conditions of the Creative Commons Attribution (CC BY) license (http://creativecommons.org/licenses/by/4.0/).
Share and Cite
Kopecká, M.; Szatmári, D.; Rosina, K. Analysis of Urban Green Spaces Based on Sentinel-2A: Case Studies from Slovakia. Land 2017, 6, 25. https://doi.org/10.3390/land6020025
Kopecká M, Szatmári D, Rosina K. Analysis of Urban Green Spaces Based on Sentinel-2A: Case Studies from Slovakia. Land. 2017; 6(2):25. https://doi.org/10.3390/land6020025
Chicago/Turabian StyleKopecká, Monika, Daniel Szatmári, and Konštantín Rosina. 2017. "Analysis of Urban Green Spaces Based on Sentinel-2A: Case Studies from Slovakia" Land 6, no. 2: 25. https://doi.org/10.3390/land6020025