
Forest Cover Changes in Lao Tropical Forests: Physical and Socio-Economic Factors are the Most Important Drivers


1
Faculty of Forest Science, The National University of Laos, Vientiane Capital 0100, Lao People’s Democratic Republic
2
School of Biological Sciences, The University of Adelaide, Adelaide, SA 5005, Australia
*
Author to whom correspondence should be addressed.
Land 2017, 6(2), 23; https://doi.org/10.3390/land6020023
Submission received: 9 January 2017
/
Revised: 11 March 2017
/
Accepted: 24 March 2017
/
Published: 28 March 2017
Abstract
:Lao People’s Democratic Republic (PDR) has been experiencing significant forest depletion since the 1980s, but there is little evidence to demonstrate the major causes and underlying drivers for the forest cover changes. In this study, we investigated the relationship between forest cover decrease and increase in the south of Lao PDR between 2006 and 2012 and selected physical and socio-economic factors. We used a map of forest cover changes derived from analysis of Landsat ETM+ imagery in 2006 and 2012, together with socio-economic and physical environmental data from the national authorities. The study area has experienced noticeable forest cover changes: both forest decreases and increases were unevenly distributed throughout the region. Logistic regression models were used to test relationships between forest cover decrease or increase and selected physical and socio-economic factors. Forest clearance was associated strongly with elevation, distance to main roads and shifting cultivation practices. Meanwhile, forest cover increase was more likely to correlate with rubber plantations. Native forest and shifting cultivation lands were vulnerable to being converted into rubber plantations. This research provides much-needed information on which to base forestry policy and decision making to minimize and prevent current deforestation, as well as manage potential risks in the future.
1. Introduction
Lao People’s Democratic Republic (PDR) was once one of the countries with the richest biodiversity in Southeast Asia. However, the country has undergone profound forest and land cover changes over the last few decades. Deforestation has become a crucial issue in the country. The deforestation rate has increased alarmingly since the 1980s (Robichaud et al., 2009 [1]). Forests covered nearly 50% of the country in 1982, but dropped to 41% in 2002, before gradually decreasing to 40% of the total land area by 2010 (Department of Forestry 2011 [2]; Vongsiharath 2011 [3]). This 40% of forest cover can be mixed with secondary forests, plantations and bamboo, as indicated by a rapid assessment in 2010 (Forest Carbon Partnership Facility 2014 [4]), and the share of primary forest within this estimation is unclear. To address this forest decline, the government of Laos has set an ambitious target to increase forest cover up to 70% by 2020 through afforestation, reforestation and stabilization of shifting cultivation (Ministry of Agriculture and Forestry 2005 [5]). Meanwhile, foreign direct investment in forestry and agriculture, along with land leases and concessions, has been promoted (The National Land Management Authority 2004 [6]). Despite this, the country has recently been experiencing forest and land use transformation to plantations, resulting in controversies about the decrease of native forests in the area. Phimmavong et al. (2009) [7] observed that between 1990 and 2007 the area of plantations, especially rubber plantations, increased dramatically from 1000 ha to over 200,000 ha. In addition, shifting cultivation practices or mountainous agriculture are considered as a critical environmental issue for forest resources. Approximately 6.5 million ha of forest were replaced by shifting cultivation during the 1990s (Messerli et al., 2009 [8]; Sovu et al., 2009 [9]).
There is growing concern over the depletion of the area of tropical forests in Laos. Its forests have been declining at an alarming rate, although the causes or factors associated with this depletion are poorly understood and the responses of tropical forests to environmental changes remain unknown. Both socio-economic and physical factors have important influences on forest depletion. Lao PDR has made rapid progress in its national socio-economic development (Asian Development Bank 2015 [10]; Organisation for Economic Cooperation and Development 2013 [11]); however, the relationship between this development and forest cover changes in the country is unclear. This has increased the nation’s efforts to explain the causes of deforestation and conversion of forests to other land uses.
Understanding these spatial relationships and complexities can offer insight into the effective maintenance of forest resources. Identifying driving forces affecting forest cover changes is essential, as this would allow policy and decision makers to understand ongoing land use management and processes of deforestation, as well as their effects on the environment (Meyfroidt et al., 2013 [12]; Vu et al., 2014b [13]). Understanding the links between socio-economic and physical factors and forest cover changes at a national level is important to inform appropriately targeted policies, plans and strategies for combating deforestation Vu et al. (2014a) [14]. This research will provide key information on which to base forestry policy and decision making in Lao PDR to minimize and prevent deforestation, as well as manage potential risks in the future.
Worldwide, several studies have been undertaken to identify the drivers or associated factors of forest cover changes (Bhattarai et al., 2009 [15]; Casse et al., 2004 [16]; Pineda et al., 2010 [17]; Ryan et al., 2014 [18]; Scullion et al., 2014 [19]; Vu et al., 2014b [13]; Webb et al., 2014 [20]), and are useful in developing predictive deforestation models and suggesting implications for national forest and land management policy. The key factors in forest cover changes are often physical conditions, such as elevation and slope, as illustrated by studies by Mon et al. (2012) [21] and Bhattarai et al. (2009) [15]. In addition, socio-economic factors at local and national levels can also influence patterns of tropical deforestation. For example, it was found that deforestation in China was associated with infrastructural parameters such as the location of rivers, roads and settlements (Gao and Liu 2012 [22]; Du et al., 2014 [23]; Mon et al., 2012 [21]).
In Lao PDR, as in many developing countries, identifying and understanding the primary causes of these changes remains challenging. There is little evidence to understand the causes and underlying drivers of forest cover changes. Detailed and in-depth studies are still rare and the issue needs to be urgently investigated. Therefore, the primary objective of this research was to investigate the relationship between the changes in the spatial patterns of forest cover and physical and socio-economic factors that have taken place in the south of the Lao PDR. We investigated this relationship by analysing forest cover changes mapped from satellite imagery in relation to socio-economic and physical data from the Lao government. The south of Lao PDR was selected as a study area due to its recent intensive land cover change and rapid foreign investment and development. The study is an important step in understanding the relationship between socio-economic and physical characteristics and forest cover changes, particularly in Laos, and to illustrate the complex interaction between the human and natural environments at national level. The study provides better understandings of socio-economic and physical drivers of forest cover change at local and regional scales and demonstrates an approach which may be scaled up to national level.
2. Materials and Methods
2.1. Study Site
The study region is located in the south of Lao PDR, covering large areas of three provinces: Savannakhet, Salavan and Champasak (Figure 1). The area is approximately 23,500 km2, including parts of the Annamite mountains (known as Xai Phou Luang) and borders Vietnam in the east. The study area covers nearly 10% of the country. The altitude within the area ranges from 20–1700 m above sea level, with an average elevation of 300 m.
The biggest river in the area is the Mekong River, which serves as a significant transport channel and essential food source for the Lao people. In addition, there are several other important rivers in this region including Xe Bang Fai, Xe Nou and Xe Bang Hieng in Savannakhet territory. The Se Don River flows through the Salavan province and eventually joins the Mekong River at Pakse, Champasak province.
The main road is Route No. 13, which connects the north to the south. There are also four important roads, including Routes 9, 15, 16 and 20, which cross the region from west to east. These connect within the provinces and extend to the Vietnam border. A large population is settled closely along the roads. There are a total of 1363 villages within the study area.
The study area covers four national protected areas (NPAs): Dong Phou Vieng, Xe Bang Nuan (located in Savannakhet and straddling the border with Salavan Province), Phou Xieng Thong (located between Salavan and Champasak), and Dong Houa Sao (situated in Champasak). These NPAs are rich in forest and wildlife species. The forests located in these areas are evergreen, dry dipterocarp and mixed deciduous and are important natural habitats for wildlife. However, much of the forest within the study area has been the target of heavy logging since the 1980s. After the investment policy on agriculture and forestry was promoted in 2004, the conversion of native forests to other land uses has become controversial, especially in the Southern part of Laos. In addition, this region is thought to have the most extensive illegal timber smuggling, with much illegal trade crossing the border between Laos and Vietnam.
2.2. Forest Cover Change between 2006 and 2012
We used a map of forest cover changes between 2006 and 2012 presented in Phompila et al. (2014) [24]. This forest cover change map covered approximately 23,500 km2 across 24 districts of three provinces: Savannakhet, Salavan and Champasak. The map was derived from Landsat ETM+ images in 2006 and 2012 using Principal Component Analysis (PCA) and was evaluated using high-resolution Google EarthTM images from the same years. The map identified areas of forest cover decrease and increase as well as areas where forest cover appeared unchanged. One principal component was interpreted as showing forest cover change between the two dates, and was classified into three classes (forest remains stable, forest increase and forest loss) using a standard threshold. The Landsat forest change classes were compared with a reference change map derived from digitization of vegetation cover classes in Google Earth images (2006 and 2012), and showed an overall accuracy of 87%, Kappa = 0.8 (Phompila et al., 2014 [24]).
2.3. Physical and Socio-Economic Factors
We investigated a total of eight physical and socio-economic variables (Table 1), influenced by the availability of relevant data in our study area. Information on elevation and slope can provide an indication of access to forest and land use. Vu et al. (2014a) [14] suggested that forest areas located on steep slopes or high elevations can create difficulties in access for people utilizing forest resources or transforming land into agricultural areas. About 80% of Lao people live in rural areas and depend on forest resources. The shifting cultivation is a major source of food for farmers in upland areas. The cutting down and the burning of trees and grasses and basic slope cultivation without soil conservation practices have resulted in land degradation. This leads to more disturbances to native forests or further to land-use pattern changes. Thus, we investigated whether elevation and slope influence population pressure on the forest.
Another key element to facilitate access to the forest resources is improved infrastructure development, such as road networks and river routes. Many studies have found that these factors can increase pressure on forest and land use (Du et al., 2014 [23]; Gao and Liu 2012 [22]). Therefore, we examined whether distances from main roads and rivers influence forest cover changes. The roads were limited to well-developed roads main only, such as paved roads which connect between provinces, districts or towns, and excluded unpaved roads or forest trails.
Conservation forest and protected forest areas are rich in biodiversity. Conservation forests are forests classified for the purposes of conserving nature, preserving plant and animal species, forest ecosystems and other valuable sites of natural, historical, cultural, tourism, environmental, educational and scientific research experiments. On the other hand, protected forests are forests with important ecosystem functions such as the protection of water resources, river banks, soil quality, natural disaster and preventing soil erosion, as well as strategic areas for national defense. The government of Laos has ambitious goals for preserving its forests, but achievements are negligible due to a lack of human and financial resources. Meanwhile, national economic development throughout land concessions, timber extraction, and large-scale mining and hydropower developments are priorities. Thus, achieving economic development growth and sustainable uses of forest resources is challenging. We assumed that the abandonment of forest resources without a strong protection mechanism could increase the risk of illegal forest timber exploitation. It is essential to examine whether this is a factor associated with deforestation. The location of villages is also important for assessing how people achieve access to forest resources (Bhattarai et al., 2009 [15]; Du et al., 2014 [23]; Getahun et al., 2013 [25]; Mon et al., 2012 [21]). Closer distances to the forest resources may increase the rate of deforestation. Thus, we hypothesized that the village locations would have some degree of correlation with a decrease in forest cover.
2.4. Elevation and Slope
Elevation data was obtained from the Global Digital Elevation Model (GDEM), derived from Advanced Spaceborne Thermal Emission and Reflection Radiometer (ASTER) images. This data is under the administration of the Ministry of Economy, Trade, and Industry (METI) Earth Remote Sensing Data Analysis Center (ERSDAC) in Japan and the National Aeronautics and Space Administration (NASA) in America. The data was downloaded from the NASA site in a Geo-referenced Tagged Image File Format (GeoTIFF) (http://earthexplorer.usgs.gov/). Slope data was generated from this GDEM data using the Spatial Analyst tool in ArcGIS 10.2 software (ArcGIS Desktop Help 10.2 Geostatistical Analyst, Environmental Systems Research Institute (ESRI), Redlands, CA, USA, 2014).
2.5. Distance to Main Roads, Rivers, Protected Areas and Villages
The road and river data was collected from the Research Division, Faculty of Forestry Sciences (FFS) at the National University of Laos. The locations of villages were derived from population census data, distributed by the Lao National Statistic Centre. The population survey was conducted in 2011/2012 by the Department of Forestry (DOF), Ministry of Agriculture and Forestry. Villages were categorized into three groups: villages without rubber plantations or shifting cultivation, villages with rubber plantations and villages with shifting cultivation. A protected area map was also obtained from the DOF. The distance of forest areas to main roads, rivers, protected areas and villages were measured using the “Near” tool, based on Euclidean distance in ArcGIS10.2 from four different GIS layers derived from this data: main roads, rivers, protected areas and village locations.
2.6. Sampling Procedure
We established a random sampling system within the study area using the Random Point tools in ArcGIS 10.2.1, producing a total of 5000 sample points. To ensure a better spatial distribution and minimize the effects of spatial autocorrelation, a minimum distance of 1 km between points was chosen as recommended by Linkie et al. (2004) [26], Mon et al. (2012) [21] and Vu et al. (2014a) [14]. Ultimately, 4998 sample points were used due to missing values from the elevation dataset. The attributes of both dependent and independent variables were extracted for each random sample and then analyzed using R scripts and packages in RStudio software (Version 1.0.136, Integrated Development for R. RStudio, Inc., Boston, MA, USA, 2016, URL http://www.rstudio.com).
2.7. Data Analysis
We applied logistic regression models to investigate the relationship between forest cover change and the chosen physical and socio-economic factors. Logistic regression allowed us to evaluate the probability of membership in one of the groups, based on the combination of the independent variables.
The logistic regression model assumes that the variables are normally distributed, so we tested for normality of our sampling data. Variable data was transformed by log10 and then tested for normality through a chi-squared test using the chisq.test () function in R.
Strong collinearity between the independent variables is undesirable when applying a logistic regression model as it can cause unstable estimates and inaccurate variances which affect the confidence intervals and hypothesis tests in statistical models (Hosmer and Lemeshow 2000 [27]; Midi et al., 2010 [28]; Mon et al., 2012 [21]; Vu et al., 2014a [14]). Thus, the collinearity between each independent variable was tested with Pearson’s correlation coefficients using the cor () function in the R software. It has been suggested that the level of collinearity of the independent variables must be below an acceptable threshold of 0.7. Results of the paired independent variable correlation tests are shown in Table 2. In our case, none of our independent or explanatory variables exceeded this collinearity level. Only three pairs of variables showed a moderate degree of collinearity: elevation and distances to villages without rubber plantations or shifting cultivation (r = 0.41), distance to main roads and distance to villages with shifting cultivation (r = 0.40), and elevation and distance to rivers (r = 0.32). Thus, all of the variables were considered to be acceptable for use in the logistic regression analysis.
Forest increase and decrease between 2006 and 2012 was used as two binary dependent variables, each expressed as two categories: change and no change. We used two separate regression models because we expected different factors contributing to forest clearance or increase. A total of seven socio-economic variables were used in the analysis including elevation, slope, distance to main roads, distance to rivers, distance to villages without rubber plantations or shifting cultivation, distance to villages with rubber plantations and distance to villages with shifting cultivation. The distance to protected areas variable was excluded due to its non-normal distribution. We noted if there were any outliers in our data because outliers can create statistical problems in logistic regression models (Mon et al., 2012 [21]). No outliers existed in our data. We examined the levels of statistical confidence in each independent variable in the results. We also used the receiver operating characteristic (ROC) statistics and the Hosmer and Lemeshow test to measure the goodness-of-fit of the logistic regression model, as suggested by Mon et al. (2012) [21] and Vu et al. (2014a) [14]. Our analysis was conducted using statistic R software.
3. Results
3.1. Distribution of Changes in Forest Cover between 2006 and 2012
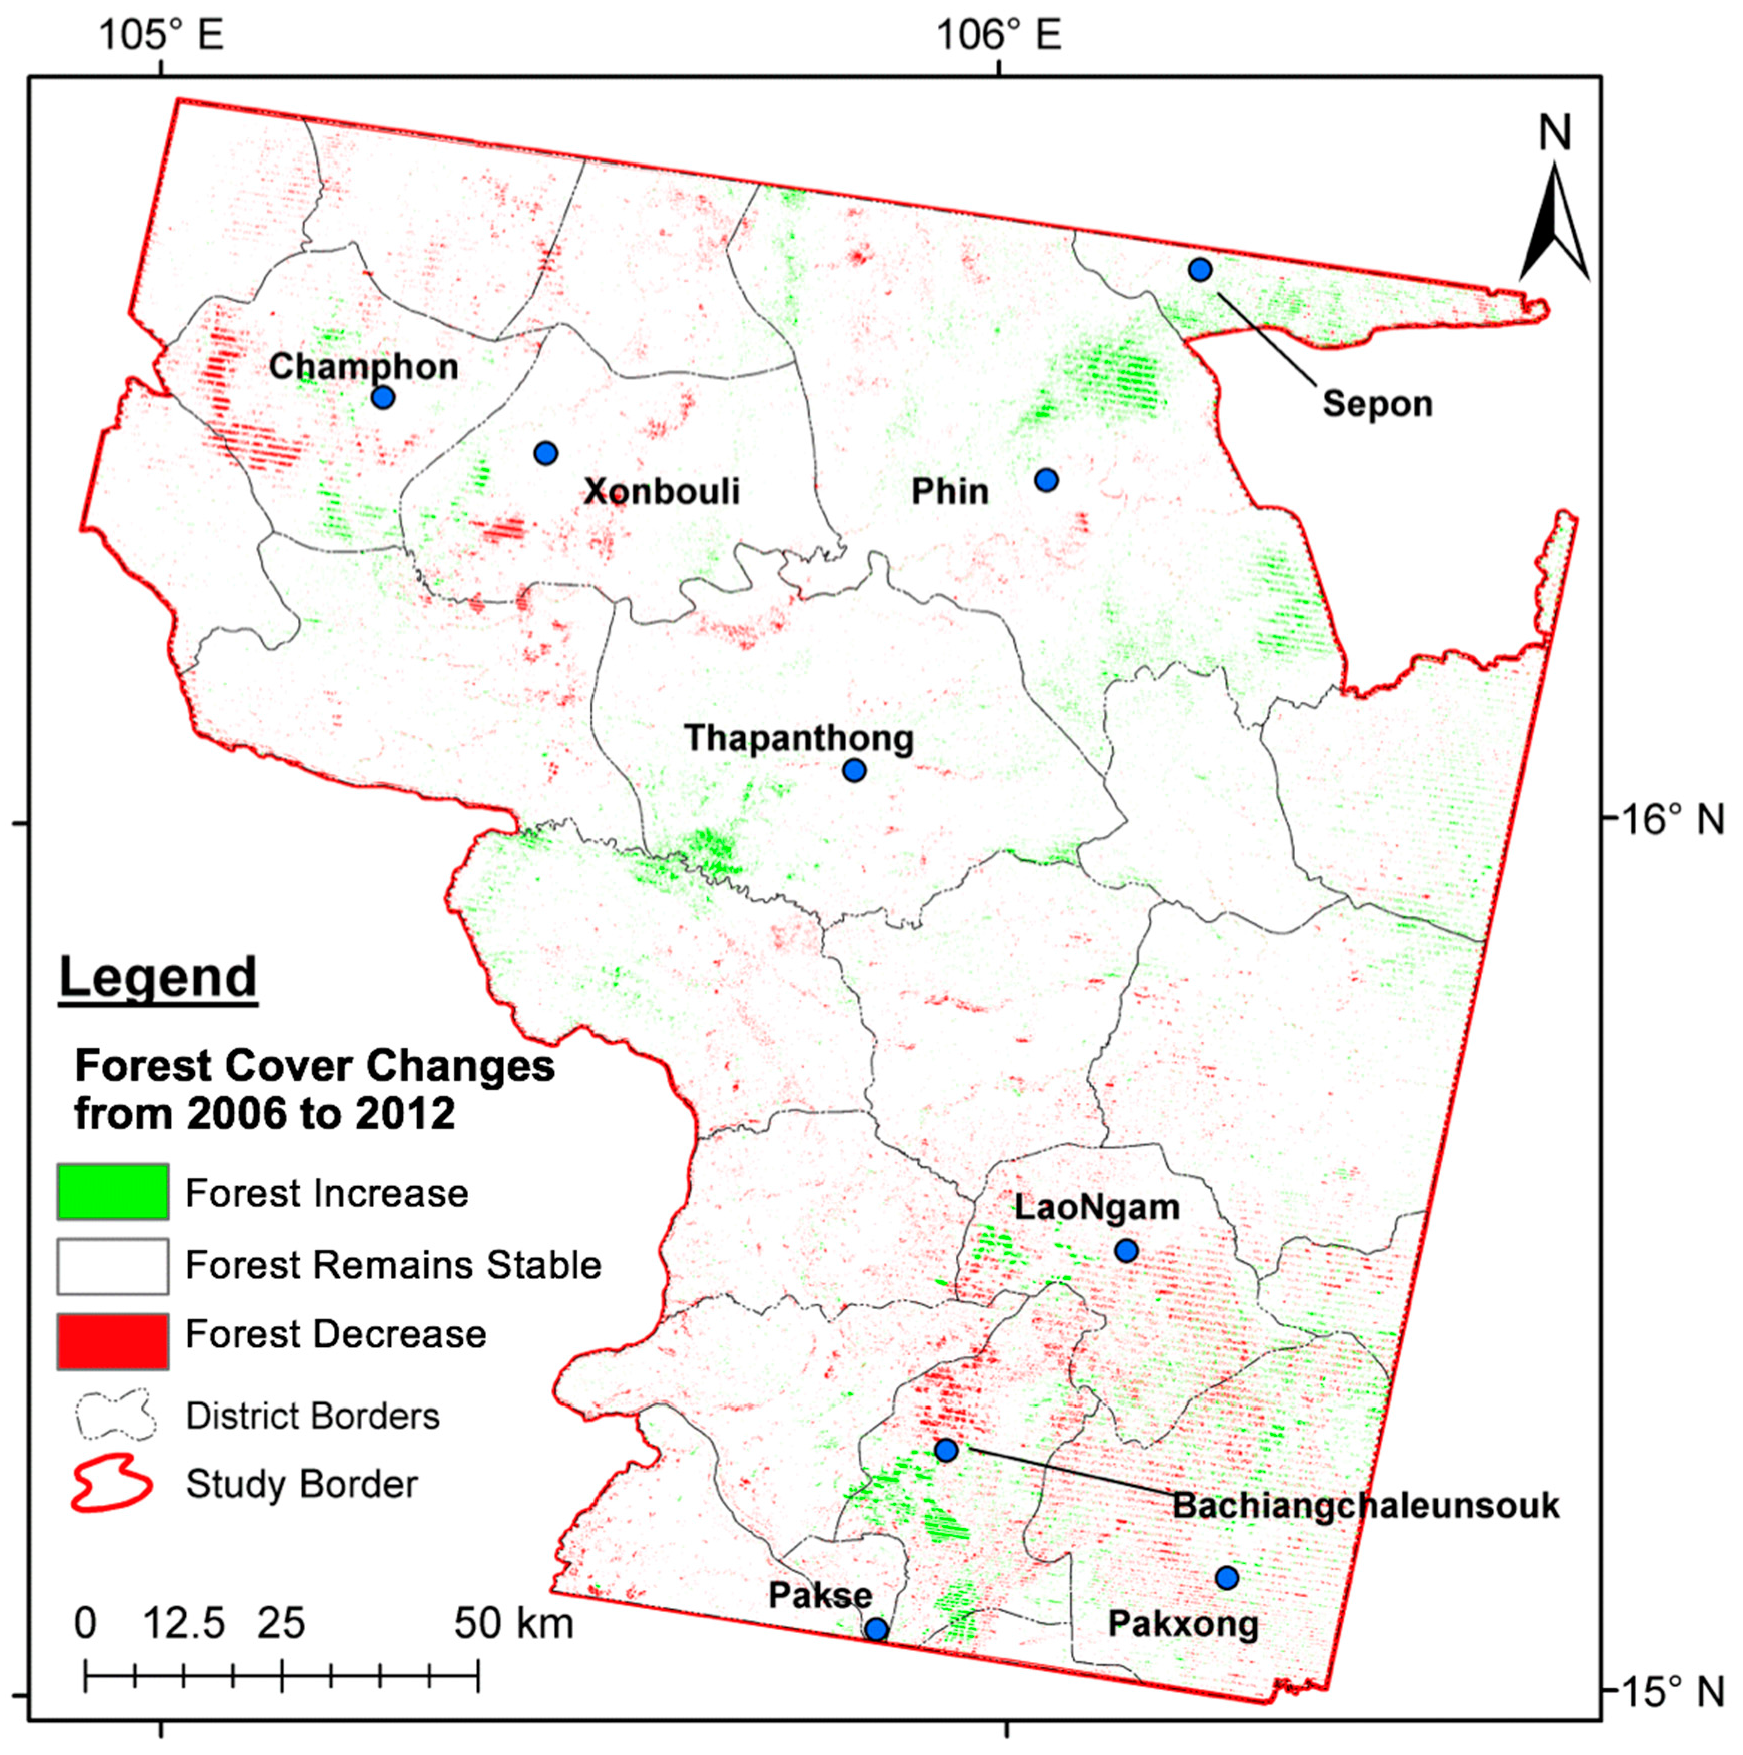
Figure 2 is a map from the previous study by Phompila et al. (2014) [24] that shows forest cover changes between 2006 and 2012 within the study area. Overall, it appears that a large proportion of the forest cover areas remained stable between 2006 and 2012 (94.6%). However, forest cover in the study area decreased by 2.8% and increased by 2.6%. Forest cover increase is found in all three provinces: Savanakhet, Salavan and Champasak. The contribution to this increase in forest cover is from plantations: mostly rubber. A large proportion of mixed wooded/cleared land was transferred to plantations. Noticeable areas of increase are located in Phin, Sepon, Thapanthong and Bachiangchaleunsouk districts. This increase is close to the national protected areas (NPA): Dong Houa Soa and inside the Dong Phou Vieng and Xe Bang Nouan NPA. There are about 37 villages located inside the NPAs that contributed to the increase in forest cover, including 21 shifting cultivation villages. A majority of shifting cultivation areas in these two NPAs was transformed to rubber plantations, resulting in an increase of forest cover.
However, forest cover decrease is notable in Champasak and Savanakhet provinces. The areas of most significant decrease appear in LaoNgam district, Salavan province andBachiangchaleunsouk, and Pakxong district near Pakse city centre and the north of Champasak province, as well as in Champhon and Xonbouli district, Savanakhet province.
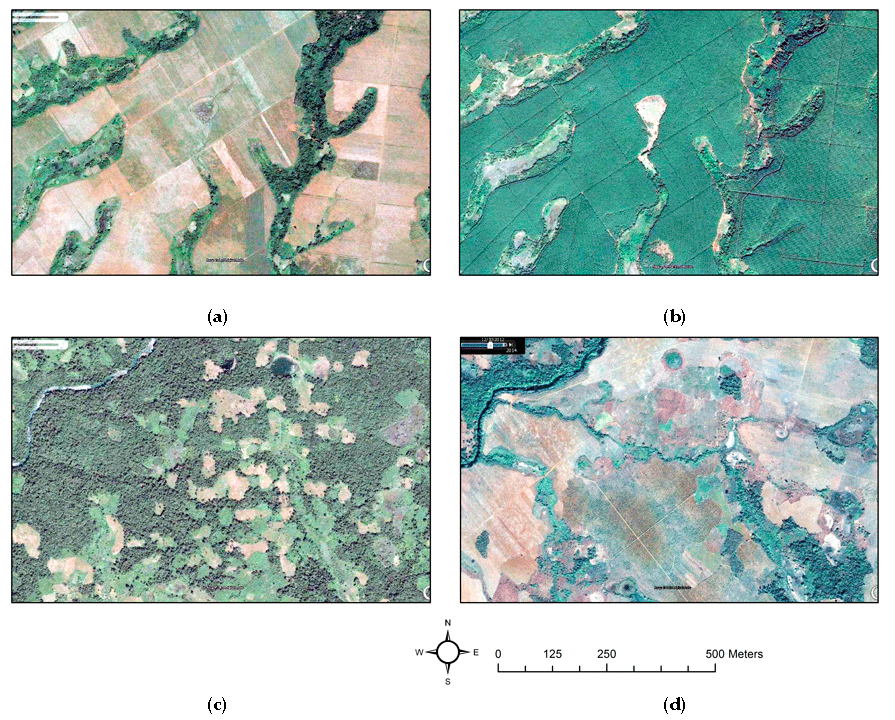
Using high resolution Google images in 2006 and 2012, we found that forest increase appears to have resulted largely from the establishment of plantations, especially rubber: rubber plantations were recognized by their regular tree canopy patterns and spacing. Forest removal occurred around 2006 and was replaced by rubber and regrowth later (Figure 3a–d). Meanwhile, forest cover decrease was likely to have been derived from forest transformation into shifting cultivation lands or to rubber plantations.
3.2. Factors Associated with Forest Cover Changes
Three physical and socio-economic variables have significant effects on the spatial extent of forest cover decrease, including elevation, distance to main roads, and distance to villages with shifting cultivation (Table 3). These were the most important predictors of forest cover decrease between 2006 and 2012. The logistic regression model showed that elevation was most significantly correlated with the likelihood of forest cover decrease in the study area (p < 0.01; and highest Wald value, Table 3). This positive correlation revealed that land at higher elevations was more likely to decrease in forest cover, especially in the south of the study area. The forest cover decrease was found to correlate negatively with distances to main roads (p < 0.05): there was more disturbance to native forests closer to roads. In addition, the distances to villages with shifting cultivation was the third strongest influential factor for forest depletion (p < 0.05). Forests located at a closer distance to these villages were more likely to be disturbed. However, other variables were not significant in the logistic regression analysis, including slope, distance to rivers, distance to villages without rubber plantations or shifting cultivation, and distance to villages with rubber plantations.
Both the Hosmer and Lemeshow and ROC tests indicate the results of the model are acceptable. The goodness-of-fit test statistics are acceptable, according to the criteria of Mon et al. (2012) [21] and Vu et al. (2014a) [14], whilst the Hosmer and Lemeshow test provides a non–significant value (p = 0.589). The area under the ROC curve (theoretically ranging from 0.5 to 1.0) was used as the basis for evaluating the model’s performance (Vu et al., 2014a [14]). In our case, the area values of 0.848 (p > 0.001) demonstrate excellent performance.
The logistic regression model indicated that the probability of forest cover increase in the study area from 2006 to 2012 was significantly correlated to distances to villages with rubber plantations and distances to villages with shifting cultivation variables used in the regression model (p < 0.05 and p < 0.1, respectively; Table 4). We found that these variables were negatively associated with an increase in forest cover. A closer distance to these villages was related to a greater increase in forest cover. However, in our analysis, the following factors were not significantly associated with forest cover increase: elevation (p = 0.369), slope (p = 0.929), distance to main roads (p = 0.369), distance to rivers (p = 0.929), and distance to villages without rubber plantations or shifting cultivation (p = 0.929).
The Wald statistics also indicated that distances to villages with rubber plantations was the most important variable (highest negative value) for forest increase in the study area during 2006–2012, followed by distances to villages with shifting cultivation. Similar to the logistic regression model for deforestation, the value of the Hosmer and Lemeshow test (p = 0.50) and Area under ROC = 0.817 (p < 0.001) indicated that the model fit was acceptable.
4. Discussion
The results indicate that the areas of forest cover decrease were associated with higher elevations, shifting cultivation and main roads within our study area. The flat areas had less deforestation whilst high elevation areas were more likely to suffer higher deforestation. Although there are a greater number of human settlements on the lower land when compared with those on high elevation mountainous areas, the impact of human activities was mainly found in high elevation areas. This finding differs from a number of studies, which suggest that the likelihood of forest cover decrease is greater at a low elevation in other worldwide countries (Fox et al., 2000 [30]; Gao and Liu 2012 [22]; Mas et al., 2004 [31]; Mon et al., 2012 [21]). In those cases, expansion of the cultivated land was associated with the distance to towns in low elevation areas which provide better accessibility and ease of access to markets. However, our analysis suggests that forest clearance in mountainous areas in southern Lao PDR was associated with shifting cultivation. The majority of shifting cultivation land is located in mountainous areas, whereas permanent agricultural lands are largely found in lowland areas. In these Lao low land areas, infrastructure is better developed and little forest remains to be cleared. Slash-and-burn agriculture or shifting cultivations are widely practiced and important food production systems for the minority ethnic groups in Lao upper lands (Inoue et al., 2010 [32]; Shi 2008 [33]; Sovu et al., 2009 [9]). Shifting cultivators rely completely on the availability of the upper farming land and forests for their income and self-subsistence due to their poverty. Thus, we infer that population increases can simultaneously lead to an increase in forest and land use, which, in turn, leads to expansion in forest clearance. The shifting cultivation practice is commonly recognized as a serious threat to biodiversity globally (Geist and Lambin 2002 [34]; Li et al., 2014 [35]; Rasul and Thapa 2003 [36]). In the case of Lao PDR, this practice is associated with land clearance, tree cutting and use of fire, and has been viewed as a direct cause of deforestation. This destructive farming practice tended to cause serious land degradation, soil erosion and loss of biodiversity (FAO 2015 [37]; Higashi 2015 [38]).
Our study suggests that roads are also a very important factor associated with forest cover decrease during 2006–2012 in the southern part of Laos. The area of greatest deforestation is found where the land is easily accessible with good road systems nearby. Logging activities frequently happen when markets and timber saw factories are easily accessible. The improved road networks create greater ease for travel: this can lead to a relative increase in the transportation of timber. As a result, forests located at close distances to roads are more likely to be disturbed. This was similar to several studies, which report that deforestation has a link with distance to roads (Ali et al., 2005 [39]; Bhattarai et al., 2009 [15]; Du et al., 2014 [23]; Etter et al., 2006 [40]; Gao and Liu 2012 [22]). However, other studies suggest that there is no link between deforestation and ease of road access (Deng et al., 2011 [41]).
Our results also reveal that distances to villages with rubber plantations are an important factor related to an increase in forest cover. We observe that most of the forest increase is a result of the establishment of rubber plantations in these villages (nearly 65% of forest increase). In recent decades, investment in rubber plantations had been promoted by the Lao Government, which aims to stimulate greater foreign investment in the country in order to reduce poverty, while managing natural forest resources and land use (Phimmavong et al., 2009 [7]; Shi 2008 [33]). However, this can potentially increase rates of forest and land use change, due to massive land preparation and clearance, when governance is ineffective and monitoring systems are insufficient. There are a number of concerns related to rubber investment promotions, including the destabilization of rubber prices in the international market, and environmental issues due to large areas of natural forest being converted to rubber plantations, which leads to a loss of biodiversity and wildlife displacement (Beukema et al., 2007 [42]; Sirirak et al., 2006 [43]; Yi et al., 2014 [44]). Furthermore, another factor associated with forest increase was distance to villages with shifting cultivation areas. There are two potential hypotheses for this: firstly, it was assumed that, after a harvest, the cultivated area would be left untouched, which would create an opportunity for forest recovery. Secondly, shifting cultivation areas in these villages were converted into rubber plantations due to high demand for rubber products in this region.
5. Conclusions
In this research, we investigated the relationship between the physical and socio-economic factors in terms of forest cover decrease and increase from 2006 to 2012 in the south of Lao PDR. We used forest cover change maps derived from a classification of Landsat ETM+ imagery and analysed the relationships with possible physical and socio-economic drivers using a logistic regression model. There are noticeable changes in forest cover within the study area, with regional and local patterns of forest cover decrease and increase. Key findings in this research showed that forest cover decrease was associated with both physical and socio-economic factors, including elevation, access to roads and shifting cultivation practices. Meanwhile, forest cover increase was more likely to be linked with rubber plantation investments in the southern region. Native forest and shifting cultivation lands were vulnerable to transformation into rubber plantations when rubber prices were booming. The goals of poverty alleviation and eradication of shifting cultivation through foreign investments requires more attention in order to reduce potential pressures on forest and land use. Our study should be useful in providing a greater understanding of socio-economic and physical drivers of forest cover change at a local level. This should also be helpful in ensuring the effectiveness of the land management policies being implemented on uplands, especially where such policies are created in response to the natural and socio-economic conditions of this region. Policies for sustainable forest and land use planning should be introduced to ensure a long-term nutrition and food security for upland communities, capacity building programs for local people should be provided to ensure the improvement of their livelihoods, and finally alternative livelihood development options or financial assistance should be available and supported to create a better opportunity for local people to improve their livelihood and avoid deforestation.
Our results provide better understanding of socio-economic and physical drivers of forest cover change at a local level, which is useful for policy makers to ensure the effective management of land use and forest resources. However, expanding the social and environmental factors (e.g., income and timber species) included could improve the analysis and provide deeper understanding of factors driving forest clearance, but is dependent on availability of suitable data. Additionally, there is scope to apply this model in different geographic areas in Laos, which may provide insights into the underlying causes of deforestation in contrasting locations and populations. This is desirable for further research.
Acknowledgments
This study was supported by the Australian Agency for International Development (AusAID). The authors would like to thank Alison-Jane Hunter, from the University of Adelaide, for her editing services for this manuscript. Special acknowledgement is also due to the National Aeronautics and Space Administration (NASA), Google EarthTM and the Government of Laos for providing freely available images and statistical data which were used for this research.
Author Contributions
Chittana Phompila designed the research, collected satellite data and socio-economic data used and implemented data analysis. Megan Lewis assisted in the research design, data analysis and interpreting results, especially regression outputs. Kenneth Clarke and Bertram Ostendorf assisted in interpreting R statistical analysis result and land use mapping. All of the authors worked on the interpretation of results, manuscript writing and revisions.
Conflicts of Interest
The authors declare no conflict of interest.
References
- Robichaud, W.G.; Sinclair, A.R.E.; Odarkor-Lanquaye, N.; Klinkenberg, B. Stable forest cover under increasing populations of swidden cultivators in central Laos: The roles of intrinsic culture and extrinsic wildlife trade. Ecol. Soc. 2009, 14, 33. [Google Scholar] [CrossRef]
- Department of Forestry, Ministry of Forestry and Agriculture. Lao PDR Preliminary proposal for forest investment program. Available online: http://www.climateinvestmentfunds.org/cif/sites/climateinvestmentfunds.org/files/Lao%20FIP%20Presentation%20Pilot%20Country%207%20Nov.pdf (accessed on 15 February 2014).
- Vongsiharath, V. Forest Cover and Land-Use Changes in Lao PDR: According to the National forest Reconnaissance Survey; Department of Forestry: Vientiane, Lao PDR, 2011; pp. 75–116.
- Forest Carbon Partnership Facility. Forest Governance Assessment for REDD+ Implementation in Lao PDR through Application of the PROFOR Forest Governance Tool; Forest Carbon Partnership Facility: Washington, DC, USA, 2014. [Google Scholar]
- Ministry of Agriculture and Forestry. Forestry Strategy to the Year 2020 of the Lao PDR; Ministry of Agriculture and Forestry: Vientiane, Lao PDR, 2005.
- The National Land Management Authority. Law on the Promotion of Foreign Investment; The National Land Management Authority: Vientiane, Lao PDR, 2004.
- Phimmavong, S.; Ozarska, B.; Midgley, S.; Keenan, R. Forest and plantation development in Laos: History, development and impact for rural Communities. Int. For. Rev. 2009, 11, 501–513. [Google Scholar] [CrossRef]
- Messerli, P.; Heinimann, A.; Epprecht, M. Finding homogeneity in heterogeneity—A new approach to quantifying landscape mosaics developed for the Lao PDR. Hum. Ecol. 2009, 37, 291–304. [Google Scholar] [CrossRef] [PubMed]
- Sovu, T.M.; Savadogo, P.; Odén, P.C.; Xayvongsa, L. Recovery of secondary forests on swidden cultivation fallows in Laos. For. Ecol. Manag. 2009, 258, 2666–2675. [Google Scholar] [CrossRef]
- Asian Development Bank. Asian Development Outlook 2015 Update: Enabling Women, Energizing Asia; Asian Development Bank: Mandaluyong, Philippines, 2015. [Google Scholar]
- Organisation for Economic Cooperation and Development (OECD). Economic Outlook for Southeast Asia, China and India 2014: Beyond the Middle-Income Trap; OECD Development Centre: Paris, France, 2013. [Google Scholar]
- Meyfroidt, P.; Lambin, E.F.; Erb, K.H.; Hertel, T.W. Globalization of land use: Distant drivers of land change and geographic displacement of land use. Curr. Opin. Environ. Sustain. 2013, 5, 438–444. [Google Scholar] [CrossRef]
- Vu, Q.M.; Le, Q.B.; Vlek, P.L.G. Hotspots of human-induced biomass productivity decline and their social–ecological types toward supporting national policy and local studies on combating land degradation. Glob. Planet. Chang. 2014, 121, 64–77. [Google Scholar] [CrossRef]
- Vu, Q.M.; Le, Q.B.; Frossard, E.; Vlek, P.L.G. Socio-economic and biophysical determinants of land degradation in Vietnam: An integrated causal analysis at the national level. Land Use Policy 2014, 36, 605–617. [Google Scholar] [CrossRef]
- Bhattarai, K.; Conway, D.; Yousef, M. Determinants of deforestation in Nepal’s Central Development Region. J. Environ. Manag. 2009, 91, 471–488. [Google Scholar] [CrossRef] [PubMed]
- Casse, T.; Milhøj, A.; Ranaivoson, S.; Romuald Randriamanarivo, J. Causes of deforestation in southwestern Madagascar: What do we know? For. Policy Econ. 2004, 6, 33–48. [Google Scholar] [CrossRef]
- Pineda, J.N.B.; Bosque, S.J.; Gómez, D.M.; Franco, P.R. Exploring the driving forces behind deforestation in the state of Mexico using geographically weighted regression. Appl. Geogr. 2010, 30, 576–591. [Google Scholar] [CrossRef]
- Ryan, C.M.; Berry, N.J.; Joshi, N. Quantifying the causes of deforestation and degradation and creating transparent REDD+ baselines: A method and case study from central Mozambique. Appl. Geogr. 2014, 53, 45–54. [Google Scholar] [CrossRef]
- Scullion, J.J.; Vogt, K.A.; Sienkiewicz, A.; Gmur, S.J.; Trujillo, C. Assessing the influence of land-cover change and conflicting land-use authorizations on ecosystem conversion on the forest frontier of Madre de Dios, Peru. Biol. Conserv. 2014, 171, 247–258. [Google Scholar] [CrossRef]
- Webb, E.L.; Jachowski, N.R.A.; Phelps, J.; Friess, D.A.; Than, M.M.; Ziegler, A.D. Deforestation in the Ayeyarwady Delta and the conservation implications of an internationally-engaged Myanmar. Glob. Environ. Chang. 2014, 24, 321–333. [Google Scholar] [CrossRef]
- Mon, M.S.; Mizoue, N.; Htun, N.Z.; Kajisa, T.; Yoshida, S. Factors affecting deforestation and forest degradation in selectively logged production forest: A case study in Myanmar. For. Ecol. Manag. 2012, 267, 190–198. [Google Scholar] [CrossRef]
- Gao, J.; Liu, Y. Deforestation in Heilongjiang Province of China, 1896–2000: Severity, spatiotemporal patterns and causes. Appl. Geogr. 2012, 35, 345–352. [Google Scholar] [CrossRef]
- Du, S.; Wang, Q.; Guo, L. Spatially varying relationships between land-cover change and driving factors at multiple sampling scales. J. Environ. Manag. 2014, 137, 101–110. [Google Scholar] [CrossRef] [PubMed]
- Phompila, C.; Lewis, M.; Clarke, K.; Ostendorf, B. Monitoring expansion of plantations in Lao tropical forests using Landsat time series. In Proceedings of the Land Surface Remote Sensing II, Beijing, China, 12–13 October 2014. [Google Scholar]
- Getahun, K.; Van Rompaey, A.; Van Turnhout, P.; Poesen, J. Factors controlling patterns of deforestation in moist evergreen Afromontane forests of Southwest Ethiopia. For. Ecol. Manag. 2013, 304, 171–181. [Google Scholar] [CrossRef]
- Linkie, M.; Smith, R.; Leader-Williams, N. Mapping and predicting deforestation patterns in the lowlands of Sumatra. Biodivers. Conser. 2004, 13, 1809–1818. [Google Scholar] [CrossRef]
- Hosmer, D.W.; Lemeshow, S. Applied Logistic Regression; Walter, A.S., Wilks, S.S., Eds.; John Wiley & Sons Inc.: Hoboken, NJ, USA, 2000. [Google Scholar]
- Midi, H.; Sarkar, S.K.; Rana, S. Collinearity diagnostics of binary logistic regression model. J. Interdiscip. Math. 2010, 13, 253–267. [Google Scholar] [CrossRef]
- Phompila, C.; Lewis, M.; Clarke, K.; Ostendorf, B. Applying the global disturbance index for detecting vegetation changes in Lao tropical forests. Adv. Remote Sens. 2015, 4, 73–82. [Google Scholar] [CrossRef]
- Fox, J.; Truong, D.M.; Rambo, A.T.; Tuyen, N.P.; Cuc, L.T.; Leisz, S. Shifting cultivation: A new old paradigm for managing tropical forests. Bioscience 2000, 50, 521–528. [Google Scholar] [CrossRef]
- Mas, J.F.; Puig, H.; Palacio, J.L.; Sosa-Lopez, A. Modelling deforestation using GIS and artificial neutral networks. Environ. Model Softw. 2004, 19, 461–471. [Google Scholar] [CrossRef]
- Inoue, Y.; Kiyono, Y.; Asai, H.; Ochiai, Y.; Qi, J.; Olioso, A.; Dounagsavanh, L. Assessing land-use and carbon stock in slash-and-burn ecosystems in tropical mountain of Laos based on time-series satellite images. Int. J. Appl. Earth Obs. Geoinf. 2012, 12, 287–297. [Google Scholar] [CrossRef]
- Shi, W. Rubber boom in Luang Namtha; a Transnational Perspective; The Deutsche Gesellschaft für Internationale Zusammenarbeit (GIZ): Vientiane, Laos, 2008; pp. 1–74. [Google Scholar]
- Geist, H.J.; Lambin, E.F. Proximate causes and underlying driving forces of tropical deforestation: Tropical forests are disappearing as the result of many pressures, both local and regional, acting in various combinations in different geographical locations. Bioscience 2002, 52, 143–150. [Google Scholar] [CrossRef]
- Li, P.; Feng, Z.; Jiang, L.; Liao, C.; Zhang, J. A review of swidden agriculture in Southeast Asia. Remote Sens. 2014, 6, 1654–1683. [Google Scholar] [CrossRef]
- Rasul, G.; Thapa, G.B. Shifting cultivation in the mountains of South and Southeast Asia: Regional patterns and factors influencing the change. Land Degrad. Dev. 2003, 14, 495–508. [Google Scholar] [CrossRef]
- Food and Agricutlure Organization. Shifting Cultivation, Livelihood and Food Security: New and Old Challenges for Indigenous Peoples in Asia; Food and Agricutlure Organization: Bangkok, Thailand, 2015. [Google Scholar]
- Higashi, S. Shifting cultivation and upland life in Northern Laos, Nature and Our Future: The Mekong Basin and Japan. Available online: http://www.mekongwatch.org/platform/bp/english2-9.pdf (accessed on 9 January 2015).
- Ali, J.; Benjaminsen, T.A.; Hammad, A.A.; Dick, Ø.B. The road to deforestation: An assessment of forest loss and its causes in Basho Valley, Northern Pakistan. Glob. Environ. Chang. 2005, 15, 370–380. [Google Scholar] [CrossRef]
- Etter, A.; McAlpine, C.; Wilson, K.; Phinn, S.; Possingham, H. Regional patterns of agricultural land use and deforestation in Colombia. Agric. Ecosyst. Environ. 2006, 114, 369–386. [Google Scholar] [CrossRef]
- Deng, X.; Huang, J.; Uchida, E.; Rozelle, S.; Gibson, J. Pressure cookers or pressure valves: Do roads lead to deforestation in China? J. Environ. Econ. Manag. 2011, 61, 79–94. [Google Scholar] [CrossRef]
- Beukema, H.; Danielsen, F.; Vincent, G.; Hardiwinoto, S.; van Andel, J. Plant and bird diversity in rubber agroforests in the lowlands of Sumatra, Indonesia. Agrofor. Syst. 2007, 70, 217–242. [Google Scholar] [CrossRef]
- Sirirak, A.T.; Somying, T.; Paul, F.D. Changes in bird communities following conversion of lowland forest to oil palm and rubber plantations in southern Thailand. Bird Conserv. Int. 2006, 16, 71–82. [Google Scholar]
- Yi, Z.F.; Cannon, C.H.; Chen, J.; Ye, C.X.; Swetnam, R.D. Developing indicators of economic value and biodiversity loss for rubber plantations in Xishuangbanna, southwest China: A case study from Menglun township. Ecol. Indic. 2014, 36, 788–797. [Google Scholar] [CrossRef]
Figure 1.
The location of the study area in the south of Lao People’s Democratic Republic (PDR), showing provincial boundaries, national protected areas, rivers, roads and village locations.
Figure 1.
The location of the study area in the south of Lao People’s Democratic Republic (PDR), showing provincial boundaries, national protected areas, rivers, roads and village locations.
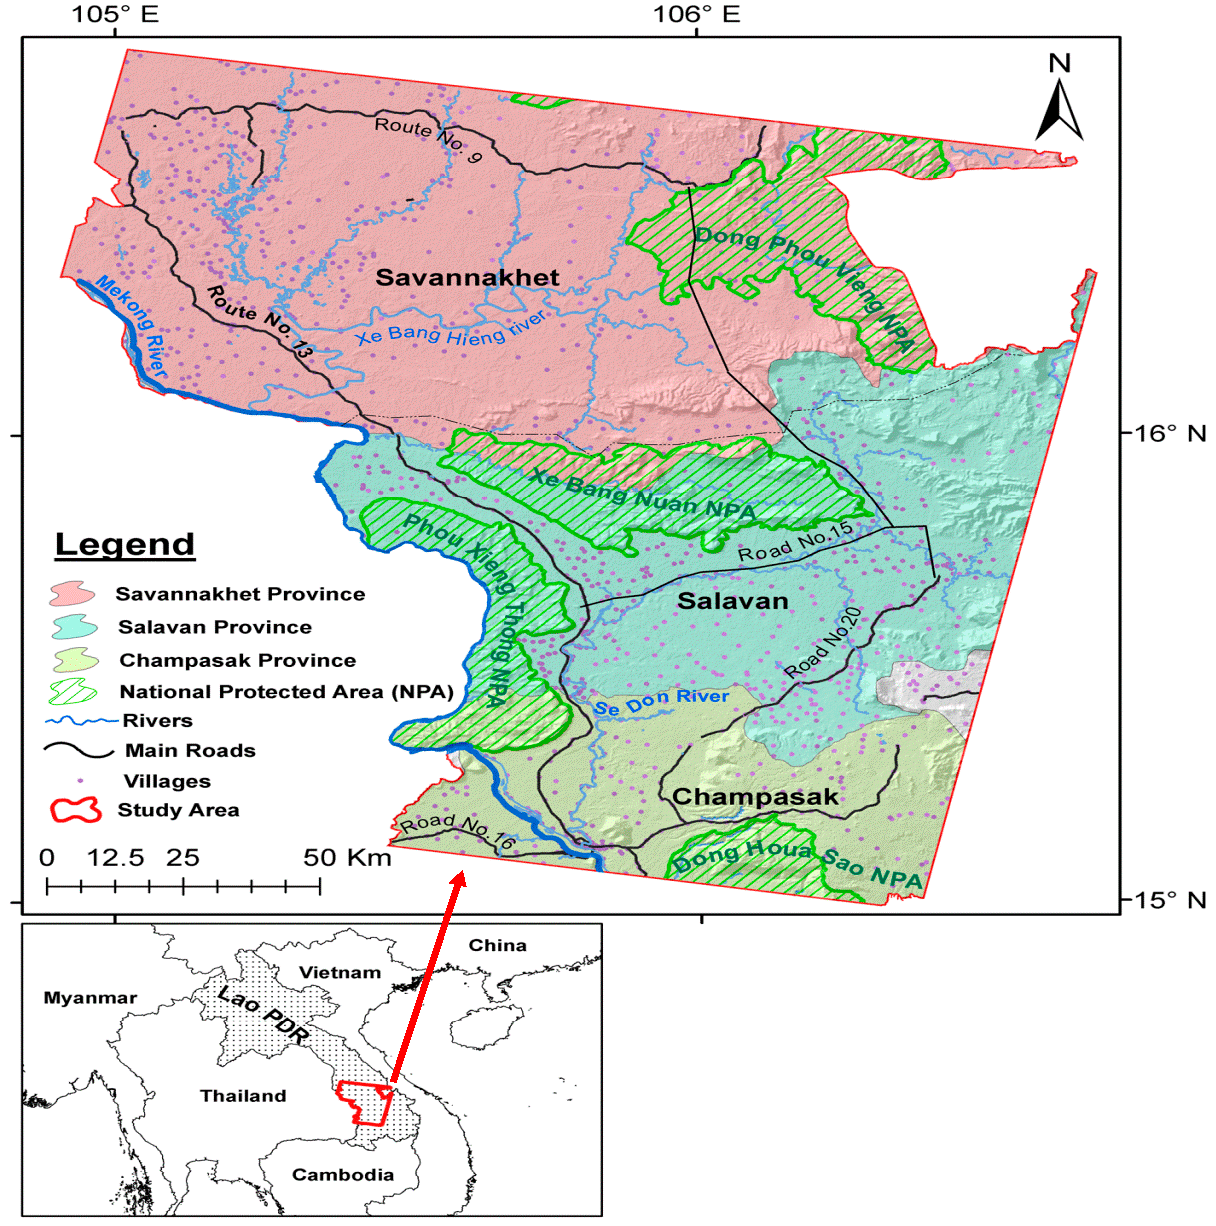
Figure 2.
Forest cover changes from 2006 to 2012 derived from Landsat ETM+ images and evaluated by high-resolution Google EarthTM images (Phompila et al., 2014 [24]; Phompila et al., 2015 [29]). Forest that remains stable are areas that appear to exhibit little or no change between the images; forest cover increase indicates areas that show an increase in forest cover such as the transition from mixed wooded/cleared areas or bare land to plantation; forest cover decrease indicates the clearance or loss of forest, i.e., the transition of native forest to mixed wooded/cleared areas, shifting cultivation areas, or agricultural land.

Figure 3.
GoogleTM Images showing forest cover changes from 2006 to 2012 in two locations: (a) land preparation in 2006; (b) full canopy of rubber plantations in 2012; (c) forest and shifting cultivation areas in 2006; (d) massive forest and land clearances apparent in 2012.
Figure 3.
GoogleTM Images showing forest cover changes from 2006 to 2012 in two locations: (a) land preparation in 2006; (b) full canopy of rubber plantations in 2012; (c) forest and shifting cultivation areas in 2006; (d) massive forest and land clearances apparent in 2012.


Table 1.
A summary of the spatial data used to produce variables for our logistic regression models of factors associated with forest cover increase and decrease in the south of Lao People’s Democratic Republic (PDR).
Table 1.
A summary of the spatial data used to produce variables for our logistic regression models of factors associated with forest cover increase and decrease in the south of Lao People’s Democratic Republic (PDR).
| Data | Source | Unit |
|---|---|---|
| Dependent Variables | ||
| Forest cover increase from 2006 to 2012 | Landsat ETM + (Phompila et al., 2014 [24]) | Categorical data (Yes = 1, No = 0) |
| Forest cover decrease from 2006 to 2012 | Landsat ETM + (Phompila et al., 2014 [24]) | Categorical data (Yes = 1, No = 0) |
| Independent Variables | ||
| Elevation | NASA GDEM | m |
| Slope | NASA GDEM | % |
| Distance to main roads | FFS | km |
| Distance to rivers | FFS | km |
| Distance to villages without rubber plantations or shifting cultivation | NSC | km |
| Distance to villages with rubber plantations | NSC | km |
| Distance to villages with shifting cultivation | NSC | km |
| Distance to protected areas | DOF | km |
Sources: NASA GDEM = National Aeronautics and Space Administration Global Digital Elevation Model; NGD = National Geographic Department; NSC = National Statistic Centre; DOF = Department of Forestry; FFS = Faculty of Forestry Sciences; National University of Laos.
Table 2.
Collinearity of the seven predicted variables used in the logistic regression analyses.
| Elevation | |||||||
|---|---|---|---|---|---|---|---|
| 0.24 | Slope | ||||||
| 0.14 | 0.09 | Distance to main roads | |||||
| 0.32 | 0.07 | −0.03 | Distance to rivers | ||||
| 0.41 | 0.17 | 0.21 | 0.20 | Distance to villages without rubber plantations or shifting cultivation | |||
| −0.09 | 0.02 | 0.15 | 0.00 | −0.04 | Distance to villages with rubber plantations | ||
| 0.08 | 0.04 | 0.40 | −0.09 | 0.11 | 0.11 | Distance to villages with shifting cultivation | |
Table 3.
Results of regression analyses for identifying associated factors of forest cover decrease between 2006 and 2012 in our study area.
Table 3.
Results of regression analyses for identifying associated factors of forest cover decrease between 2006 and 2012 in our study area.
| Variables | Coefficient | S.E | Z-Value | p-Value |
|---|---|---|---|---|
| Elevation | 3.578 | 0.917 | 3.903 | 0.000 |
| Slope | −2.209 | 1.954 | −1.130 | 0.258 |
| Distance to main roads | −0.781 | 0.374 | −2.086 | 0.037 |
| Distance to rivers | −0.623 | 0.432 | −1.443 | 0.149 |
| Distance to villages without rubber plantations or shifting cultivation | 0.142 | 0.671 | 0.212 | 0.833 |
| Distance to villages with shifting cultivation | −1.030 | 0.519 | −1.987 | 0.047 |
| Distance to villages with rubber plantations | 0.216 | 0.501 | 0.431 | 0.667 |
| (Intercept) | −4.265 | 3.824 | −1.115 | 0.265 |
| Null deviance = 260.76 on 4997 degrees of freedom Residual deviance = 223.71 on 4990 degrees of freedom Akaike Information Criterion (AIC) = 239.71 n = 4998; B = coefficient; S.E. = standard error; z-value = Wald z-statistic Nagelkerke r2 = 0.15 Hosmer and Lemeshow test = X-squared = 6.5256, df = 8, p-value = 0.589 Area under Receiver Operating Curves (ROC) = 0.848 (p < 0.001) | ||||
Note: In the logistic regression, the Wald value is normally used to determine whether a certain predictor dependent variable (X) is significant or not. We reject the null hypothesis if it is zero.
Table 4.
Results of regression analyses for identifying associated factors of forest cover increase between 2006 and 2012 in our study area.
Table 4.
Results of regression analyses for identifying associated factors of forest cover increase between 2006 and 2012 in our study area.
| Variables | B | S.E | z-Value | p-Value |
|---|---|---|---|---|
| Elevation | −0.820 | 0.915 | −0.896 | 0.370 |
| Slope | −0.161 | 1.950 | −0.082 | 0.934 |
| Distance to main roads | −0.051 | 0.427 | −0.119 | 0.905 |
| Distance to rivers | 0.670 | 0.521 | 1.285 | 0.199 |
| Distance to villages without rubber plantations or shifting cultivation | 1.055 | 0.708 | 1.491 | 0.136 |
| Distance to villages with shifting cultivation | −0.905 | 0.502 | −1.802 | 0.072 |
| Distance to villages with rubber plantations | −1.512 | 0.487 | −3.104 | 0.002 |
| (Intercept) | 0.025 | 3.595 | 0.007 | 0.995 |
| Null deviance = 293.43 on 4997 degrees of freedom Residual deviance = 262.98 on 4990 degrees of freedom Akaike Information Criterion (AIC) = 278.98 n = 4998; B = coefficient; S.E. = standard error; z-value = Wald z-statistic Nagelkerke r2 = 0.11 Hosmer and Lemeshow test = X-squared = 7.3362, df = 8, p-value = 0.5008 Area under Receiver Operating Curves (ROC) = 0.817 (p < 0.001) | ||||
© 2017 by the authors. Licensee MDPI, Basel, Switzerland. This article is an open access article distributed under the terms and conditions of the Creative Commons Attribution (CC BY) license (http://creativecommons.org/licenses/by/4.0/).
Share and Cite
MDPI and ACS Style
Phompila, C.; Lewis, M.; Ostendorf, B.; Clarke, K. Forest Cover Changes in Lao Tropical Forests: Physical and Socio-Economic Factors are the Most Important Drivers. Land 2017, 6, 23. https://doi.org/10.3390/land6020023
AMA Style
Phompila C, Lewis M, Ostendorf B, Clarke K. Forest Cover Changes in Lao Tropical Forests: Physical and Socio-Economic Factors are the Most Important Drivers. Land. 2017; 6(2):23. https://doi.org/10.3390/land6020023
Chicago/Turabian StylePhompila, Chittana, Megan Lewis, Bertram Ostendorf, and Kenneth Clarke. 2017. "Forest Cover Changes in Lao Tropical Forests: Physical and Socio-Economic Factors are the Most Important Drivers" Land 6, no. 2: 23. https://doi.org/10.3390/land6020023
Note that from the first issue of 2016, this journal uses article numbers instead of page numbers. See further details here.