
Accounting for the Drivers that Degrade and Restore Landscape Functions in Australia

Abstract
:1. Introduction
2. Method
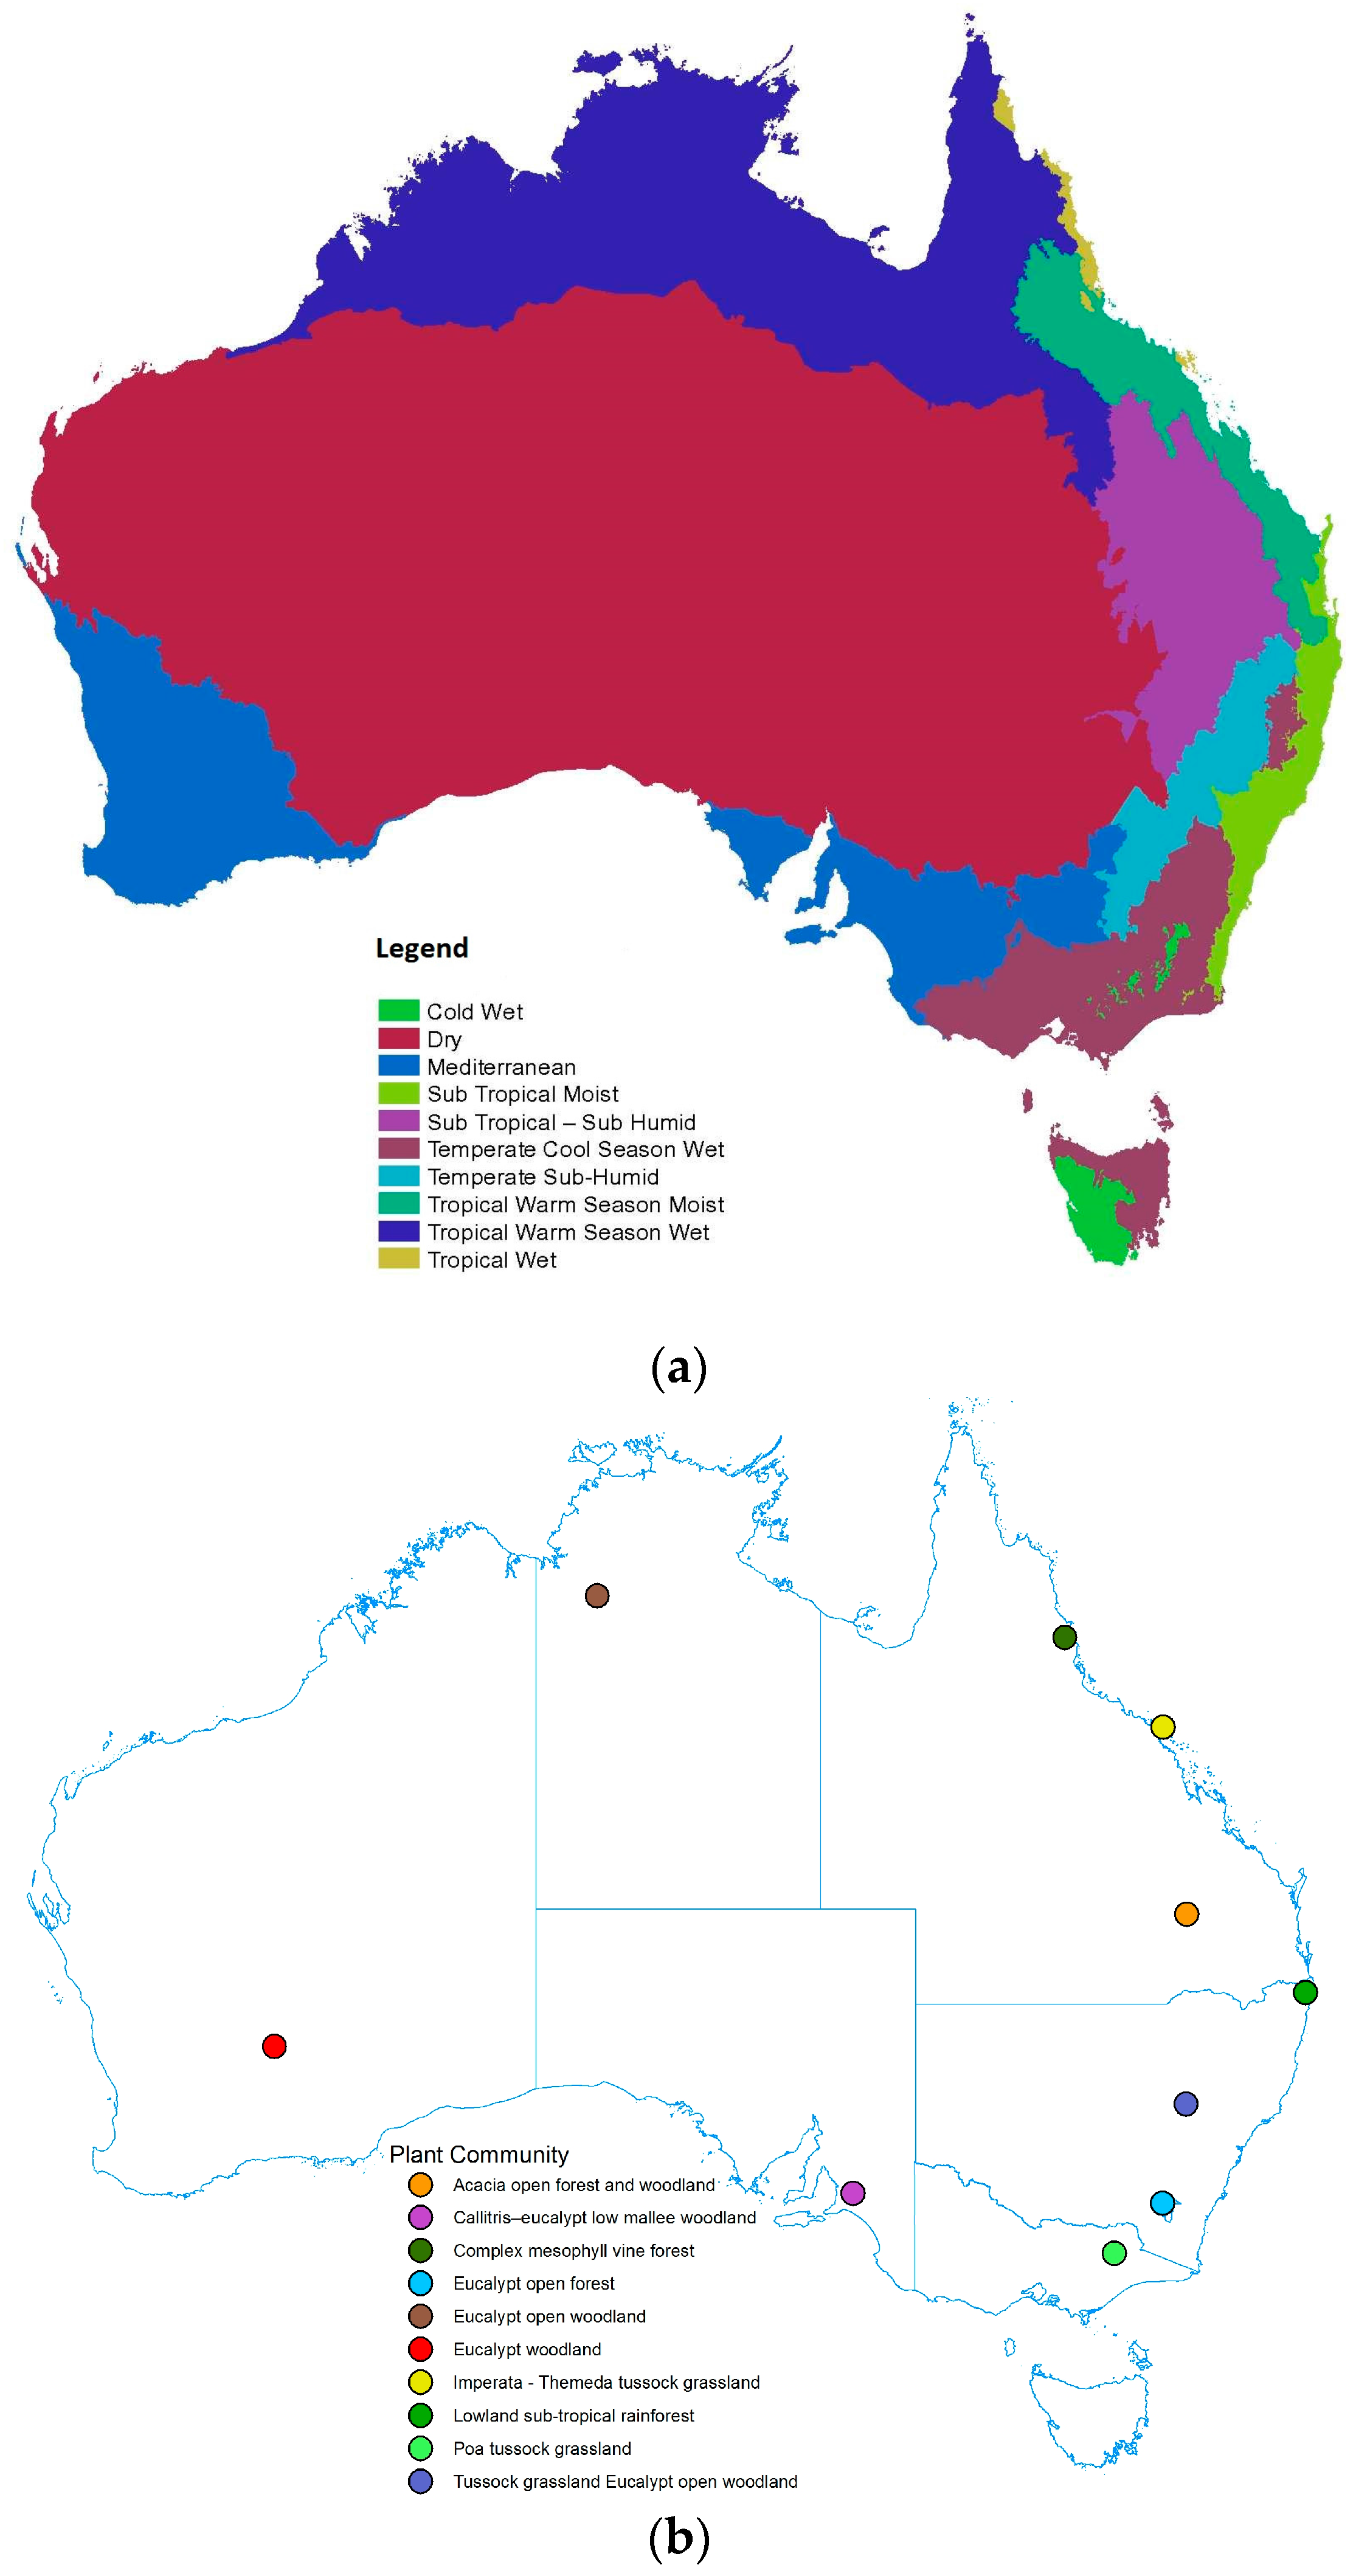
2.1. Selecting Case Study Sites to Represent Australia’s Agro-Climatic Regions
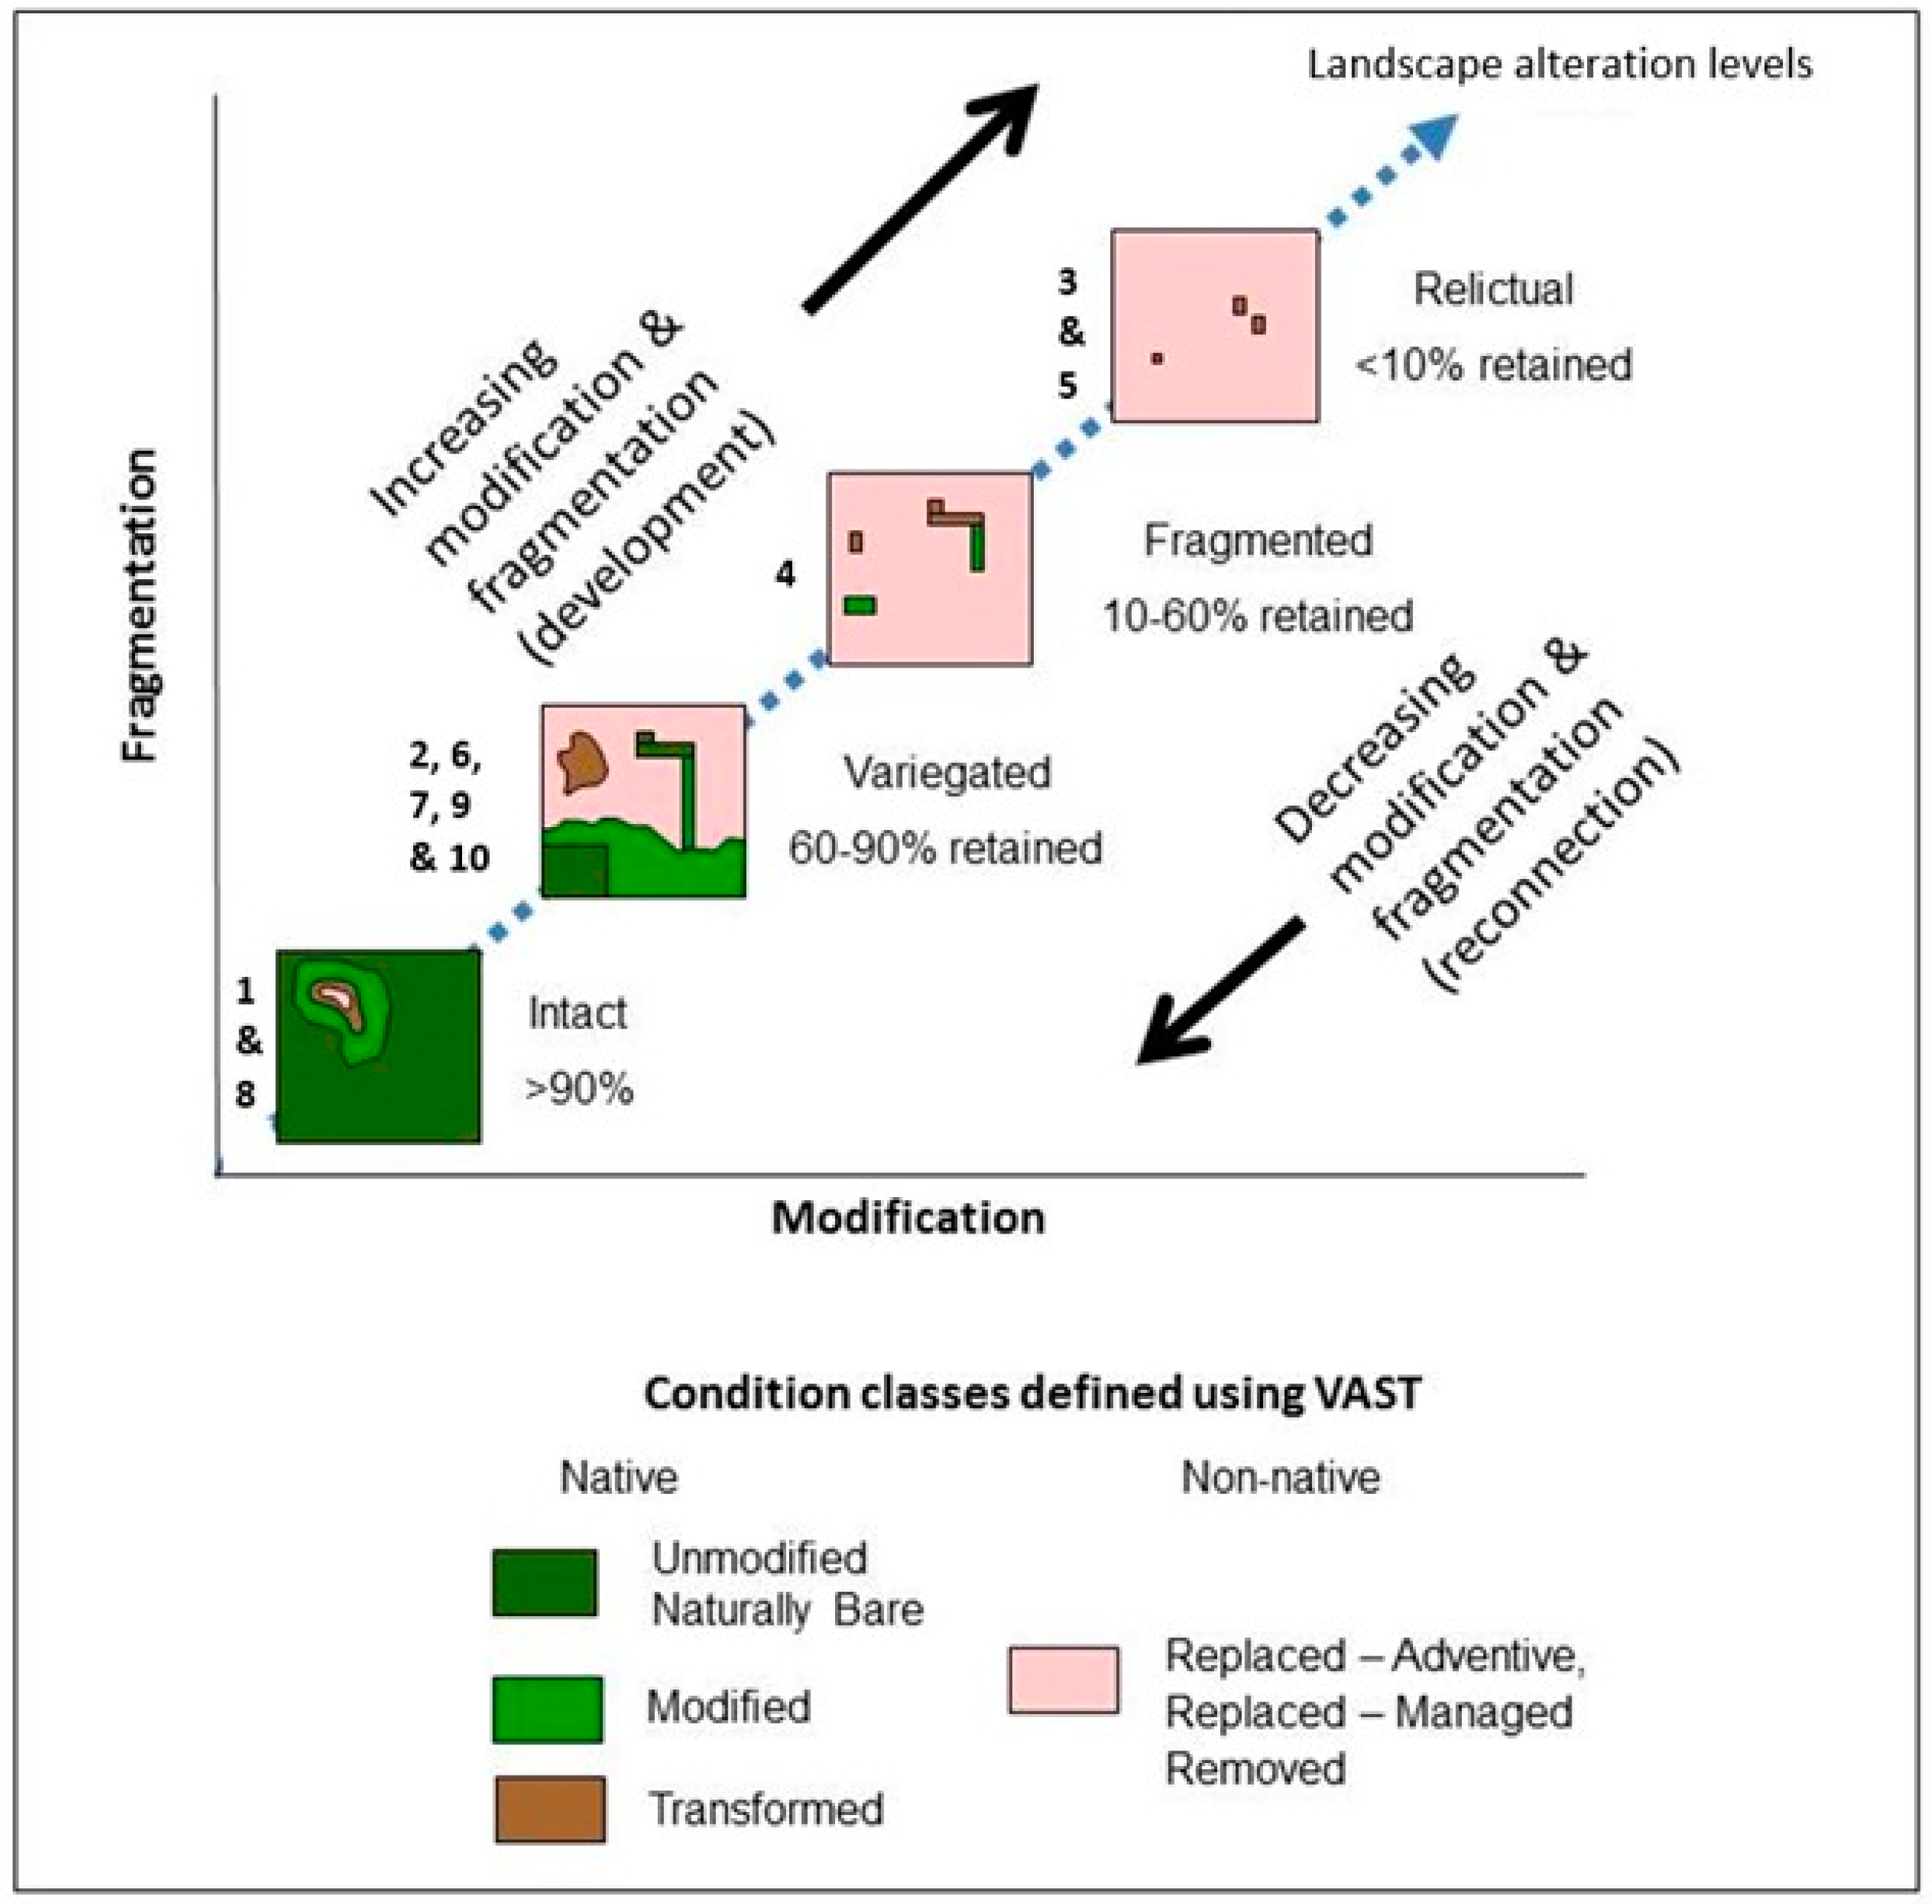
2.2. A Framework for Assessing Change
- 80%–100% of the reference state corresponds to a residual/unmodified state;
- 60%–80% corresponds to a modified state;
- 40%–60% corresponds to a transformed state;
- 20%–40% corresponds to VAST Class IV: replaced and adventive; as well as
- 0%–20% corresponds to VAST Class V: replaced and managed; and VAST Class VI: replaced.
3. Results
4. Discussion
4.1. Emergent Impacts at Multiple Scales
4.2. Major Drivers of Change
4.3. Resilience
4.4. Changing Values and Attitudes
5. Conclusions
Supplementary Materials
Acknowledgments
Author Contributions
Conflicts of Interest
References
- McIntyre, S.; Hobbs, R.J. Human impacts on landscapes: Matrix condition and management priorities. In Nature Conservation 5: Nature Conservation in Production Environments: Managing the Matrix; Craig, J.L., Mitchell, N., Saunders, D.A., Eds.; Surrey Beatty and Sons: Chipping Norton, Australia, 2000; pp. 301–307. [Google Scholar]
- Thackway, R.; Lesslie, R. Describing and mapping human-induced vegetation change in the Australian landscape. Environ. Manag. 2008, 42, 572–590. [Google Scholar] [CrossRef] [PubMed]
- Mutendeudzi, M.; Thackway, R. A Method for Deriving Maps of Landscape Alteration Levels from Vegetation Condition State Datasets; Bureau of Rural Sciences: Canberra, Australia, 2010. [Google Scholar]
- Resilience Alliance. Assessing Resilience in Social-Ecological Systems: Workbook for Practitioners, Version 2.0; 2010. Available online: http://www.resalliance.org/3871.php (accessed on 31 January 2016).
- Sayer, J.; Sunderland, T.; Ghazoul, J.; Pfund, J.L.; Sheil, D.; Meijaard, E.; Venter, M.; Boedhihartono, A.K.; Day, M.; Garcia, C.; et al. Ten principles for a landscape approach to reconciling agriculture, conservation, and other competing land uses. Proc. Natl. Acad. Sci. USA 2013, 110, 8349–8356. [Google Scholar] [CrossRef] [PubMed]
- Woollacott, A.; Adcock, M.; Allen, M.; Evans, R.; Mackinnon, A. Overview: The Making of the Modern World (1750–1918); Cambridge University Press: Cambridge, UK, 2010. [Google Scholar]
- Mulvaney, D.J. The Prehistory of Australia; Frederick A Praeger: New York, NY, USA, 1969. [Google Scholar]
- Blainey, G. The Story of Australia’s People. The Rise and Fall of Ancient Australia; Viking: Melbourne, Australia, 2015. [Google Scholar]
- Thackway, R.; Specht, A. Synthesising the effects of land use on natural and managed landscapes. Sci. Total Environ. 2015, 526, 136–152. [Google Scholar] [CrossRef] [PubMed]
- Brown, V.A.; Lambert, J.A. Collective Learning for Transformational Change: A Guide to Collaborative Action; Routledge: London, UK; New York, NY, USA, 2013. [Google Scholar]
- Yapp, G.; Walker, J.; Thackway, R. Linking vegetation type and condition to ecosystem goods and services. Ecol. Complex. 2010, 7, 292–301. [Google Scholar] [CrossRef]
- Schaffer, G.; Levin, N. Mapping human induced landscape changes in israel between the end of the 19th century and the beginning of the 21th century. J. Landsc. Ecol. 2014, 7, 110–145. [Google Scholar] [CrossRef]
- Hobbs, R.J.; McIntyre, S. Categorizing Australian landscapes as an aid to assessing the generality of landscape management guidelines. Glob. Ecol. Biogeogr. 2005, 14, 1–15. [Google Scholar] [CrossRef]
- Hutchinson, M.F.; McIntyre, S.; Hobbs, R.J.; Stein, J.L.; Garnett, S.; Kinloch, J. Integrating a global agro-climatic classification with bioregional boundaries in Australia. Glob. Ecol. Biogeogr. 2005, 14, 197–212. [Google Scholar] [CrossRef]
- Williams, J.; Hook, R.A.; Hamblin, A. Agro—Ecological Regions of Australia, Methodologies for Their Derivation and Key Issues in Resource Management; CSIRO Land and Water: Canberra, Australia, 2002. [Google Scholar]
- Köppen, W. Die Klimate der Erde; De Gruyter: Berlin, Germany, 1923. [Google Scholar]
- Noss, R.F. Indicators for Monitoring Biodiversity: A Hierarchical Approach. Conserv. Biol. 1990, 4, 355–364. [Google Scholar] [CrossRef]
- Tropical Savannas Cooperative Research Centre. Savanna Explorer Northern Australian Information Service. Retrieved from The Population of Savanna Australia: (n.d.). Available online: http://www.savanna.org.au/all/economic.html (accessed on17 April 2016).
- Fensham, R.J.; Fairfax, R.J.; Archer, S.R. Rainfall, land use and woody vegetation cover change in semi-arid Australian savanna. J. Ecol. 2005, 93, 596–606. [Google Scholar] [CrossRef]
- Thackway, R. Tracking Anthropogenic Influences on the Condition of Plant Communities at Sites and Landscape Scales; Almusaed, A.Z., Ed.; Landscape Ecology: Rijeka, Croatia, 2016. [Google Scholar]
- Yapp, G.A.; Thackway, R. Responding to change—Criteria and indicators for managing the transformation of vegetated landscapes to maintain or restore ecosystem diversity. In Biodiversity in Ecosystems—Linking Structure and Function; Blanco, J.A., Ed.; InTech: Rijeka, Croatia, 2015. [Google Scholar]
- Fitzsimons, J.; Pulsford, I.; Wescott, G. (Eds.) Linking Australia’s Landscapes, Lessons and Opportunities from Large-Scale Conservation Networks; CSIRO Publishing: Collingwood, Australia, 2013.
- Brown, V.A. Landcare Languages: Talking to Each Other about Living with the Land; National Landcare Program, Department of Primary Industry: Canberra, Australia, 1995.
- Queensland Herbarium. Regional Ecosystem Description Database (REDD); Version 9.0; Queensland Department of Science, Information Technology and Innovation: Brisbane, QLD, Australia, 2015. Available online: https://environment.ehp.qld.gov.au/regional-ecosystems/ (accessed on 17 April 2016).
- McDonald, K.; Atherton, Queensland. Personal communication, 2016.
- Stanton, P.; Redlynch, Queensland. Personal communication, 2015.
- Department of National Parks, Recreation, Sport and Racing. Whitsunday Islands National Parks and Adjoining State Waters Management Statement 2013; Department of National Parks, Recreation, Sport and Racing, Queensland Government, 2013. Available online: http://www.nprsr.qld.gov.au/managing/plans-strategies/statements/pdf/whitsunday-islands.pdf (accessed on 15 May 2016).
- Stanton, P.; Stanton, D.; Stott, M.; Parsons, M. Fire exclusion and the changing landscape of Queensland’s Wet Tropics Bioregion 1. The extent and pattern of transition. Aust. For. 2014, 77, 51–57. [Google Scholar] [CrossRef]
- Victorian Conservation Trust. Bogong High Plains, Vegetation Map and Guide to Alpine Flora. 1:15,000 Scale. One of a Series. Rocky Valley Sheet Including Falls Creek, Mt Nelse and Mt Cope Areas; Victorian Conservation Trust in Conjuction with the Soil Conservation Service: Melbourne, Australia, 1986. [Google Scholar]
- Australian Alps National Parks. Grazing in the Australian Alps. Educational Resource. Available online: https://theaustralianalps.files.wordpress.com/2013/11/grazing.pdf (accessed on 31 January 2016).
- Thackway, R. Blundells Flat, Ex-Coupe 424, ACT. Ver. 1. VAST-2: Tracking the Transformation of Australia’s Vegetated Landscapes; Australian Centre for Ecological Analysis and Synthesis, University of Queensland: Brisbane, Australia, 2012. [Google Scholar]
- Montreal Implementation Group National Forest Inventory Steering Committee. Australia’s State of the Forests Report 2013; Montreal Process Implementation Group for Australia and National Forest Inventory Steering Committee: Canberra, Australia, 2013.
- Ecosystem Science Long-Term Plan Steering Committee. Foundations for the Future: A Long-Term Plan for Australian Ecosystem Science; Terrestrial Ecosystem Research Network, the Ecological Society of Australia, and the Australian Academy of Science’s National Committee for Ecology, Evolution and Conservation: Canberra, Australia, 2014. [Google Scholar]
- Sbrocchi, C.; Davis, R.; Grundy, M.; Harding, R.; Hillman, T.; Mount, R.; Possingham, H.; Saunders, D.; Smith, T.; Thackway, R.; et al. Technical Analysis of the Australian Regional Environmental Accounts Trial; Wentworth Group of Concerned Scientists: Sydney, Australia, 2015. [Google Scholar]


| Condition Components 1 | Key Functional, Structural and Composition Criteria | Indicators |
|---|---|---|
| Level 3 | Level 2 | Level 1 |
| Functional | Soil hydrology | Rainfall infiltration and soil water holding capacity |
| Surface and subsurface flows | ||
| Soil physical status | Effective rooting depth of the soil profile | |
| Bulk density of the soil through changes to soil structure or soil removal | ||
| Soil nutrient status | Nutrient stress: rundown (deficiency) relative to reference soil fertility | |
| Nutrient stress: excess (toxicity) relative to reference soil fertility | ||
| Soil biological status | Organisms responsible for maintaining soil porosity and nutrient recycling | |
| Surface organic matter, soil crusts | ||
| Natural disturbance regime | Area/size of disturbance events: foot prints (e.g., major storm cells, floods, wildfire, cyclones, droughts, ice) | |
| Interval between disturbance events | ||
| Reproductive potential | Reproductive potential of overstorey structuring species | |
| Reproductive potential of understorey structuring species | ||
| Structural | Overstorey structure | Overstorey top height (mean) of the plant community |
| Overstorey foliage projective cover (mean) of the plant community | ||
| Overstorey structural diversity (i.e., a diversity of age classes) of the stand | ||
| Understorey structure | Understorey top height (mean) of the plant community | |
| Understorey ground cover (mean) of the plant community | ||
| Understorey structural diversity (i.e., a diversity of age classes) of the plant | ||
| Compositional | Overstorey composition | Densities of overstorey species functional groups |
| Richness: the number of indigenous overstorey species relative to the number of exotic species | ||
| Understorey composition | Densities of understorey species functional groups | |
| Richness: the number of indigenous understorey species relative to the number of exotic species |
| Management Regimes | |
|---|---|
| 1. | No active intervention that affects indicators of vegetation function, structure and composition |
| 2. | Management practices that harvest vegetation products (biomass, fibre, flowers, fruit and nuts), which affect indicators of vegetation function, structure and composition |
| 3. | Management practices that enhance or improve indicators of vegetation function, structure and composition |
| 4. | Management practices that extirpate or remove indicators of the function, structure and composition |
| 5. | Management practices that reconstruct or reinstate indicators of the function, structure and composition |
| Case Study | Agro-Climatic Zone and Reference Vegetation | Vegetation Condition Dynamics (Status Score Change Relative to Reference State) | Government Policies | Markets | Technological Changes | Climate Variation | Cultural |
|---|---|---|---|---|---|---|---|
| 1 | Cold-wet, alpine grassland | 10% loss due to livestock grazing then recovery to near reference conditions | State government reduction, then prohibition of livestock grazing, then creation of a national park | Rapid development of national and international markets for meat and wool | Domestic livestock | Periods of drought that increased livestock grazing pressure on alpine grassland | Total indigenous displacement by Western European values and land management practices |
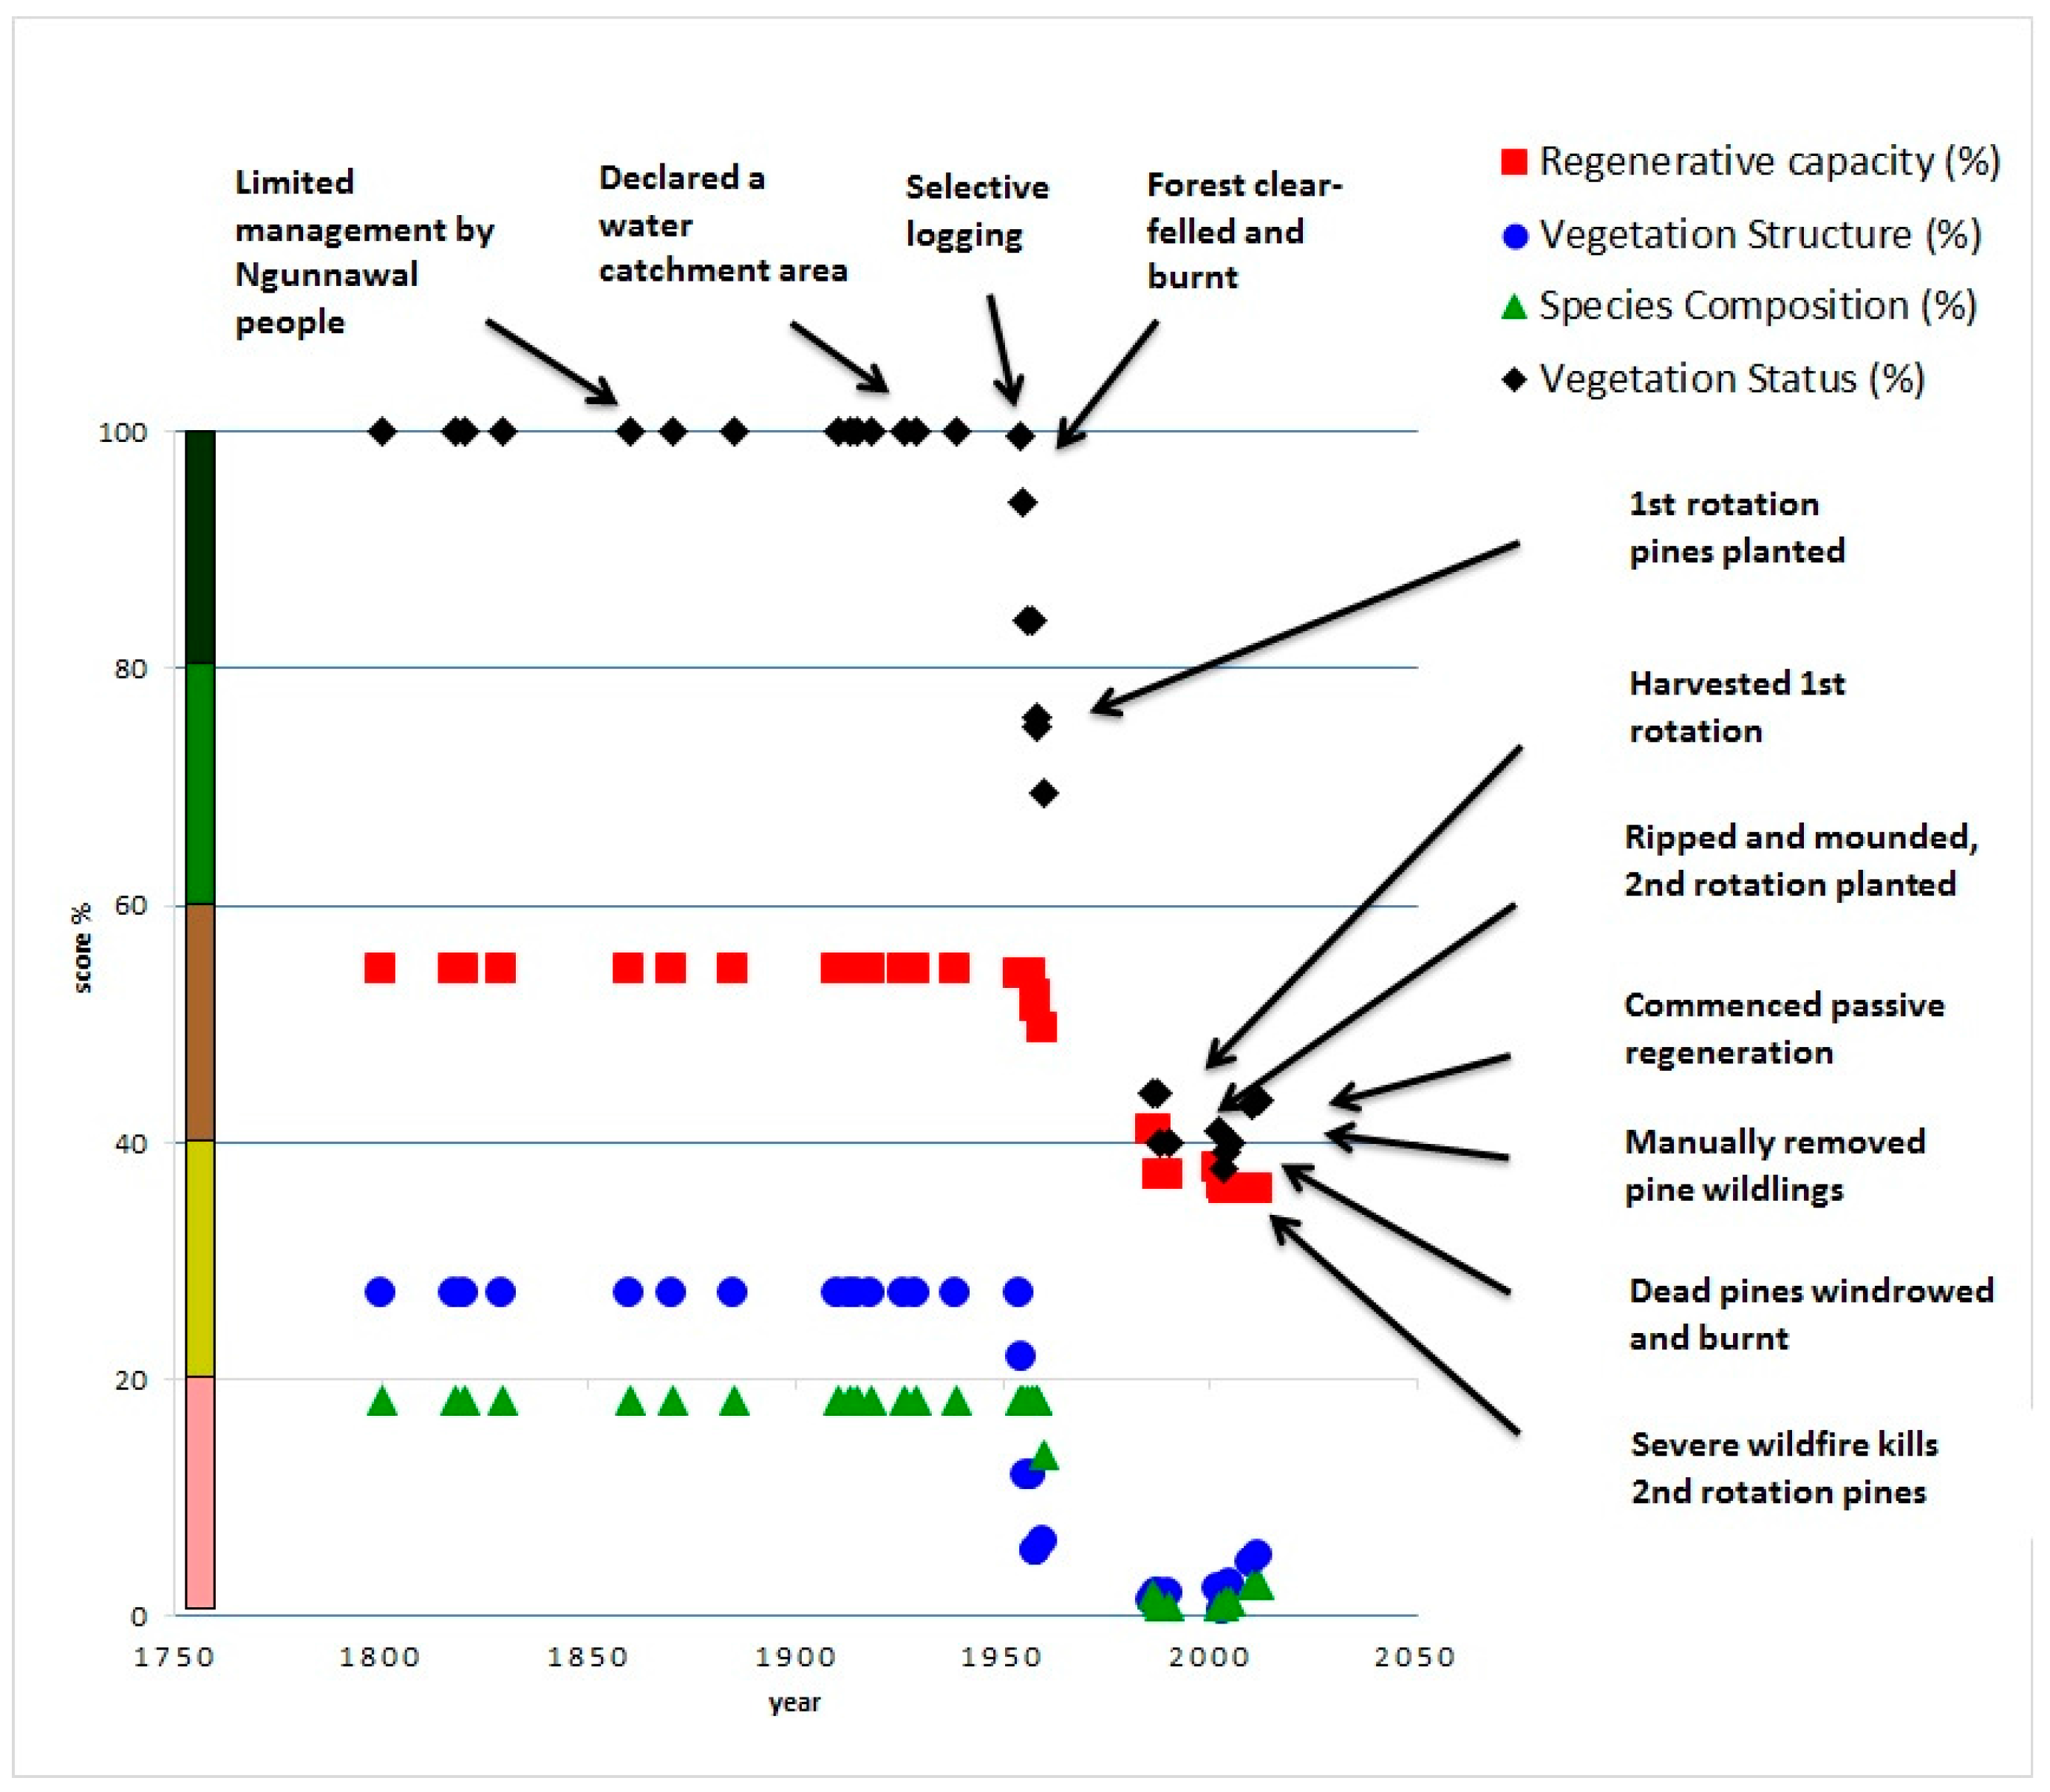
| 2 | Cold-wet, open forest | 60% loss due to forest clearing, minor recovery by passive restoration | National and territory government-funded establishment of softwood plantations, then initiation of restoration of native vegetation for water catchment values | Domestic market for softwood for housing construction now influenced by softwood supply from New Zealand | Pinus radiata plantation system | Severe wildfire destroys pine plantation in 2003, linked to prolonged drought, as well as periods of above average rainfall that supported passive restoration (El-Nino-La Nina cycles) | Total indigenous displacement by Western European values and land management practices |
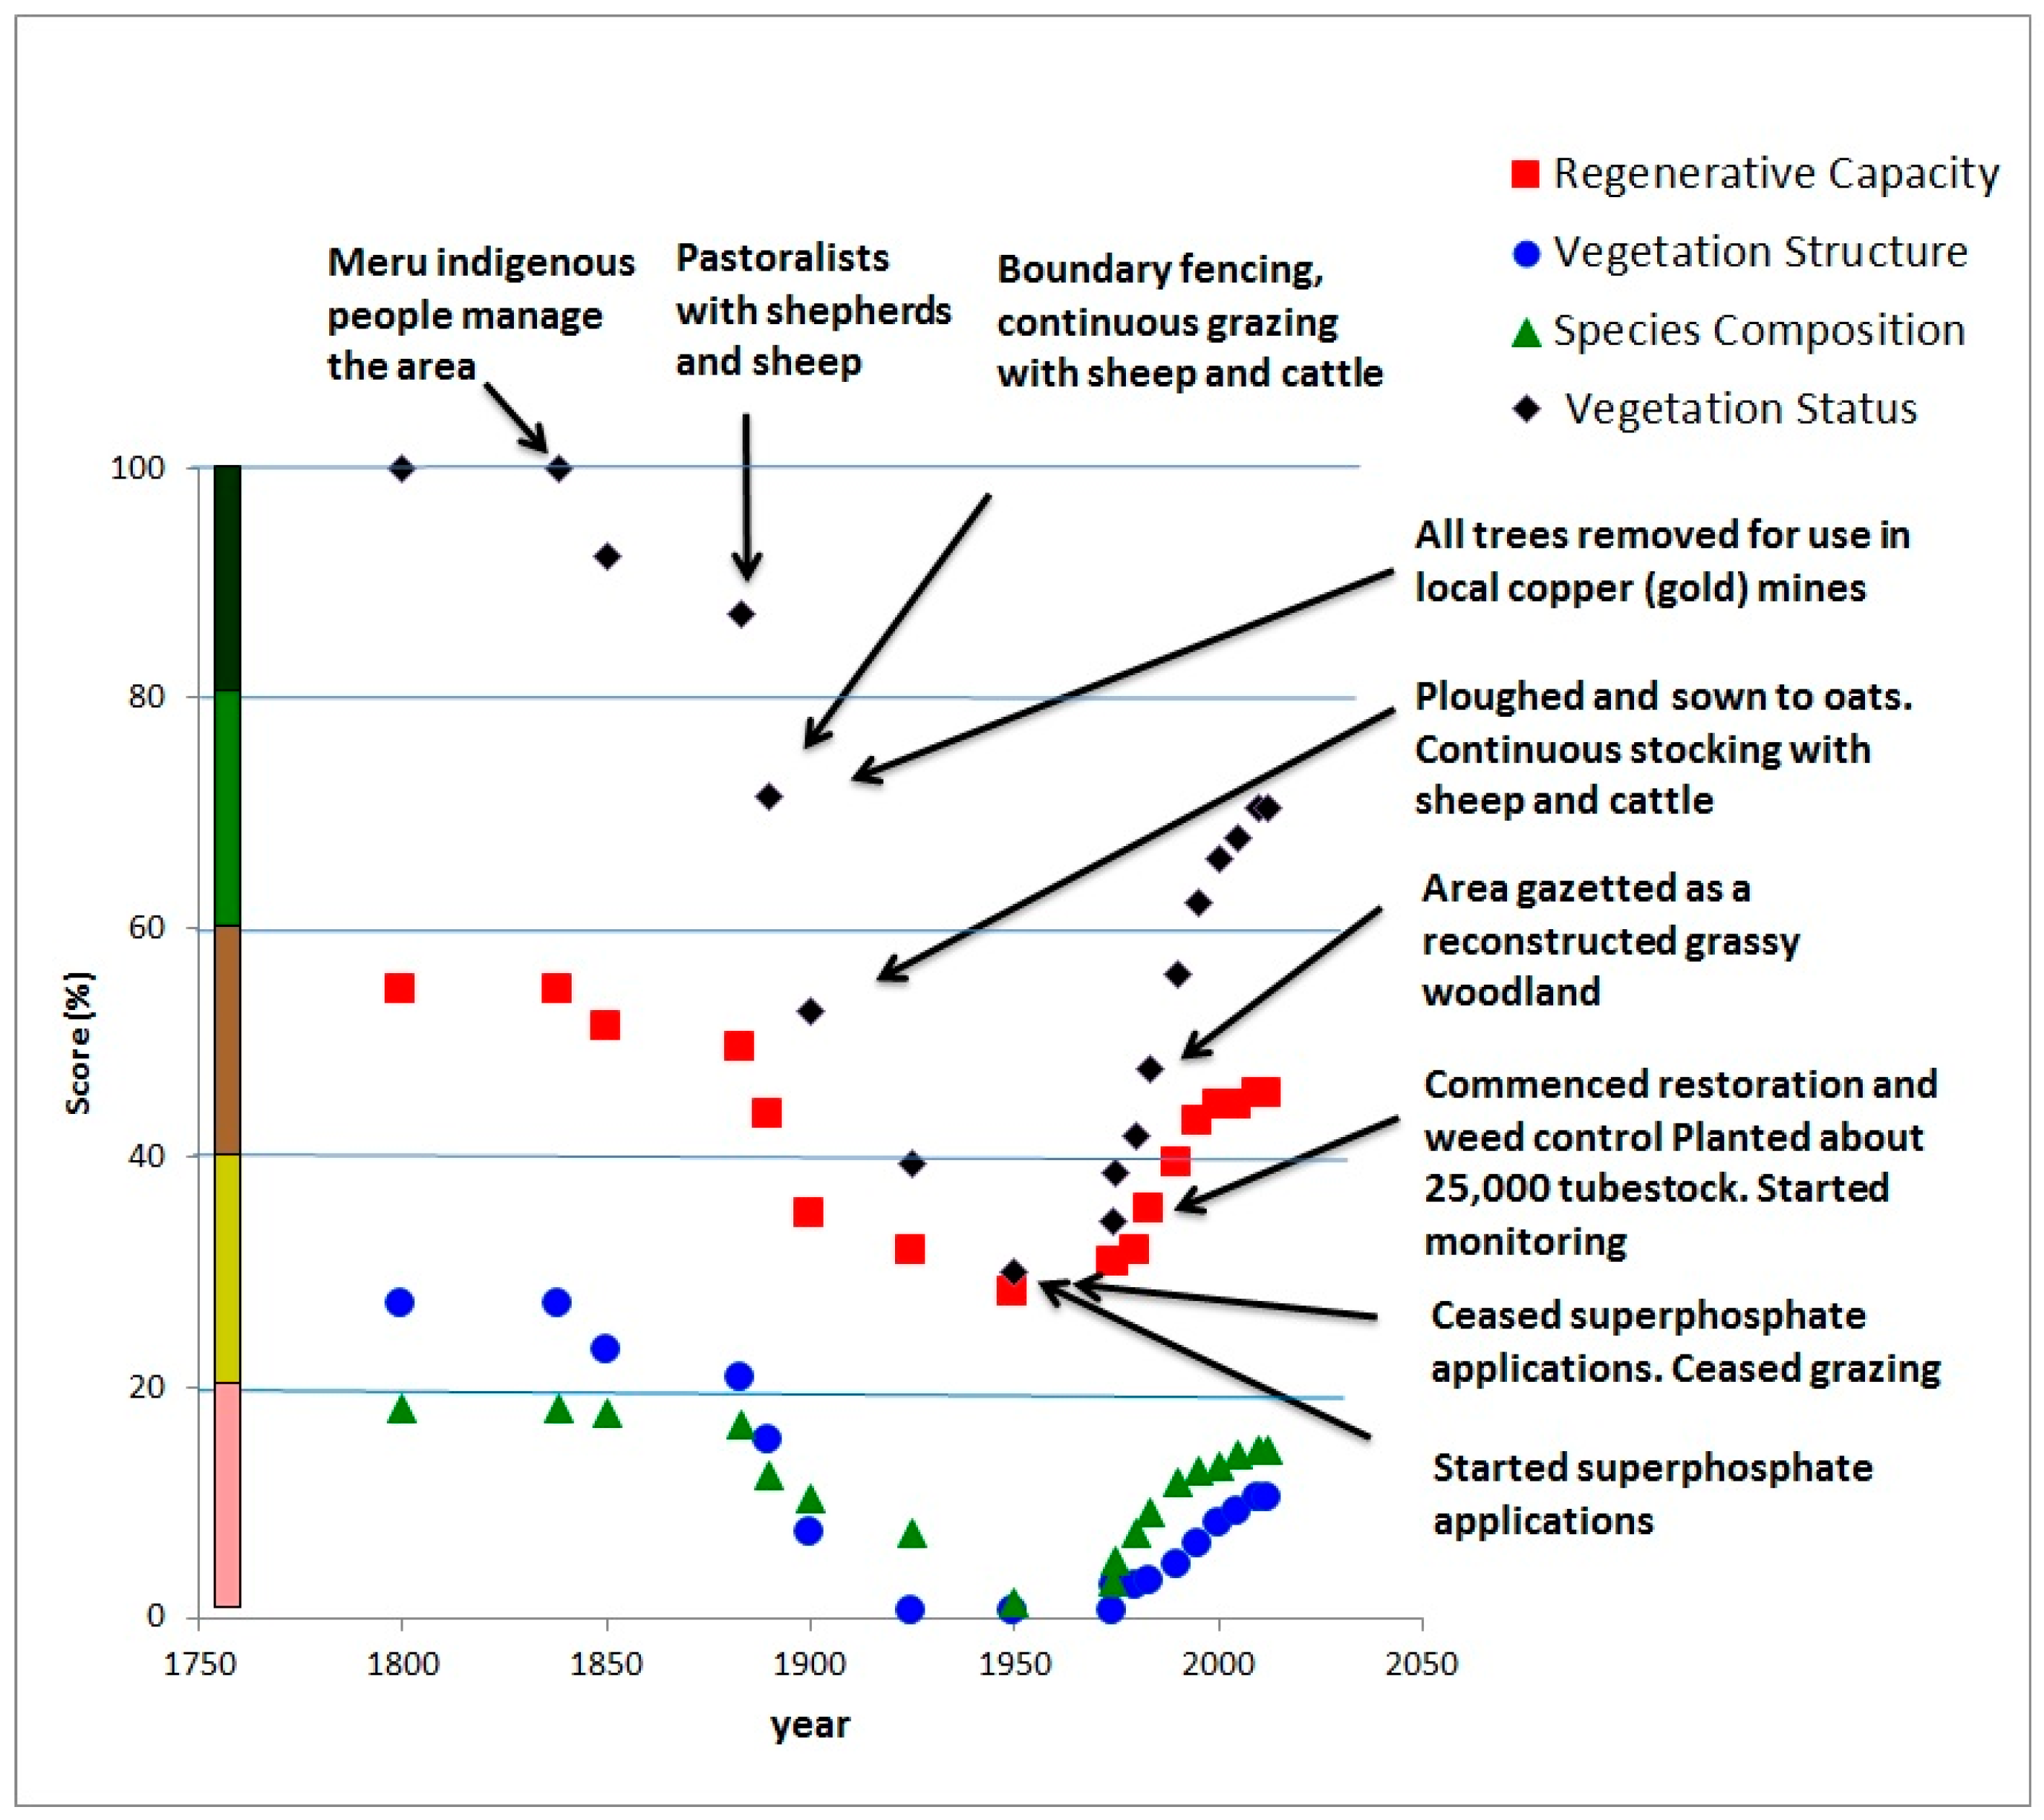
| 3 | Mediterranean, low (mallee) woodland | 70% loss due to clearing, then significant recovery by active restoration | Various regulations that required clearing, then subsidies on fertiliser to increase intensification, more recently, agri-environment schemes to support farmers to restore native vegetation | Demand for timber for smelting of copper, then domestic and international demand for meat wool and grains | Mining technology, broad-scale cropping and exotic pasture systems, domestic livestock, fencing and feral rabbits | Periods of drought that hastened loss of vegetation condition, as well as periods of above average rainfall that supported restoration (El-Nino-La Nina cycles) | Total indigenous displacement by Western European values and land management practices |
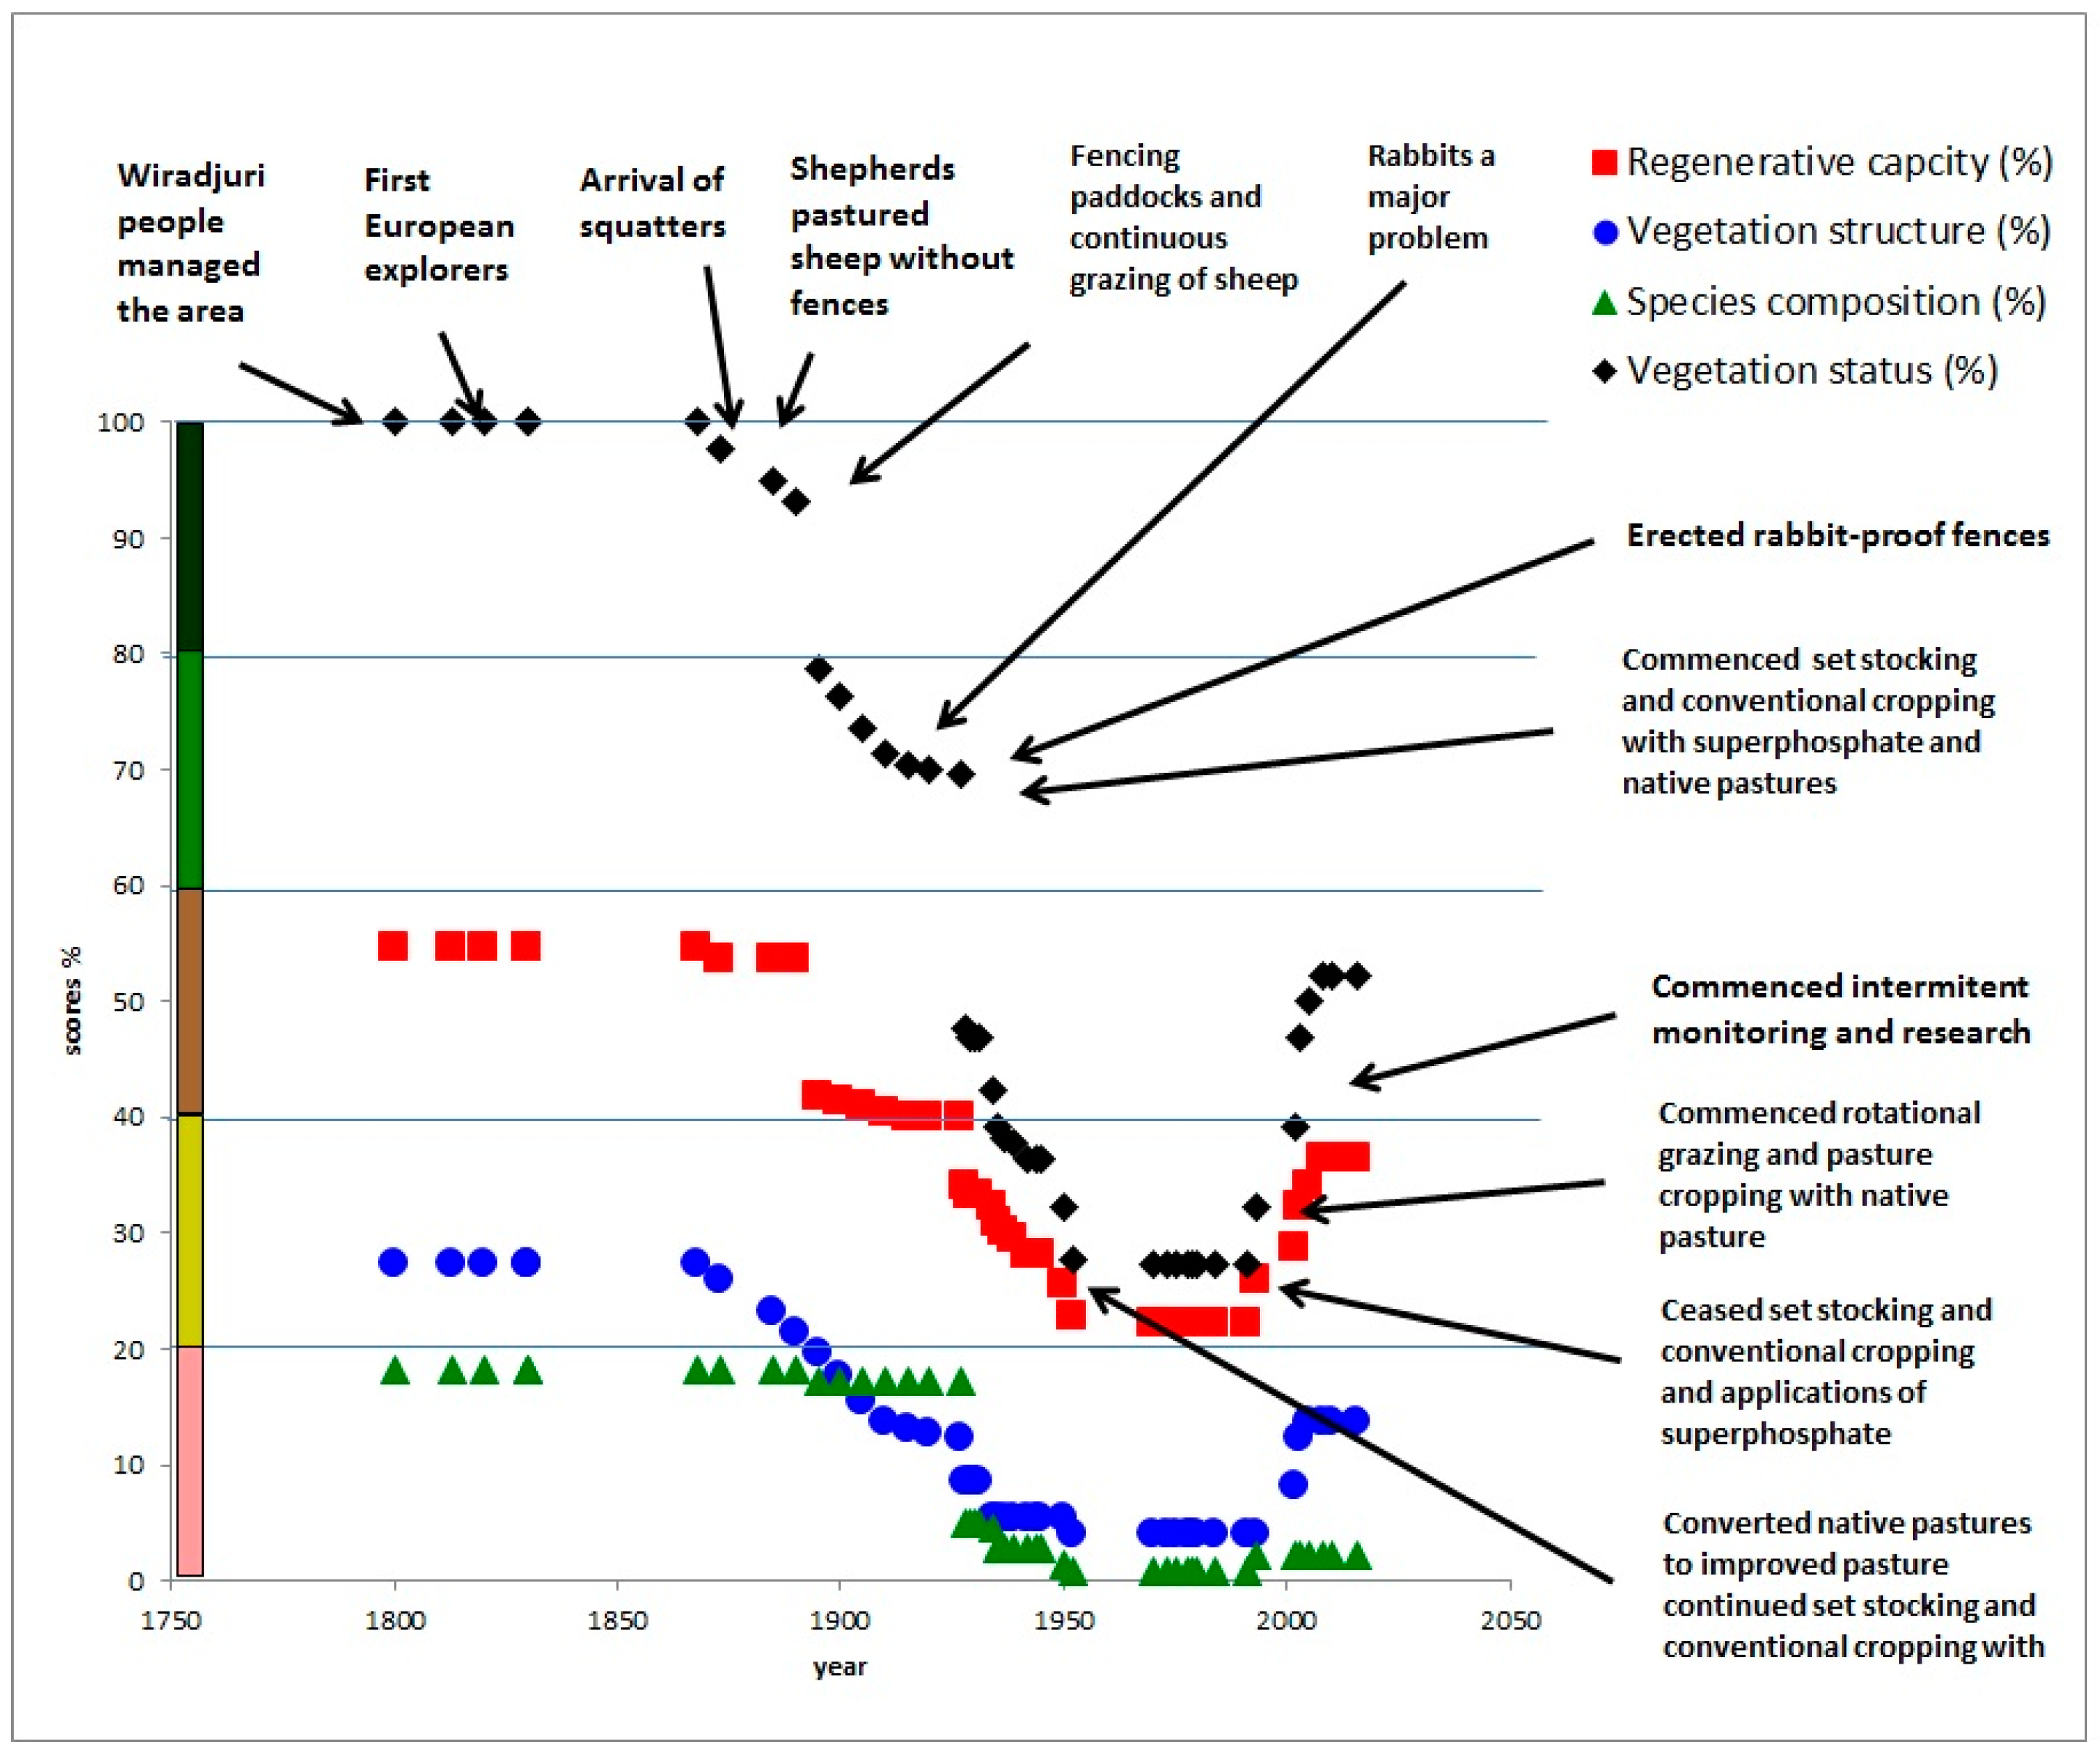
| 4 | Temperate, sub-humid, grassy eucalypt woodland | 70% loss due to clearing then partial recovery | Various regulations that required clearing, then subsidies on fertiliser to increase intensification, more recently, later agri-environment schemes to support farmers to restore native vegetation | Domestic and international demand for grains, meat and wool | Broad-scale cropping and exotic pasture systems, domestic livestock, fencing and feral rabbits; no till cropping into dormant native pasture with cell-based sheep grazing | Drought and wildfire were a stimulus for land management change coupled with localised rising ground water that was saline. | Total indigenous displacement by Western European values and land management practices |
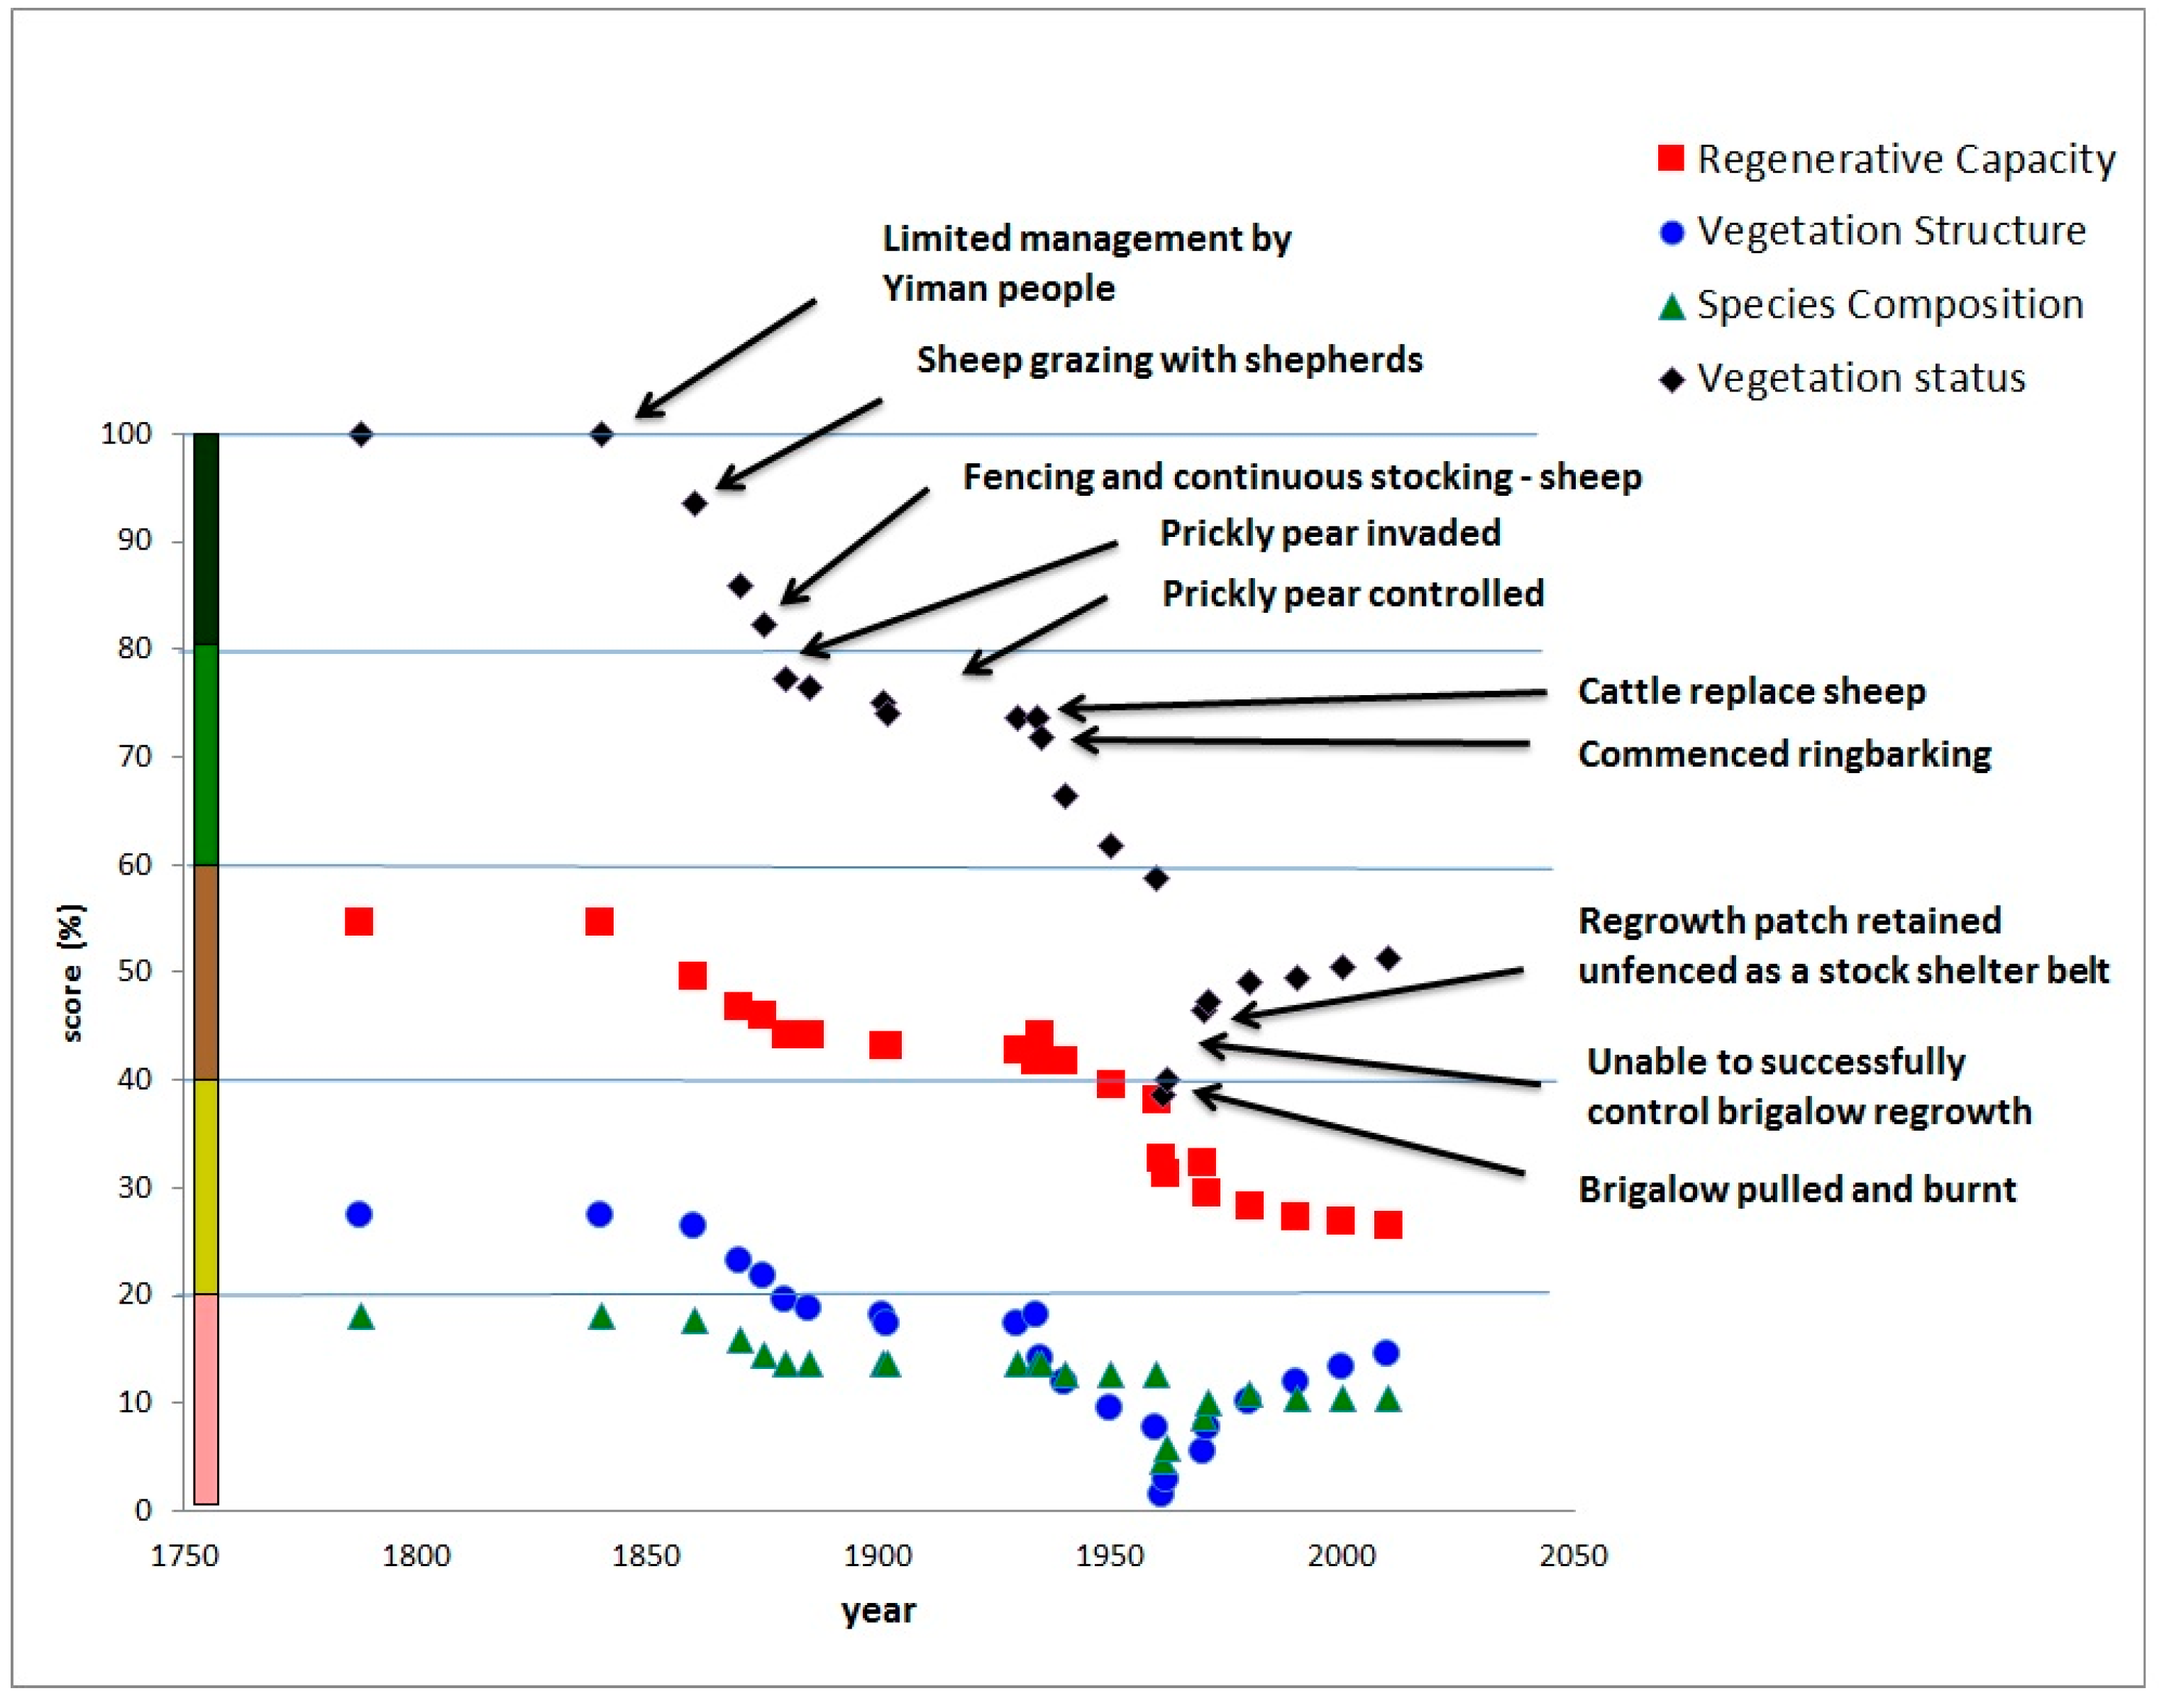
| 5 | Sub-tropical subhumid, Acacia forest and woodland | 60% loss due to clearing and introduction of exotic pasture grasses, weeds, then small-scale recovery by Acacia regrowth | Various regulations that required clearing by land owners | Domestic and international demand for grains, meat and wool | Broad-scale mechanical clearing, cropping and exotic pasture systems, domestic livestock and fencing | Unknown impact of climate variation | Total indigenous displacement by Western European values and land management practices |
| 6 | Sub-tropical moist, lowland rainforest | 60% loss due to land clearing and conversion to exotic pastures, colonisation by a woody weed, then significant recovery due to active restoration | Various regulations that required clearing by land owners, then initiation of restoration of native vegetation for water catchment and local eco-tourism values | Domestic and international demand for sub-tropical timbers, then domestic demand for dairy products | Fencing for intensive dairy production, then development of the science and practice of ecological restoration | An area of less climatic variation than inland Australia | Total indigenous displacement by Western European values and land management practices |
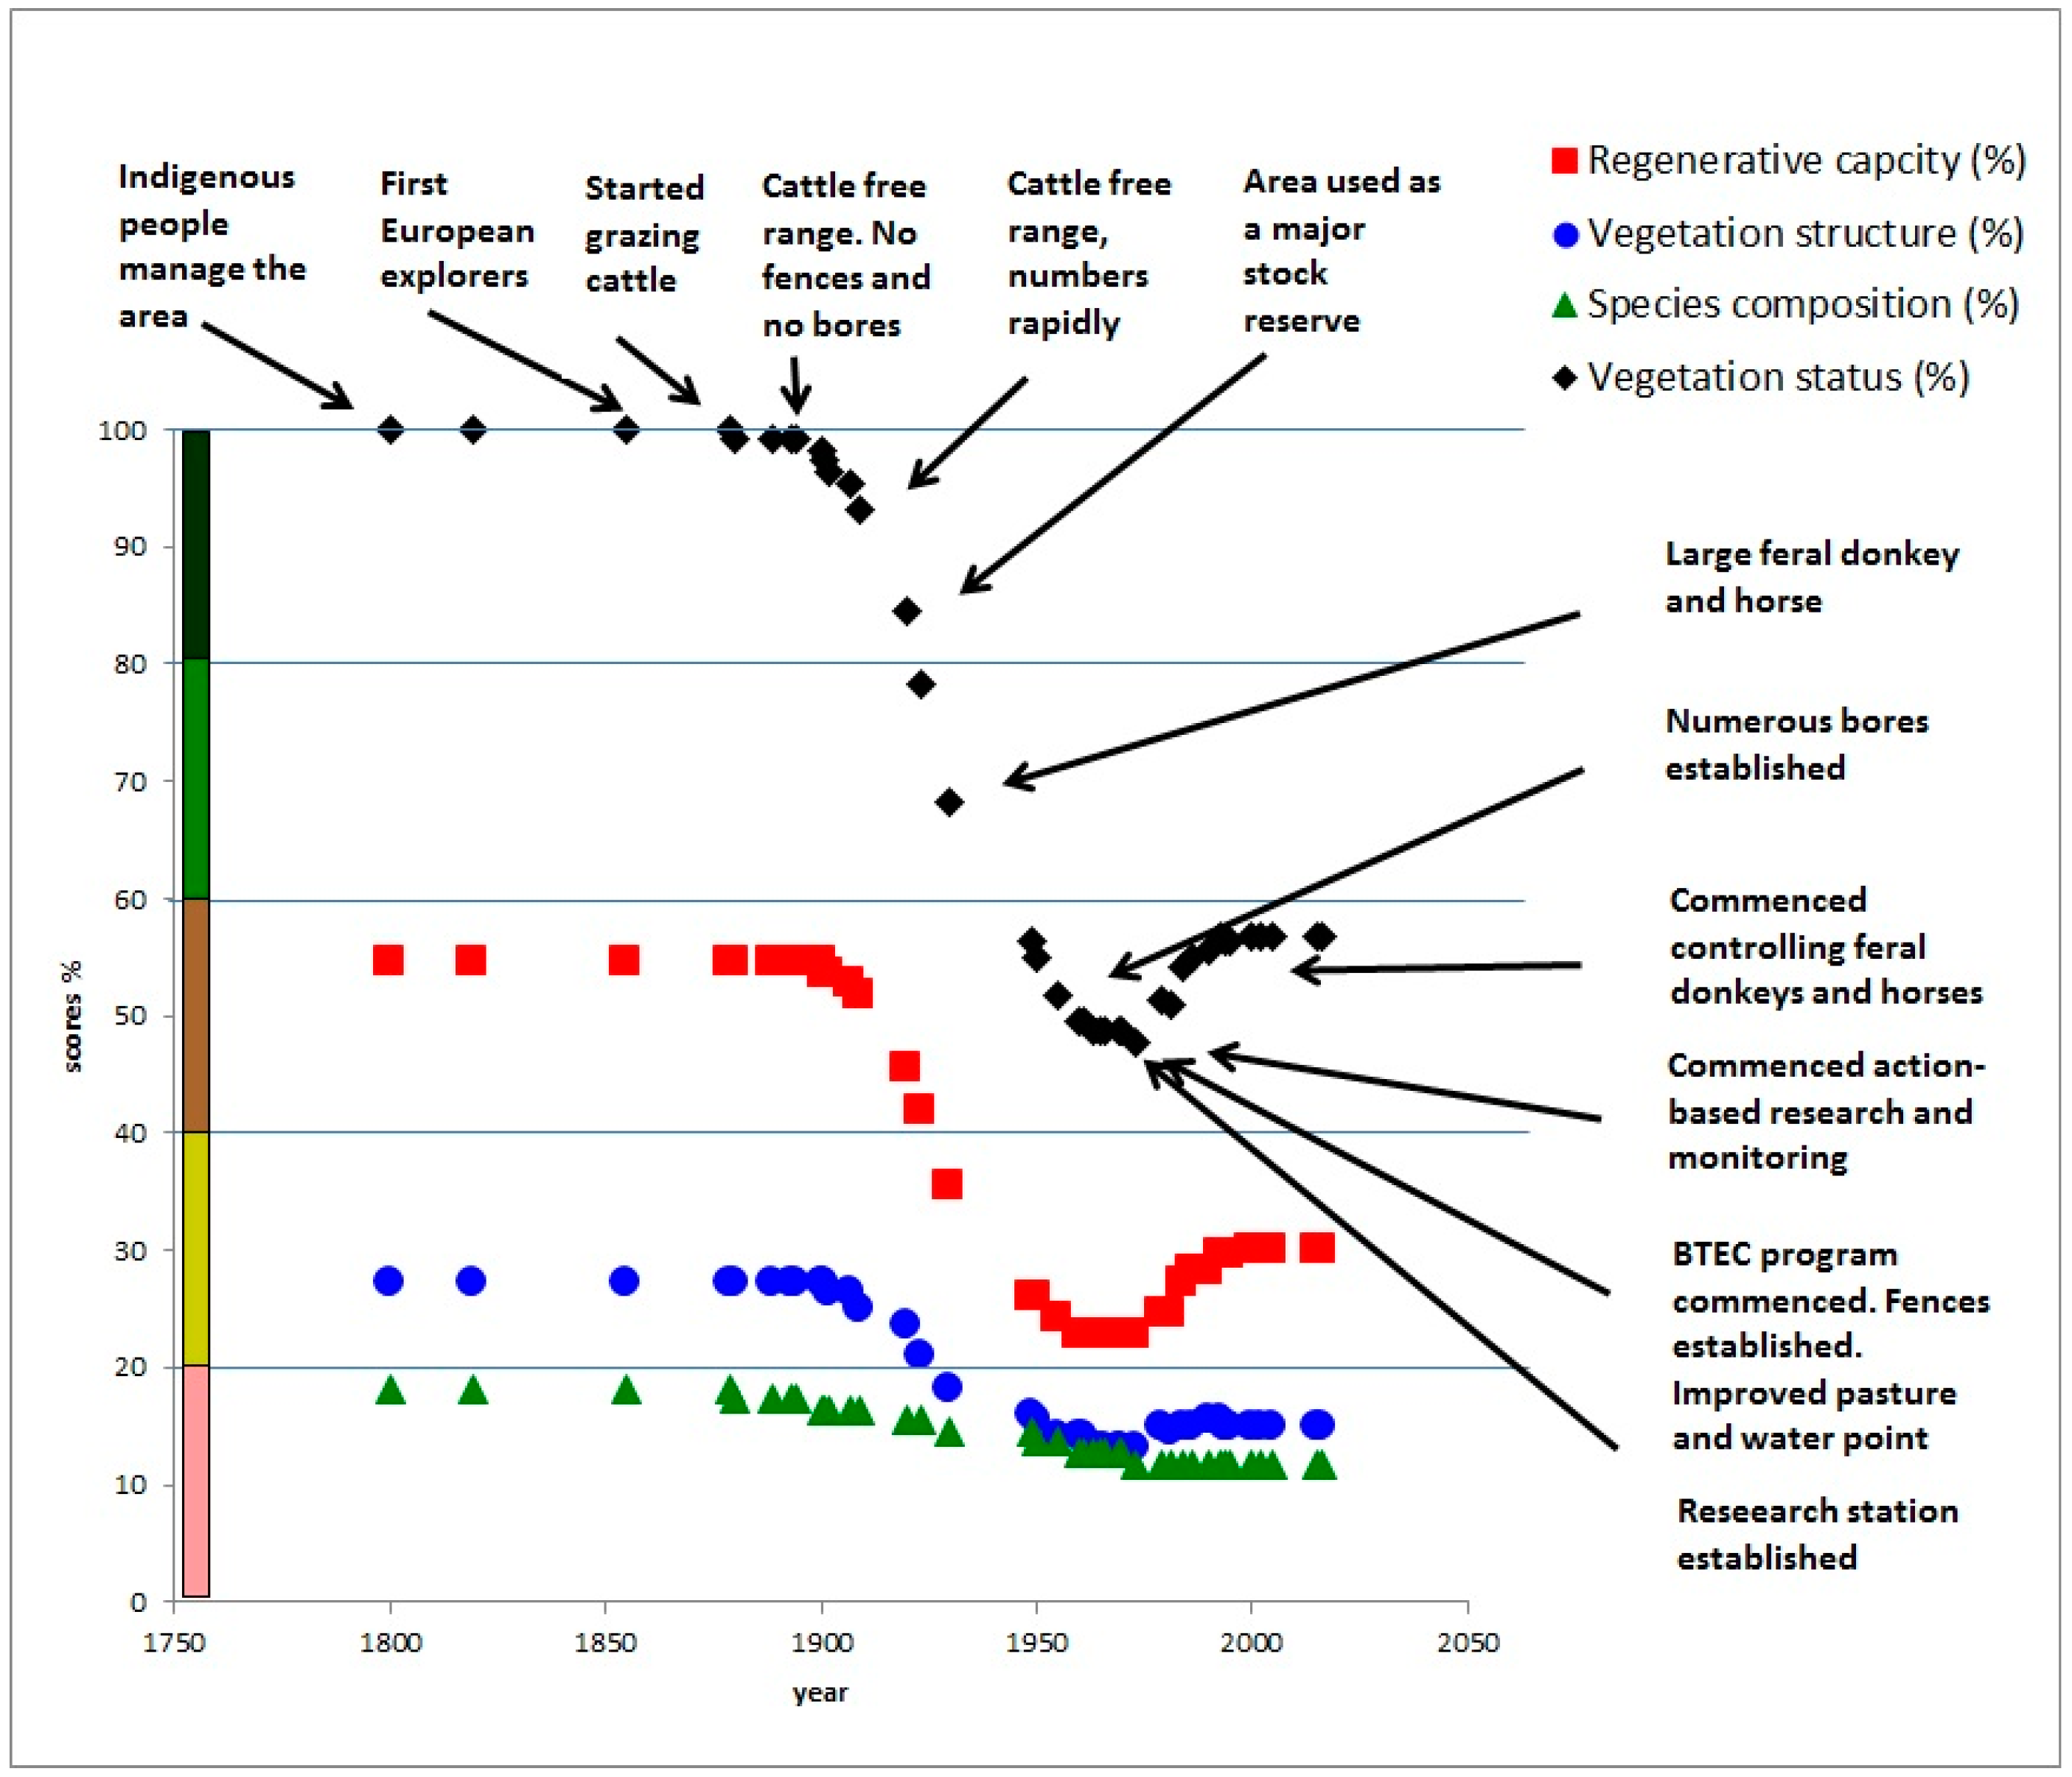
| 7 | Tropical warm season wet, eucalypt open woodland | 50% loss due to livestock and feral herbivore grazing with modest recovery due to improved grazing management and increasing woody cover due to climate change | Government-managed livestock reserve, and subsidies for artificial watering points and fencing, then R&D into improved range management | Domestic and particularly international demand, including live cattle exports | Artificial watering points (bores), then fencing to improve grazing management, improved roads and transport, introduction of Bos indicus breeds of cattle | Large seasonal fluctuations in rainfall affecting livestock and feral herbivore numbers, but overall increasing rainfall over a longer season | Total indigenous displacement by Western European values and land management practices; a conditional land claim was granted in 1990, enabling continued use of the area as a research station |
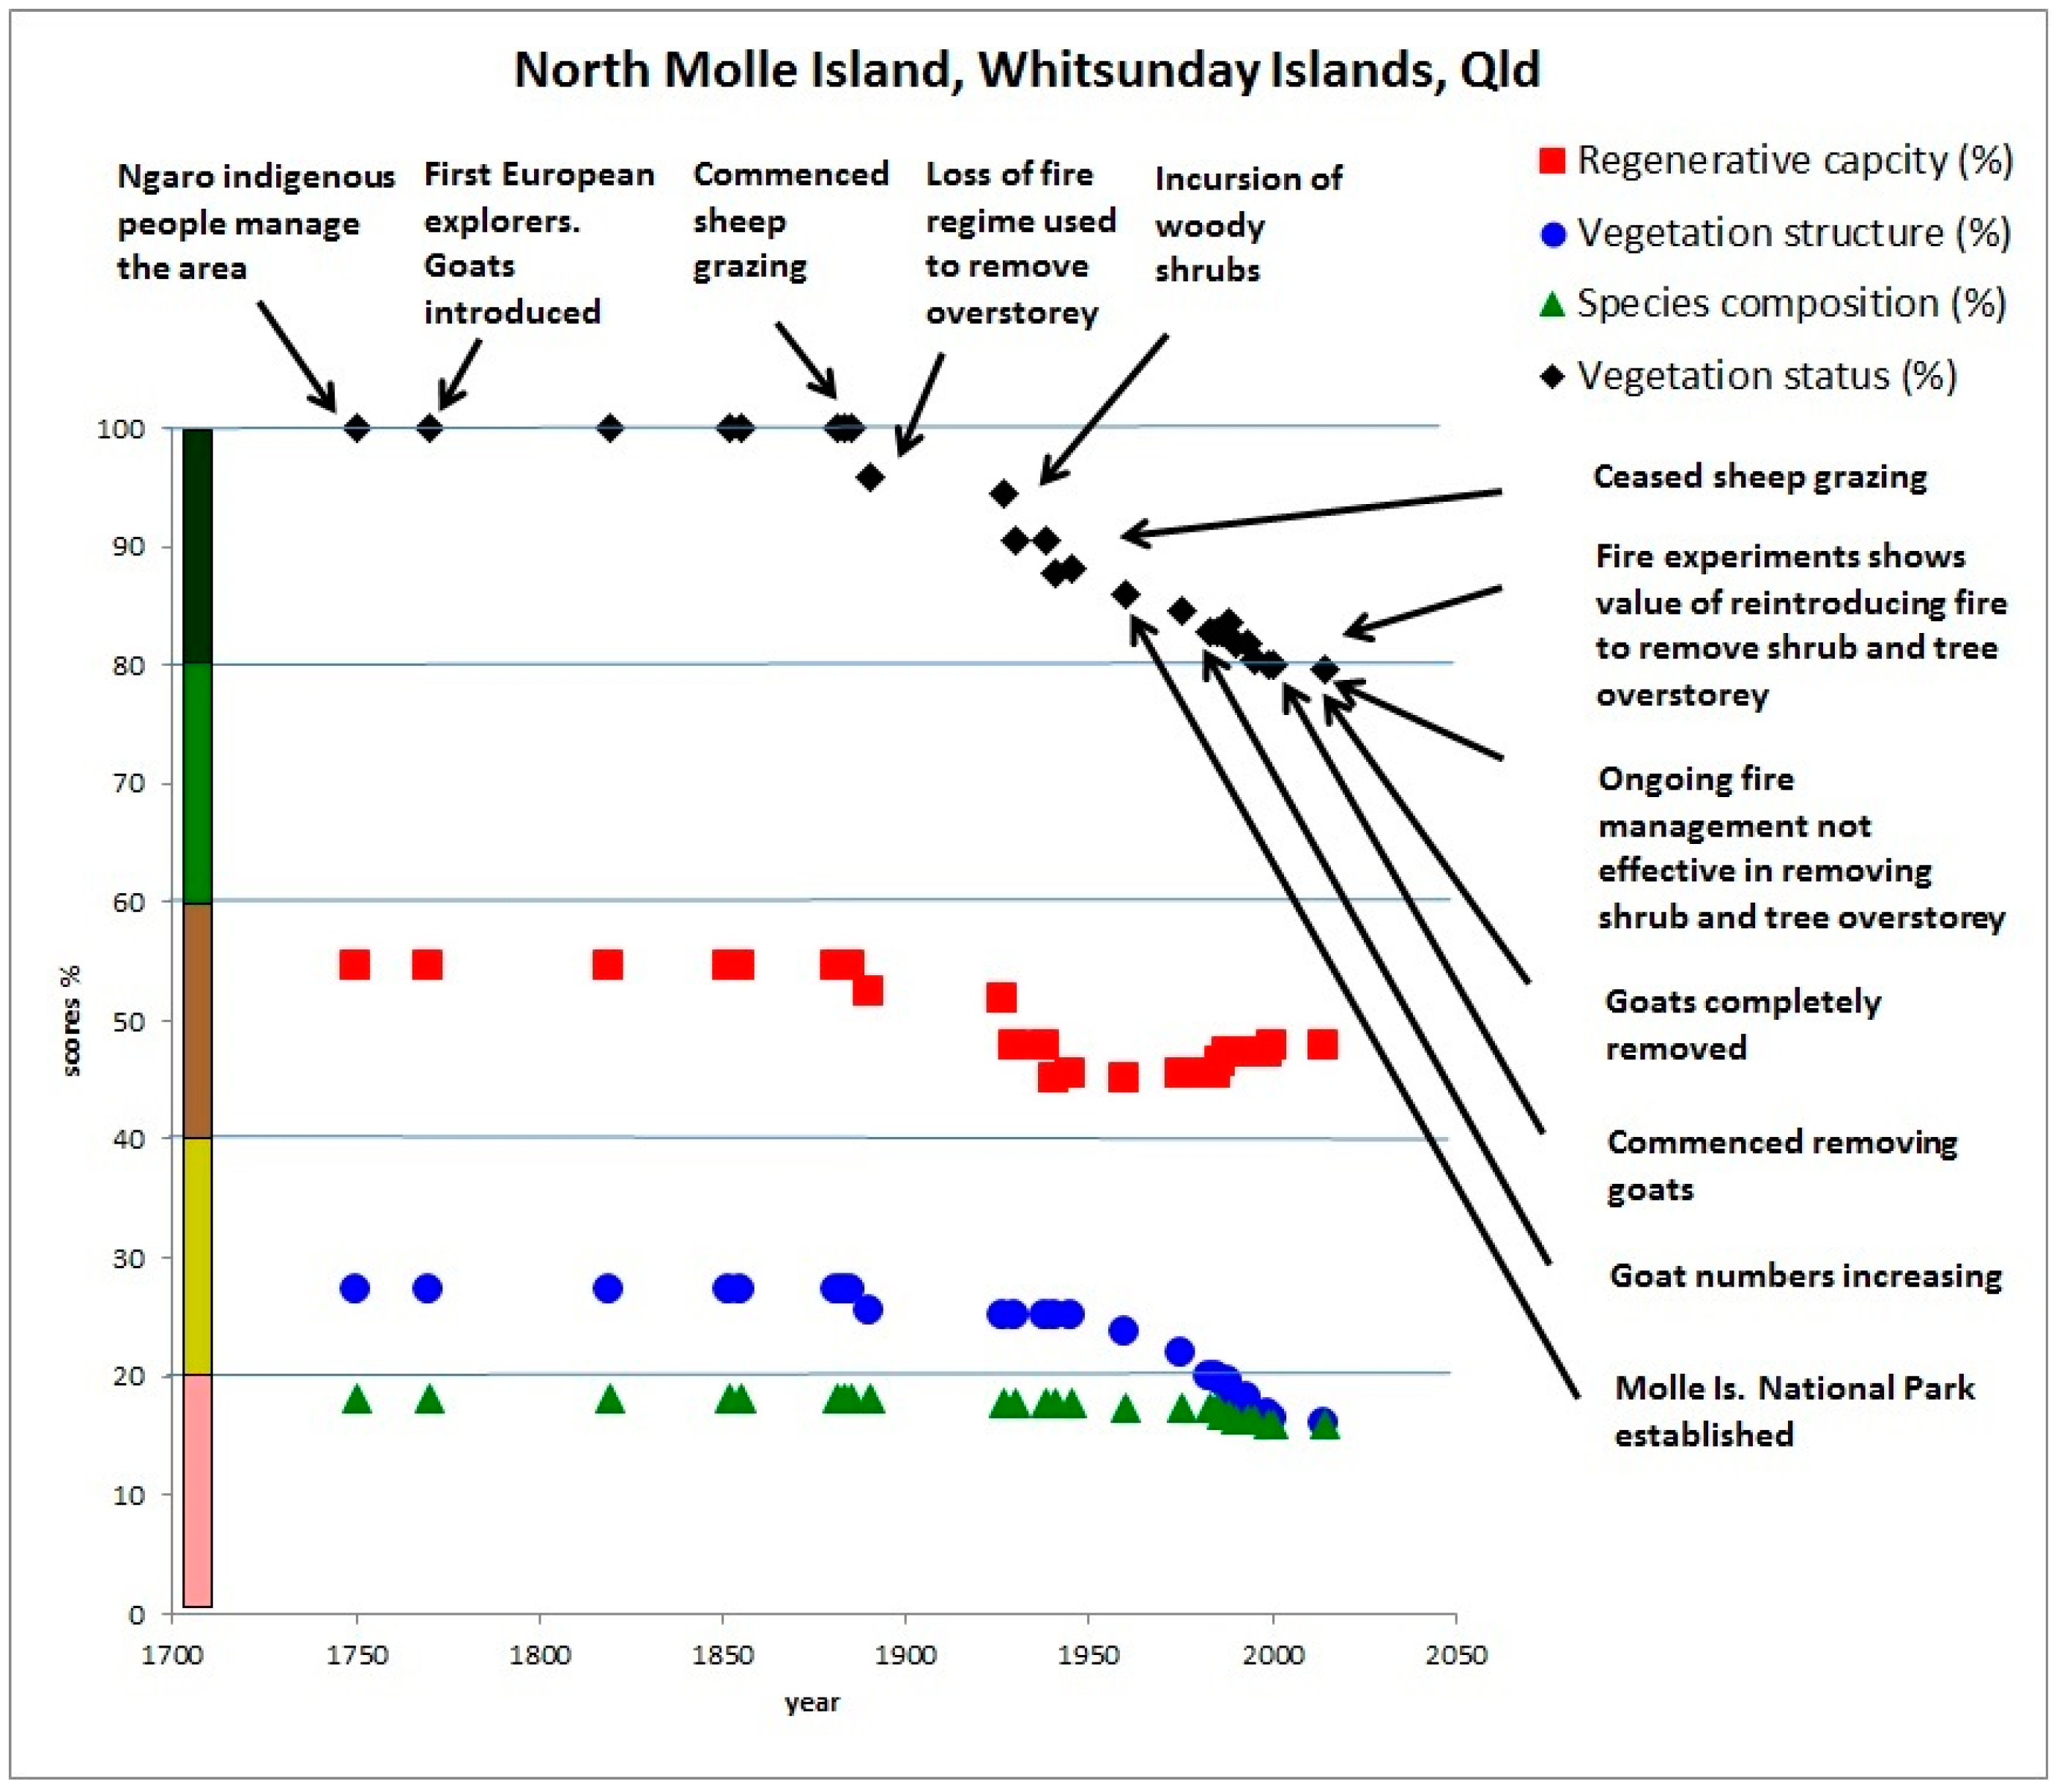
| 8 | Tropical warm season moist, tussock grassland | 20% loss due to loss of Indigenous fire regime that controlled woody cover | National park status declared in 1938, eventual removal of domestic and feral goat grazing pressure | Limited use by domestic livestock for local consumption | Aerial incendiaries applied, but with limited success in reducing woody cover | Limited impact of seasonal variations | Total indigenous displacement by Western European values and land management practices |
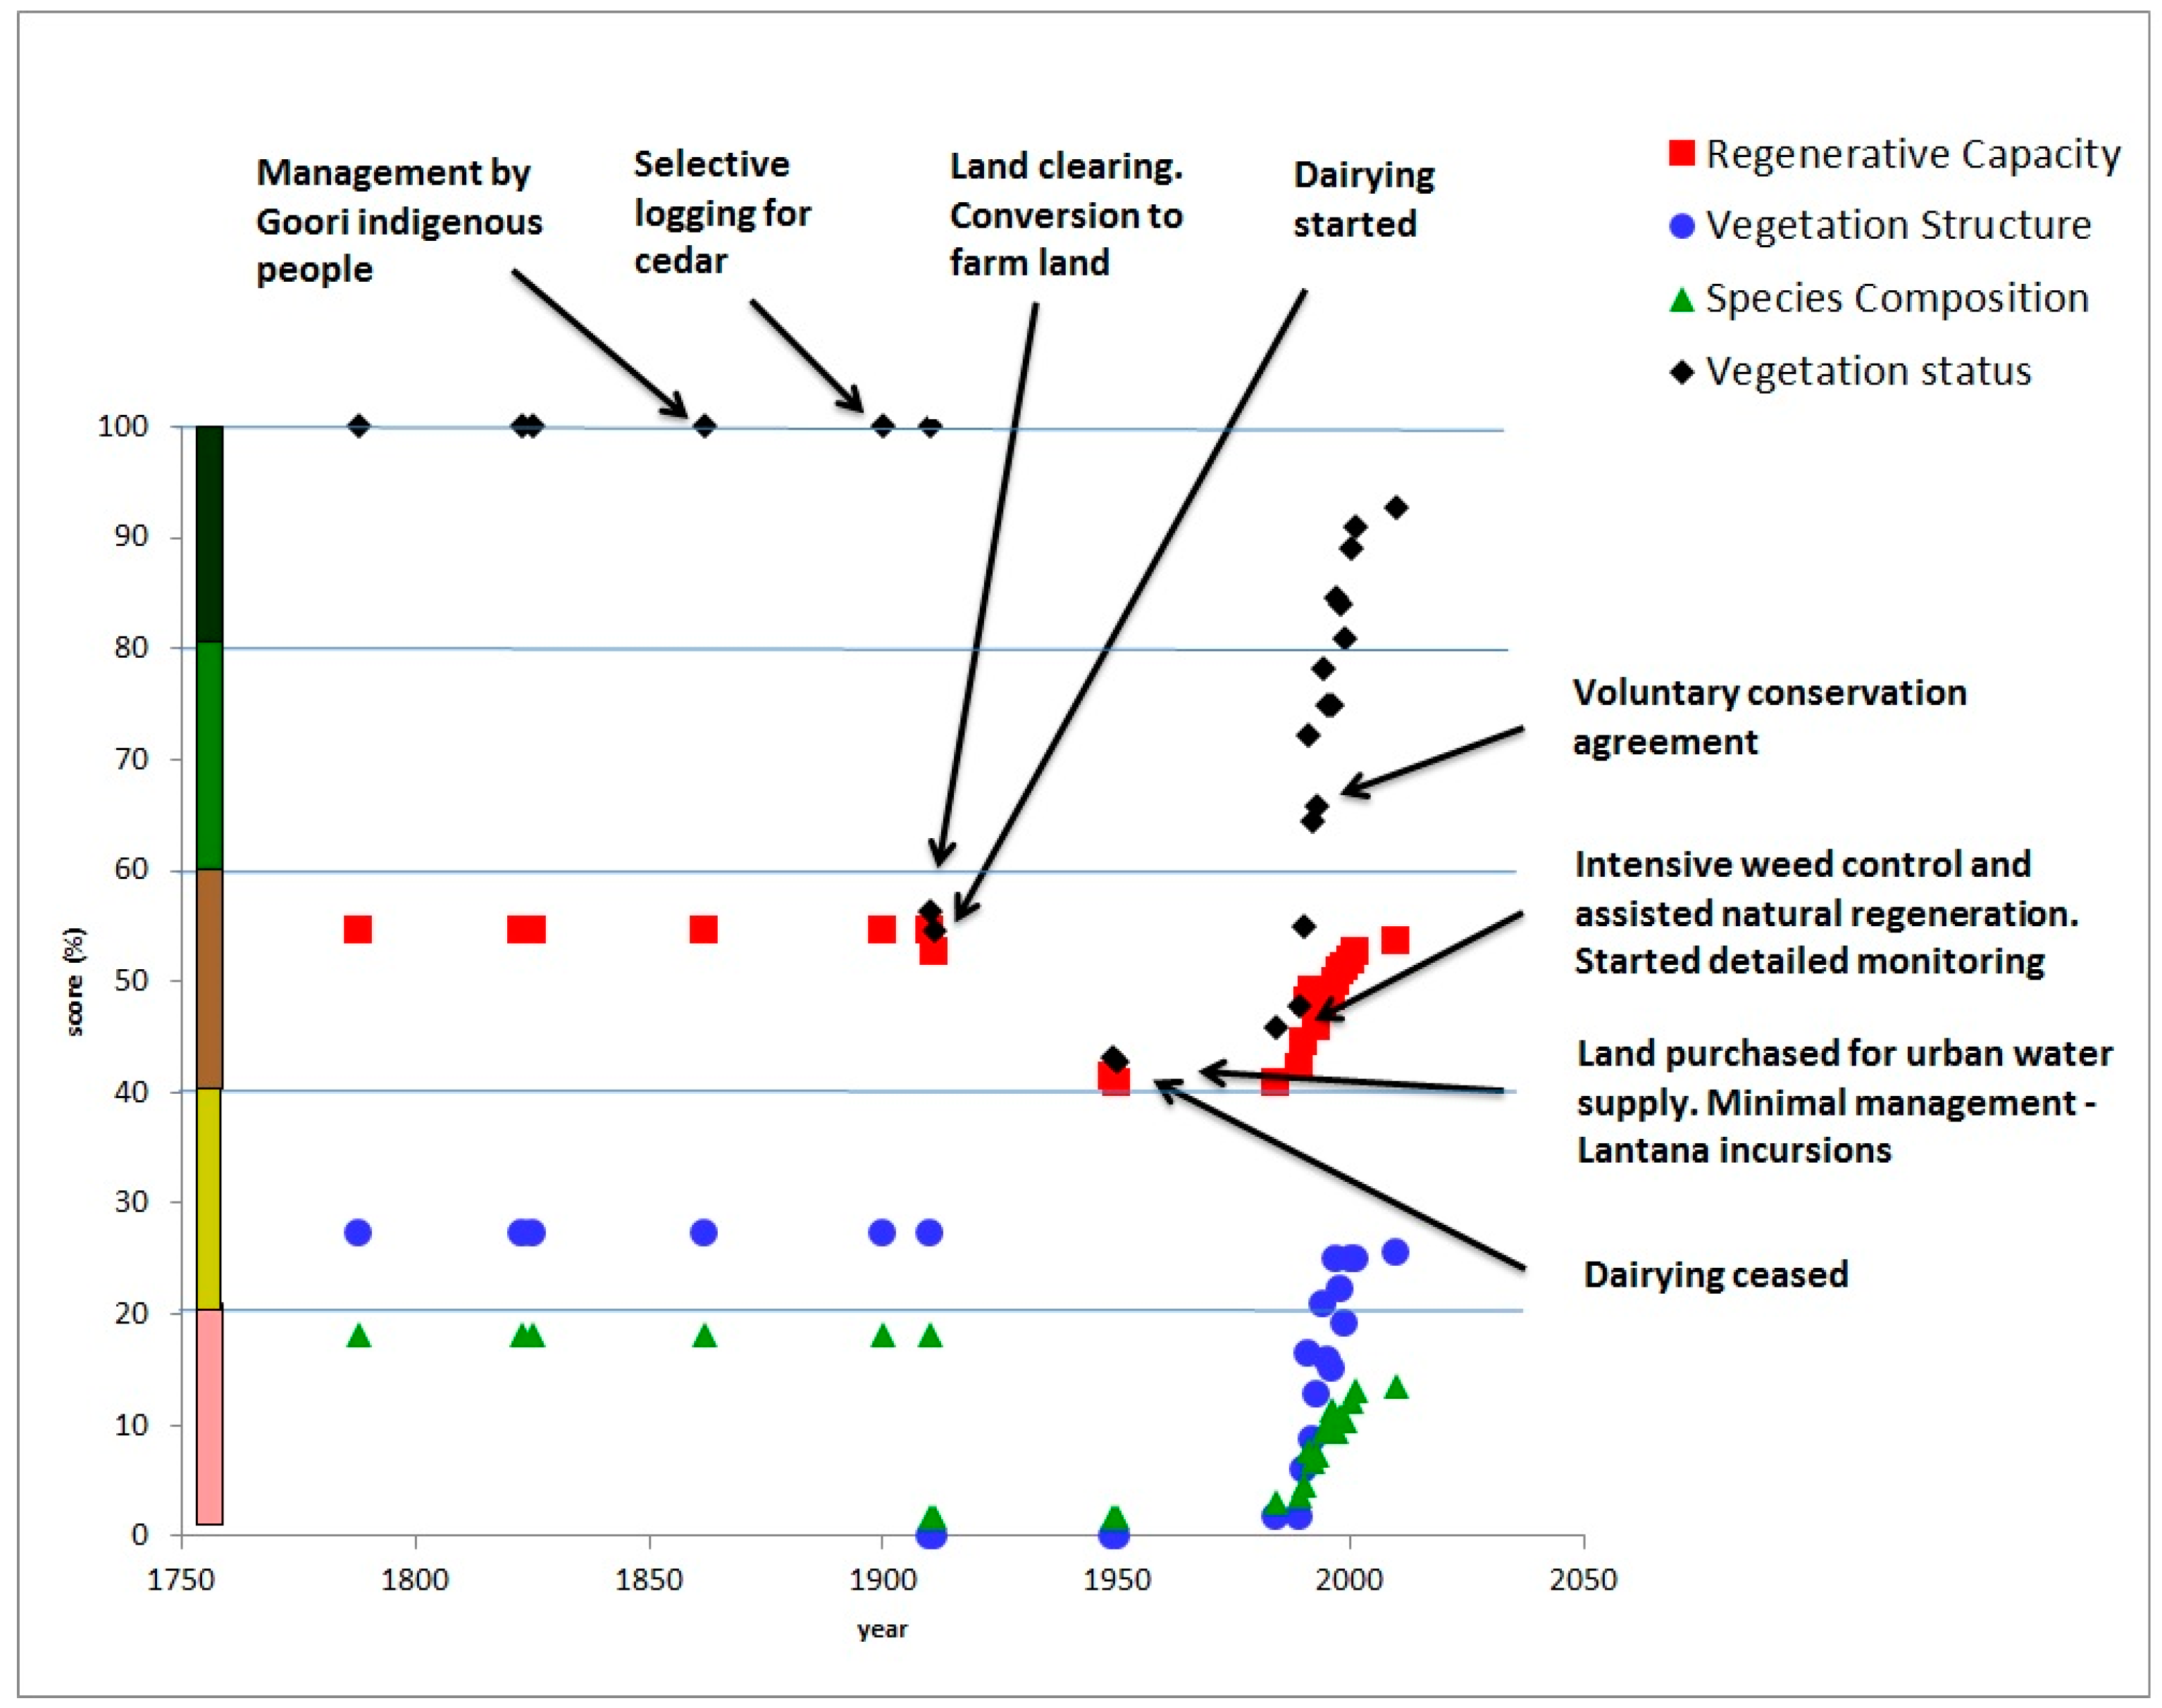
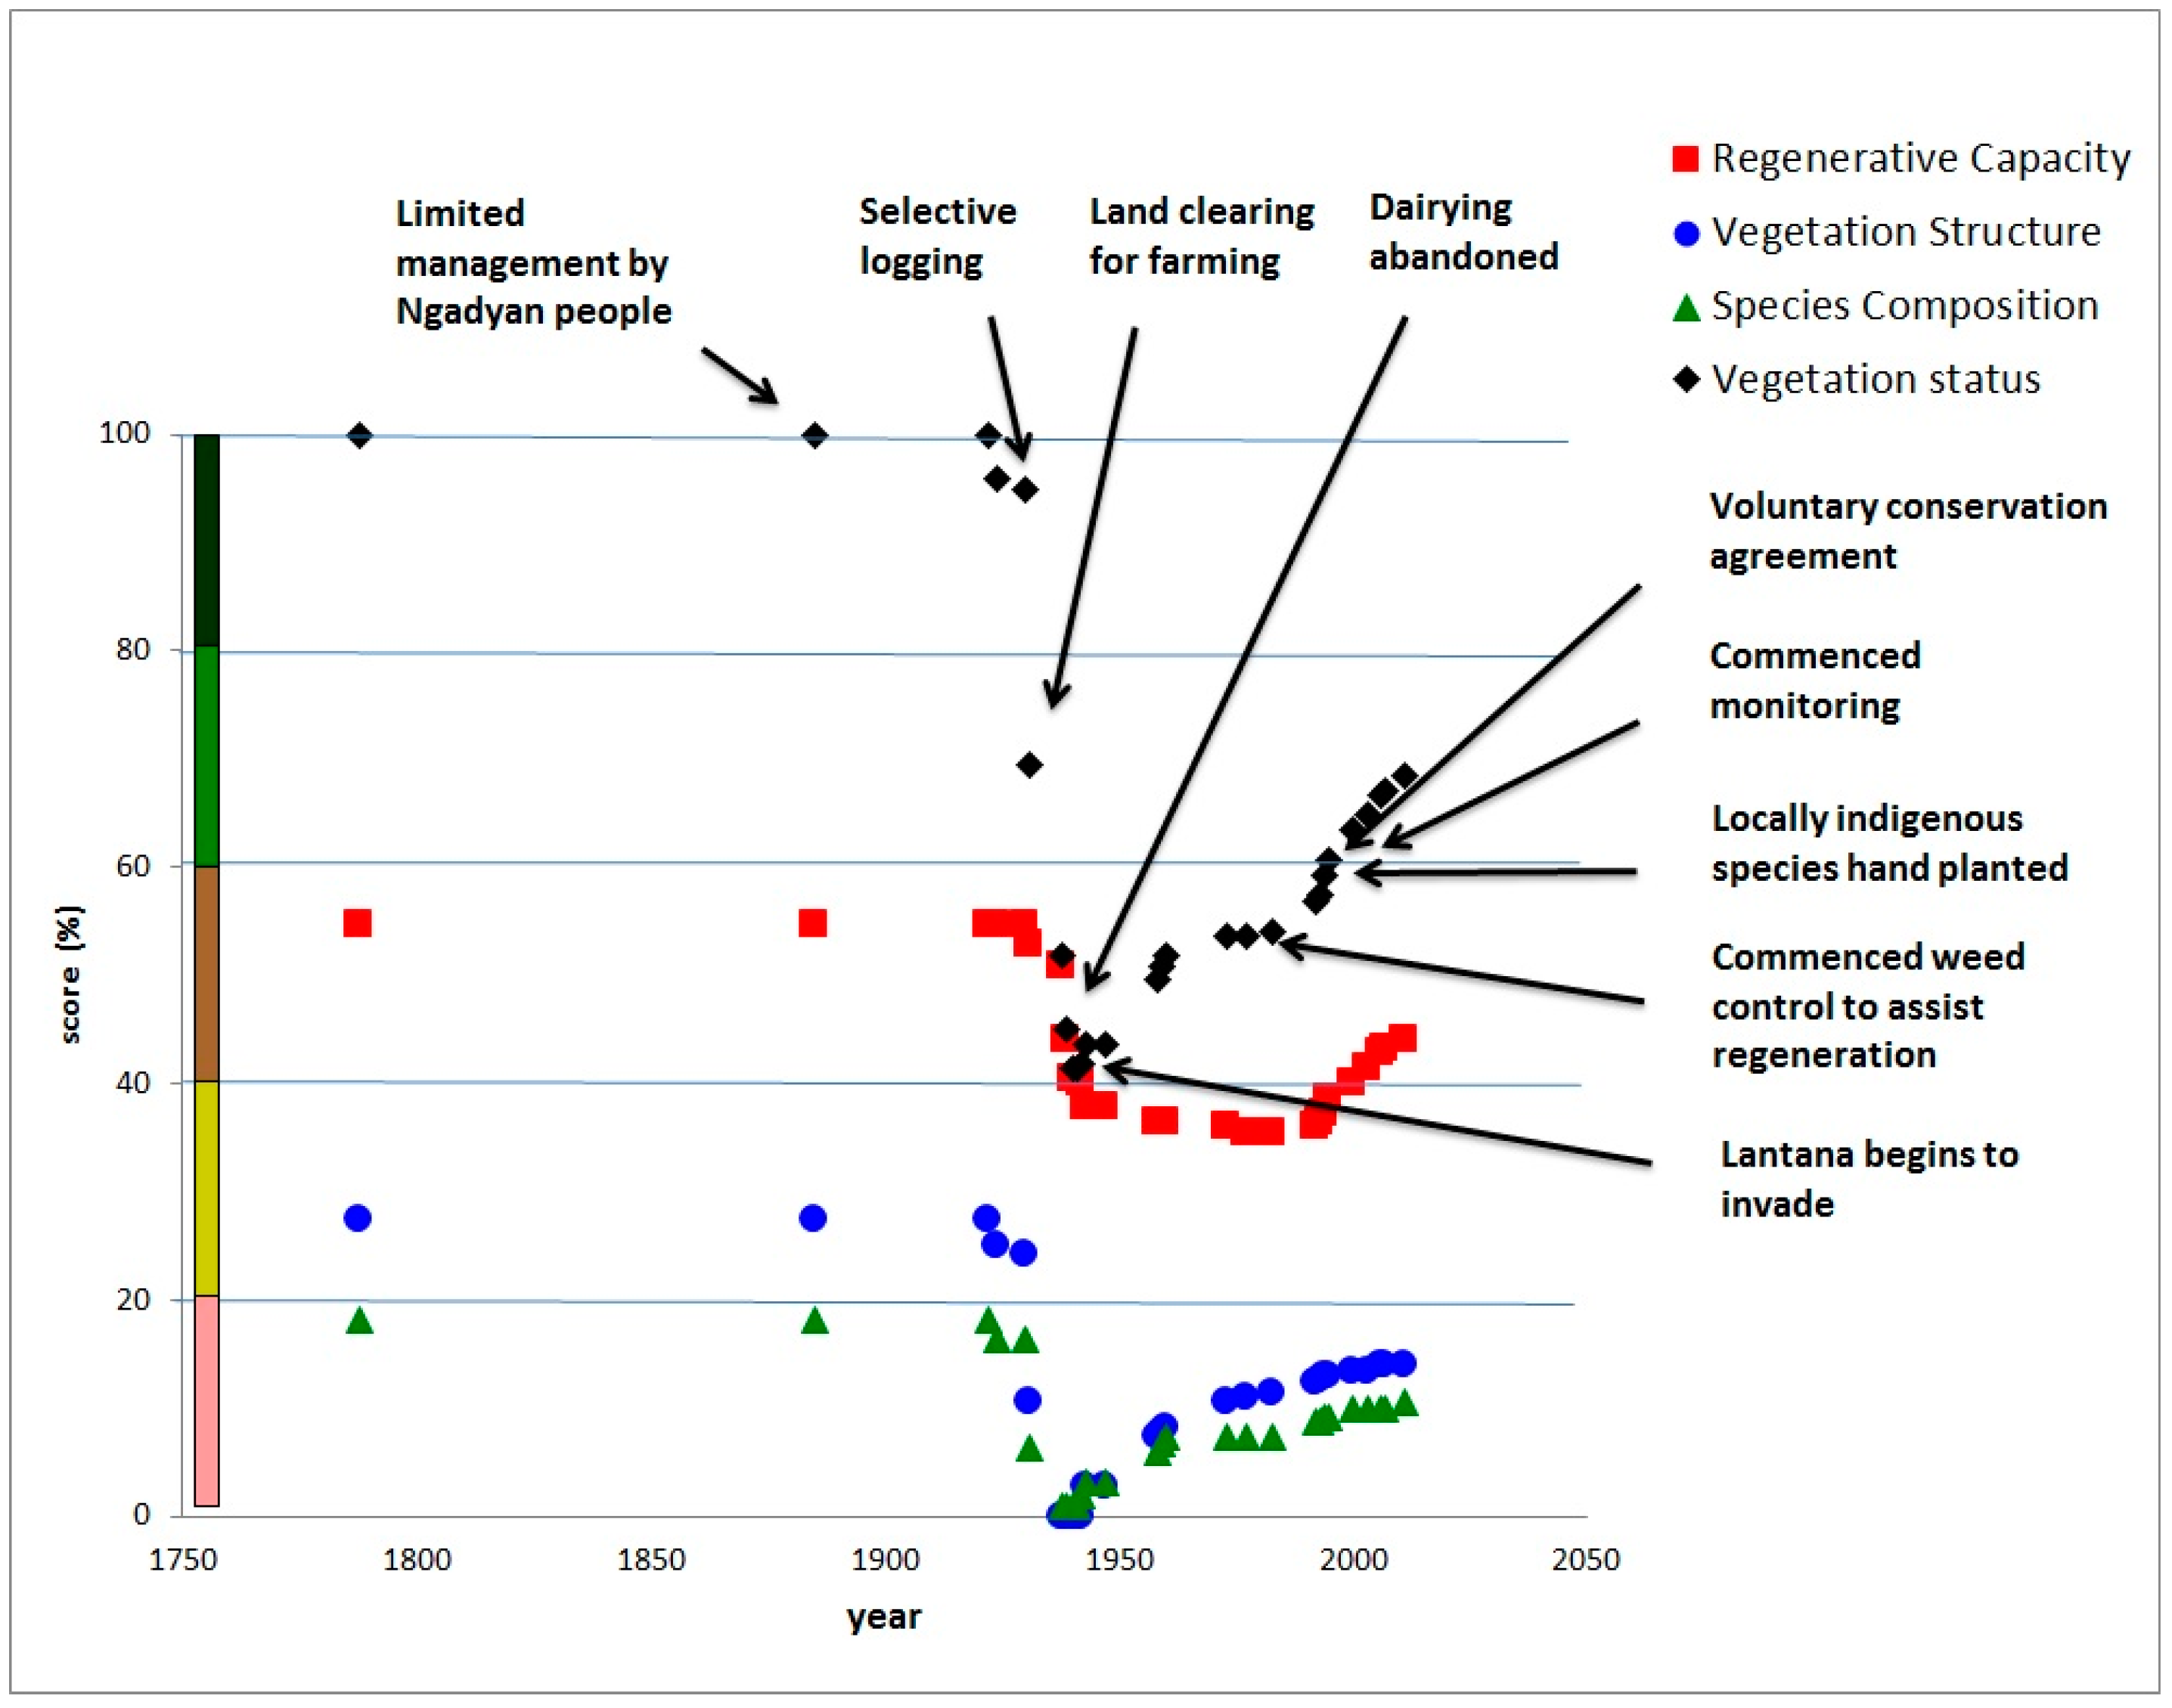
| 9 | Tropical wet, vine forest | 60% loss due to land clearing, then moderate recovery by passive and active restoration | State government land development policies that promoted land clearing for dairy, but more recently, site declared a nature refuge, providing public and private benefits | Initially demand for high value tropical timbers, then domestic dairy production and subsequent collapse due to high costs | Introduction of exotic pasture grasses and dairy production system, including fertilizers and lime, then modest demand for ‘life-style’ blocks of land with new owners passionate about restoration | Very high annual rainfall accelerated soil erosion and fertility decline, though this rainfall also supported rapid ecological restoration | Total indigenous displacement by Western European values and land management practices |
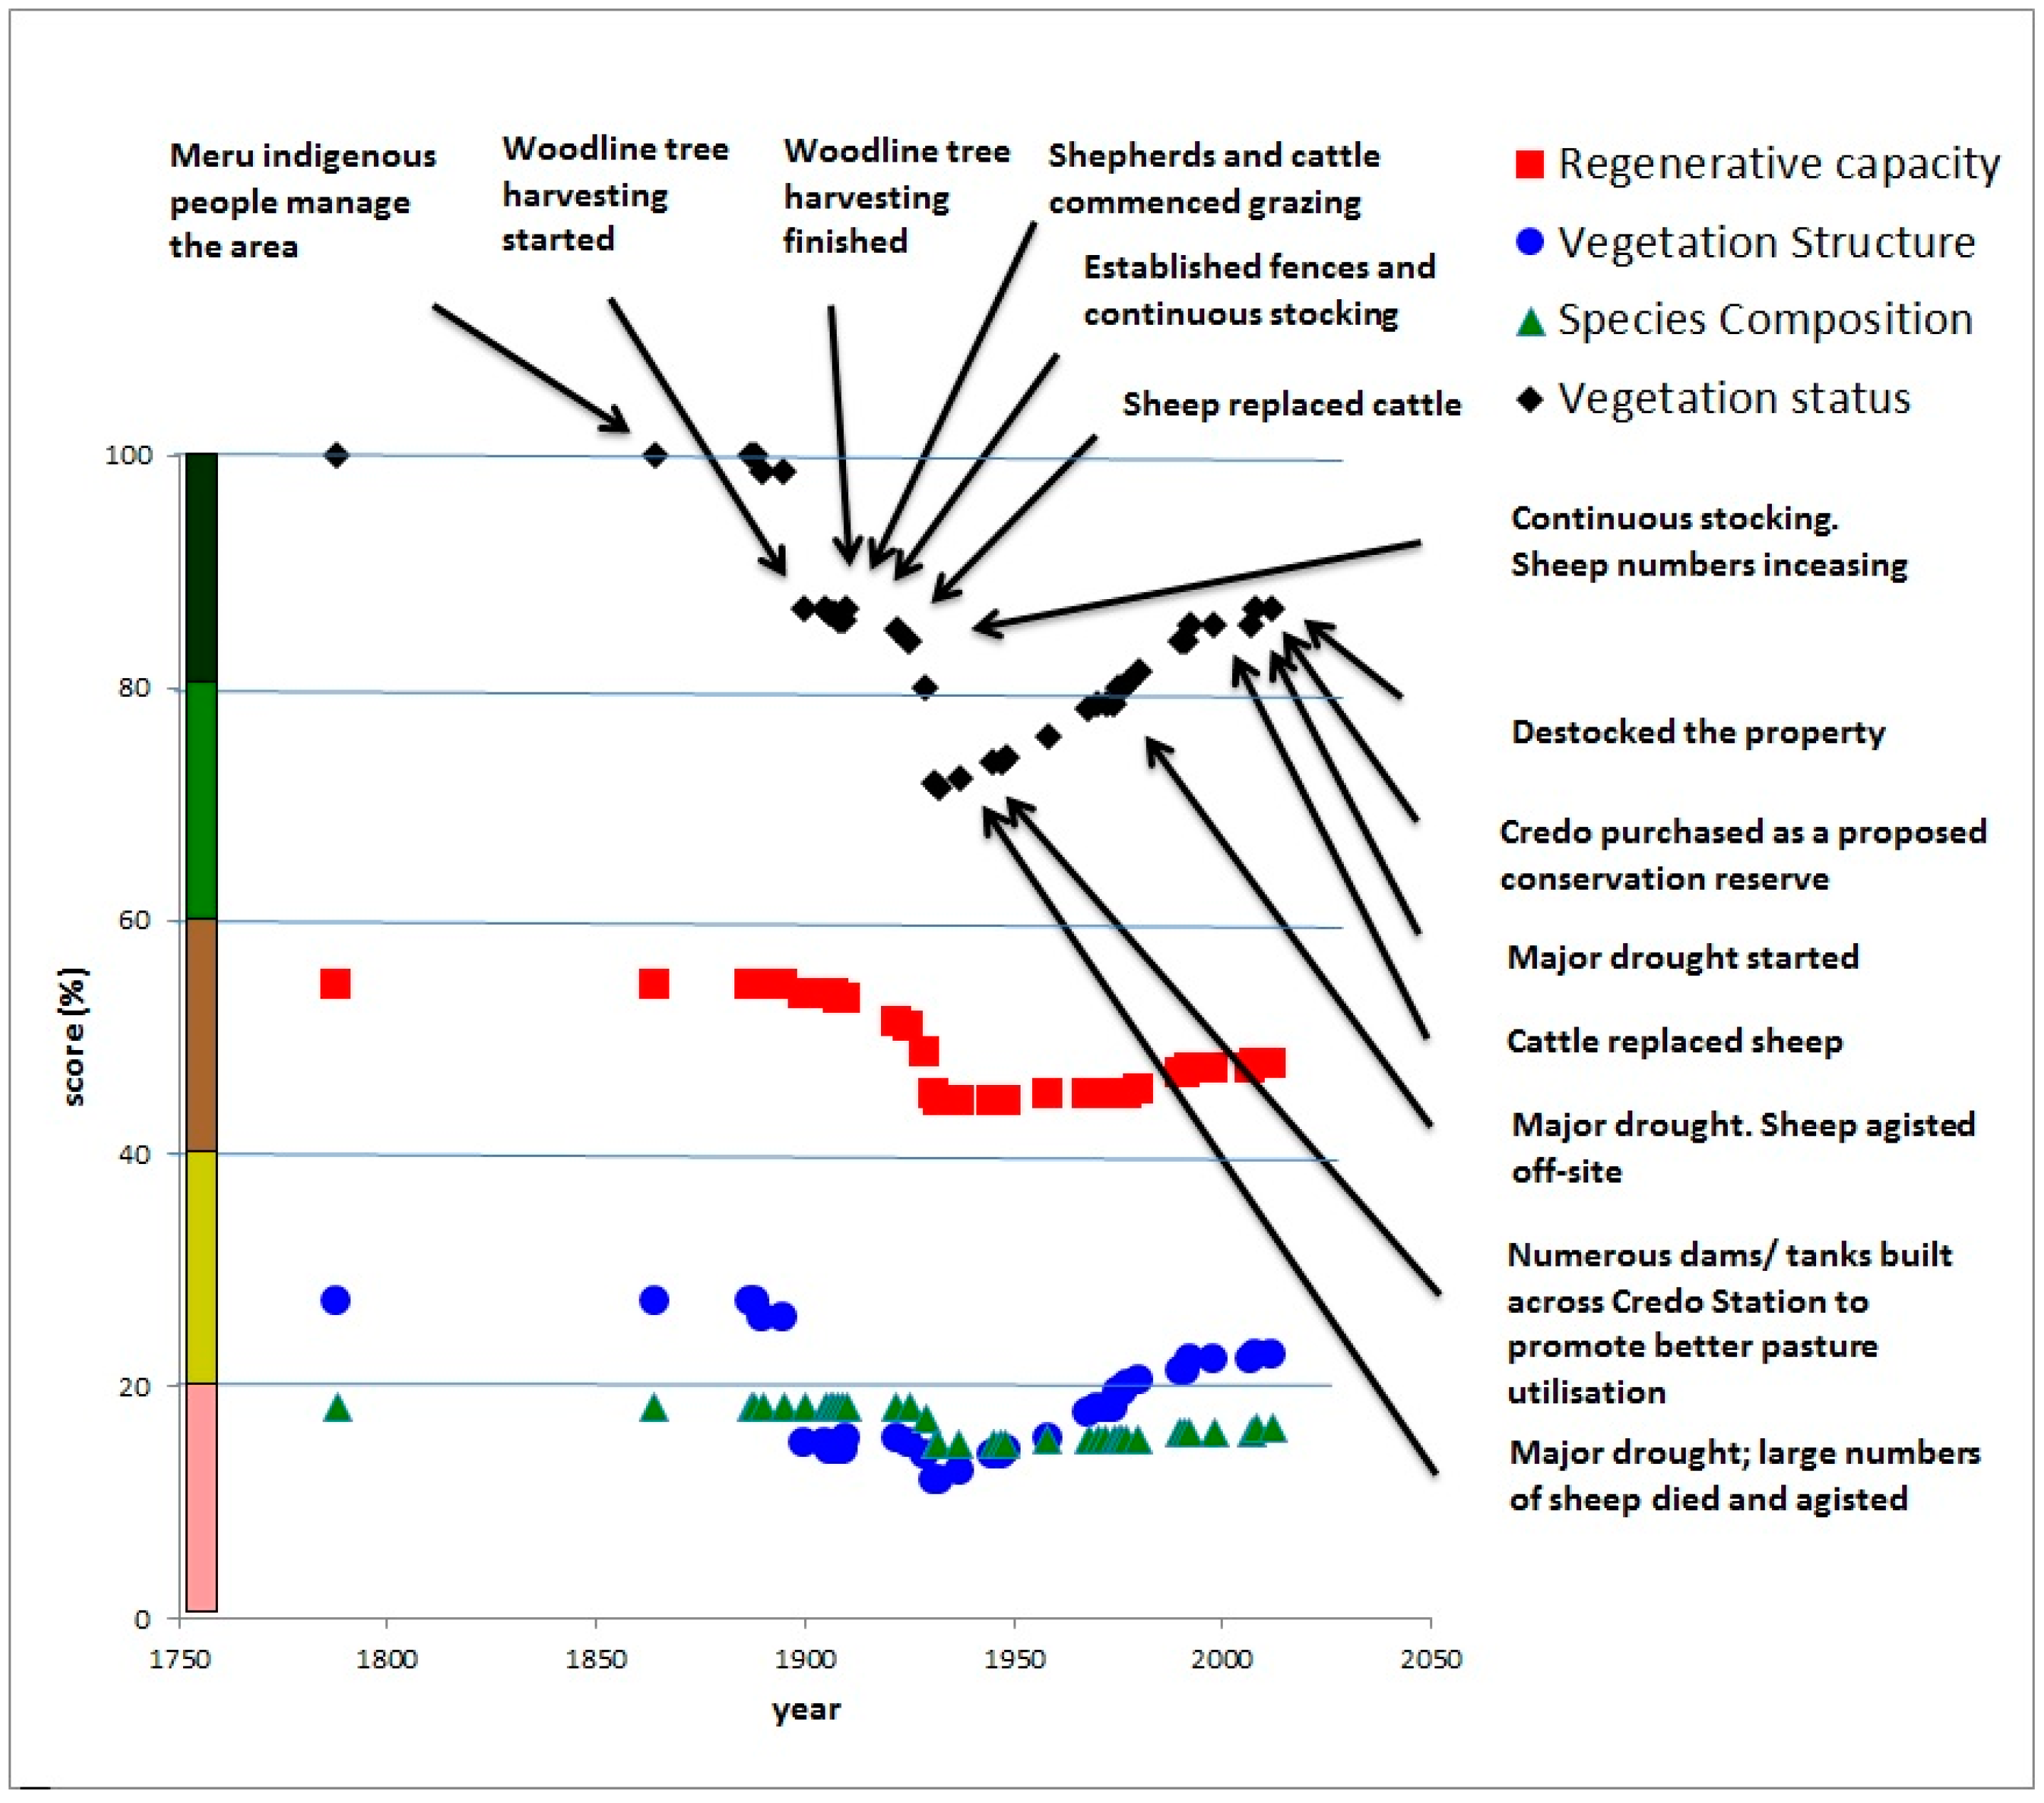
| 10 | Dry, eucalypt woodland | 30% loss due to timber harvesting and livestock grazing, then modest recovery due to improve grazing management | Recently purchased by state government as a proposed conservation reserve | Global demand for minerals requiring timber for smelting, then demand for meat and wool | Smelting technologies requiring timber for fuel, fencing, artificial watering points, domestic livestock | Periods of drought requiring artificial sources of water for livestock (bores and troughs) | Total indigenous displacement by Western European values and land management practices |
© 2016 by the authors; licensee MDPI, Basel, Switzerland. This article is an open access article distributed under the terms and conditions of the Creative Commons Attribution (CC-BY) license (http://creativecommons.org/licenses/by/4.0/).
Share and Cite
Thackway, R.; Freudenberger, D. Accounting for the Drivers that Degrade and Restore Landscape Functions in Australia. Land 2016, 5, 40. https://doi.org/10.3390/land5040040
Thackway R, Freudenberger D. Accounting for the Drivers that Degrade and Restore Landscape Functions in Australia. Land. 2016; 5(4):40. https://doi.org/10.3390/land5040040
Chicago/Turabian StyleThackway, Richard, and David Freudenberger. 2016. "Accounting for the Drivers that Degrade and Restore Landscape Functions in Australia" Land 5, no. 4: 40. https://doi.org/10.3390/land5040040