Article

The Influence of Forest Management Regimes on Deforestation in a Central Indian Dry Deciduous Forest Landscape

1
Ashoka Trust for Research in Ecology and the Environment (ATREE), Royal Enclave, Sriramapura, Jakkur Post, Bengaluru 560 064, Karnataka, India
2
Manipal University, Manipal, Udupi 576 104, Karnataka, India
3
School of Development, Azim Premji University, PES Institute of Technology Campus, Pixel Park, B Block, Electronics City, Beside Nice Road, Hosur Road, Bengaluru 560 100, Karnataka, India
4
International Centre for Integrated Mountain Development, G.P.O. Box 3226, Kathmandu, Nepal
*
Author to whom correspondence should be addressed.
Submission received: 9 April 2016 / Revised: 5 August 2016 / Accepted: 5 August 2016 / Published: 12 August 2016

Abstract

:
This research examines the impact of forest management regimes, with various degrees of restriction, on forest conservation in a dry deciduous Indian forest landscape. Forest change is mapped using Landsat satellite images from 1977, 1990, 1999, and 2011. The landscape studied has lost 1478 km2 of dense forest cover between 1977 and 2011, with a maximum loss of 1002 km2 of dense forest between 1977 and 1990. The number of protected forest areas has increased, concomitant with an increase in restrictions on forest access and use outside protected areas. Interviews with residents of 20 randomly selected villages indicate that in the absence of alternatives, rather than reducing their dependence on forests, communities appear to shift their use to other, less protected patches of forest. Pressure shifts seem to be taking place as a consequence of increasing protection, from within protected areas to forests outside, leading to the creation of protected but isolated forest islands within a matrix of overall deforestation, and increased conflict between local residents and forest managers. A broader landscape vision for forest management needs to be developed, that involves local communities with forest protection and enables their decision-making on forest management outside strict protected areas.

Graphical Abstract

1. Introduction

The densely populated landscapes of India pose a challenge for conservation, with high population densities coexisting with bio-diverse, threatened forests. In recent decades, forests across India have witnessed accelerated rates of clearing and degradation [1]. Forest protection within and outside protected areas is threatened by high population densities, high levels of poverty, rapid economic growth, industrialization, and urbanization [2]. Although protected areas have been the cornerstone of Indian conservation efforts, multiple studies indicate that protected areas have become increasingly isolated [2,3]. Such isolation impacts ecological processes of connectivity that are important for long term species survival and persistence [4,5].
The number of protected areas in India has steadily increased from approximately 100 in the 1970s to 657 in 2009, covering 5% of India’s terrestrial area [6]. Along with the increase in the number of protected areas with a large number of villages, relocation of a number of villages from within the protected areas to outside has added to the pressure on forests outside protected areas [6]. As parks expand in area, increase in number, and restrict the use of forest products within these protected areas, forests outside protected areas are being increasingly used by forest dependent communities [7,8]. These forested landscapes are multifunctional, providing livelihood and cultural support to the local communities, and are also used by the state for revenue generation. Dewi et al. (2013) [9] have shown that protected areas are surrounded by these multifunctional forested landscapes, where deforestation and fragmentation is high due to economic, social, urbanization, and industrial pressure. Conserving forests outside protected areas is important, as they act as corridors for wildlife movement, but these forests are undergoing rapid change, especially in densely populated countries like India where there is substantial economic and political pressure on forests [2,10,11]. Studies have shown that institutional processes of governance play an important role in the management of forest patches within as well as outside protected areas [12,13].
A large proportion of India’s forest land is located outside the protected area network [2,10]. These forests are also legally under the formal control of the Indian Forest Department, mostly managed under the Reserved Forest and Protected Forest category. However, many forest patches are also informally managed by local communities through informal institutions such as sacred groves, as well as by traditional norms that circumscribe hunting and harvesting of forest resources [14]. Recently, through the Joint Forest Management (JFM) and the Indian Forest Rights Act, local communities have received partial de jure (formal) rights to access and maintain forest patches [12,15]. However, community struggles over forest resource use continues, because of inadequate policy support, and due to poor implementation [15,16]. Forest areas form landscapes of contrast, where long standing traditional institutions of forest management coexist with large scale forest logging, and strictly managed protected areas are located alongside clearings for large infrastructure projects [15,17].
An examination of the overall picture of forest management in India over several decades [18] reveals a steady increase in the number of protected areas, and in the restrictions on use of the forest by local communities within protected areas. In forests outside protected areas as well, there is a visible influence of the Forest Department in the management of forest resources through measures such as plantation projects, JFM policies, and park buffer zone management, enforced by the routine monitoring of forest guards [19]. These interventions have led to increase in restrictions on forest use by local communities [20]. These have also led to a deterioration in indigenous norms and local institutions, as policy makers have neglected the intrinsic motivation and traditional norms of communities [21]. The policy and institutional environment for forest governance is thus highly challenging in the Indian context. High population densities around forests, as well as the high dependence on forests for livelihoods, require conservation policies to work with local communities for maximum effectiveness. Greater connectivity cannot be provided solely by expansion of the protected area network, given constraints on land availability [22]. Conservation needs to encompass a diversity of mechanisms for forest protection, from strict conservation to engagement with local communities [23,24]. Therefore, a landscape level study on a large scale, encompassing multiple forest management regimes, will help to understand the impact of policy interventions on forest land use and land cover change.
The objective of this study is, therefore, to understand the change in the forest cover within and outside protected areas in a larger forested landscape, which is governed by a variety of different management regimes. We seek to use forest management regimes as a proxy to understand deforestation and degradation process in this area, and to relate these to the social consequences of strict conservation, in an effort to understand the implications for forest policy.
This study also contributes to the societal applications of remote sensing for land change research, by examining the impact of changing forest management regimes on forests in a dry deciduous forested landscape in India using satellite remote sensing. Remote sensing and GIS techniques enable us to study land use and land cover change at large scales that otherwise requires extensive field data collection across decades [25]. The effectiveness of forest polices on conservation can be studied using remote sensing techniques, integrated with field information on the social and ecological context [26]. Landsat images, freely available from the United State Geological Survey (USGS), provide an invaluable uninterrupted archival dataset from the 1970s that is relatively easy to process and analyze. Remote sensing methods are particularly valuable for studies in inaccessible terrain, whether for reasons of security of access or physical constraints of inaccessibility. They permit the rapid and relatively inexpensive analysis of data across large spatial scales and long timeframes with reliable accuracy [27].
We assess forest changes over three decades from 1977 to 2011, using satellite remote sensing combined with GIS maps of forest management boundaries, relating different categories of forest protection to forest change outcomes. Based on information obtained from twenty villages that are representative of the diversity in population and forest access, we further investigate the impacts of forest management on local tribal communities inhabiting this landscape.

2. Materials and Methods
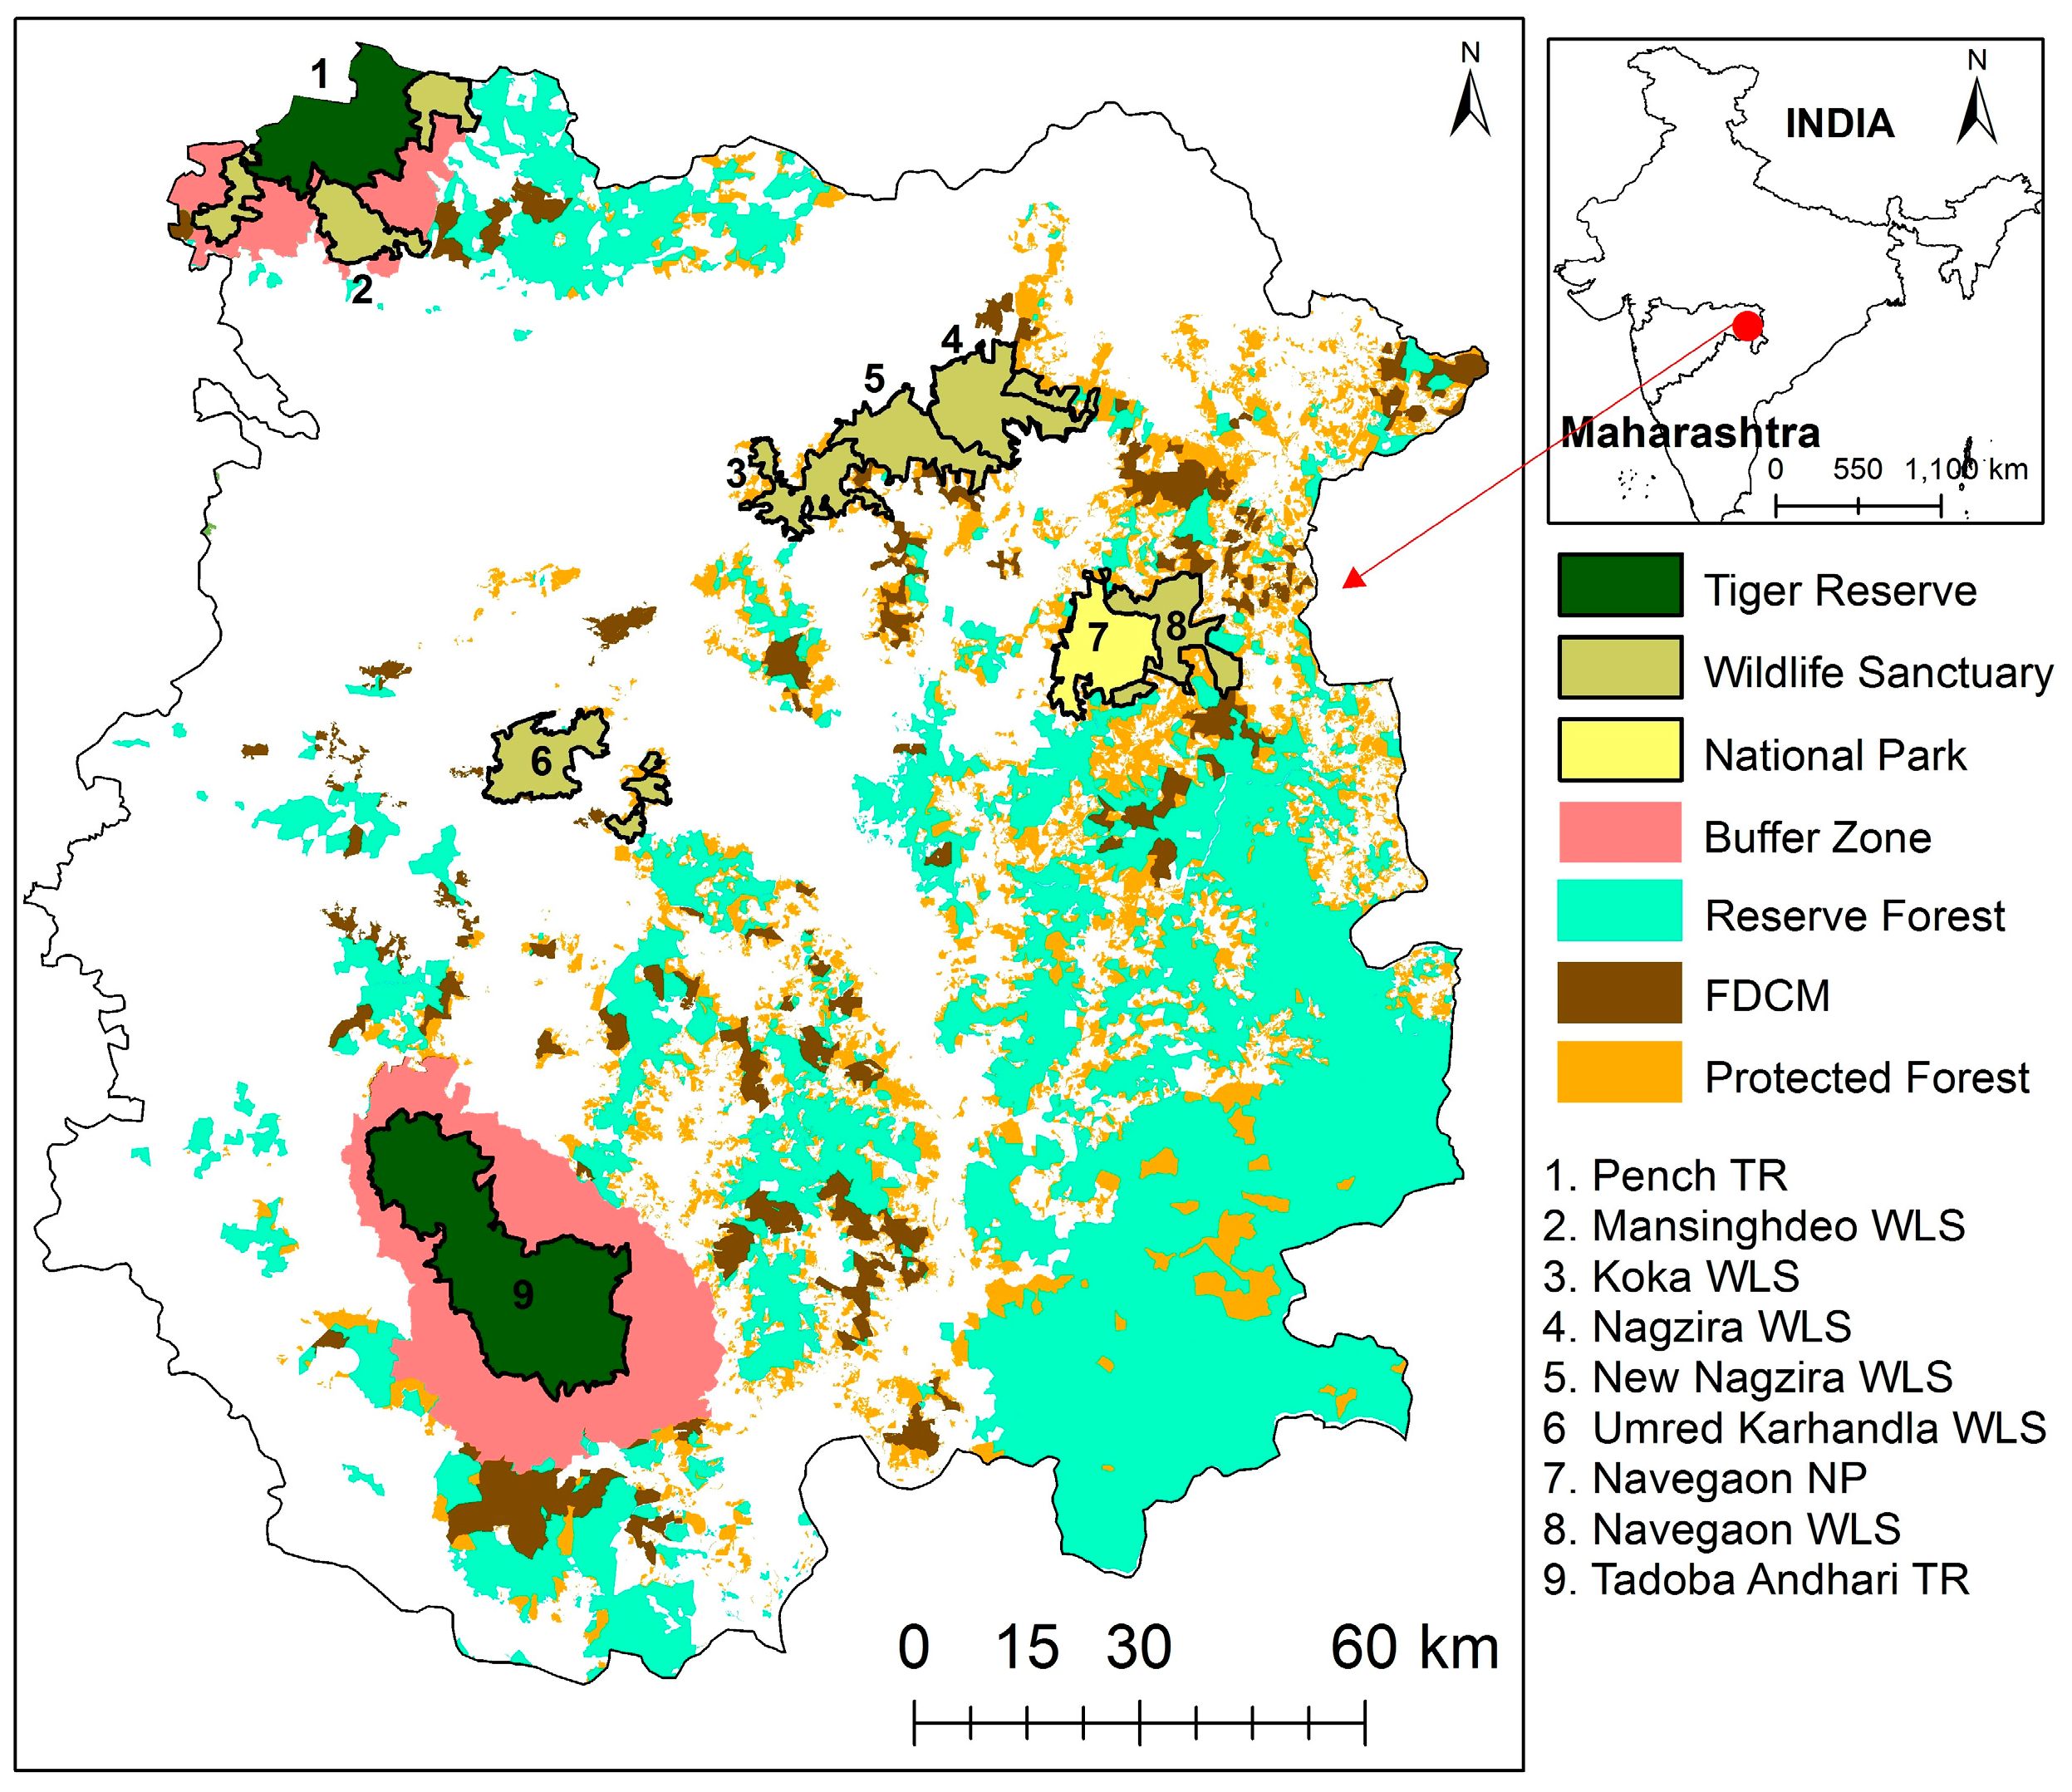
2.1. Study Area

The study was conducted in a dry deciduous central Indian forest landscape connecting two important tiger reserves (TRs) of central India: Pench and Tadoba Andhari Tiger Reserve, in Eastern Maharashtra. There are nine protected areas in the selected region with the two Tiger Reserves, six Wildlife Sanctuaries (WLSs), and one National Park (NP) (Figure 1), which covers around 17% of the total forest area in this region. The total forest area in this region is around 11,000 km2 out of which around 1350 km2 is covered by protected areas and the rest of the forest area acts as the corridor, which connects these protected areas. There are a range of formal institutional arrangements including tiger reserves, wildlife sanctuaries, and national parks under the protected areas (Table 1 and Figure 1). The Forest Department also maintains the forests outside the protected areas under categories such as Reserve Forest and Protected Forest. Some forest patches are managed by the Forest Development Corporation of Maharashtra for commercial, rotational harvest (Table 1 and Figure 1). The population density is about 250 people/km2, of which 33% of the population belongs to tribal communities [28]. A large proportion of tribal and nontribal communities that live near the forest are highly dependent on the forests for subsistence and economic livelihoods.

2.2. Data Processing and Analysis

In order to identify changes in the numbers and the boundaries of protected areas and administrative forest sub-divisions outside the TRs, NPs, and WLSs (forest ranges, rounds, and beats), we visited eight forest division offices and collected data and maps depicting the changes in the boundaries since the 1970s. Old maps were scanned and geo-referenced using reference points from toposheets and existing boundaries in geographic latitude/longitude World Geodetic System 1984 (WGS84) projection, after which the boundaries were digitized using ArcGIS (10.4, Environmental Systems Research Institute (ESRI) Inc., Redlands, CA, USA) software.

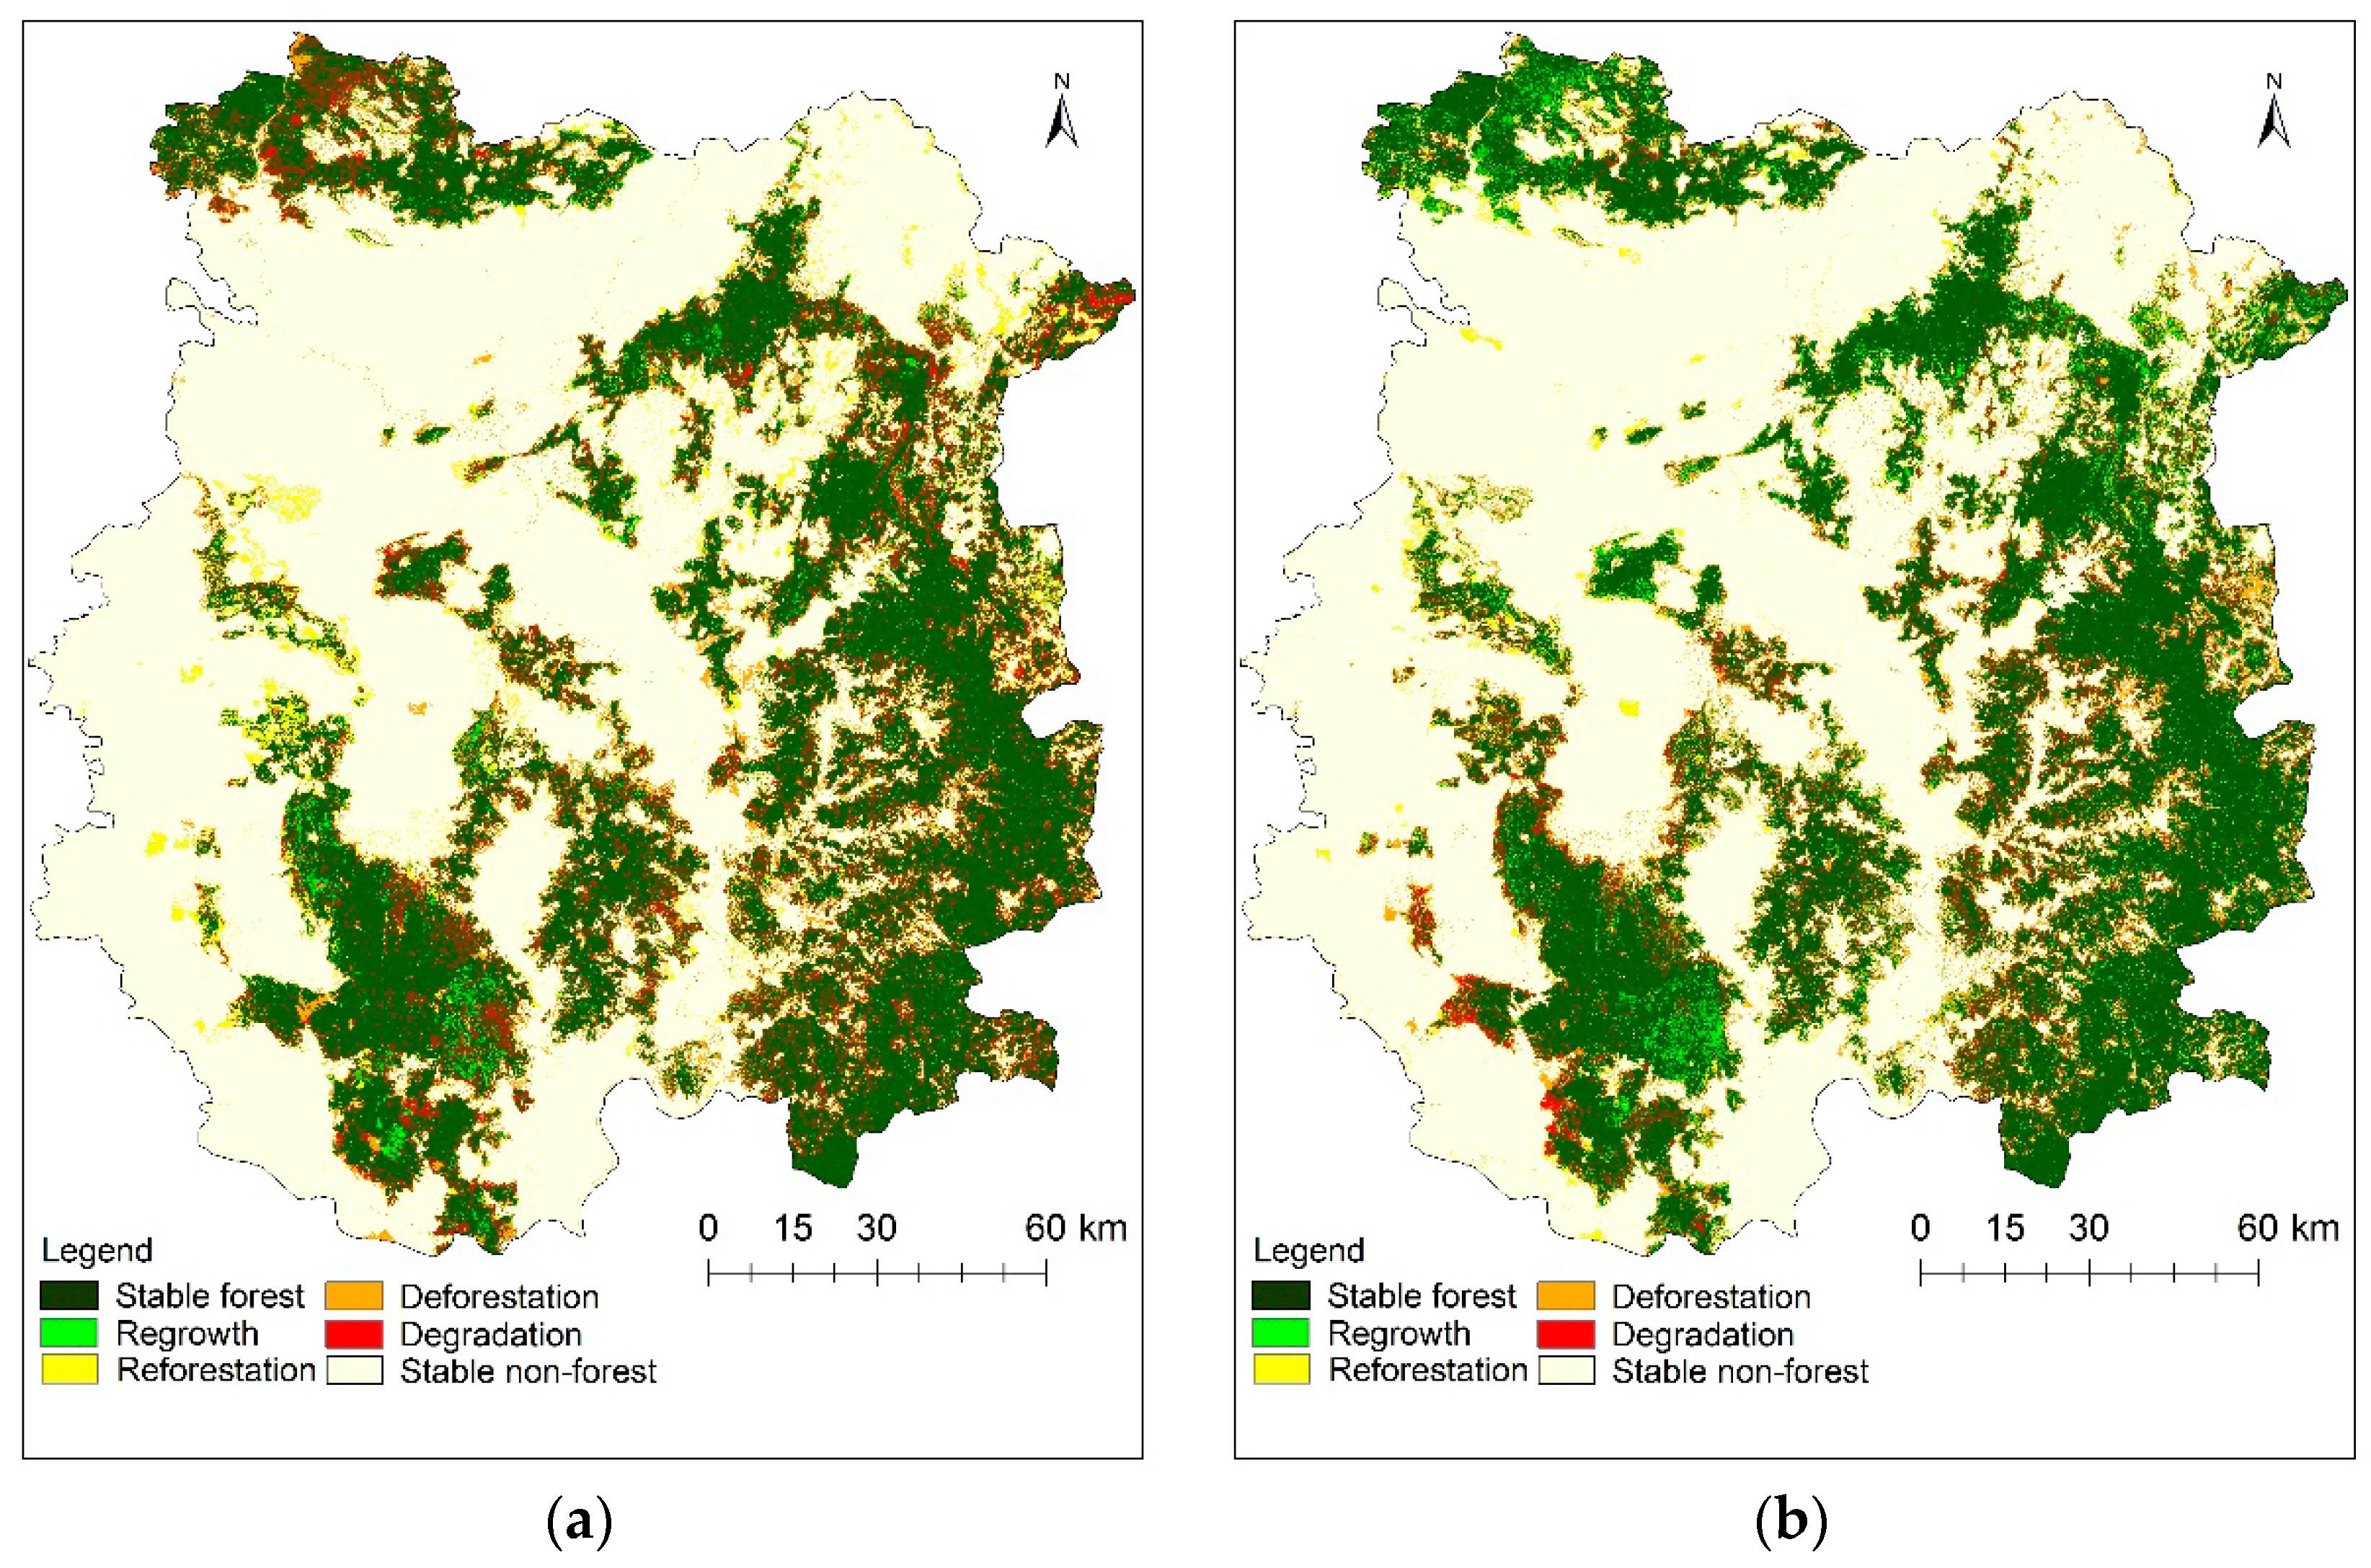
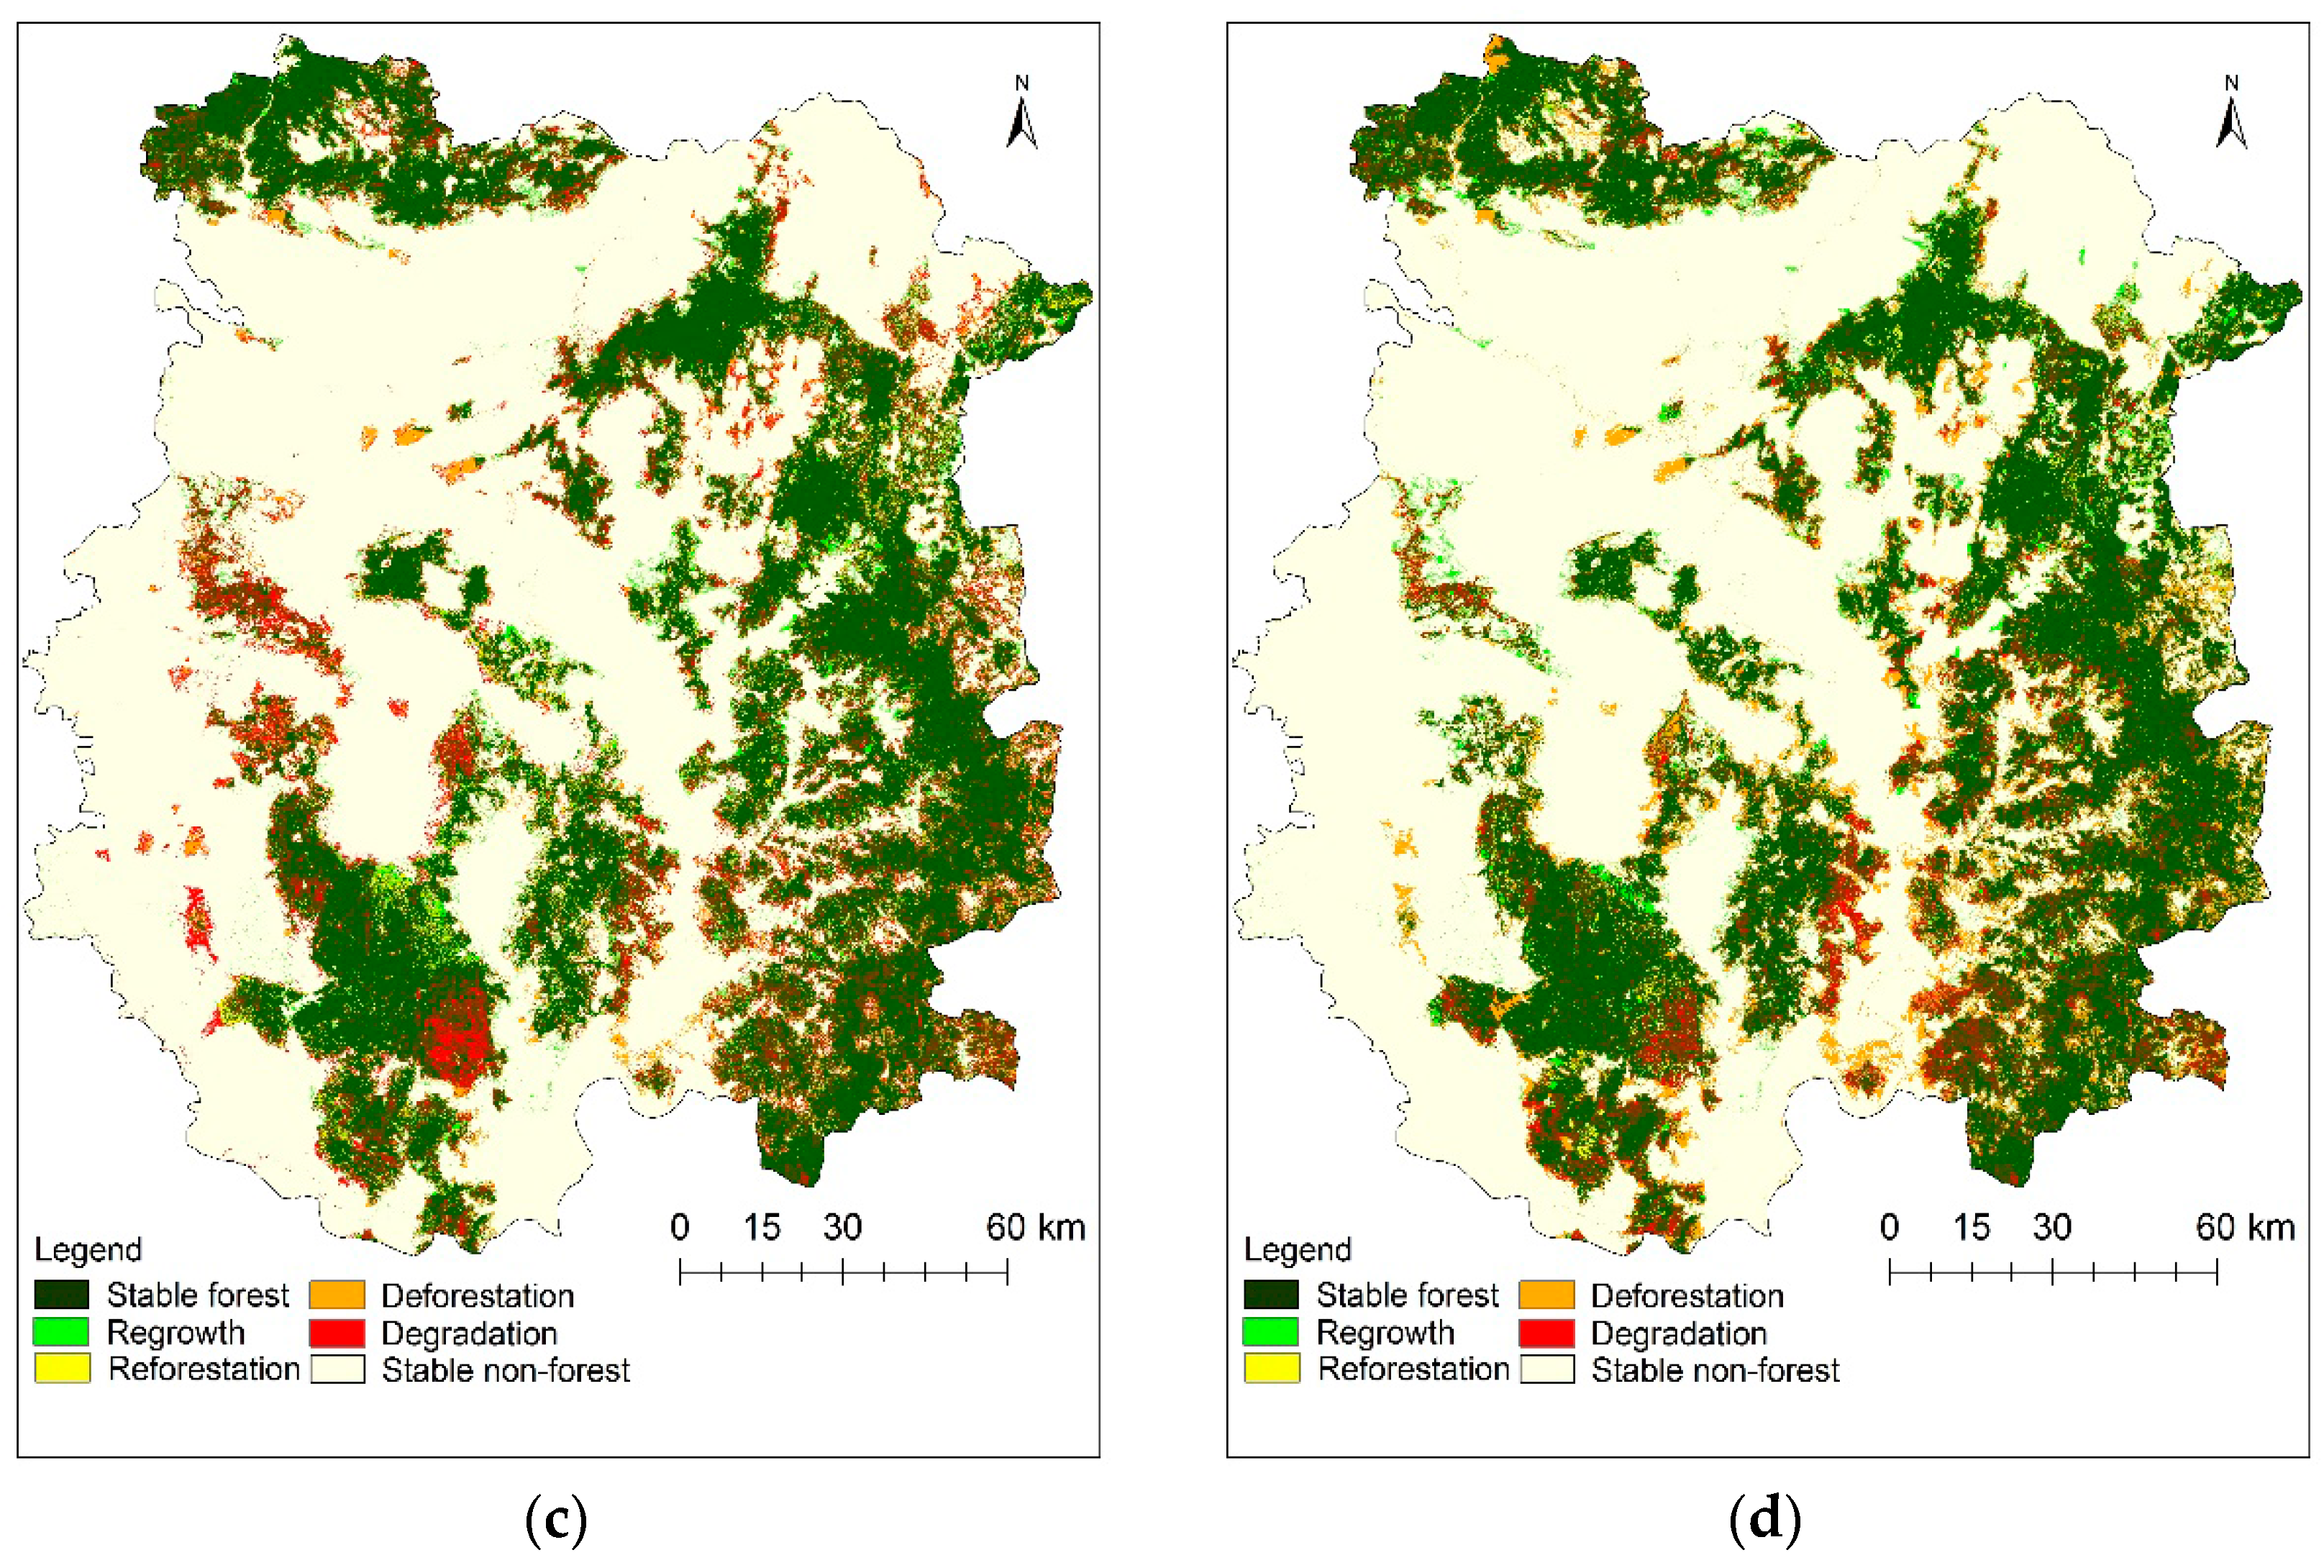
2.2.1. Satellite Image Analysis

Cloud free georeferenced images were downloaded from the USGS website [29]. We selected images from 2011 from Landsat Thematic Mapper (TM), which did not have striping errors that Landsat Enhanced Thematic Mapper Plus (ETM+) images from this time period are subject to. The study area covers four paths and rows of Landsat TM, ETM+, and Multispectral Scanner (MSS) data. Thus, it was not possible to analyze the entire area using images from a single date. Images from the dry pre-monsoon season were selected to reduce the impacts of seasonality on the forest change analysis to the extent possible. There was a maximum of three months difference between the images across years; however our focus was on the identification of three broad categories of land cover, i.e., dense forest, open forest, and non-forest, and the variation in dry deciduous forest cover is not substantially different during the season of study. The images described in Table 2 were downloaded and used to map forest cover. An image overlay function was conducted along with careful visual comparisons to verify that the co-registered images overlapped exactly across image dates, and that there were no sliver areas of misregistration [30].
Relative and absolute radiometric calibration was not conducted on this dataset due to the lack of availability of unpolluted deep water bodies in this region to act as reliable dark targets [31]. Images were classified using supervised classification [30] based on red, green, blue, and near infrared (NIR) bands. Each of the four images belonging to one time period were classified separately, after which images were mosaicked [30]. Ground training data for the 2011 image was collected during a field visit in August–September 2012, and verified using Google Earth imagery from the same season as the image. 30% of the ground control points kept aside for the accuracy assessment were not used in the classification. We did not deploy soft classification methods using vegetation indices [32,33], but used supervised classification in order to provide estimates of the changes in total forest area for quantification of the impact of different forest management regimes.
For images from 1990 and 1999, classifications were performed using information from visual assessment of images and information from local residents about land cover during previous time periods. We asked questions regarding the location of plantations, forest clearing for agriculture, forest regeneration due to local community efforts, degradation due to excessive harvest of forest resources, and of sacred forests that remained protected. This information was digitized and used as an input for image classification and accuracy assessment of areas of stable forest, forest clearing and degradation, and forest regrowth. For the 1977 image, ground training data was collected from a set of 58 Survey of India topographic sheets of 1:50,000 scale covering the study area, dating from the early 1970s.
Classification was performed using the ERDAS Imagine™ (9.2, ERDAS Inc., Norcross, GA, USA) software, classifying the landscape into eight land cover categories-dense forest (canopy cover above 40%), open forest (canopy cover between 10% and 40%), agriculture, grassland, settlements, water, river bed, and fallow land. Images from each path within a specific time period were classified separately, and then mosaicked after classification to minimize issues of image to image compatibility [30]. As the focus of this analysis was on the evaluation of the impact of management regimes on forest change, we focused further on the forests. Accordingly, all non-forest categories were subsequently collapsed into a single category of non-forest (agriculture, grassland, water, river bed, fallow land, and settlements). After classification, Landsat TM and ETM+ images of 30 m spatial resolution were downgraded to 60 m to facilitate comparison with Landsat MSS images, which are provided at a resampled resolution of 60 m [34]. Classified images were overlaid on each other to delineate land cover change trajectories highlighting the dominant land cover trends for 1977–1990, 1990–1999, 1999–2011, and 1977–2011.
The following land cover change classes were analysed:
  • stable forest (forested in both images),
  • stable non-forest (devoid of forest cover in both dates),
  • deforestation (dense or open forest in the first time period but non-forest in the second time period),
  • degradation (dense forest in the first time period and open forest in the second time period),
  • reforestation (non-forested in the first time period but converted to dense or open forest in the second time period), and
  • regrowth (open forest in the first time period, dense forest in the second time period).

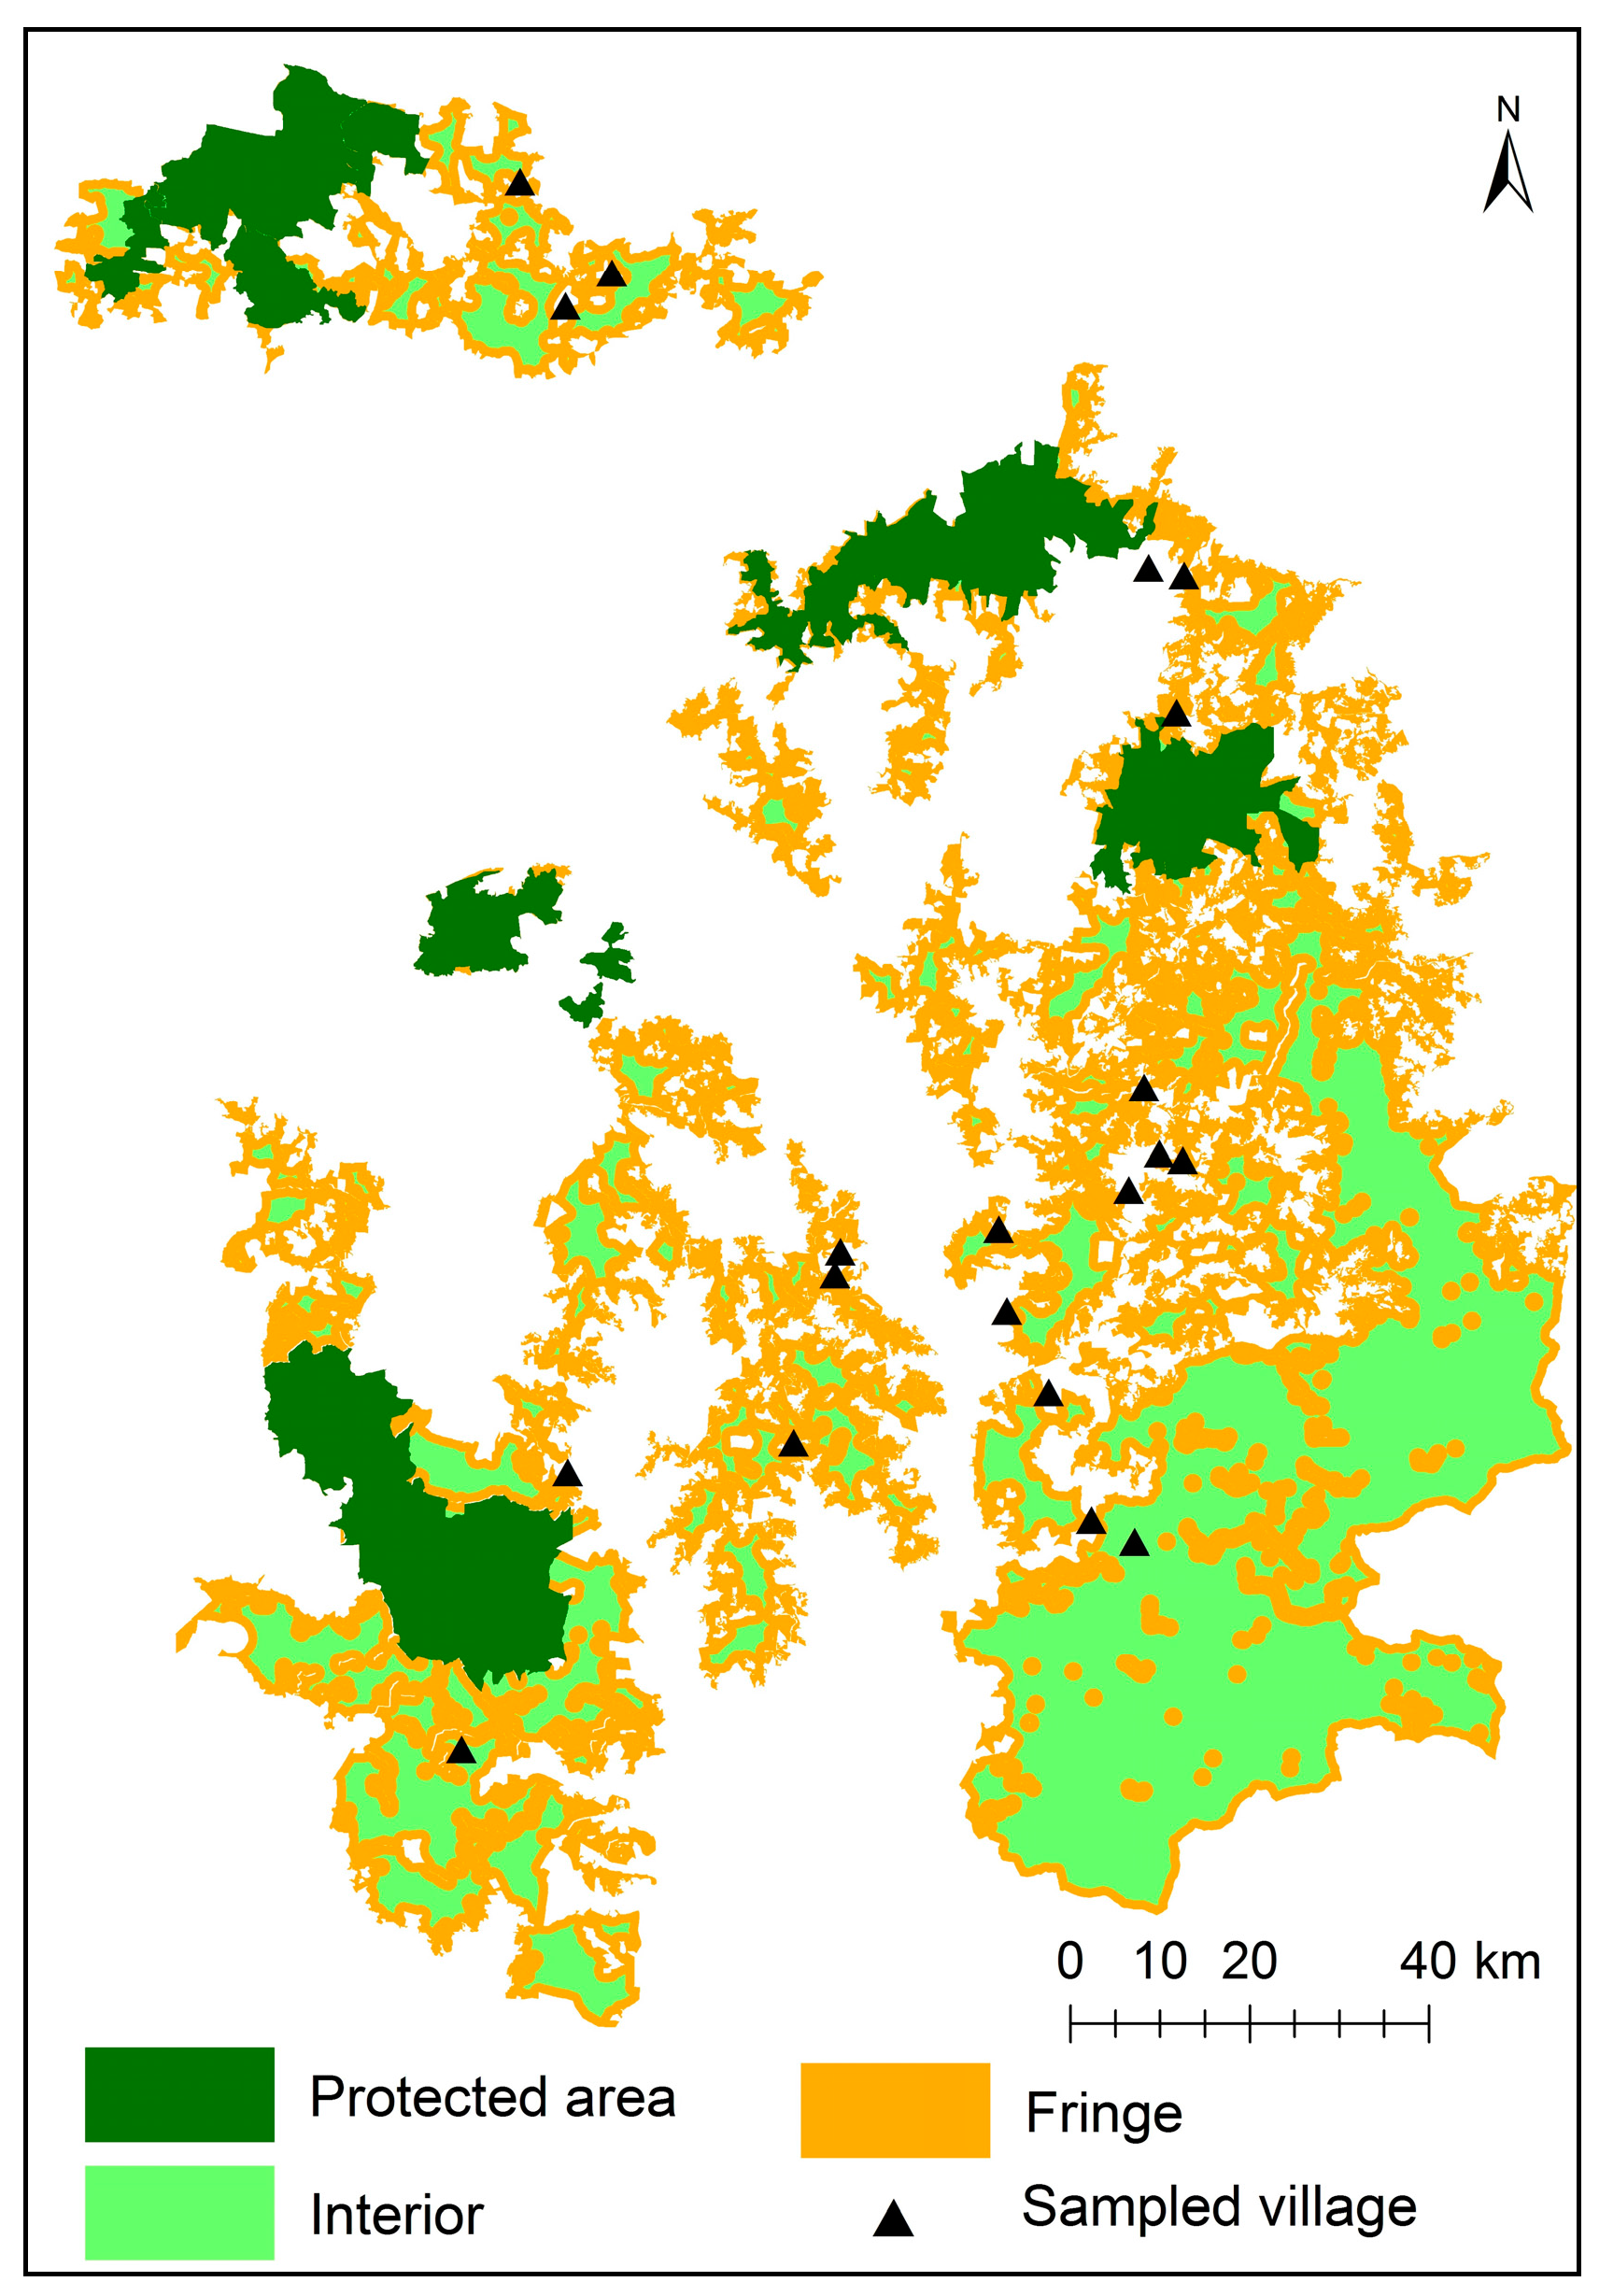
2.2.2. Stratified Random Selection of Field Sites for In-Depth Analysis

The objective of this analysis was to understand the reasons for deforestation and reforestation in areas of the landscape outside protected areas. We separated the forest outside protected areas into two sections (Figure 2):
  • Fringe (areas of forest located within a distance of 1 km from the outermost forest boundary)
  • Interior (areas of forest that are not part of the fringe)
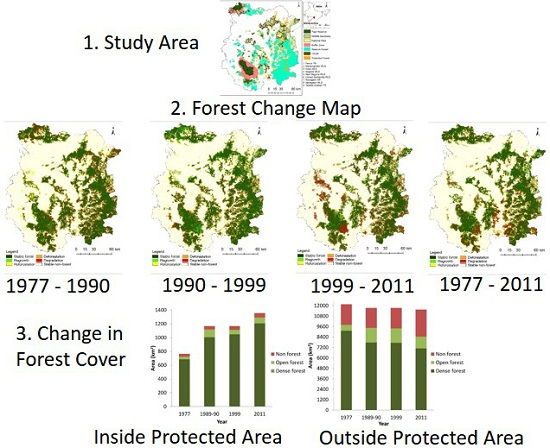
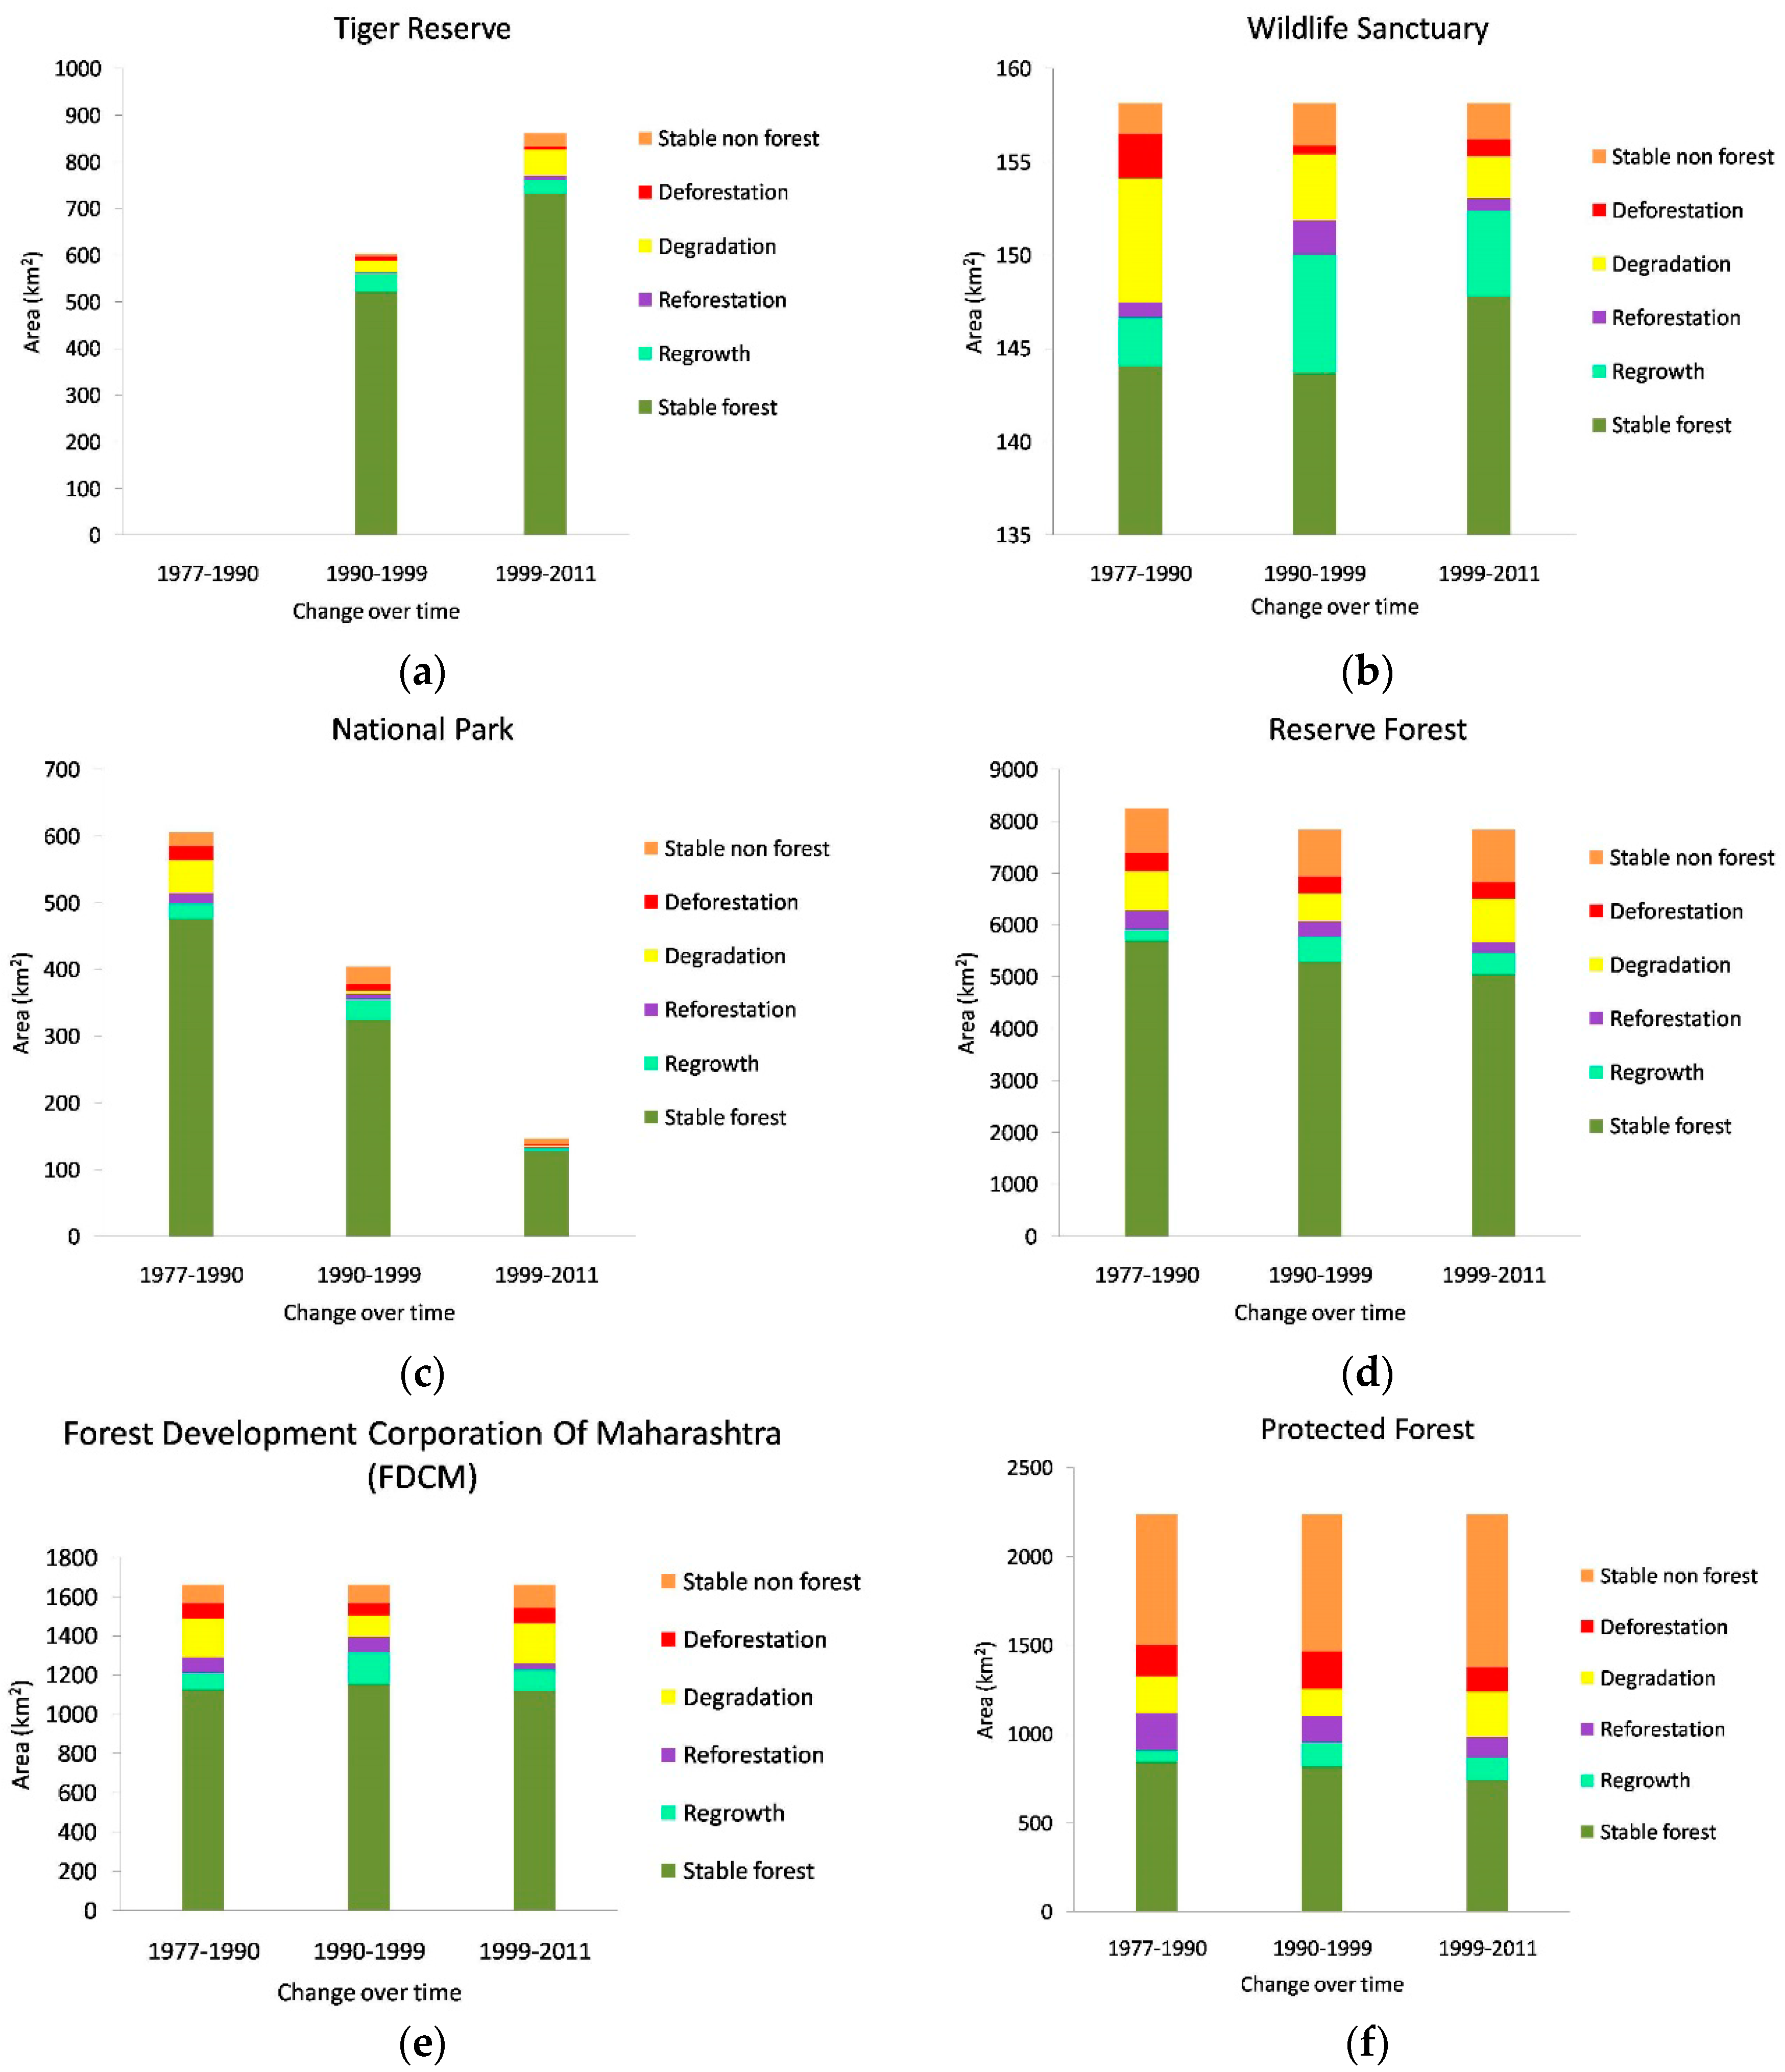
We focused on the time period, from 2000 to 2011, which generated the most recent and hence reliable information on drivers of forest change via discussions with local communities.
Out of the 583 villages located in the fringe, we selected villages where the forests had experienced at least an 80% change in land cover, as villages with a dominant trend towards either deforestation or reforestation. Based on this definition, we identified 61 villages that had predominantly experienced deforestation and 27 villages that had predominantly experienced reforestation. In the forest interior, forest change was much less extreme. Thus, in the 376 villages located in the forest interior, we selected villages which exhibited over 50% deforestation or over 50% reforestation, selecting a similar proportion of villages.
The selected villages were divided into population ranges based on population density per square km: 0–100; 100–500; 500–1000; 1000–1500, and above 1500. One village in each category was randomly selected, giving us a final sample set of 20 villages (Figure 2). These represented categories of deforestation and reforestation distributed across the interior and fringe areas, and came from diverse population densities, ensuring that our sample represented the diversity of villages in our study area.
Semi-structured focused group discussions of 3–5 h were conducted in the selected villages at public meeting places. People representing different groups, typically a mix of elderly men (aged 70–80 years) and young to middle aged men (25–50 years old) were present. We also tried to ensure that we captured the views of women by having separate interactions. Questions focused on the constitution and functionality of local institutions, including rules and norms followed to use the forest resources, and formal and informal institutions involved in forest activities. We also asked questions relating to peoples’ perceptions regarding the condition of the forest in the past and present; and their perceptions of the reasons for the changes observed in the forest. Questions on the traditional norms of forest use, and the cultural importance of forests for communities were also included. We also gathered general village information such as population, development activities, and forest and agricultural area from the village office.
In order to assess if there was an additional unaccounted impact of anthropogenic pressure on the forest, we utilized a Generalized Linear Model. Distance to the road, distance to the forest, forest area, and population within a 2 km distance of the village were used as input variables, with direction of forest change (deforestation or reforestation) as the response variables. We did not find any significant impact of these variables (related to anthropogenic pressure) on forest outcomes; thus we focused on qualitative data on community institutions to understand the reasons for forest regrowth or clearing.

3. Results

3.1. Increased State Protection over Time

There has been a substantial increase in the number and size of protected areas over time. In the 1970, there were only four protected areas: currently, there are nine, of which five wildlife sanctuaries (Mansinghdeo, Umred Karhandl, Koka, New-Nagzira, and Navegaon) were formed between 2010 and 2013 (Table 3). There is also a transition of some protected areas to stricter management categories. Tadoba Andhari Wildlife Sanctuary became a Tiger Reserve in 1993 and similarly Pench National Park was declared a Tiger Reserve in 1999 (Table 3).
The numbers of forest administrative sub-units—forest ranges, rounds, and beats—outside protected areas (TRs, WLSs, and NPs) have increased over time. Ranges have increased from 45 to 70, rounds from 235 to 304, and beats from 1060 to 1243 in the past four decades. Concomitant with the decrease in the area of forests located outside protected areas, this clearly indicates that the size of these administrative sub-units has decreased substantially. Each range, round, and beat has an associated range officer, round officer, and beat office, with a proportional number of forest guards. Thus, a larger number of Forest Department staff now monitors smaller areas of forests. The restrictions have increased through various plantation projects, regular monitoring by forest guards, buffer zone establishment, increase in number of administrative sub-units, and also through polices of the Joint Forest Management.

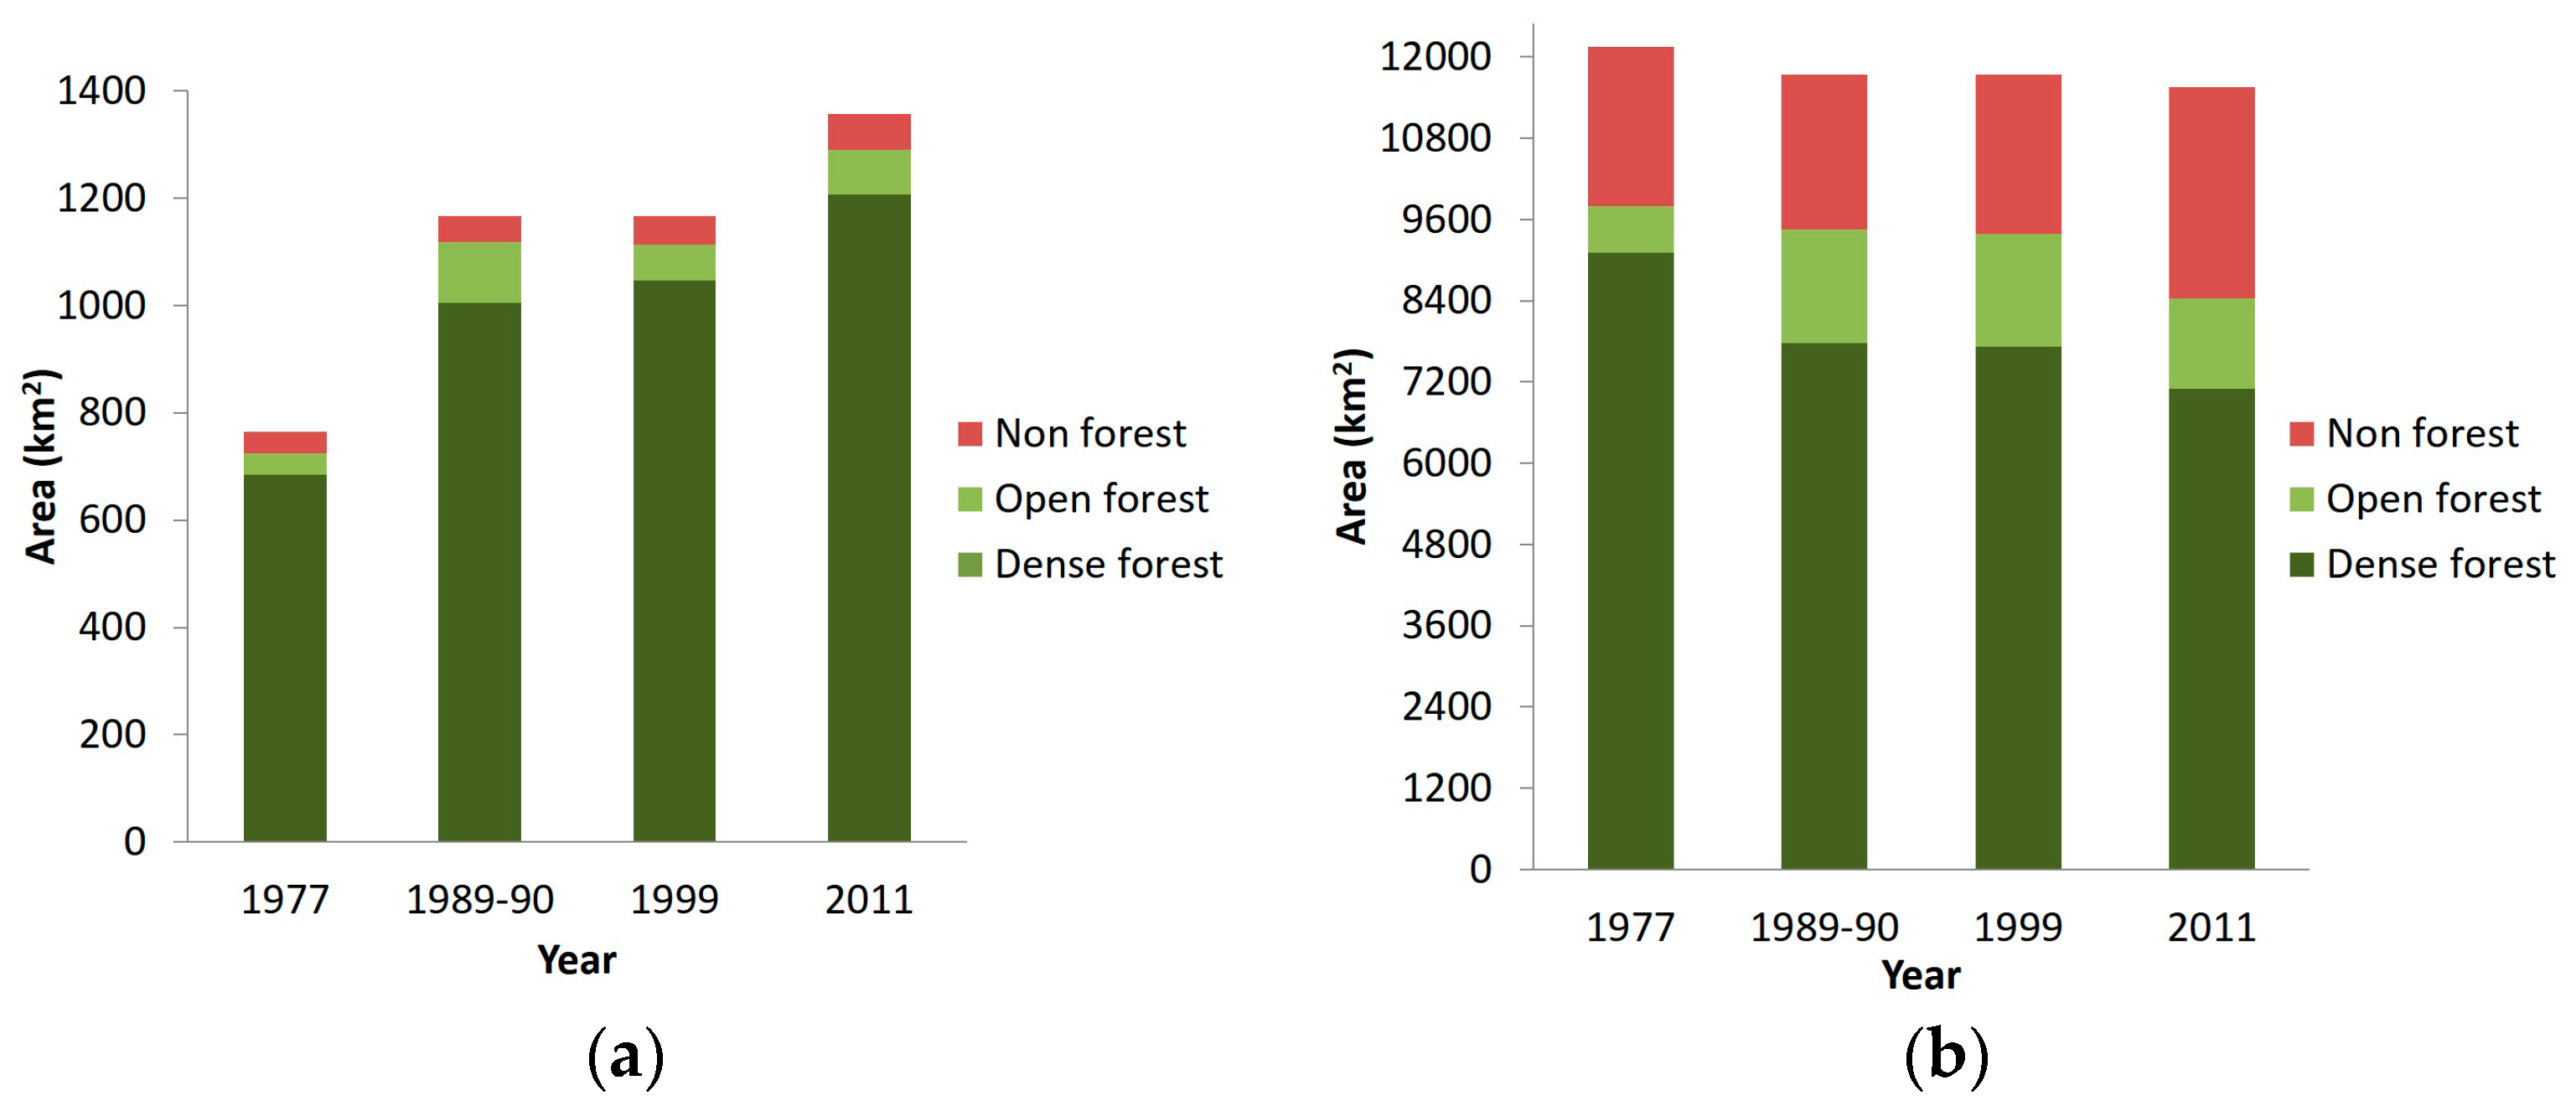
3.2. Forest Cover Change Analysis

The overall classification accuracy for image classifications, verified using an independent data set of 194 points, is above 89% for all dates, indicating confidence in the analysis (Table 4). As the final analysis focused on forests, the accuracy assessment was conducted for three collapsed categories of dense forest, open forest, and non-forest.
Table 5 describes the changes in land cover from 1977 to 2011. Overall, there has been a decrease of 1478 km2 of dense forest area in the study area between 1977 and 2011, which works out to around 43.47 km2/year. The period from 1977 to 1990 saw the greatest loss amounting to 77.07 km2/year. Dense forest cover in Tiger Reserves reduced from 89% in 1999 to 87% in 2011 and from 95% to 93% in Wildlife Sanctuaries. National Parks compensated somewhat for these losses, showing an increase in dense forest cover from 88% to 90% during the same time period. In contrast, there has been a consistent decline in dense forest cover outside the protected areas. Reserve Forests, which constitute a substantial proportion of the forest area, have declined slightly in dense forest cover from 70.5% to 69.5%. Protected Forests, which have the second largest share of the total forest area in the study area, have the sharpest decline in dense forest cover during this time period, from 40% to 37% (Table 5, Figure 3). Such decline has taken place despite increased efforts at forest protection outside Tiger Reserves, Wildlife Sanctuaries, and National Parks. Figure 3 and Figure 4 show that the total area under TR, WLS, and NP increased while the percentage of the dense forest remained unchanged. However, outside these three categories of strict protection, the total area as well as the percentage of dense forest decreased over time (Figure 4).
These findings can be understood as a pressure shift resulting from the areas within strict protection to forest patches with lower levels of protection (primarily reserve forests and protected forests), as Figure 5 and Table 5 demonstrate.

3.3. Information about the Villages

Agriculture is the predominant occupation in the study landscape, with the majority of land owners being marginal or small farmers. Road access has improved the opportunities for youth to migrate to nearby towns and industrial centers in search of work. However, the lack of specific skills and the poor quality of education compels most into taking up menial, low paying jobs that are typically seasonal in nature. Increasing population and limited income generating alternatives result in a continued dependence on the forests.
Although statutory provisions of reserve forests have always restricted collection of fuel wood, non-timber forest products, and open grazing, the implementation has been lax, especially in well forested areas. However, with the stricter enforcement of these rules, as a consequence of the declaration of tiger reserves, restrictions on extraction from the forest have become tightened, without providing feasible alternatives. Liquefied Petroleum Gas (LPG) stoves are made available by the Forest Department in some villages, but many households cannot afford to refill the cylinders. Fodder for cattle, indispensable for predominantly agrarian communities, cannot be grown in farms due to small farm sizes, nor can the village residents afford to buy fodder.

3.4. Reasons for Forest Change

All forest patches in the 20 selected villages were under the reserve forest category. Four out of ten village communities indicated that deforestation was due to the clearing of forest land for farming and the dependence of the villages on forest products. Two out of ten village communities said that the forest was clear felled by the Forest Department as per working plans (i.e., five–ten years plan of forest division), mainly to create plantations of teak (Tectona grandis) and mixed species. Three out of ten village communities identified both causes. One village mentioned that deforestation took place because of illegal logging as the forest patch is situated close to the national highway. Interview data showed that deforestation was also due to unsuccessful plantation programs, conducted by the Forest Department under their working plans, where trees were cut before the plantation process. Forests were also cleared for timber harvesting and for the construction and expansion of roads.
Eight out of ten forest patches were under the reserve forest category, and the others were under the protected forest and FDCM category. Four out of ten village communities said that strict rules enforced by the Forest Department and the plantation of teak are the main reasons for reforestation. Villages in our sample stated that they found forest plantations to be an advantage because they provide seasonal employment. Two out of ten village communities were actively involved in the regular monitoring/patrolling of the forest and also in developing the mixed plantations initiated under the Joint Forest Management. In other villages, reforestation occurred as a result of plantation activities, and of strict enforcement of the limits on forest access by the Forest Department. Yet, village residents described a general disinclination to protect, monitor, and limit use once protection restrictions were imposed. Villagers indicated that, given the lack of alternate sources that could be used to satisfy their requirements from the forest, they needed to resort to actions such as the bribing of forest guards for forest access. Strict enforcement of rules has led to frequent conflicts. Rather than reducing their forest use, people moved elsewhere to less protected forests, where restrictions of use were reduced, and monitoring was less frequent or not as strict. People also said that the monoculture plantations raised by the Forest Department (mostly teak) were not beneficial for them as they could not access non-timber products, and lacked other livelihood and subsistence support, except employment during the plantation process.

4. Discussion

This study examined the changes in a dry deciduous forest landscape within Maharashtra, India, connecting two important protected areas, the Tadoba Andhari Tiger Reserve and the Pench Tiger Reserve, between the years 1977 and 2011 (Figure 5). The findings show that while protected areas are well conserved, the pressure on forests outside these areas is high. There has also been an increase in the percentage of dense forest cover within the protected areas and a decrease in the percentage of dense forest cover outside the protected areas. Additionally, outside the protected areas, the percentage of area in open and non-forest categories has increased.
This study demonstrates the importance of the long time series provided by the Landsat satellite images for understanding the long term trends of forest change in India, and of examining the impact of protected areas on forest protection at a landscape scale. In doing so, this research builds on previous research studies on forest change in the Pench and Tadoba Andhari Tiger Reserves [3,13,26] that examine deforestation and regrowth in these protected areas, as well as the region in the immediate periphery. Extending the study to the landscape level, we demonstrate the importance of combining remote sensing using GIS maps of management boundaries and interviews with the local communities, to better understand the impact of protected areas on forest change at a landscape scale: a matter of increasing global concern.
Linking satellite data with community interviews across twenty villages, representative of different categories of population density as well as different trajectories of forest change, we find that the increased level of strict conservation has led to forest protection within protected areas. Yet this has also resulted in a pressure shift outside protected area boundaries to other types of forests, which are now under even more severe threat than before. Our surveys show the continued dependence of local communities living in this landscape on the forests for livelihood, as well as for non-economic uses.
In 1977 only four protected areas had been established, while five additional protected areas were created after 2010 (Table 3). Yet, even in the less protected reserve forests, protected forests, and FDCM forests outside the protected areas (tiger reserves, wildlife sanctuaries, and national parks), forests have been subject to higher degrees of protection, with greater patrolling, a larger number of forest staff, and greater enforcement of restrictions on access to the forest. Despite this, forest cover in reserve forests and protected forests is declining.
Forest degradation is frequently attributed to population increase, and to the high dependency of local communities on the forests [2]. However, deforestation could occur because of other causes as well. We find that protected areas are embedded within a larger multifunctional landscape, where community interviews indicate that village residents have not reduced their dependence on forests, but rather, transferred their dependence to less protected forests. Forests also continue to face threats due to the growing market demand for forest products, which also encourages the growth of monoculture teak plantations by the Forest Department [9]. Thus, central Indian forests form a landscape of contrast, where there are several usage and control mechanisms existing in a single region which acts as a forest corridor for wildlife. The approach employed by the state has been to restrict people from using the forest via the creation of new protected areas, expansion of established areas, and strengthening of rules limiting forest entry and use. This appears to be working within parks, but with the consequence of increasing forest degradation outside the parks. Interviews with villagers also indicate that deforestation is not only an outcome of increased forest use and high population demand with no alternate opportunities, but also that it takes place in reserve forest areas due to clear felling under the Forest Department working plans. Furthermore, reforestation frequently fails as a consequence of unsuccessful plantation programs, or results in the creation of monoculture teak plantations with little biodiversity or local-use value.
The Forest Department typically manages the forest in a bureaucratic manner, justified for enhancing ecological services and biodiversity conservation, but with the challenges of rent seeking, driven by institutionalized incentives [35]. The Forest Department gains revenue through the regular felling of trees in selected beats/coupes, and via plantations, usually of eucalyptus and teak. Despite claims of ecological services being enhanced by forest plantation, other research has demonstrated the problems of forest degradation and ecological damage resulting from such activities [36,37,38]. Thus, market-driven plantation based projects are problematic, and more attention should be given to plantations to meet local conditions [39]. Teak plantations may provide short term economic benefits through wage labour earnings, but monocultures adversely affect the livelihood of communities dependent on a range of non-timber forest products that do not grow in such plantations. Teak plantations also impact the ecology of the landscape, converting a biodiverse dry forest into an area where tree cover is protected, but with low ecological value in terms of their overall support of wildlife, bird, and insect diversity [26].
We need to better understand the complexities of landscape change before embarking on continued declarations of new and expanded protected areas. The boundaries created by the Forest Department seem to provide increased forest protection within TRs, WLSs, and NPs. However, ironically, they seem to exacerbate forest conditions in forests with lower levels of protection, where a pressure shift plays a dominant role in deforestation and forest fragmentation at the landscape scale, in the backdrop of increased conflicts between forest residents and forest management authorities.
Our research can help address larger questions of how different forested patches, governed by a variety of management approaches ranging from strict conservation to more open areas, need to be integrated within regional landscape planning across a large spatial extent in order to facilitate conservation processes over the long term. Incorporating a variety of institutions including strict protected areas as well as community institutions, could strengthen the resilience of forests outside the protected areas [40,41]. Such planning has been implemented in Nepal, for instance, where despite the almost complete cessation of park monitoring and a spike in poaching between 2002 and 2006 because of civil violence, tiger and rhino populations were able to persist—most likely because of landscape level connectivity to Indian parks [41]. Similarly in Indonesia, research indicates that poaching-related depletions in specific protected areas can be offset by migration from other landscapes if the connectivity between reserves is maintained [42]. In this landscape mosaic of different protection categories, broader approaches, that involve local communities with forest protection and in decision-making about the nature of forest management outside the strict protected areas, need to be strengthened and enabled via a strong policy focus.

Acknowledgments

The authors gratefully acknowledge the financial support provided by the South Asian Network for Development and Environmental Economics (SANDEE) under grant number SANDEE/July 2011/008. We thank E. Somanathan, Priya Shamsunder, and other SANDEE colleagues for their valuable comments and feedback on earlier versions of this manuscript. Comments by an anonymous reviewer on an early version were especially helpful. We thank Jayalakshmi Krishnan, Seema Mundoli, and Aniruddha Marathe for technical support; and the Maharashtra Forest Division for sharing valuable information. Neha Mujumdar, Nojendra Landage, Rajkamal Patle, and Vinod Borkar provided excellent research assistance.

Author Contributions

Shivani Agarwal, Harini Nagendra, and Rucha Ghate conceived and designed the research; Shivani Agarwal conducted the field work and classification of remote sensing data; Shivani Agarwal and Harini Nagendra analyzed the data; Shivani Agarwal, Harini Nagendra, and Rucha Ghate wrote the paper.

Conflicts of Interest

The authors declare no conflict of interest.

Abbreviations

DFDense Forest
ETM+Enhanced Thematic Mapper Plus
FDCMForest Development Corporation of Maharashtra
GISGeographic Information System
JFMJoint Forest Management
LPGLiquefied Petroleum Gas
MSSMultispectral Scanner
NFNon Forest
NPNational Park
OFOpen Forest
PAProtected Area
PFProtected Forest
RFReserve Forest
TMThematic Mapper
TRTiger Reserve
USGSUnited State Geological Survey
WLSWildlife Sanctuary

References

  1. Davidar, P.; Sahoo, S.; Mammen, P.C.; Acharya, P.; Puyravaud, J.-P.; Arjunan, M.; Garrigues, J.P.; Roessingh, K. Assessing the extent and causes of forest degradation in India: Where do we stand? Biol. Conserv. 2010, 143, 2937–2944. [Google Scholar] [CrossRef]
  2. Karanth, K.K.; De Fries, R. Conservation and management in human-dominated landscapes: Case studies from India. Biol. Conserv. 2010, 143, 2865–2869. [Google Scholar] [CrossRef]
  3. Nagendra, H.; Rocchini, D.; Ghate, R. Beyond parks as monoliths: Spatially differentiating park-people relationships in the Tadoba Andhari Tiger Reserve in India. Biol. Conserv. 2010, 143, 2900–2908. [Google Scholar] [CrossRef]
  4. DeFries, R.; Hansen, A.; Newton, A.C.; Hansen, M.C. Increasing isolation of protected areas in tropical forests over the past twenty years. Ecol. Appl. 2005, 15, 19–26. [Google Scholar] [CrossRef]
  5. Karanth, K.K.; Gopalaswamy, A.M.; Prasad, P.K.; Dasgupta, S. Patterns of human–wildlife conflicts and compensation: Insights from Western Ghats protected areas. Biol. Conserv. 2013, 166, 175–185. [Google Scholar] [CrossRef]
  6. Lasgorceix, A.; Kothari, A. Displacement and relocation of protected areas: A synthesis and analysis of case studies. Econ. Political Wkly. 2009, 44, 37–47. [Google Scholar]
  7. Guha, R. Forestry in British and post-British India a historical analysis. Econ. Political Wkly. 1983, 18, 1940–1947. [Google Scholar]
  8. Guha, R. The Unquiet Woods: Ecological Change and Peasant Resistance in the Himalaya; Oxford University Press: New Delhi, India, 1989. [Google Scholar]
  9. Dewi, S.; van Noordwijk, M.; Ekadinata, A.; Pfund, J.-L. Protected areas within multifunctional landscapes: Squeezing out intermediate land use intensities in the tropics? Land Use Policy 2013, 30, 38–56. [Google Scholar] [CrossRef]
  10. DeFries, R.; Karanth, K.K.; Pareeth, S. Interactions between protected areas and their surroundings in human-dominated tropical landscapes. Biol. Conserv. 2010, 143, 2870–2880. [Google Scholar] [CrossRef]
  11. Shahabuddin, G.; Rangarajan, M. Making Conservation Work: Securing Biodiversity in This New Century; Permanent Black: New Delhi, India, 2007. [Google Scholar]
  12. Ghate, R.; Nagendra, H. Role of monitoring in institutional performance: Forest management in Maharashtra, India. Conserv. Soc. 2005, 3, 509–509. [Google Scholar]
  13. Nagendra, H.; Pareeth, S.; Ghate, R. People within parks—Forest villages, land-cover change and landscape fragmentation in the Tadoba Andhari Tiger Reserve, India. Appl. Geogr. 2006, 26, 96–112. [Google Scholar] [CrossRef]
  14. Fleischman, F. Understanding India’s forest bureaucracy: A review. Reg. Environ. Chang. 2015, 16, 153–165. [Google Scholar] [CrossRef]
  15. Sarin, M.; Singh, N.M.; Sundar, N.; Bhogal, R.K. Devolution as a Threat to Democratic Decision-Making in Forestry? Findings from Three States in India; Overseas Development Institute: London, UK, 2003. [Google Scholar]
  16. Nayak, P.K.; Berkes, F. Politics of co-optation: Community forest management versus joint forest management in Orissa, India. Environ. Manag. 2008, 41, 707–718. [Google Scholar] [CrossRef] [PubMed]
  17. Shahabuddin, G.; Rao, M. Do community-conserved areas effectively conserve biological diversity? Global insights and the Indian context. Biol. Conserv. 2010, 143, 2926–2936. [Google Scholar] [CrossRef]
  18. West, P.; Igoe, J.; Brockington, D. Parks and peoples: The social impact of protected areas. Ann. Rev. Anthropol. 2006, 35, 251–277. [Google Scholar] [CrossRef]
  19. Torri, M.C. Conservation approaches and development of local communities in India: Debates, challenges and future perspectives. Int. J. Environ. Sci. 2011, 1, 871–883. [Google Scholar]
  20. Shahabuddin, G. Conservation at the Crossroads: Science, Society, and the Future of India's Wildlife; Permanent Black: New Delhi, India, 2010. [Google Scholar]
  21. Vollan, B. Socio-ecological explanations for crowding-out effects from economic field experiments in southern Africa. Ecol. Econ. 2008, 67, 560–573. [Google Scholar] [CrossRef]
  22. DeFries, R.; Hansen, A.; Turner, B.L.; Reid, R.; Liu, J. Land use change around protected areas: Management to balance human needs and ecological function. Ecol. Appl. 2007, 17, 1031–1038. [Google Scholar] [CrossRef] [PubMed]
  23. Ostrom, E.; Nagendra, H. Insights on linking forests, trees, and people from the air, on the ground, and in the laboratory. Proc. Natl. Acad. Sci. USA 2006, 103, 19224–19231. [Google Scholar] [CrossRef] [PubMed]
  24. Porter-Bolland, L.; Ellis, E.A.; Guariguata, M.R.; Ruiz-Mallén, I.; Negrete-Yankelevich, S.; Reyes-García, V. Community managed forests and forest protected areas: An assessment of their conservation effectiveness across the tropics. For. Ecol. Manag. 2012, 268, 6–17. [Google Scholar] [CrossRef]
  25. Kerr, J.T.; Ostrovsky, M. From space to species: Ecological applications for remote sensing. Trends Ecol. Evol. 2003, 18, 299–305. [Google Scholar] [CrossRef]
  26. Mondal, P.; Southworth, J. Protection vs. commercial management: Spatial and temporal analysis of land cover changes in the tropical forests of Central India. For. Ecol. Manag. 2010, 259, 1009–1017. [Google Scholar] [CrossRef]
  27. Hansen, M.C.; Loveland, T.R. A review of large area monitoring of land cover change using Landsat data. Remote Sens. Environ. 2012, 122, 66–74. [Google Scholar] [CrossRef]
  28. Census of India. Available online: http://www.censusindia.gov.in (accessed on 11 October 2014).
  29. Landsat Images. Available online: http://www.glovis.usgs.gov (accessed on 1 September 2011).
  30. Jensen, J.R. Remote Sensing of the Environment: An Earth Resource Perspective; Prentice Hall: Upper Saddle River, NJ, USA, 2000. [Google Scholar]
  31. Hall, F.G.; Strebel, D.E.; Nickeson, J.E.; Goetz, S.J. Radiometric rectification: Toward a common radiometric response among multidate, multisensor images. Remote Sens. Environ. 1991, 35, 11–27. [Google Scholar] [CrossRef]
  32. Krishnaswamy, J.; Bawa, K.S.; Ganeshaiah, K.; Kiran, M. Quantifying and mapping biodiversity and ecosystem services: Utility of a multi-season NDVI based Mahalanobis distance surrogate. Remote Sens. Environ. 2009, 113, 857–867. [Google Scholar] [CrossRef]
  33. Mondal, P. Quantifying surface gradients with a 2-band Enhanced Vegetation Index (EVI2). Ecol. Indic. 2011, 11, 918–924. [Google Scholar] [CrossRef]
  34. Landsat Image. Available online: http://landsat.usgs.gov/band_designations_landsat_satellites.php (accessed on 4 August 2016).
  35. Fleischman, F.D. Why do foresters plant trees? Testing theories of bureaucratic decision-making in central India. World Dev. 2014, 62, 62–74. [Google Scholar] [CrossRef]
  36. Das, S. The strange valuation of forests in India. Econ. Political Wkly. 2010, 45, 16–18. [Google Scholar]
  37. Afreen, S.; Sharma, N.; Chaturvedi, R.K.; Gopalakrishnan, R.; Ravindranath, N. Forest policies and programs affecting vulnerability and adaptation to climate change. Mitig. Adapt. Strateg. Glob. Chang. 2011, 16, 177–197. [Google Scholar] [CrossRef]
  38. Chaturvedi, R.K.; Gopalakrishnan, R.; Jayaraman, M.; Bala, G.; Joshi, N.; Sukumar, R.; Ravindranath, N. Impact of climate change on Indian forests: A dynamic vegetation modeling approach. Mitig. Adapt. Strateg. Glob. Chang. 2011, 16, 119–142. [Google Scholar] [CrossRef]
  39. Vatn, A.; Vedeld, P.O. National governance structures for REDD+. Glob. Environ. Chang. 2013, 23, 422–432. [Google Scholar] [CrossRef]
  40. Schwartzman, S.; Alencar, A.; Zarin, H.; Souza, A.P.S. Social movements and large-scale tropical forest protection on the Amazon frontier: Conservation from chaos. J. Environ. Dev. 2010, 19, 274–299. [Google Scholar] [CrossRef]
  41. Wikramanayake, E.; Dinerstein, E.; Seidensticker, J.; Lumpkin, S.; Pandav, B.; Shrestha, M.; Mishra, H.; Ballou, J.; Johnsingh, A.J.T.; Chestin, I. A landscape-based conservation strategy to double the wild tiger population. Conserv. Lett. 2011, 4, 219–227. [Google Scholar] [CrossRef]
  42. Linkie, M.; Chapron, G.; Martyr, D.J.; Holden, J.; Leader-Williams, N. Assessing the viability of tiger subpopulations in a fragmented landscape. J. Appl. Ecol. 2006, 43, 576–586. [Google Scholar] [CrossRef]
Figure 1. Study area map depicting the distribution of protected areas and forest outside protected area.
Land 05 00027 g001
Figure 2. Distribution of interior and fringe forests in the landscape along with locations of selected villages.
Land 05 00027 g002
Figure 3. Change in area and land cover classes inside (a) Tiger Reserve; (b) Wildlife Sanctuary; (c) National Park; (d) Reserve Forest; (e) Forest Development Corporation of Maharashtra (FDCM); (f) Protected Forest over time.
Land 05 00027 g003
Figure 4. Change in dense forest, open forest, and non-forest in the forests (a) inside categories of strict protection (TR, WLS, NP, and BZ) and (b) outside categories of strict protection (RF, PF, and FDCM).
Land 05 00027 g004
Figure 5. Forest change between (a) 1977–1990; (b) 1990–1999; (c) 1999–2011 and (d) 1977–2011.
Land 05 00027 g005aLand 05 00027 g005b
Table 1. Types of forest management regimes and the rules of use and access.
Different Types of Management RegimesRules
Tiger Reserve (TR)
880.52 km2
TRs have completely inaccessible core areas, increased restrictions in terms of forest resource use and entry, and check points at all entry points. People cannot collect any resources from the forest, including dead wood. Grazing is completely prohibited. Villages inside many TRs have been relocated. However, tourism is allowed on specified routes. Local communities use the forest in the buffer area around the reserve, and may receive some indirect benefits from tourism.
Wildlife Sanctuary (WLS)
898.69 km2
WLSs are protected areas created for the conservation of particular faunal and floral species. There are restrictions on timber and fuelwood extraction from these areas. Hunting is also banned. Check points are located at all entry points. Grazing is also banned inside WLSs. However, local communities use the forest in the buffer area around the reserve, and may receive some indirect benefits from tourism.
National Park (NP)
129.55 km2
NPs are areas demarcated for conservation. There are restrictions on timber and fuelwood extraction from the forest. Hunting is also banned. However, local communities around the forest use the forest for their livelihood.
Buffer Zone (BZ)
1585 km2
An area of around 5-10 km distance from the park is demarcated around Tiger Reserves as a buffer zone. Local communities use the forest in the buffer area around the reserve, and may receive some indirect benefits from tourism. Eco-development programs have been initiated by the Forest Department in the buffer zones.
Reserve Forest (RF)
6400 km2 (approximate)
There are much fewer restrictions in terms of using forest resources in RFs as compared to TRs, WLSs, NPs, and buffer zones. Within RFs, plantation, beat cutting (rotational felling of trees above a specified girth in the selected coupe/beat, followed by plantation) and other forest related work is conducted according to five year plans of the Forest Department. There are restrictions on logging and hunting. Local residents can collect fuelwood only through head-loads. Use of bullock-cart, bicycle, and axe for wood collection is prohibited.
Forest Development Corporation of Maharashtra (FDCM)
1150 km2 (approximate)
Some RF compartments are leased to the Forest Development Corporation of Maharashtra for afforestation, timber extraction, and sale. Local communities work in FDCM forests for daily wages, but are not allowed to access forest resources for their livelihood. They are sometimes allowed to use resources that are not commercially useful for the FDCM department.
Protected Forest (PF) 2200 km2 (approximate)PFs are similar to RFs; however there are fewer restrictions on village residents in terms of using the former as compared to the latter. The term PF is sometimes interchangeably used with village forest. Village residents are allowed to collect fuelwood, timber, and other non-timber forest products (NTFPs).
Table 2. Description of Landsat image, its path and row and date of acquisition.
Landsat SensorPath and RowDate of Acquisition
MSS154-45 and 154-4628 January 1977
MSS155-45 and 155-4629 January 1977
TM144-45 and 144-465 November 1989
TM143-45 and 143-4617 November 1990
TM144-45 and 144-461 January 1999
ETM+143-45 and 143-464 December 1999
TM144-45 and 144-463 February 2011
TM143-45 and 143-4612 February 2011
Table 3. Year of establishment as well as transition to different forest management regimes along with the respective and cumulative area under PA and buffer zone.
Notification YearProtected AreaArea km2Total Area under PA and Buffer
±1955Tadoba NP116.55371.67
±1955Pandit Jawaharlal Nehru NP255.12
1970Nagira WLS152.58653.8
1975Navegaon NP129.55
1975Pandit Jawaharlal Neharu NP changed to Pench NP255.12
1986Andhari WLS508.851162.65
1993Tadoba Andhari WLS changed to Tadoba Andhari TR625.41162.65
1999Pench NP changed to Pench TR255.12
2010Buffer zone for Tadoba Andhari TR1101.771585.73
2010Buffer zone for Pench NP483.96
2010Mansingdeo WLS182.591908.76
2012New Nagzira WLS151.33
2012Navegaon WLS 122.76
2012Umred Karhandla WLS189.3
2013Koka WLS100.13
Table 4. Accuracy assessment of classified images.
Class NameReference TotalClassified TotalNumber CorrectProducers AccuracyUsers AccuracyKappa Statistics
Accuracy Assessment 1977 Image
Dense forest13313412996.99%96.27%0.8813
Open forest17141376.47%92.86%0.9217
Non forest44464295.45%91.30%0.8875
Total194194184Overall classification accuracy = 94.85%Overall kappa statistics = 0.8895
Accuracy Assessment 1990 Image
Dense forest10810910092.59%91.74%0.8137
Open forest40373485.00%91.89%0.8979
Non forest46484189.13%85.42%0.8088
Total194194175Overall classification accuracy = 90.21%Overall kappa statistics = 0.8338
Accuracy Assessment 1999 Image
Dense forest971049496.91%90.38%0.8077
Open forest37353081.08%85.71%0.8235
Non forest60555083.33%90.91%0.8684
Total194194174Overall classification accuracy = 89.69%Overall kappa statistics = 0.831
Accuracy Assessment 2011 Image
Dense forest93938793.55%93.55%0.8761
Open forest37383389.19%86.84%0.8374
Non forest64636093.75%95.24%0.9289
Total194194180Overall classification accuracy = 92.78%Overall kappa statistics = 0.8847
Table 5. Change in forest cover percentage over time across different management regimes.
Management RegimeTime PeriodDense Forest PercentageOpen Forest PercentageNon Forest Percentage
Tiger Reserve199989.036.534.44
201187.237.665.11
Wildlife Sanctuary197795.562.871.57
1989–199090.458.560.99
199994.753.591.66
201192.694.293.02
National Park197788.155.746.11
1989–199082.3310.816.86
199988.13.818.09
201189.752.148.11
Buffer zone201154.0112.2633.72
Reserve Forest197780.474.6614.87
1989–199071.4913.1615.35
199970.5513.8415.62
201169.4911.2319.28
Forest Development Corporation of Maharashtra (FDCM)197780.978.3510.68
1989–199073.3116.2410.45
199977.2213.479.31
201169.4713.217.32
Protected Forest197750.577.1842.25
1989–199042.3316.8540.82
199940.3716.0443.59
201137.0711.4351.5

