
Poverty and Environmental Degradation in Southern Burkina Faso: An Assessment Based on Participatory Methods


Abstract
:1. Introduction
2. Materials and Methods
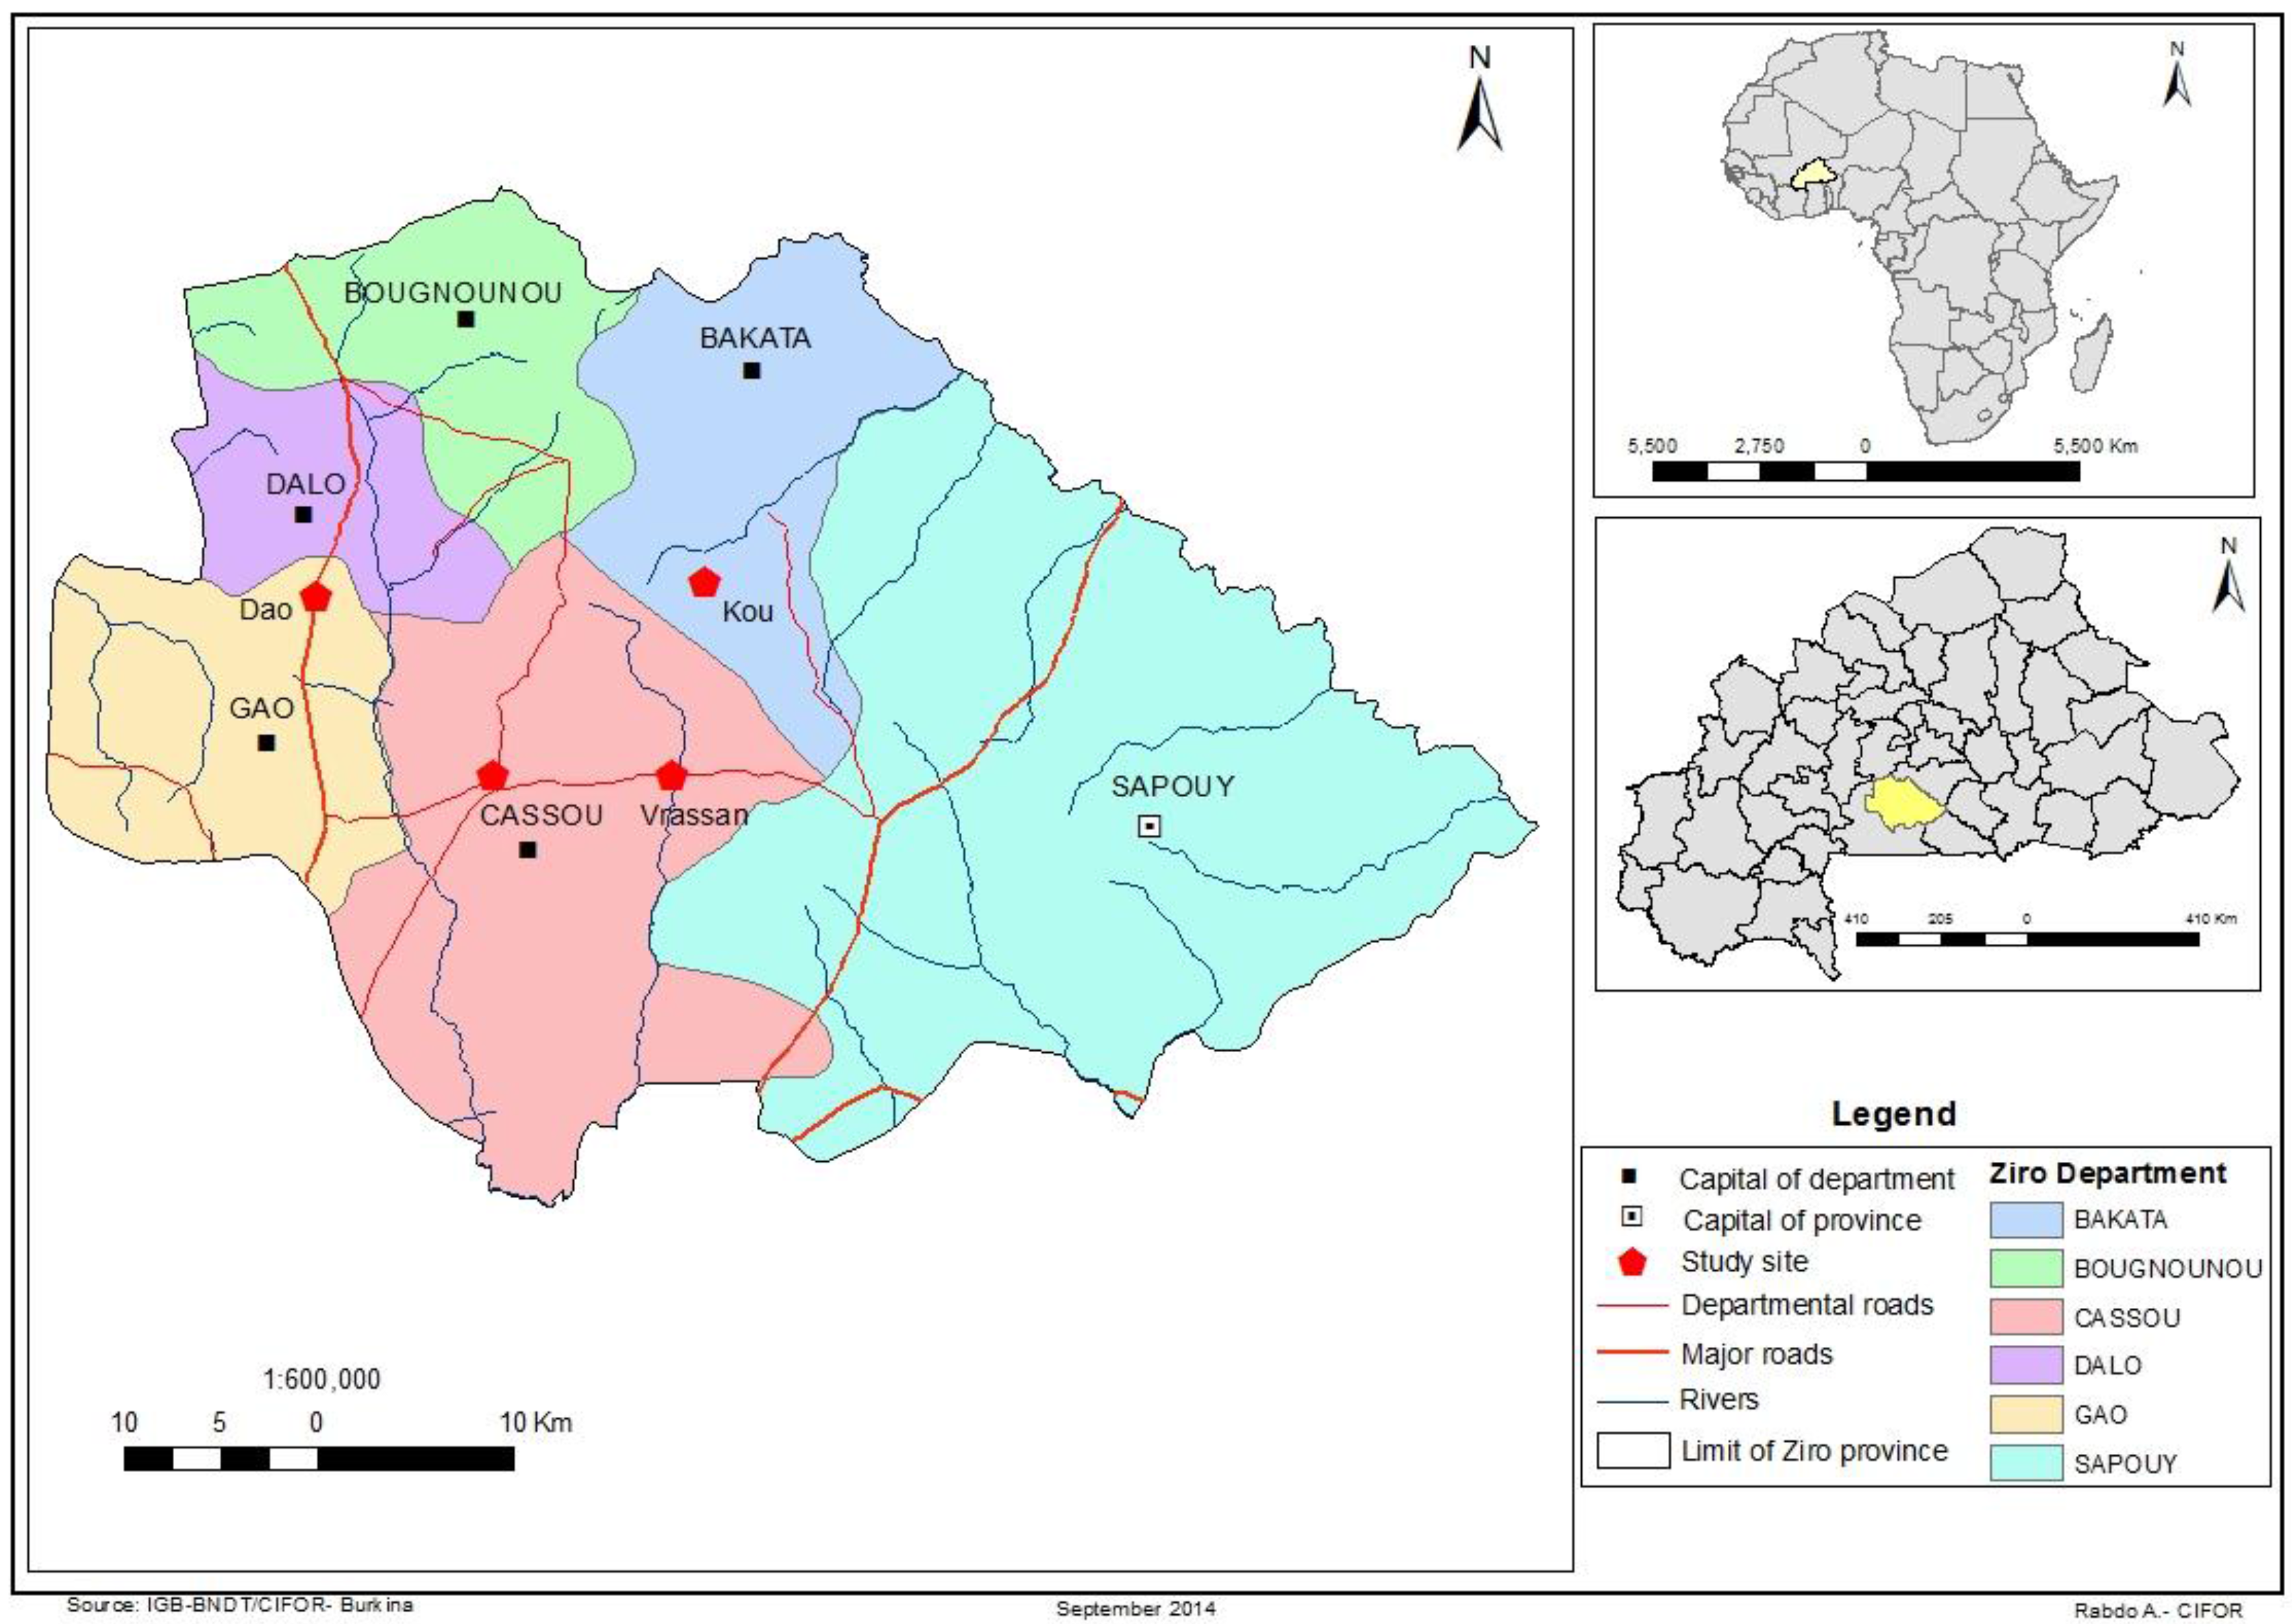
2.1. Description of Study Area
2.2. Sampling and Data Collection
2.3. Analytical Methods: Categorizing Households Based on Local Indicators Derived from Participatory Poverty Assessment (PPA)
- Level 1—[(1 − 1)/(3 − 1)] × 100 = 0, where 0 implies non-poor household
- Level 2—[(2 − 1)/(3 − 1)] × 100 = 50, where 50 implies fairly poor household
- Level 3—[(3 − 1)/(3 − 1)] × 100 = 100, where 100 implies poorest household
2.4. Study Variables Indicating Environmentally Degrading Activities
2.4.1. Deforestation
2.4.2. Cotton Cultivation
2.4.3. Cutting and Selling of Fuel Wood
2.4.4. Overgrazing
2.4.5. Farmers’ Assessment of Tenure Insecurity on FMNR
2.4.6. Farmers’ Assessment of Soil Fertility Loss
2.5. Statistical Analysis
3. Results and Discussion
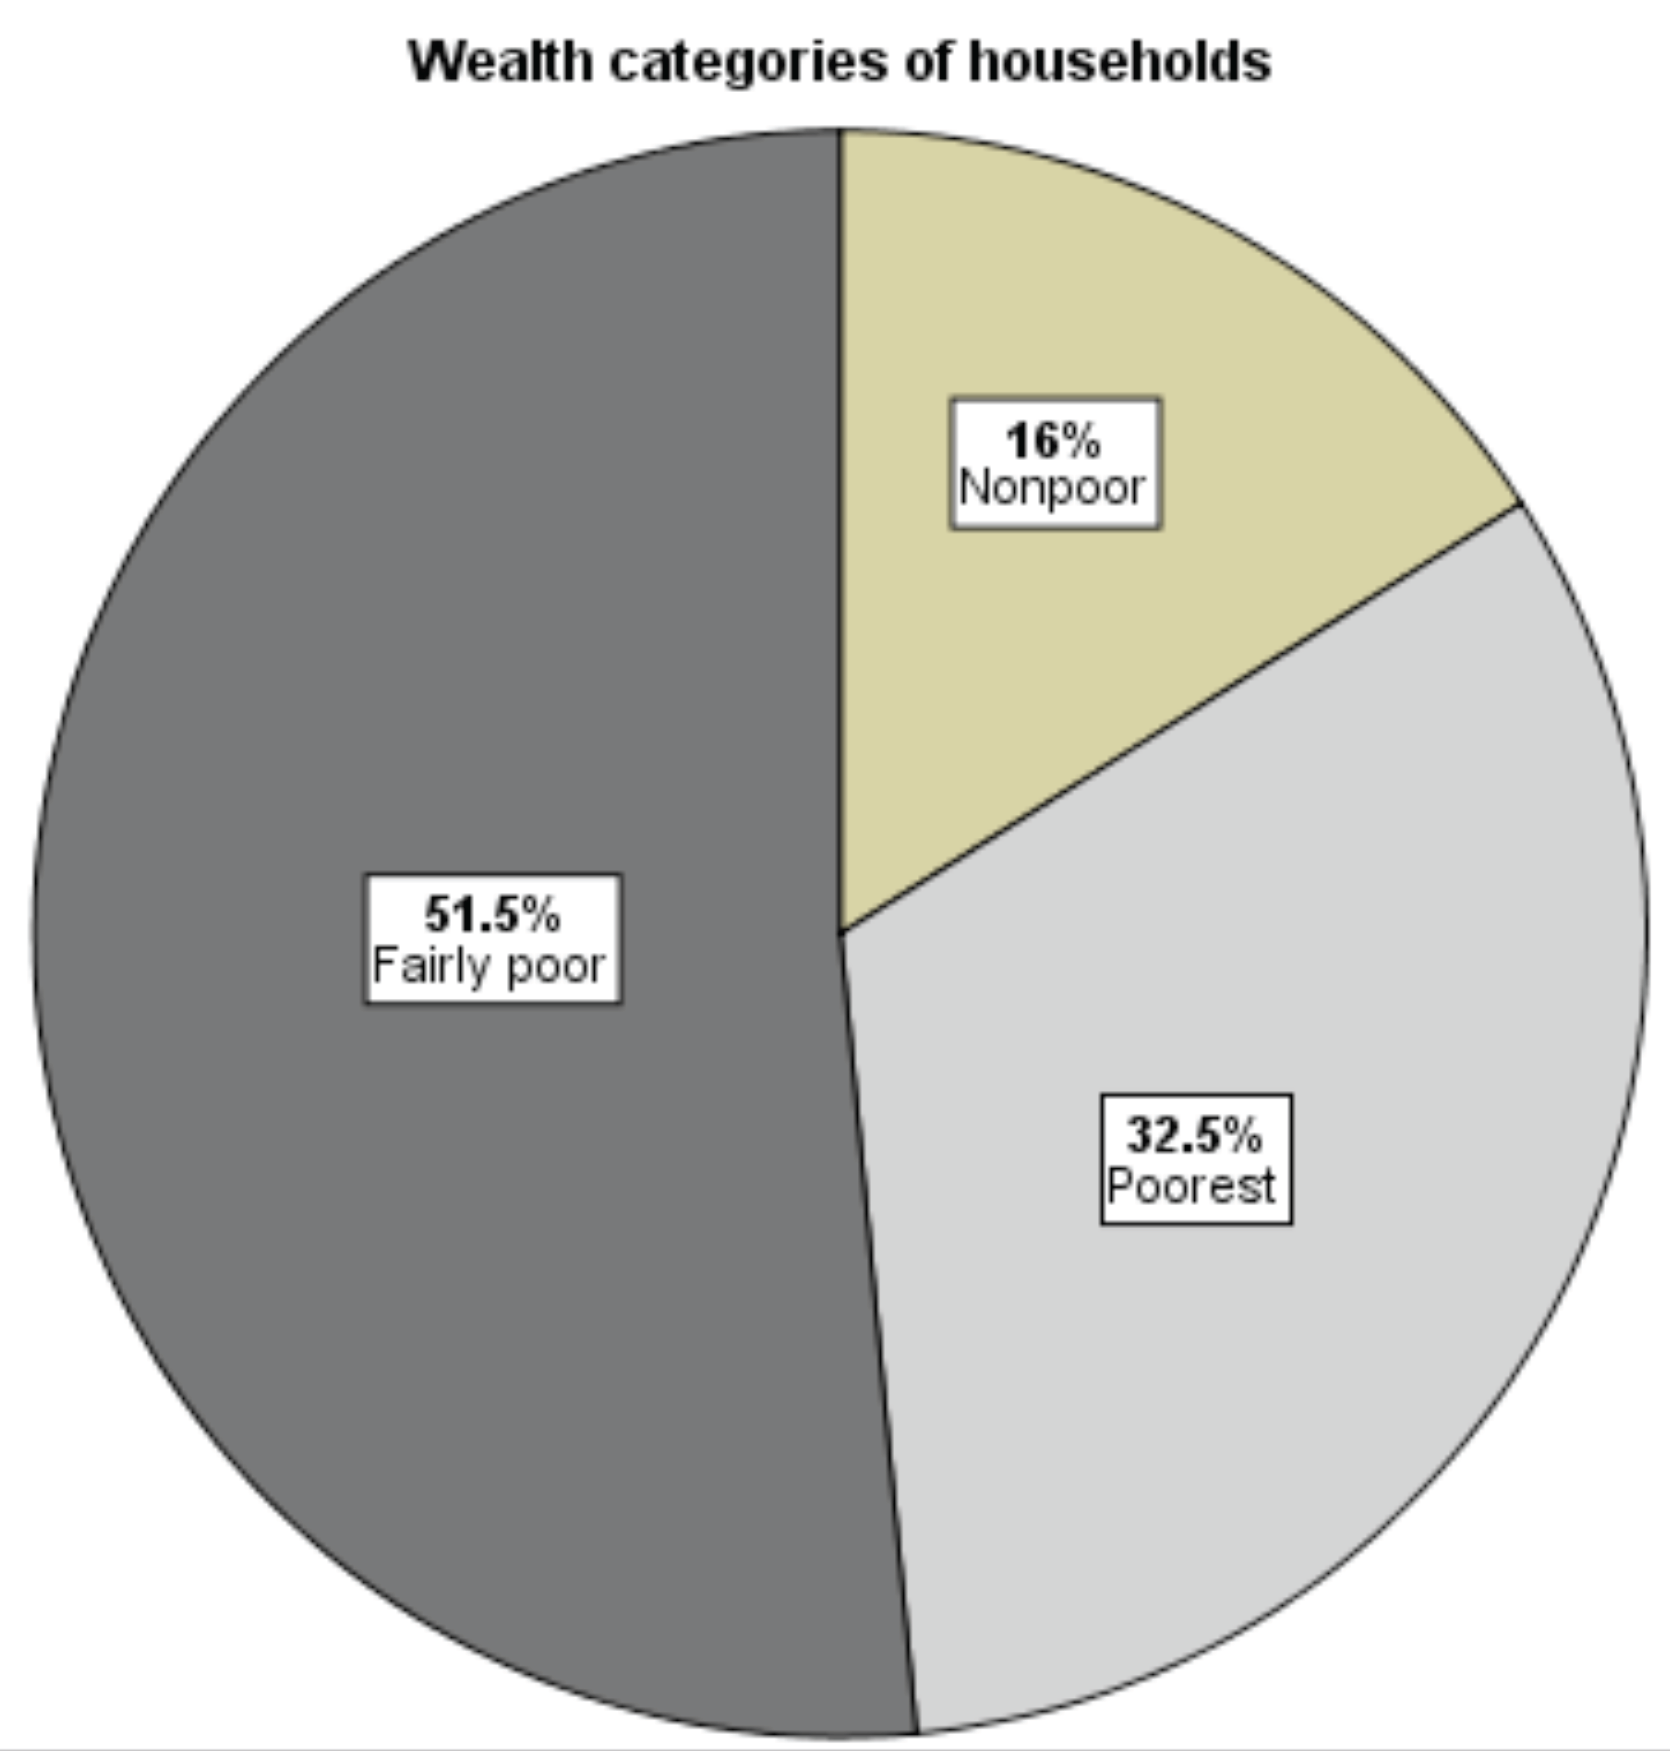
3.1. Poverty Level and Households’ Characteristics
3.2. Indicators of Environmental Degradation: Differences among Wealth Categories
3.2.1. Deforestation
3.2.2. Cotton Cultivation as an Environmentally Degrading Activity
3.2.3. Cutting and Selling Fuel Wood
3.2.4. Overgrazing
3.2.5. Perceptions of Soil Fertility Loss
3.2.6. Farmers’ Assessment of Tenure Insecurity on Assisted Natural Regeneration
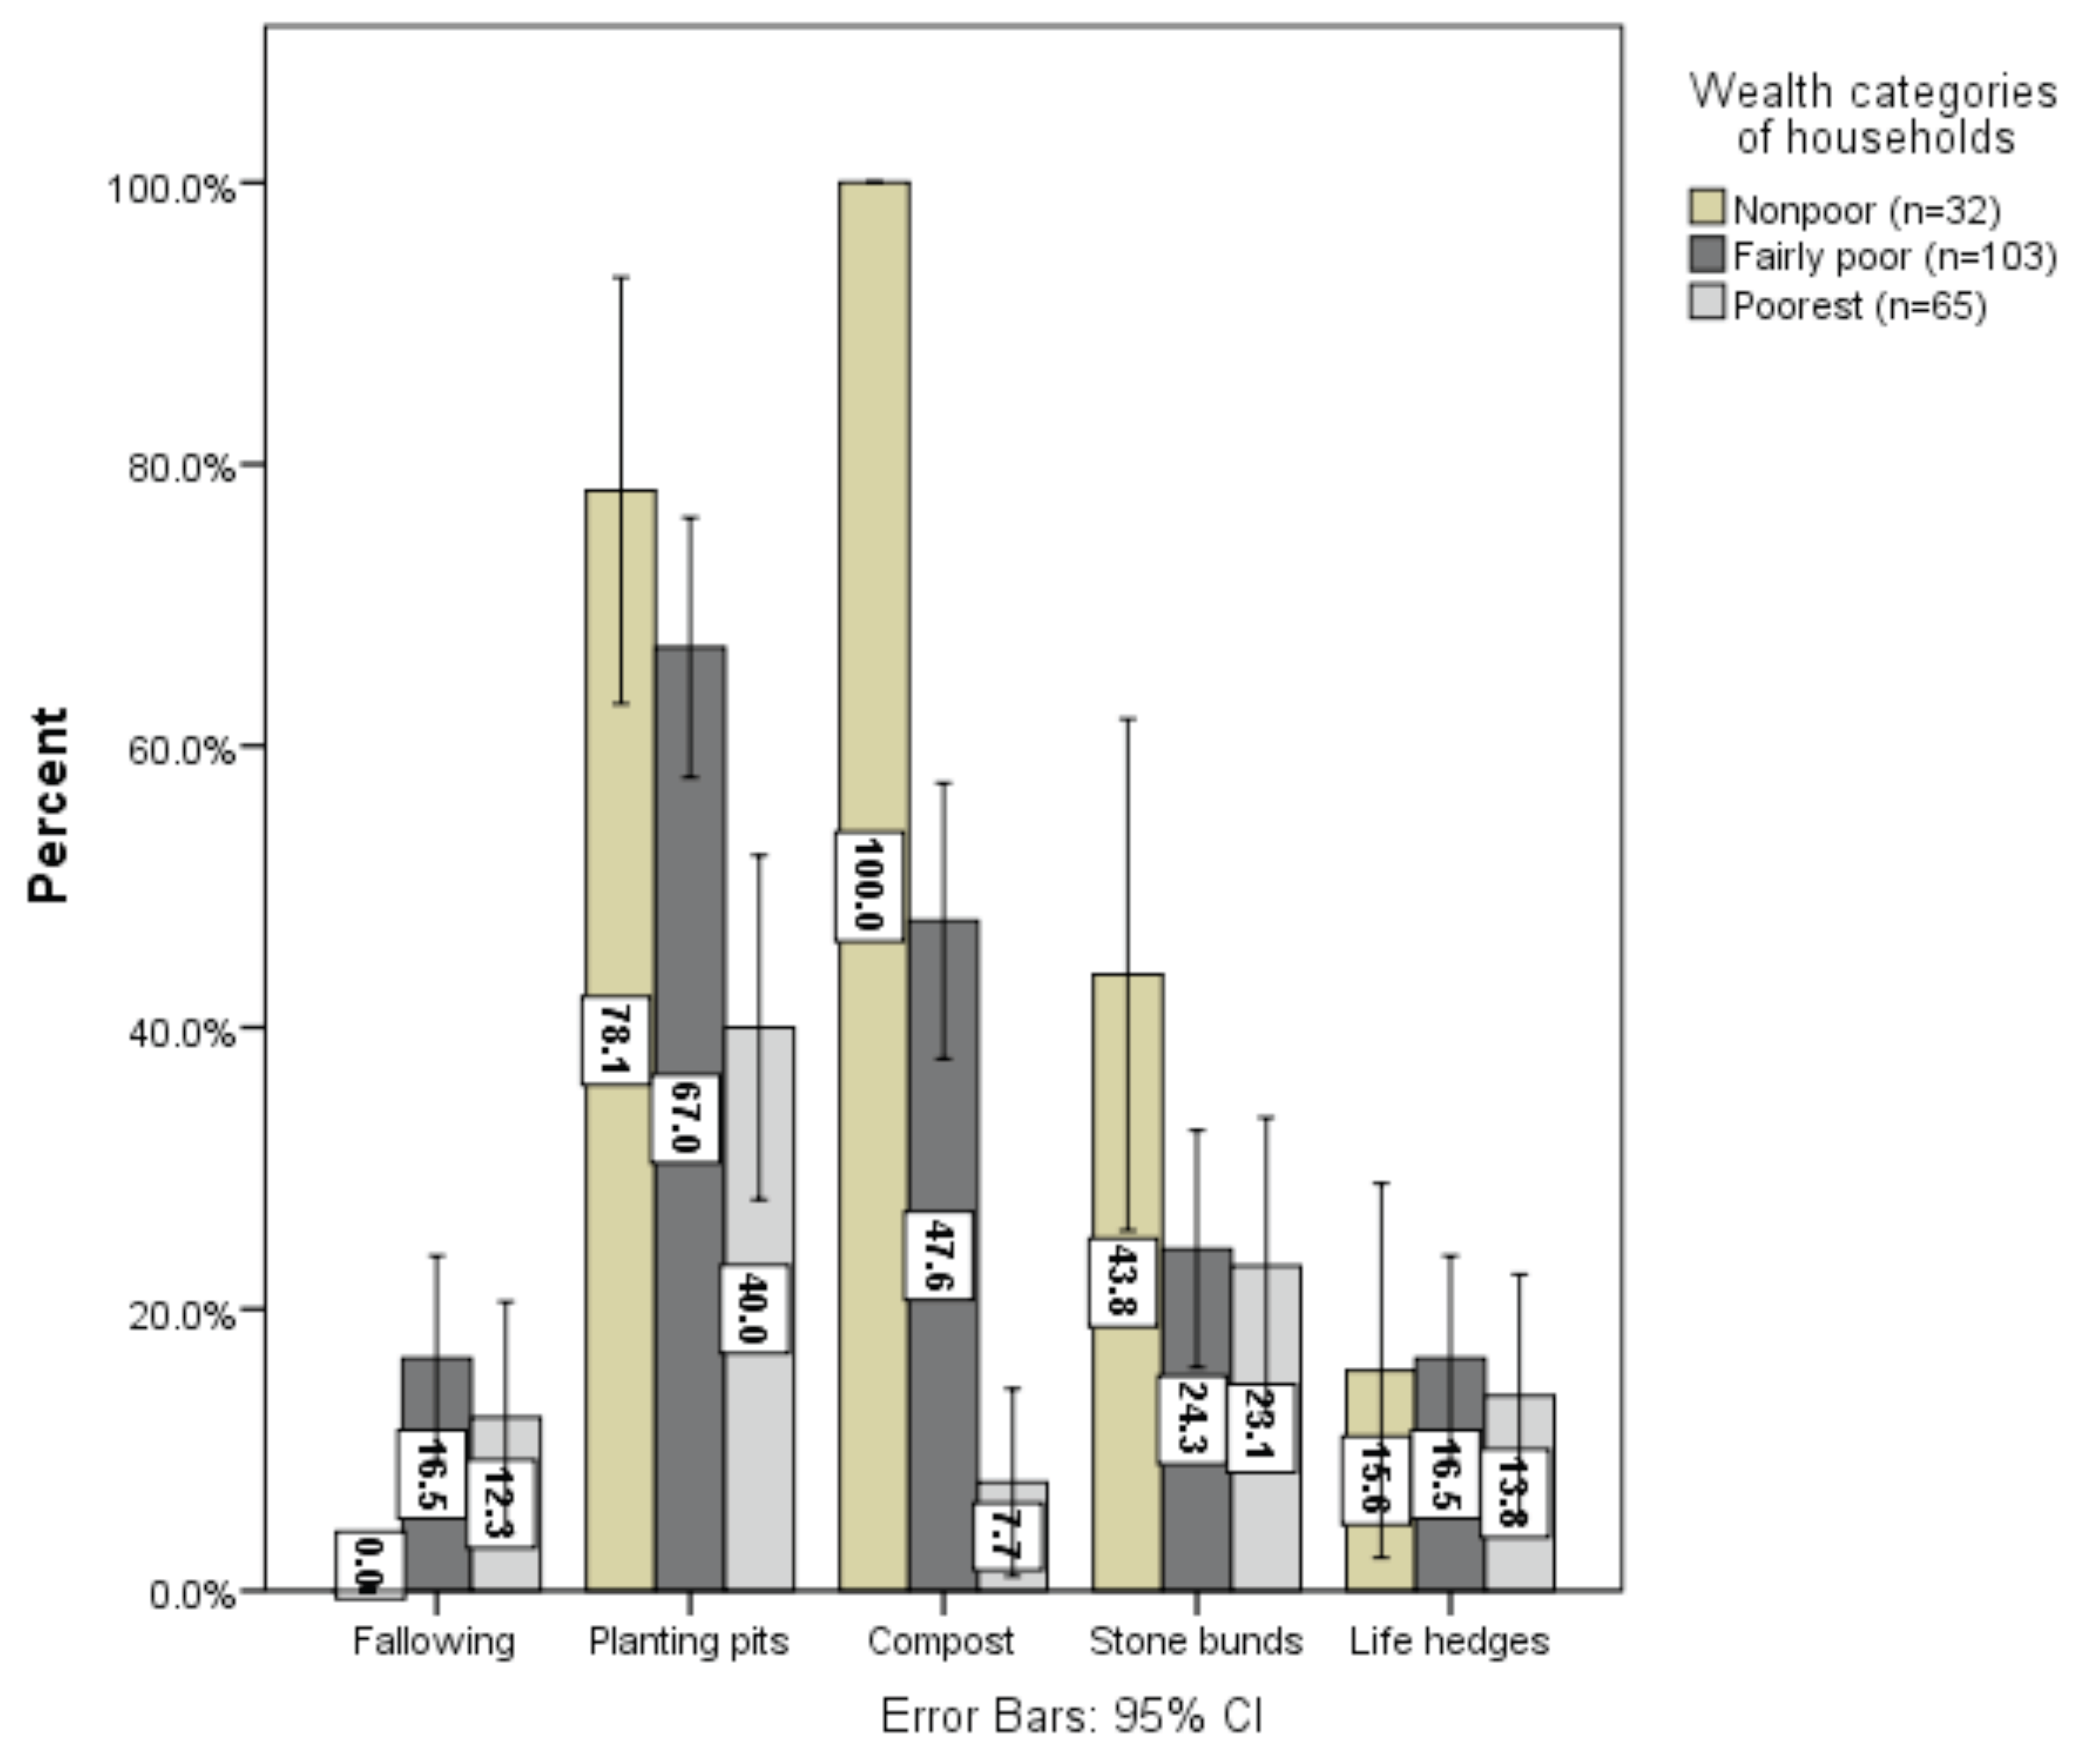
3.3. Land Management Practices Adopted by Respondents
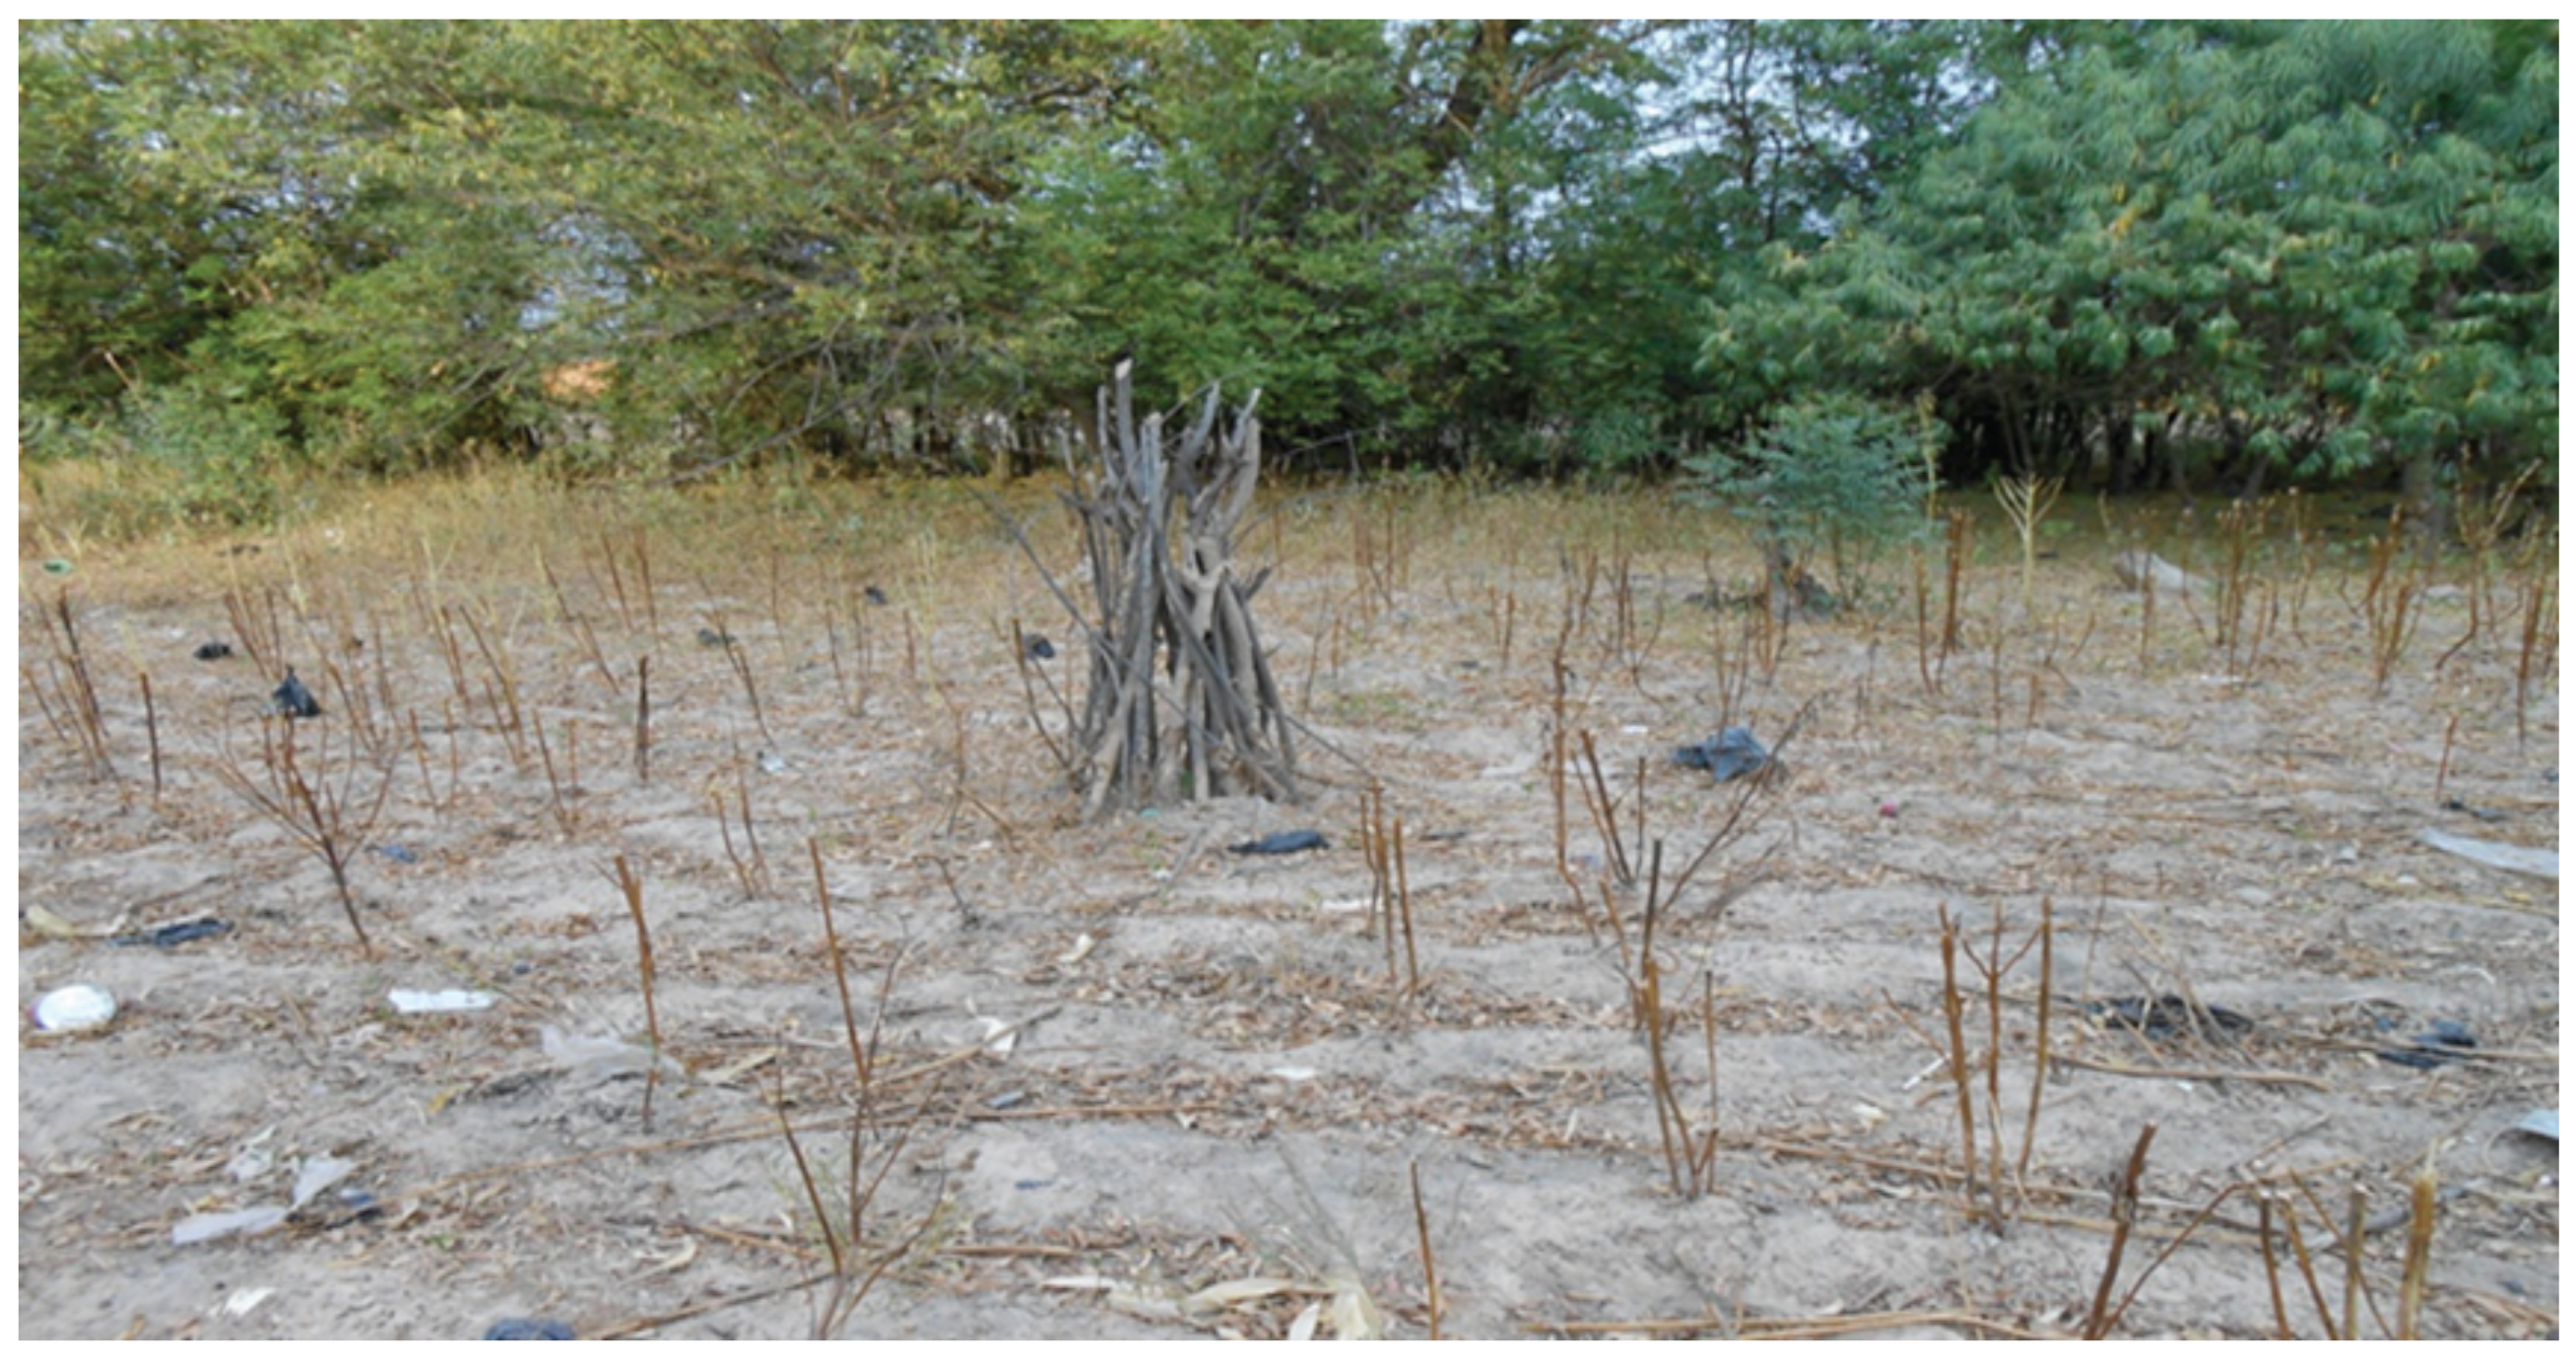
3.3.1. Fallows
3.3.2. Planting Pits
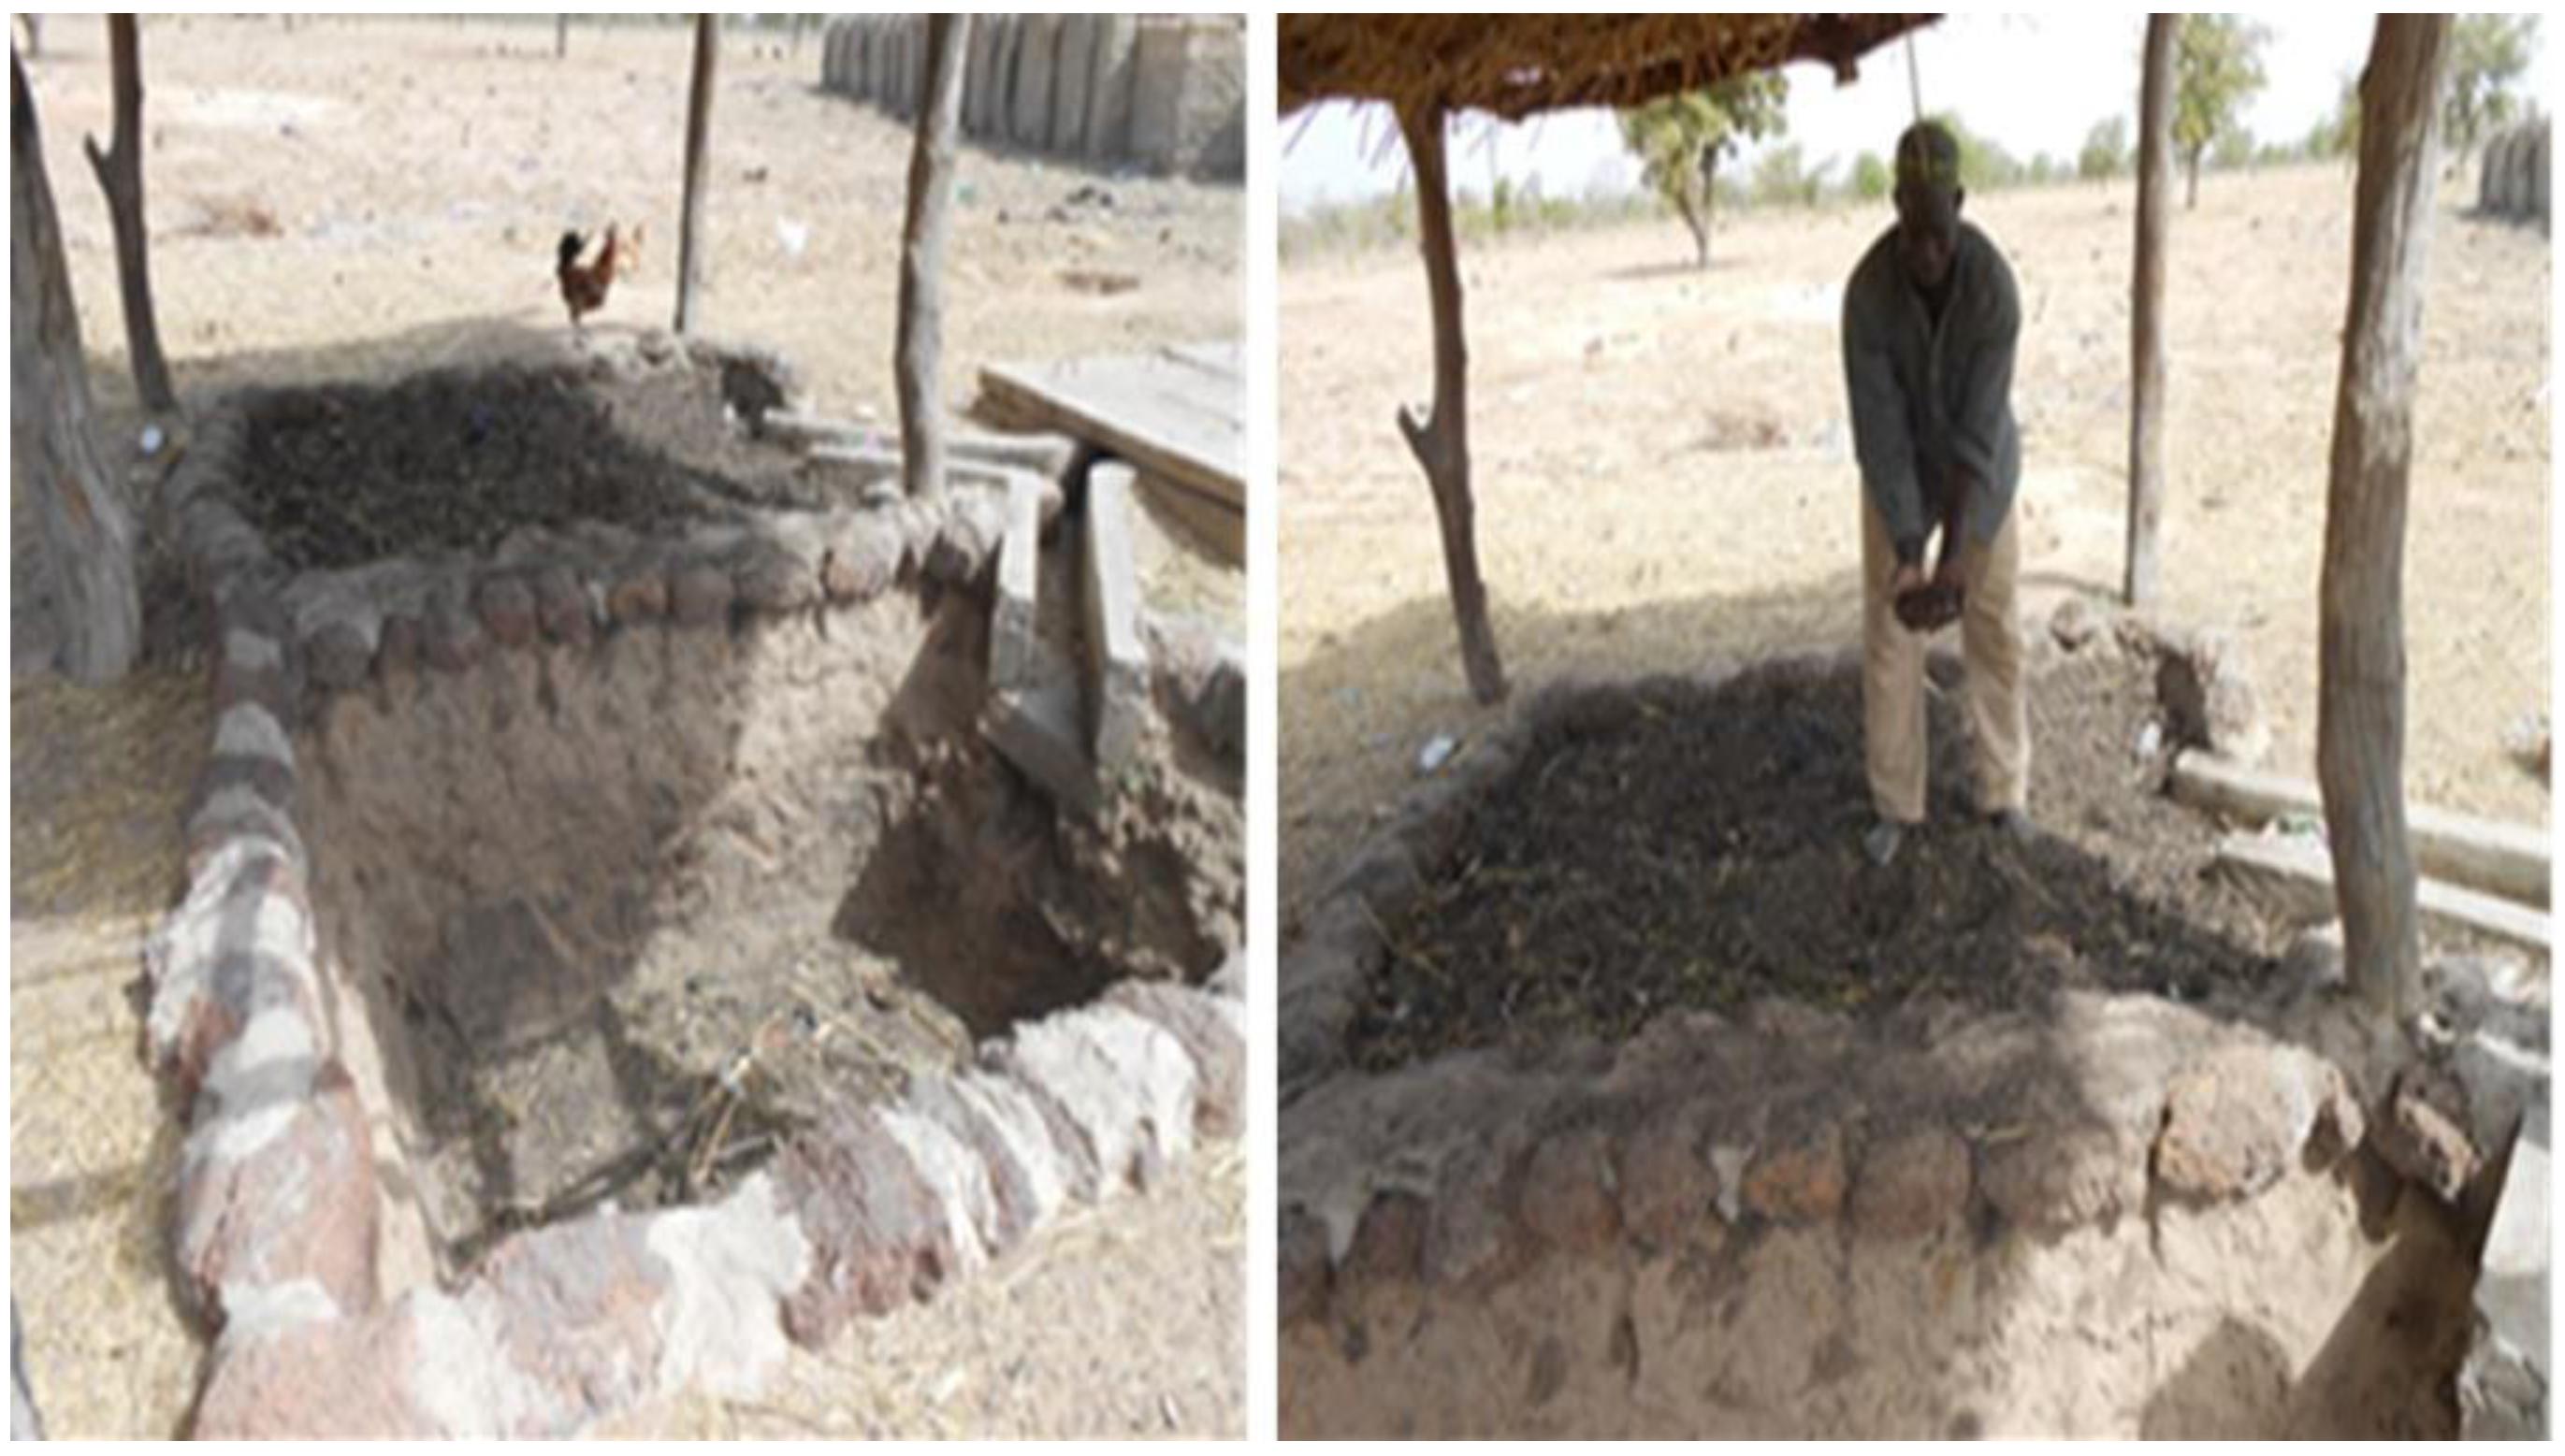
3.3.3. Composting
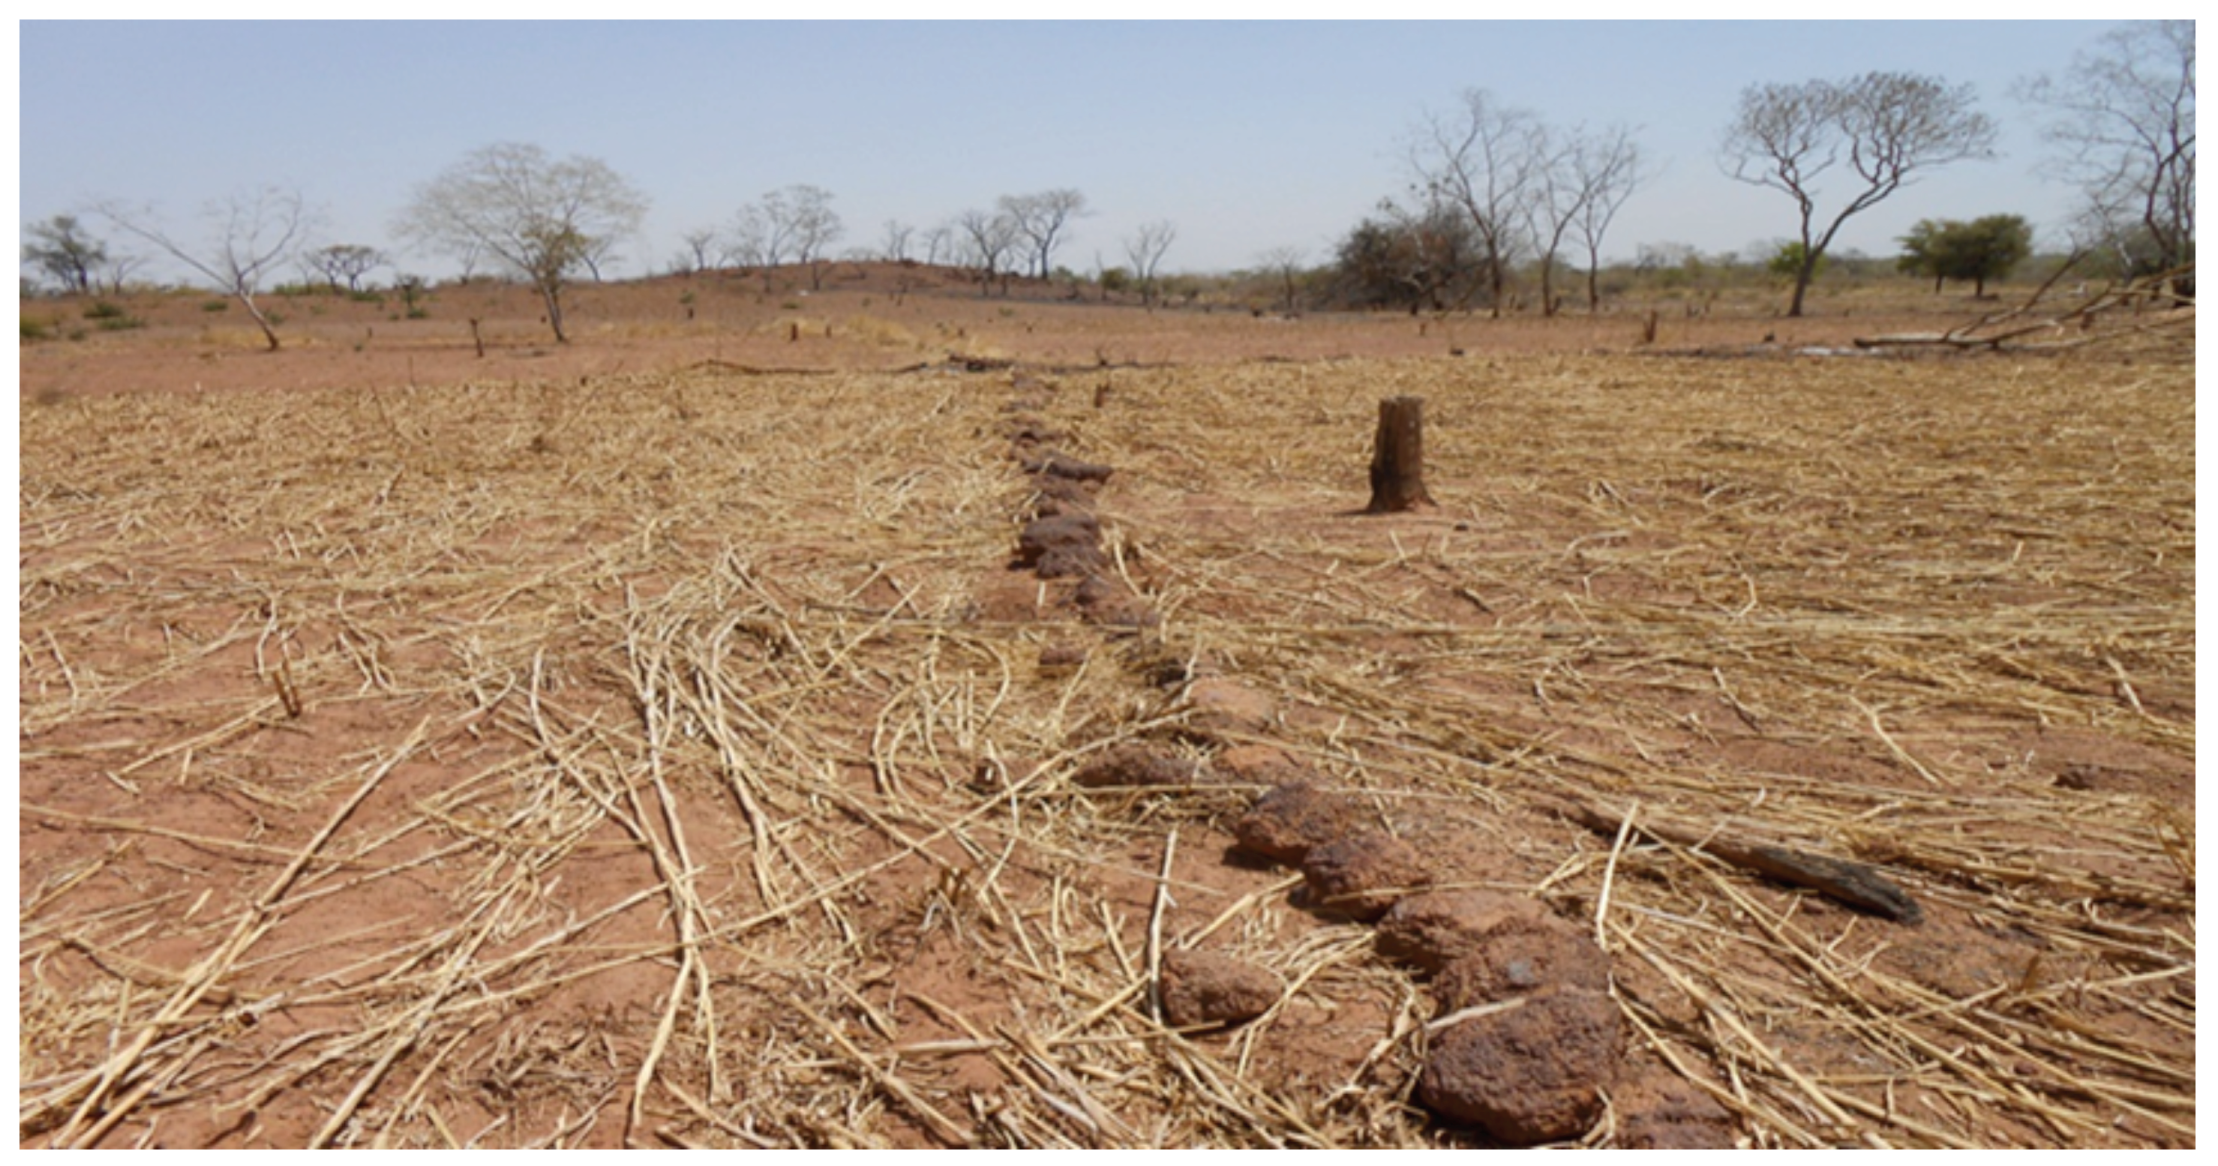
3.3.4. Stone Bunds
3.3.5. Live Hedges
4. Limitations
5. Conclusions
Acknowledgments
Author Contributions
Conflicts of Interest
Appendix

| Dependent Variable | Mean Difference (I–J) | Std. Error | Sig. | 95% Confidence Interval | |||
|---|---|---|---|---|---|---|---|
| Lower Bound | Upper Bound | ||||||
| Annual average deforestation | Non-poor | Fairly poor | 0.08 | 0.06 | 0.40 | −0.07 | 0.22 |
| Poorest | 0.17 * | 0.06 | 0.01 | 0.02 | 0.33 | ||
| Fairly poor | Non-poor | −0.08 | 0.06 | 0.40 | −0.22 | 0.06 | |
| Poorest | 0.09 | 0.05 | 0.10 | −0.01 | 0.21 | ||
| Poorest | Non-poor | −0.17 * | 0.06 | 0.01 | −0.33 | −0.02 | |
| Fairly poor | −0.09 | 0.05 | 0.10 | −0.21 | 0.01 | ||
| Dependent Variable | Mean Difference (I–J) | Std. Error | Sig. | 95% Confidence Interval | ||||
|---|---|---|---|---|---|---|---|---|
| Lower Bound | Upper Bound | |||||||
| Number of cattle | Scheffe | Non-poor | Fairly poor | 37.22 * | 2.82 | 0.000 | 30.27 | 44.17 |
| Poorest | 40.85 * | 3.01 | 0.000 | 33.44 | 48.27 | |||
| Fairly poor | Non-poor | −37.22 * | 2.82 | 0.000 | −44.17 | −30.27 | ||
| Poorest | 3.64 | 2.20 | 0.259 | −1.80 | 9.07 | |||
| Poorest | Non-poor | −40.85 * | 3.01 | 0.000 | −48.27 | −33.44 | ||
| Fairly poor | −3.64 | 2.20 | 0.259 | −9.07 | 1.80 | |||
| Dunnett C | Non-poor | Fairly poor | 37.22 * | 6.12 | 22.15 | 52.28 | ||
| Poorest | 40.85 * | 6.11 | 25.80 | 55.90 | ||||
| Fairly poor | Non-poor | −37.22 * | 6.12 | −52.28 | −22.15 | |||
| Poorest | 3.64 * | 0.33 | 2.86 | 4.41 | ||||
| Poorest | Non-poor | −40.85 * | 6.11 | −55.90 | −25.80 | |||
| Fairly poor | −3.64 * | 0.33 | −4.41 | −2.86 | ||||
| Monthly fuel wood consumption (m3) | Scheffe | Non-poor | Fairly poor | 0.43 * | 0.15 | 0.016 | 0.06 | 0.79 |
| Poorest | 0.97 * | 0.16 | 0.000 | 0.57 | 1.36 | |||
| Fairly poor | Non-poor | −0.43 * | 0.15 | 0.016 | −0.79 | −0.06 | ||
| Poorest | 0.53 * | 0.12 | 0.000 | 0.25 | 0.82 | |||
| Poorest | Non-poor | −0.97 * | 0.16 | 0.000 | −1.36 | −0.57 | ||
| Fairly poor | −0.53 * | 0.12 | 0.000 | −0.82 | −0.25 | |||
| Dunnett C | Non-poor | Fairly poor | 0.43 | 0.19 | −0.06 | 0.92 | ||
| Poorest | 0.97 * | 0.19 | 0.49 | 1.44 | ||||
| Fairly poor | Non-poor | −0.43 | 0.19 | −0.92 | 0.06 | |||
| Poorest | 0.53 * | 0.09 | .31 | 0.76 | ||||
| Poorest | Non-poor | −0.97 * | 0.19 | −1.44 | −0.49 | |||
| Fairly poor | −0.53 * | 0.09 | −0.76 | −0.31 | ||||
| Quantity of cotton produced(kg) | Scheffe | Non-poor | Fairly poor | −34.25 | 36.29 | 0.641 | −123.77 | 55.27 |
| Poorest | 42.62 | 38.73 | 0.547 | −52.90 | 138.14 | |||
| Fairly poor | Non-poor | 34.25 | 36.29 | 0.641 | −55.27 | 123.77 | ||
| Poorest | 76.87 * | 28.40 | 0.027 | 6.79 | 146.94 | |||
| Poorest | Non-poor | −42.62 | 38.73 | 0.547 | −138.14 | 52.90 | ||
| Fairly poor | −76.87 * | 28.41 | 0.027 | −146.94 | −6.79 | |||
| Dunnett C | Non-poor | Fairly poor | −34.25 | 42.31 | −137.58 | 69.08 | ||
| Poorest | 42.62 | 39.27 | −53.78 | 139.02 | ||||
| Fairly poor | Non-poor | 34.25 | 42.31 | −69.08 | 137.58 | |||
| Poorest | 76.87 * | 23.87 | 19.95 | 133.79 | ||||
| Poorest | Non-poor | −42.62 | 39.27 | −139.02 | 53.78 | |||
| Fairly poor | −76.87 * | 23.87 | −133.79 | −19.95 | ||||
References
- Bojö, J.; Bucknall, J.; Hamilton, K.; Kishor, N.; Kraus, C.; Pillai, P. Environment Chapter, Poverty Reduction Strategy Papers’ Source Book; World Bank: Washington, DC, USA, 2001. [Google Scholar]
- Bosch, C.; Hommann, K.; Rubio, G.M.; Sadoff, C.; Travers, L. Water, Sanitation and Poverty Chapter, Poverty Reduction Strategy Papers’ Source Book; World Bank: Washington, DC, USA, 2001. [Google Scholar]
- Mabogunje, A.L. Poverty and environmental degradation: Challenges within the global economy. Sci. Policy Sustain. Dev. 2002, 44, 8–19. [Google Scholar] [CrossRef]
- World Commission for Environment and Development. Our Common Future; Oxford University Press: Oxford, UK, 1987. [Google Scholar]
- Moseley, W.G. Environmental degradation and the “poor” smallholders in the West African Sudano-Sahel: Global discourses and local realities. In African Environment and Development: Rhetoric, Programmes, Realities; Moseley, W.G., Logan, B.I., Eds.; Ashgate Publishing: Aldershot, UK, 2004; pp. 41–62. [Google Scholar]
- Ravnborg, H.M. Poverty and environmental degradation in the Nicaraguan Hillsides. World Dev. 2003, 31, 1933–1946. [Google Scholar] [CrossRef]
- Swinton, S.M.; Quiroz, R. Is poverty to blame for soil, pasture and forest degradation in Peru’s Altiplano? World Dev. 2003, 31, 1903–1919. [Google Scholar] [CrossRef]
- Gray, C.L.; Moseley, W.G. A geographical perspective on poverty-environmental interactions. Geogr. J. 2005, 171, 9–23. [Google Scholar] [CrossRef]
- Duraiappah, A.K. Poverty and environmental degradation: A review and analysis of the nexus. World Dev. 1998, 12, 2169–2179. [Google Scholar] [CrossRef]
- Angelsen, A. The poverty of the environment and the environment of poverty. In Poverty and the Environment, Proceedings of the CROP/ADIPA/UNCTAD workshop, Sabah, Malaysia, October 1995; Angelsen, A., Vainio, M., Eds.; Comparative Research Programme on Poverty (CROP) Publications: Bergen, Norway, 1998; pp. 2–18. [Google Scholar]
- Boyce, J.K. Inequality as a cause of environmental degradation. Ecol. Econ. 1994, 11, 169–178. [Google Scholar] [CrossRef]
- Leach, M.; Mearns, R.; Scoones, I. Environmental Entitlements: Dynamics and Institutions in Community-Based Natural Resource Management. World Dev. 1999, 2, 225–247. [Google Scholar] [CrossRef]
- Forest Investment Program. REDD Preparation Plan; Ministry of Environment and Sustainable Development: Ouagadougou, Burkina Faso, 2012.
- Kambire, H.W.; Djenontin, I.N.S.; Kabore, A.; Djoudi, H.; Balinga, M.P.B.; Zida, M.; Assembe-Mvondo, S. La REDD+ et l’Adaptation aux Changements Climatiques au Burkina Faso: Causes, Agents et Institutions; CIFOR: Bogor, Indonesia, 2015. [Google Scholar]
- Kaminski, J.; Headey, D.; Bernard, T. The Burkinabe cotton story 1992–2007: Sustainable success or sub-saharan mirage? World Dev. 2011, 39, 1460–1475. [Google Scholar] [CrossRef]
- Ouedraogo, I.; Savadogo, P.; Tigabu, M.; Cole, R.; Odén, P.C.; Ouadba, J.M. Is rural migration a threat to environmental sustainability in Southern Burkina Faso? Land Degrad. Dev. 2009, 20, 217–230. [Google Scholar] [CrossRef]
- Johnson, D.L.; Ambrose, S.H.; Bassett, T.T.; Bowen, M.L.; Crummey, D.E.; Isaacson, J.S.; Johnson, D.N.; Lamb, P.; Saul, M.; Winter-Nelson, A.E. Meanings of environmental terms. J. Environ. Qual. 1997, 26, 581–589. [Google Scholar] [CrossRef]
- Abu Hammad, A.; Tumeizi, A. Land degradation: Socioeconomic and environmental causes and consequences in the eastern Mediterranean. Land Degrad. Dev. 2012, 23, 216–226. [Google Scholar] [CrossRef]
- Mortimore, M. The Future of Family Farms in West Africa: What Can We Learn from Long-Term Data? Drylands Issue Paper No. 119; IIED: London, UK, 2003. [Google Scholar]
- Belem, M.; Bayala, J.; Kalinganire, A. Defining the poor by the rural communities of Burkina Faso: Implications for the development of sustainable parkland management. Agrofor. Syst. 2011, 83, 287–302. [Google Scholar] [CrossRef]
- United Nations Development Programme (UNDP). Human Development Report 2006—Beyond Scarcity: Power, Poverty and the Global Water Crisis; United Nations Development Programme (UNDP): New York, NY, USA, 2006. [Google Scholar]
- Chomitz, K. At loggerheads? Agricultural Expansion, Poverty Reduction, and Environment in the Tropical Forests; World Bank Policy Research Report; World Bank: Washington, DC, USA, 2007. [Google Scholar]
- Ouedraogo, I.; Tigabu, M.; Savadogo, P.; Compaoré, H.; Odén, P.C.; Ouadba, J.M. Land cover change and its relation with population dynamics in Burkina Faso, West Africa. Land Degrad. Dev. 2010, 21, 453–462. [Google Scholar] [CrossRef]
- Paré, S.; Söderberg, U.; Sandewall, M.; Ouadba, J.M. Land use analysis from spatial and field data capture in Southern Burkina Faso, West Africa. Agric. Ecosyst. Environ. 2008, 127, 277–285. [Google Scholar] [CrossRef]
- Ingram, K.T.; Roncoli, M.C.; Kirshen, P.H. Opportunities and constraints for farmers of West Africa to use seasonal precipitation forecasts with Burkina Faso as a case study’. Agric. Syst. 2002, 74, 331–349. [Google Scholar] [CrossRef]
- Driessen, P.; Deckers, J.; Spaargaren, O. Lectures Notes on the Major Soils of the World; FAO World Soil Resources, Report-94; Food and Agriculture Organization of the United Nations: Rome, Italy, 2001. [Google Scholar]
- Institut National des Statistiques et de la Démographie (INSD). Résultats Préliminaires du Recensement Général de la Population et de l’Habitat de 2006; Institut National des Statistiques et de la Démographie (INSD), Direction de la Démographie: Ouagadougou, Burkina Faso, 2007. [Google Scholar]
- Fontes, J.; Guinko, S. Carte de Végétation et de l’Occupation du sol du Burkina Faso; Projet Campus; UPS: Toulouse, France, 1995. [Google Scholar]
- Balen, J.; McManus, D.; Yue-Sheng, L.; Zheng-Yuan, Z.; Li-Ping, Y.; Utzinger, J.; Williams, G.M.; Li, Y.; Ren, M.Y.; Liu, Z.C.; et al. Comparison of two approaches for measuring household wealth via an asset-based index in rural and Peri-urban settings of Hunan province, China. Emerg. Themes Epidemiol. 2010, 7, 7. [Google Scholar] [CrossRef] [PubMed]
- Laderchi, C.R.; Saith, R.; Stewart, F. Does it matter that we do not agree on the definition of poverty? A comparison of four approaches. Oxf. Dev. Stud. 2003, 31, 243–274. [Google Scholar] [CrossRef]
- Weng, X. The Rural Informal Economy: Understanding Drivers and Livelihood Impacts in Agriculture, Timber and Mining; IIED Working Paper; IIED: London, UK, 2015; Available online: http://pubs.iied.org/16590IIED.html?r=p (accessed on 15 March 2016).
- Booysen, F.; van der Berg, S.; Burger, R.; van Maltitz, M.; de Rand, G. Using an asset index to assess trends in poverty in seven sub-Saharan African countries. World Dev. 2008, 6, 1113–1130. [Google Scholar] [CrossRef]
- Narayan, D.; Chambers, R.; Shah, M.K.; Petesch, P. Voices of the Poor: Crying out for Change; Oxford University Press USA for the World Bank: New York, NY, USA, 2000. [Google Scholar]
- Ouedraogo, I.; Mbow, C.; Balinga, M.; Neufeldt, H. Transitions in land use architecture under multiple human driving forces in a semi-arid zone. Land 2015, 4, 560–577. [Google Scholar] [CrossRef]
- Swinton, S.M.; Escobar, G.; Reardon, T. Poverty and environment in Latin America: Concepts, evidence and policy implications. World Dev. 2003, 31, 1865–1872. [Google Scholar] [CrossRef]
- Teshome, A.; de Graaff, J.; Ritsema, C.; Kassie, M. Farmers’ perceptions about the influence of land quality, land fragmentation and tenure systems on sustainable land management in the north western Ethiopian Highlands. Land Degrad. Dev. 2014. [Google Scholar] [CrossRef]
- Ravnborg, H.M.; Escolán, R.M.; Guerrero, M.P.; Méndez, M.A.; Méndoza, F.; de Páez, E.M.; Motta, F. Developing Regional Poverty Profiles Based on Local Perceptions; CIAT Publication No. 291; Centro Internacional de Agricultura Tropical (CIAT): Cali, Colombia, 1999. [Google Scholar]
- Etongo, D.; Djenontin, I.N.S.; Kanninen, M.; Fobissie, K.; Korhonen-Kurki, K.; Djoudi, H. Land tenure, asset heterogeneity and deforestation in Southern Burkina Faso. For. Policy Econ. 2015, 61, 51–58. [Google Scholar] [CrossRef]
- Gray, L.C. What kind of intensification? Agricultural practices, soil fertility and socioeconomic differentiation in rural Burkina Faso. Geogr. J. 2005, 171, 70–82. [Google Scholar] [CrossRef]
- Reenberg, A.; Oksen, P.; Svendsen, J. Land use Changes vis-à-vis agricultural development in Southeastern Burkina Faso: The field expansion dilemma. Geogr. Tidsskr. Dan. J. Geogr. 2003, 103, 57–69. [Google Scholar] [CrossRef]
- Jones, D.W.; Dale, V.H.; Beauchamp, J.J.; Pedlowski, M.A.; O’Neill, R.V. Farming in Rondomia. Resour. Energy Econ. 1995, 17, 155–188. [Google Scholar] [CrossRef]
- Ouédraogo, M.; Tankoano, A.; Ouédraogo, Z.T.; Guissou, I.P. Etude des facteurs des risques d’intoxications chez les utilisateurs de pesticides dans la region cotonnière de Fada N’Gourma au Burkina Faso. Environ Risque Santé 2009, 8, 343–347. [Google Scholar]
- Toe, A.M.; Kinane, M.L. Les pesticides au Burkina Faso/ Pesticide in Burkina Faso, Dakar-Fann. Available online: https://searchworks.stanford.edu/view/9154884 (accessed on 26 July 2015).
- Toe, A.M.; Ouedraogo, M.; Ouedraogo, R.; Ilboudo, S.; Guissou, P.I. Pilot study on agricultural pesticides poisoning in Burkina Faso. Interdiscip Toxicol 2013, 6, 185–191. [Google Scholar] [CrossRef] [PubMed]
- Brocard, D.; Lacaux, J.P.; Eva, H. Domestic biomass combustion and associated atmospheric emissions in West Africa. Glob. Biogeochem. Cycle 1998, 12, 127–139. [Google Scholar] [CrossRef]
- Kituyi, E.; Marufu, L.; Huber, B.; Wandiga, S.O.; Jumba, I.O.; Andreae, M.O.; Helas, G. Biofuel consumption rates and patterns in Kenya. Biomass Bioenergy 2001, 20, 83–99. [Google Scholar] [CrossRef]
- Niemeijer, D.; Mazzucato, V. Soil degradation in the West African Sahel: How serious is it? Environ. Sci. Policy Sustain. Dev. 2002, 44, 20–31. [Google Scholar] [CrossRef]
- Larwanou, M.; Saadou, M. The role of human interventions in tree dynamics and environmental rehabilitation in the Sahel zone of Niger. J. Arid Environ. 2011, 75, 194–200. [Google Scholar] [CrossRef]
- Place, F.; Binam, J.N. Economic Impacts of Farmer Managed Natural Regeneration in the Sahel: End of Project Technical Report; Free University, International Fund for Agricultural Development (IFAD): Amsterdam, NY, USA, 2013. [Google Scholar]
- Weston, P.; Hong, R.; Kaboré, C.; Kull, C.A. Farmer-managed natural regeneration enhances rural livelihoods in dryland West Africa. Environ. Manag. 2015, 55, 1402–1417. [Google Scholar] [CrossRef] [PubMed]
- Nabahungu, N.L.; Visser, S.M. Farmers’ knowledge and perception of agricultural wetland management in Rwanda. Land Degrad. Dev. 2013, 24, 363–374. [Google Scholar] [CrossRef]
- Karltun, E.; Lemenih, M.; Tolera, M. Comparing farmers’ perception of soil fertility change with soil properties and crop performance in Beseku, Ethiopia. Land Degrad. Dev. 2013, 24, 228–235. [Google Scholar] [CrossRef]
- Morgan, G.A.; Leech, N.L.; Gloeckner, G.W.; Barrett, K.C. SPSS for Introductory Statistics: Use and Interpretation, 2nd ed.; Lawrence Erlbaum Associates: Mahwah, NJ, USA, 2004. [Google Scholar]
- Hilton, A.; Armstrong, R.A. Is one set of data more variable than another? Microbiologist 2006, 7, 34–36. [Google Scholar]
- Field, A.P. Discovering Statistics Using IBM SPSS Statistics: And Sex and Drugs and Rock’n’roll, 4th ed.; Sage: London, UK, 2013. [Google Scholar]
- Ton, P. Cotton Production and Rural Livelihoods in West Africa; Oxfam: Oxford, UK, 2001. [Google Scholar]
- Bonnassieux, A. Filière coton, émergence des organisations de producteurs et transformations territoriales au Mali et au Burkina Faso. Les Cahiers d’Outre-Mer 2002, 220, 421–434. [Google Scholar] [CrossRef]
- Sawadogo, L. Adapter les Approches de l’Aménagement Durable Des Forêts Sèches Aux Aptitudes Sociales, Economiques et Technologiques en Afrique; Center for International Forestry Research (CIFOR): Bogor, Indonesia, 2006. [Google Scholar]
- Ndiaye, O.; Zoungrana, P. Techniques de maintien de la fertilité des sols: Une Revolution Silencieuse de l’Agriculture. Available online: http://www.inter-reseaux.org/auteur/philippe-zoungrana (accessed on 30 December 2014).
- Ouédraogo, E.; Mando, A.; Zombré, N.P. Use of compost to improve soil properties and crop productivity under low input agricultural system in West Africa. Agric. Ecosyst. Environ. 2001, 84, 259–266. [Google Scholar] [CrossRef]
- Reij, C.; Tappan, G.; Belemvire, A. Changing land management practices and vegetation on the Central Plateau of Burkina Faso (1968–2002). J. Arid Environ. 2005, 63, 642–659. [Google Scholar] [CrossRef]
- McClintock, N.C.; Diop, A.M. Soil fertility management and compost use in Senegal’s Peanut Basin. Int. J. Agric. Sustain. 2005, 3, 1473–5903. [Google Scholar] [CrossRef]
- Ouédraogo, M. Land Tenure and Rural Development in Burkina Faso: Issues and Strategies; Issue Paper No. E112; International Institute for Environment and Development (IIED): London, UK, 2002; Available online: http://www.iied.org/ (accessed on 4 June 2014).
- Bai, Z.G.; Dent, D.L.; Olsson, L.; Schaepman, M.E. Proxy global assessment of land degradation. Soil Use Manag. 2008, 24, 223–234. [Google Scholar] [CrossRef]
- Lenhardt, A.; Glennie, J.; Intscher, N.; Ali, A.; Morin, G. A Greener Burkina: Sustainable Farming Techniques, Land Reclamation and Improved Livelihoods; Development Progress Case Study Report; Overseas Development Institute: London, UK, 2014; Available online: http://www.odi.org/sites/odi.org.uk/files/odi-assets/publications-opinion-files/9153.pdf (accessed on 5 January 2015).
- Robinson, B.E.; Holland, M.B.; Naughton-Treves, L. Does secure land tenure save forest? A meta-analysis of the relationship between land tenure and tropical deforestation. Glob. Environ. Chang. 2013, 29, 281–293. [Google Scholar] [CrossRef]
- Ajayi, O.C.; Franzel, S.; Kuntashala, E.; Kwesiga, F. Adoption of improved fallow technology for soil fertility management in Zambia: Empirical studies and emerging issues. Agrofor. Syst. 2003, 59, 317–326. [Google Scholar] [CrossRef]
- Kenta, I.; Shinjo, H.; Tanaka, U.; Tobita, S.; Funakawa, S.; Kosaki, T. Fallow Band System, a land management practices for controlling desertification and improving crop production in the Sahel, West Africa, Effectiveness in desertification control and soil fertility improvement. Soil Sci. Plant Nutr. 2011, 57, 573–586. [Google Scholar]
- Somda, J.; Nianogo, A.J.; Nassa, S.; Sanou, S. Soil fertility management and socio-economic factors in crop-livestock systems in Burkina Faso: A case study of composting technology. Ecol. Econ. 2002, 43, 175–183. [Google Scholar] [CrossRef]
- Zougmore, R.; Gnankambary, Z.; Guillobez, S.; Stroosnijder, L. Effects of stone lines on soil chemical characteristics under continuous sorghum cropping in semiarid Burkina Faso. Soil Tillage Res. 2002, 66, 47–53. [Google Scholar] [CrossRef]
- Kaboré, D.; Reij, C. The Emergence and Spreading of an Improved Traditional Soil and Water Conservation Practice in Burkina Faso; EPTD Discussion Paper No. 114; International Food Policy Research Institute: Washington, DC, USA, 2004; Available online: http://www.ifpri.org/publication/emergence-and-spreading-improved-traditional-soil-and-water-conservation-practice-burkin (accessed on 31 December 2014).
- Leenders, J.K.; Sterk, G.; van Boxel, J.H. Wind erosion reduction by scattered woody vegetation in farmers’ fields in northern Burkina Faso. Land Degrad. Dev. 2014. [Google Scholar] [CrossRef]
- Grimaldi, S.; Angeluccetti, I.; Coviello, V.; Vezza, P. Cost-effectiveness of soil and water conservation measures on the catchment sediment budget—The Laaba watershed case study, Burkina Faso. Land Degrad. Dev. 2013. [Google Scholar] [CrossRef]

| Indicator | Score | Description |
|---|---|---|
| Access to land | 0 | Owns more than 10 ha of land |
| 50 | Owns between 4 and 10 ha of land | |
| 100 | Owns less than 4 ha of land | |
| Food security | 0 | Household without a period of food shortage in the last 3 years |
| 50 | Experienced a food shortage in the last 3 years that lasted <3 months | |
| 100 | Experienced a food shortage in the last 3 years that lasted >3 months | |
| Healthcare | 0 | Capable of paying for the services of a doctor in the district hospital and beyond |
| 50 | Capable of paying for doctors’ services limited to the district hospital | |
| 100 | Household is unable to pay for a doctor’s service and relies on herbal medicine | |
| Nonagricultural sources of income | 0 | Receives income from the sale of livestock, household shops, owns a truck for transportation |
| 50 | Uses cart to transport crops for income, sells food and non-timber forest products | |
| 100 | Household does not have any other source of nonagricultural income | |
| Sale of crops | 0 | Sells more than half of cereals produced while satisfying household needs |
| 50 | Selling up to half of cereal produced will lead to a food shortage | |
| 100 | Does not sell cereals and is not self-sufficient, depends heavily on non-timber forest products (NTFPs) | |
| Agricultural equipment | 0 | Cultivates the land with tractor and draught ox, owns compost production facilities |
| 50 | Cultivates with donkeys and is capable of buying compost to use on farm | |
| 100 | Cultivates the land with hand hoes and cutlasses | |
| Tree resources | 0 | Owns tree plantations (fruit trees, poles for construction, etc.) |
| 50 | Has a few trees on farm and around compound for subsistence and commercial use | |
| 100 | Does not own trees on farm and compound but depends on the forest for NTFPs | |
| Livestock ownership | 0 | Owns three or more herds of cattle (a herd is 10 cows) |
| 50 | Owns less than three herds of cattle | |
| 100 | Does not own any cattle | |
| Ownership of other animals | 0 | Owns three droves of donkeys, goats, and sheep (a drove is 10 animals) |
| 50 | Owns less than three droves of donkeys, goats, and sheep | |
| 100 | Does not own any donkeys, goats, or sheep | |
| Household gadgets | 0 | Owns TV/solar panel, radio/radio-cassette player and Yamaha generator |
| 50 | Owns radio/radio-cassette player, uses motor battery to generate electricity | |
| 100 | Does not own electrical appliances but uses kerosene lamp | |
| Transportation | 0 | Owns ≥ 1 car and ≥ 1 motorcycle |
| 50 | Owns a motorcycle and a cart | |
| 100 | Owns a bicycle and other members of the household often go on foot | |
| Institutional credit | 0 | Has the required collateral security for credit and is capable of paying back |
| 50 | Limited collateral for credit and might be unable to pay if externalities arises | |
| 100 | Lacks collateral for credit and also lacks the potential for repayment |
| Households Characteristics | Wealth Categories of Households (%) | Total (%) | Chi-Square Tests | ||||
|---|---|---|---|---|---|---|---|
| Non-Poor | Fairly Poor | Poorest | Value | Asymp. Sig. (2-Sided) | |||
| Ethnic group | Gourounsi | 0.0 | 48.5 | 64.6 | 46.0 | 108.147 | 0.000 |
| Mossi | 34.4 | 47.6 | 35.4 | 41.5 | |||
| Fulani | 65.6 | 3.9 | 0.0 | 12.5 | |||
| Level of education | No education | 96.9 | 78.6 | 87.7 | 84.5 | 6.947 | 0.031 |
| Education | 3.1 | 21.4 | 12.3 | 15.5 | |||
| Perceived tenure security | Insecure | 100.0 | 51.5 | 35.4 | 54.0 | 36.595 | 0.000 |
| Secure | 0.0 | 48.5 | 64.6 | 46.0 | |||
| Number of cattle | ≤9 | 0.0 | 85.4 | 100.0 | 76.5 | 128.713 | 0.000 |
| ≥10 | 100.0 | 14.6 | 0.0 | 23.5 | |||
| Variables | Descriptive statistics | One-way ANOVA | ||||
|---|---|---|---|---|---|---|
| N | Mean | Std. Deviation | F | Sig. | ||
| Mean annual deforestation (ha) | Non-poor | 32 | 0.353 | 0.379 | 4.50 | 0.012 |
| Fairly poor | 103 | 0.274 | 0.293 | |||
| Poorest | 65 | 0.175 | 0.228 | |||
| Total | 200 | 0.255 | 0.295 | |||
| Quantity of cotton produced (kg) | Non-poor | 32 | 90.313 | 210.230 | 3.70 | 0.027 |
| Fairly poor | 103 | 124.563 | 205.229 | |||
| Poorest | 65 | 47.692 | 102.313 | |||
| Total | 200 | 94.100 | 181.731 | |||
| Monthly fuel wood consumption (m3) | Non-poor | 32 | 2.281 | 1.039 | 20.60 | 0.000 |
| Fairly poor | 103 | 1.849 | 0.776 | |||
| Poorest | 65 | 1.315 | 0.429 | |||
| Total | 200 | 1.745 | 0.805 | |||
| Overgrazing expressed by the number of cattle | Non-poor | 32 | 41.500 | 34.586 | 104.90 | 0.000 |
| Fairly poor | 103 | 4.282 | 3.197 | |||
| Poorest | 65 | 0.6462 | 0.694 | |||
| Total | 200 | 9.055 | 19.897 | |||
| Indicators of Environmental Degradation | Wealth Categories of Households (%) | Total (%) | Chi-Square Tests | ||||
|---|---|---|---|---|---|---|---|
| Non-poor | Fairly poor | Poorest | Value | Asymp. Sig. (2-sided) | |||
| Derived categorical forms from our quantitative collected variables | |||||||
| Deforestation 2003-2013 | No | 1.00 | 19.50 | 16.50 | 37.00 | 18.30 | 0.000 |
| Yes | 15.00 | 32.00 | 16.00 | 63.00 | |||
| Cotton cultivation | No | 13.00 | 30.50 | 25.50 | 69.00 | 9.57 | 0.008 |
| Yes | 3.00 | 21.00 | 7.00 | 31.00 | |||
| Cutting and selling fuel wood | No | 14.50 | 27.00 | 19.50 | 61.00 | 15.01 | 0.001 |
| Yes | 1.50 | 24.50 | 13.00 | 39.00 | |||
| Overgrazing based on owning more than mean number of cattle | No | 0.00 | 19.00 | 27.00 | 46.00 | 66.67 | 0.000 |
| Yes | 16.00 | 32.50 | 5.50 | 54.00 | |||
| Variables collected in qualitative forms from field work | |||||||
| Overgrazing (farmers’ assessments of overgrazing on their own farms) | Low | 0.0% | 42.7% | 84.6% | 49.5% | 110.259 | 0.000 |
| Moderate | 6.3% | 32.0% | 15.4% | 22.5% | |||
| High | 93.8% | 25.2% | 0.0% | 28.0% | |||
| Soil fertility loss (farmers’ assessments of soil fertility loss on their own farm) | Low | 65.6% | 49.5% | 27.7% | 45.0% | 42.191 | 0.000 |
| Moderate | 28.1% | 23.3% | 6.2% | 18.5% | |||
| High | 6.3% | 27.2% | 66.2% | 36.5% | |||
| Tenure insecurity (farmers’ assessments of effect of tenure insecurity on farmer-managed natural regeneration) | No FMNR | 100.0% | 51.5% | 35.4% | 54.0% | 36.595 | 0.000 |
| Yes FMNR | 0.0% | 48.5% | 64.6% | 46.0% | |||
© 2016 by the authors; licensee MDPI, Basel, Switzerland. This article is an open access article distributed under the terms and conditions of the Creative Commons Attribution (CC-BY) license (http://creativecommons.org/licenses/by/4.0/).
Share and Cite
Etongo, D.; Djenontin, I.N.S.; Kanninen, M. Poverty and Environmental Degradation in Southern Burkina Faso: An Assessment Based on Participatory Methods. Land 2016, 5, 20. https://doi.org/10.3390/land5030020
Etongo D, Djenontin INS, Kanninen M. Poverty and Environmental Degradation in Southern Burkina Faso: An Assessment Based on Participatory Methods. Land. 2016; 5(3):20. https://doi.org/10.3390/land5030020
Chicago/Turabian StyleEtongo, Daniel, Ida Nadia S. Djenontin, and Markku Kanninen. 2016. "Poverty and Environmental Degradation in Southern Burkina Faso: An Assessment Based on Participatory Methods" Land 5, no. 3: 20. https://doi.org/10.3390/land5030020
APA StyleEtongo, D., Djenontin, I. N. S., & Kanninen, M. (2016). Poverty and Environmental Degradation in Southern Burkina Faso: An Assessment Based on Participatory Methods. Land, 5(3), 20. https://doi.org/10.3390/land5030020