3.1. Assessment of the Variables
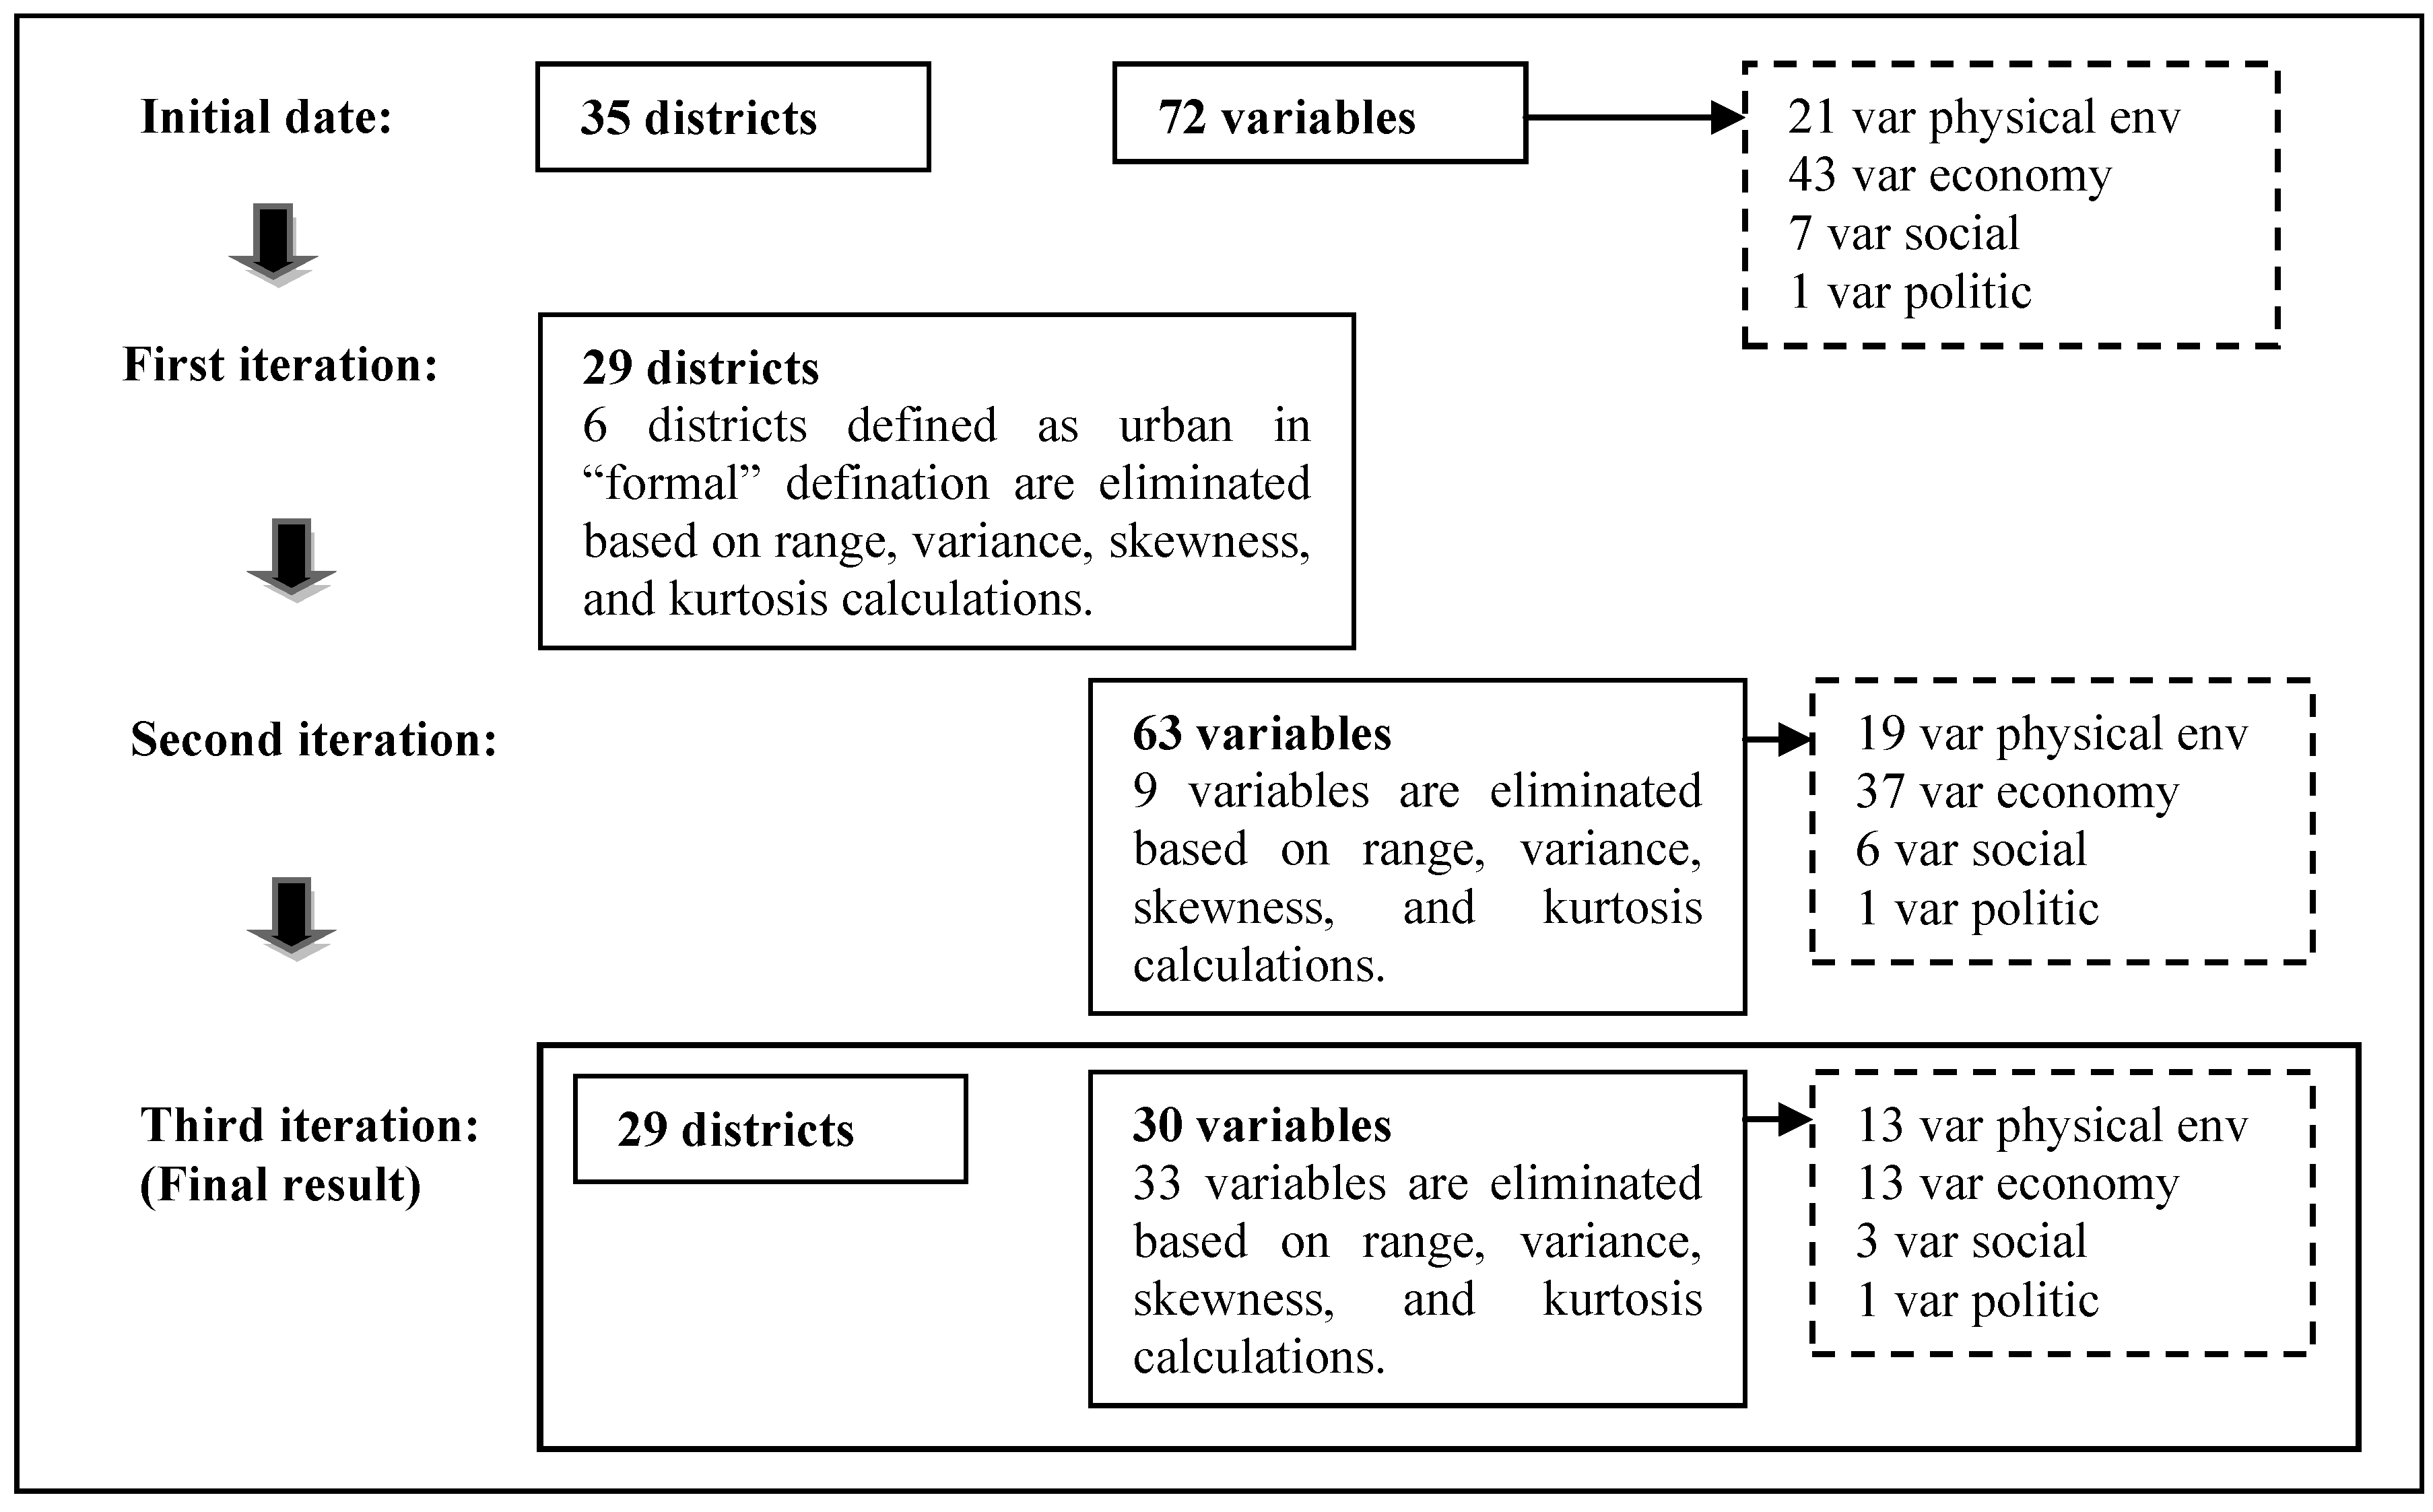
Initially, there were 35 districts, six urban and 29 non-urban, and 72 variables to be examined. To produce robust and statistically convincing indicators, stepwise analysis was used to examine the quality of the data. The examination consisted of two main steps. The first step involved calculation of the ranges, standard deviations, variances, skewness and kurtosis of the variables. These statistical measures were employed in analyzing the distribution of the data and the identification of outliers. The second step involved using matrix correlation to minimize multicollinearity. In eliminating those variables, the representation of each category is greatly improved. As z-score standardization was applied, only variables found to be normally distributed were chosen. The mean values of the variables ranged from a low of 3.4 (for annual growth of employment engaged in the non-primary sector) to a high of 135.8 (for built-up areas); the skewness and kurtosis values of all the variables chosen were close to zero (ranging from −0.99 to 0.99).
However, disparities between urban districts and non-urban districts do exist in the research area; therefore, outliers were significant for several variables. In the first iteration, outliers were identified due to six small areas (categorized as urban districts) contributing significantly to almost all development indicators. These six urban districts were then excluded in the first iteration of variable assessment. Nine variables related to Gross domestic product (GDP), employment and density were eliminated in the second iteration, because of their non-normal distributions (as indicated by skewness and kurtosis values >0.99 or <−0.99) or because they contained outliers. Nevertheless, for the purpose of comprehensive interpretation, the six urban districts that were excluded in the first iteration were still considered in the final interpretation.
Figure 3.
Selection of variables by stepwise analysis.
Figure 3.
Selection of variables by stepwise analysis.
Another issue was multicollinearity, which was inevitable, because many of the variables initially analyzed were likely to have been related. For example, the number of jobs in industries may be highly correlated with the number of industries, and the GDP of the industry also may be highly correlated with the number of large industries. It was also difficult to apply time series data, because, for some variables, such as education attainment, the situation in 1994 was similar to the situation in 2006, as reflected in the relatively high correlation between the two variables.
Figure 3 explains the selection process of the variables, and
Table 1 shows the list of variables that were finally used in the cluster analysis.
3.2. Cluster Solution and Dendrogram Interpretation
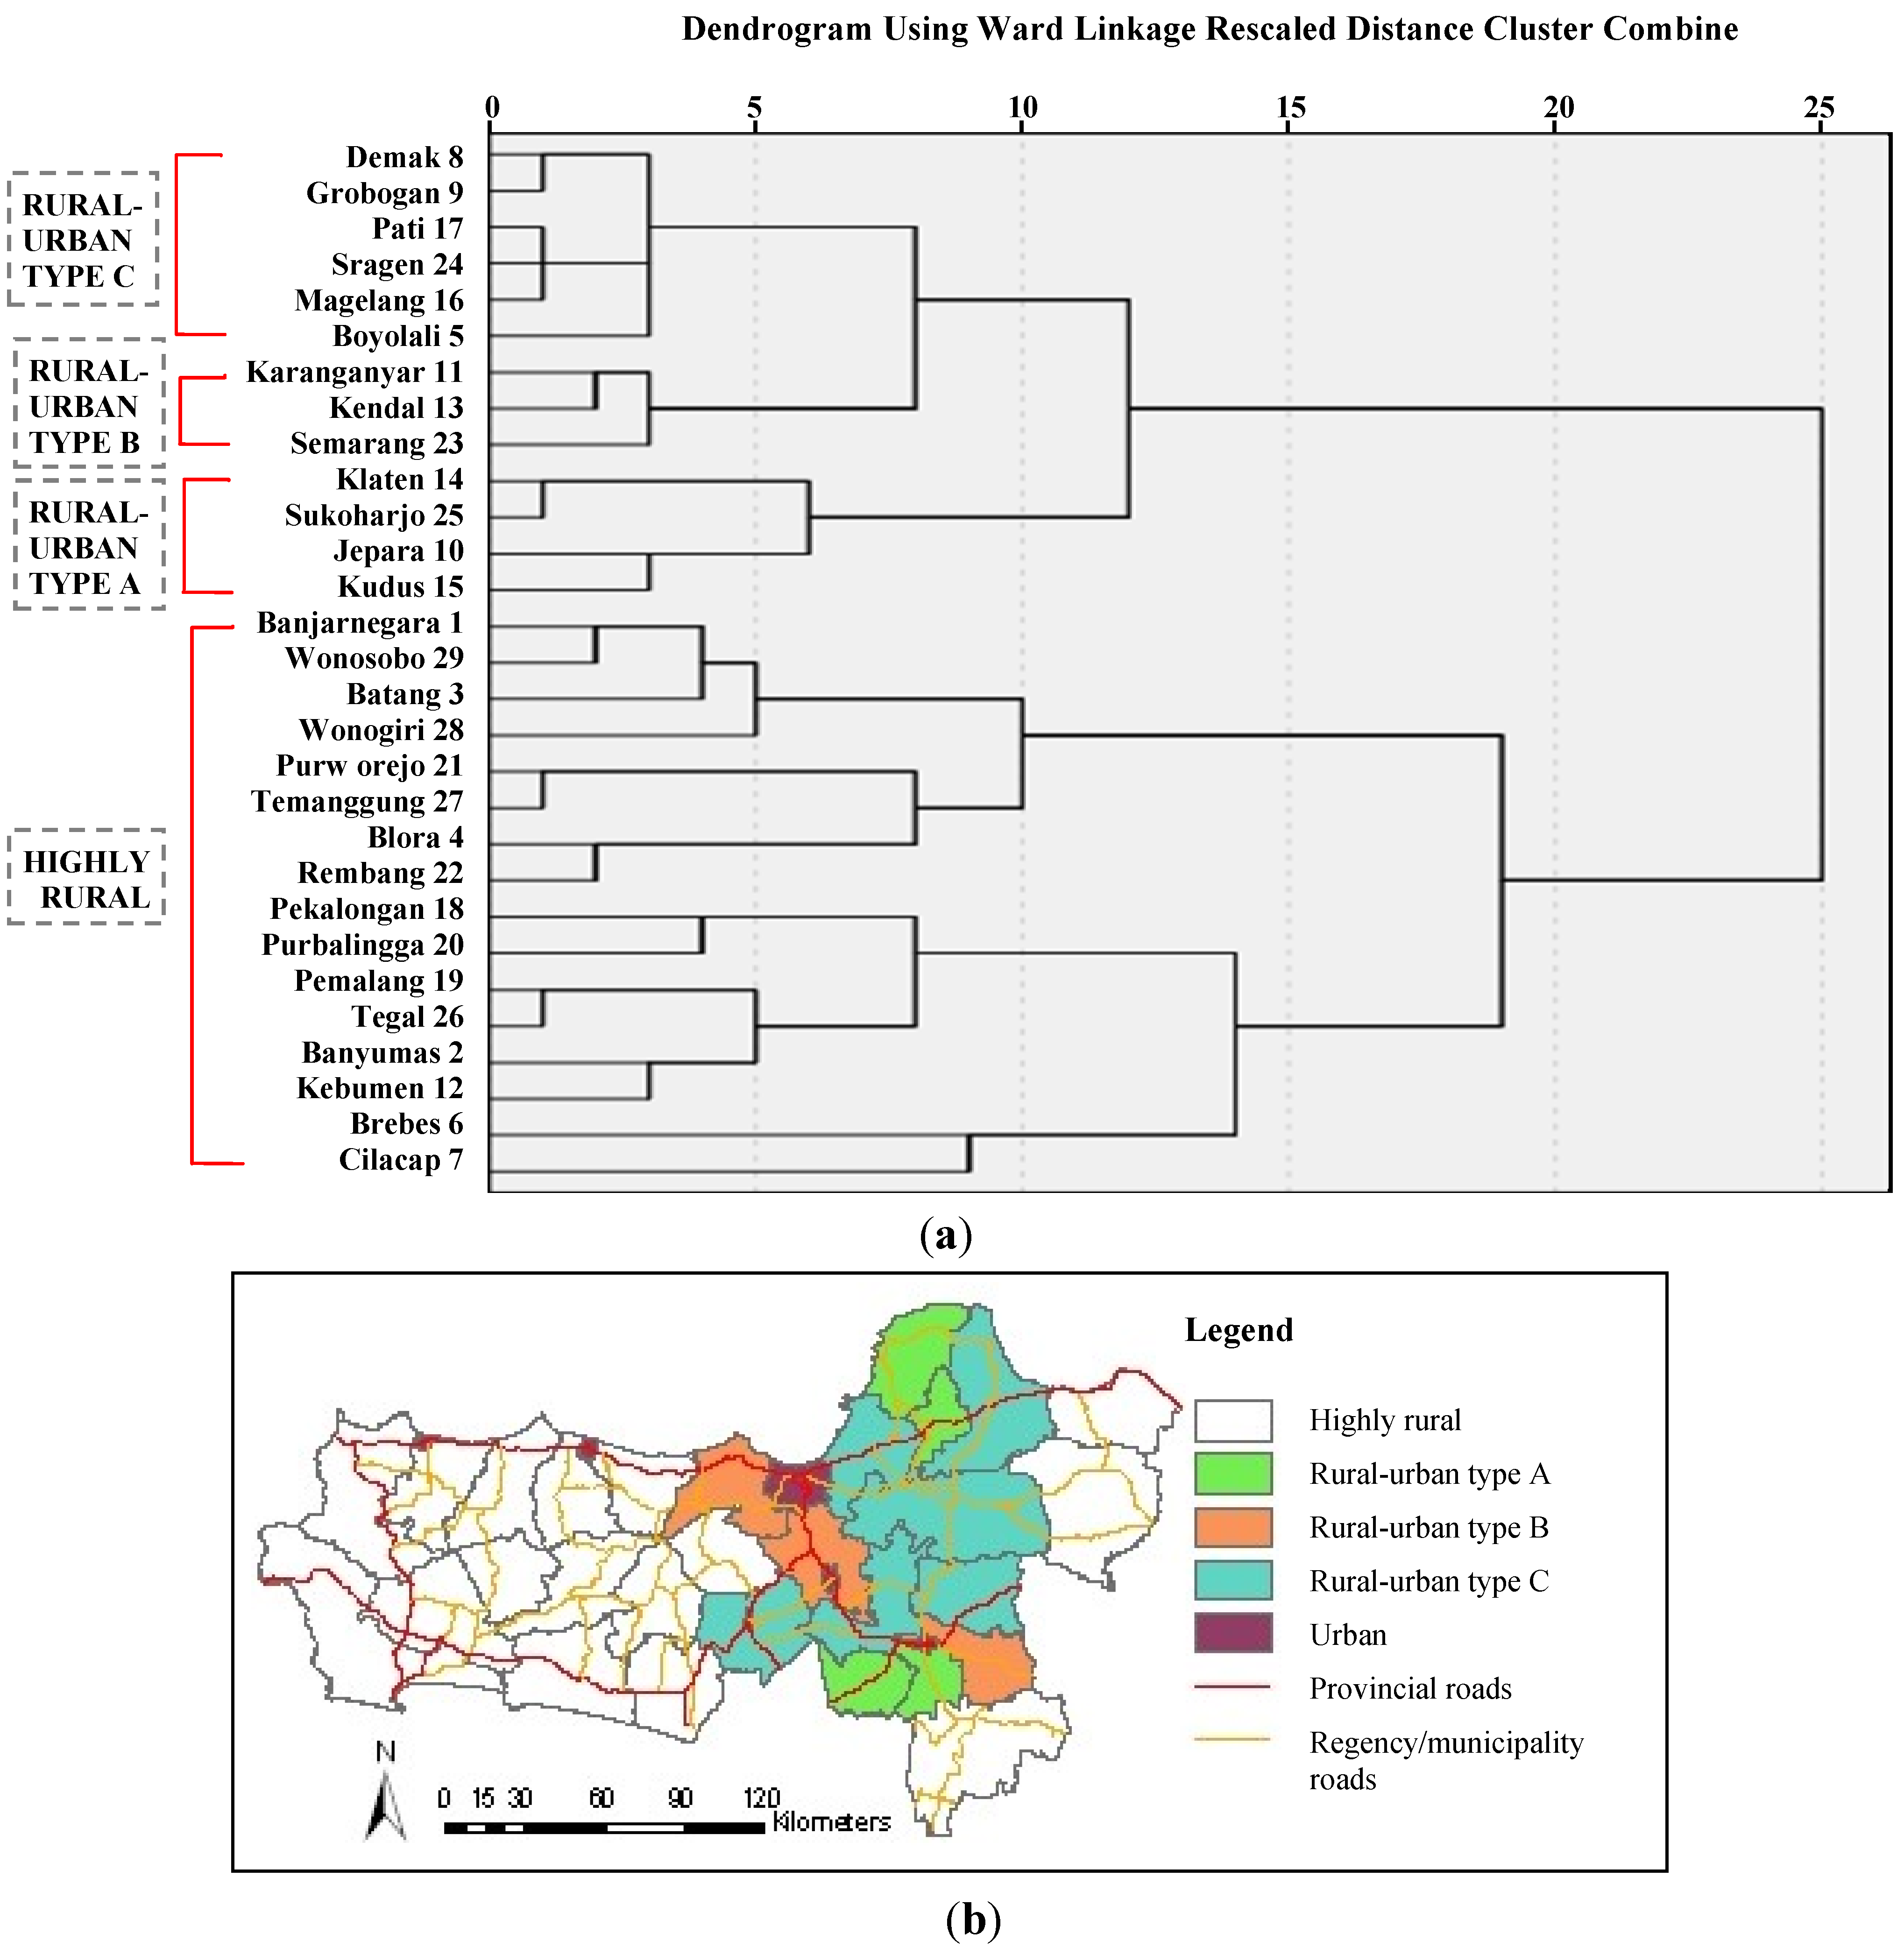
From examination of the dendrogram based on the explanation in
Table 1, four main groups were identified (see
Figure 4 and
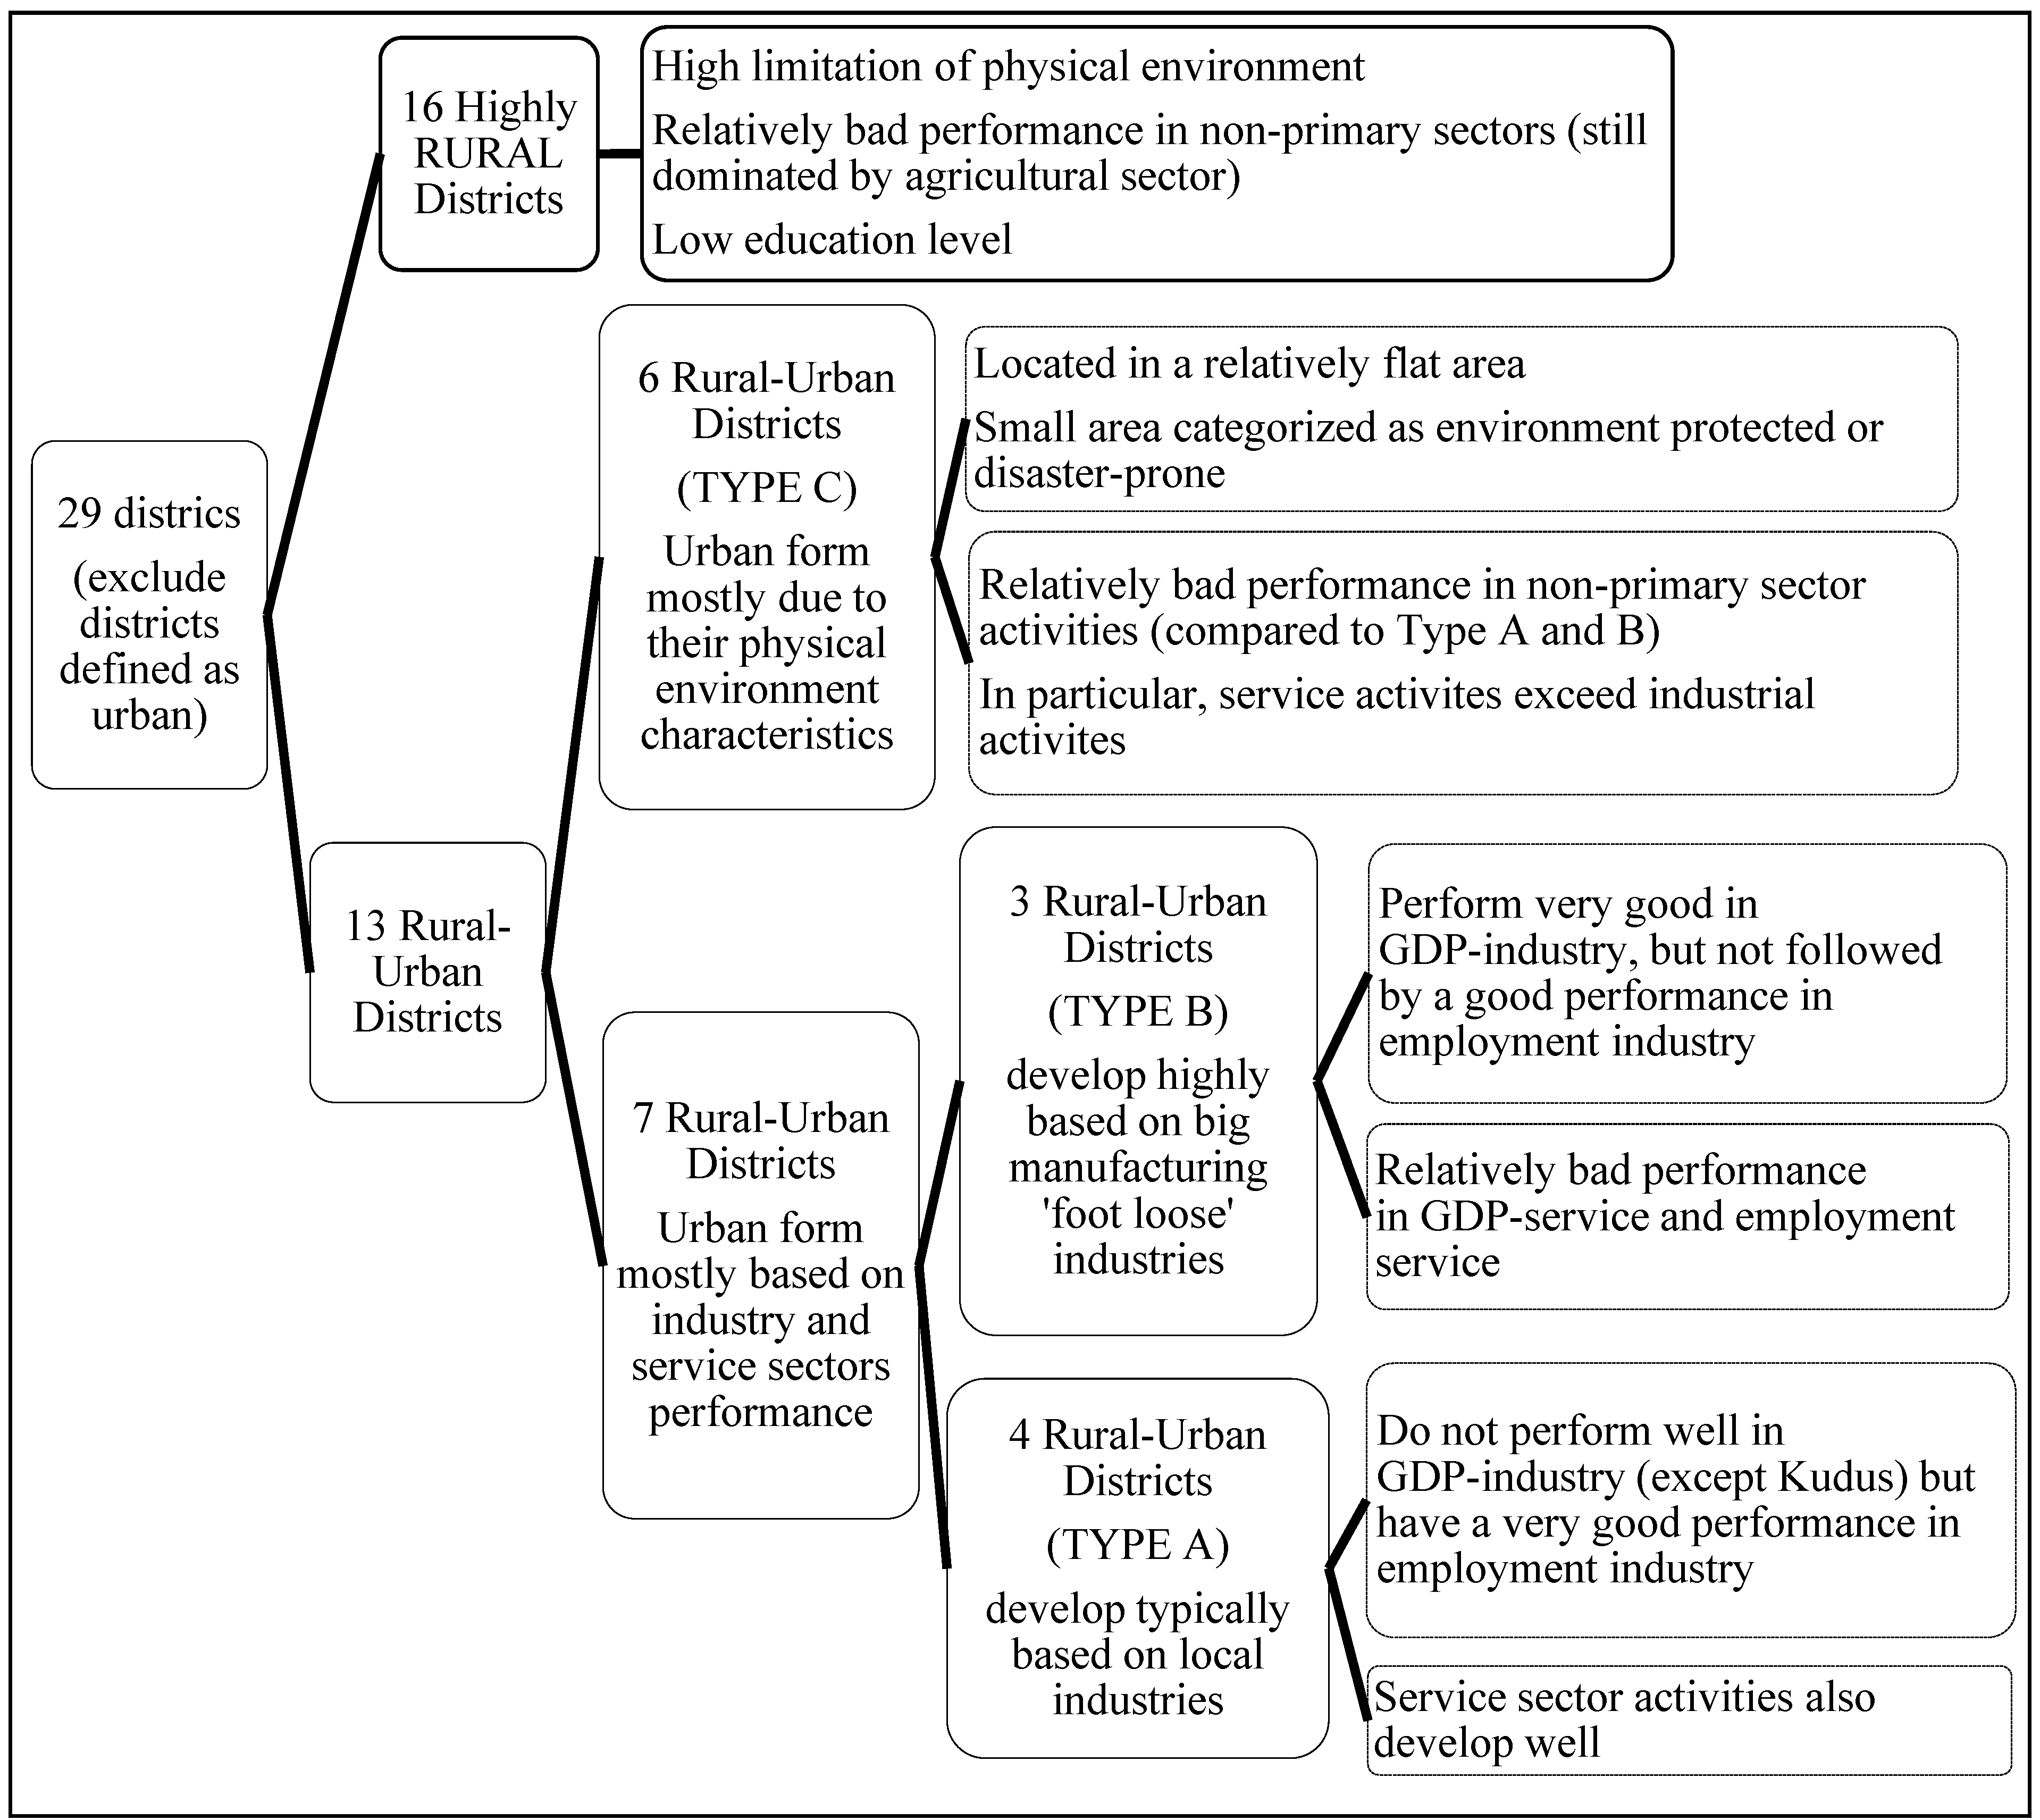
Figure 5). First, 16 districts were identified as being highly rural. With respect to their physical environment, they are mainly characterized by relatively low proportions of their population categorized as living in urban regions (<20 percent), low proportions of built-up areas (<25 percent) and being mostly located in remote and relatively hilly areas, far from the closest growth centers (16–20 km from the closest urban center) and airport facilities (71–190 km from the closest airport facility). Due to these physical limitations, the activity of these districts is dominated by agriculture. In other words, the physical characteristics of these districts do not favor industrial development. These districts also have very low proportions of people who have graduated from high school or university (<20 percent). This low level of education has led to high average unemployment growth (13.30 percent), as well as a low employment rate (<60 percent).
Table 1.
Variables to explain the performance of the rural-urban interface in the study area.
Table 1.
Variables to explain the performance of the rural-urban interface in the study area.
| | Physical Environment | Economic | Social-Politic |
|---|
| Static | - -
Number of people living in urban areas - -
Built-up area (km2) - -
Average distance to the closest urban center (km) - -
Average distance to the closest airport (km) - -
Proportion of area (%) with zoning limiting urbanization, includingenvironmental protection areas, agricultural protection areas and disaster-prone areas
| - -
Contributions of the industrial and service sectors to GDP (%) - -
Contribution of the industrial and service sectors to the provincial GDP (%) - -
Proportion of employment engaged in the industrial and service sectors (%) - -
Proportion of employment engaged in the industrial and service sectors at the provincial level (%)
| - -
Proportion of population that has graduated from high school and university (%) - -
Employment rate (%) - -
Political intervention, as indicated by policy documents by ranking (dummy variable)
|
| Dynamic | - -
Growth of built-up area (km2)
| - -
Annual growth of the non-primary sector in GDP (%) - -
Growth of the GDP share of the non-primary sector (%) - -
Annual growth of employment engaged in the industrial and service sectors (%) - -
Growth of the proportion of employment engaged in the industrial and service sectors (%)
| - -
Unemployment growth (%)
|
In addition to the 16 districts characterized above, there are six districts classified as Rural-Urban Type C, which have a character very similar to that of the highly rural districts. These districts may be classified as rural-urban, because of their physical characteristics. High proportions of the populations of these districts are urban (20–40 percent). These districts are not located in remote areas, which means that they are closer to urban centers (11–15 km from the closest urban center) and airport facilities (51–70 km from the closest airport facility) than the highly rural districts, and they are located in flat areas. However, in terms of their economic features, these districts are highly rural and tend to be dominated by agricultural activities.
Figure 4.
(a) Cluster solution (final result from Predictive Analytics SoftWare (PASW) 18). (b) Cluster solution (final result from PASW 18).
Figure 4.
(a) Cluster solution (final result from Predictive Analytics SoftWare (PASW) 18). (b) Cluster solution (final result from PASW 18).
The most significant characteristics of the rural-urban regions is evident in seven rural-urban districts classified as Rural-Urban Type A and Type B. The two most obvious indicators are a high contribution of the industrial sector to the GDP and a significant proportion of employment in the non-primary sector. These districts are categorized further into two different groups.
Figure 5.
Dendrogram interpretation.
Figure 5.
Dendrogram interpretation.
The first group is Rural-Urban Type A, which is characterized by quite significant involvement of smaller industrial activities. This group is mainly characterized by a relatively lower contribution of the industrial sector to GDP (20–30 percent) and a higher proportion of employment in the industrial sector (30–50 percent). These districts are not necessarily located on the urban fringe districts and are not necessarily supported by the political will to develop these districts as centers of growth at the provincial level. The second is Rural-Urban Type B, which is characterized by the dominant role of large manufacturing industries. The dominant features of these districts are a high contribution of the industrial sector to GDP (40–50 percent), with relatively low employment in the industrial sector (15–20 percent), being located in an urban fringe area and being supported by the political will to push for economic growth at the provincial level.
However, there are some similarities between the Rural-Urban Type A and Type B groups. They both have relatively high proportions of people who have graduated from high school and university, compared to highly rural regions and those in the Rural-Urban Type C group. They are also located in relatively flat areas and have good access to the closest urban centers and airport facilities.
Figure 5 summarizes the dendrogram interpretation.
3.3. Rural-Urban Transition in Central Java Based on an Examination of Population Changes
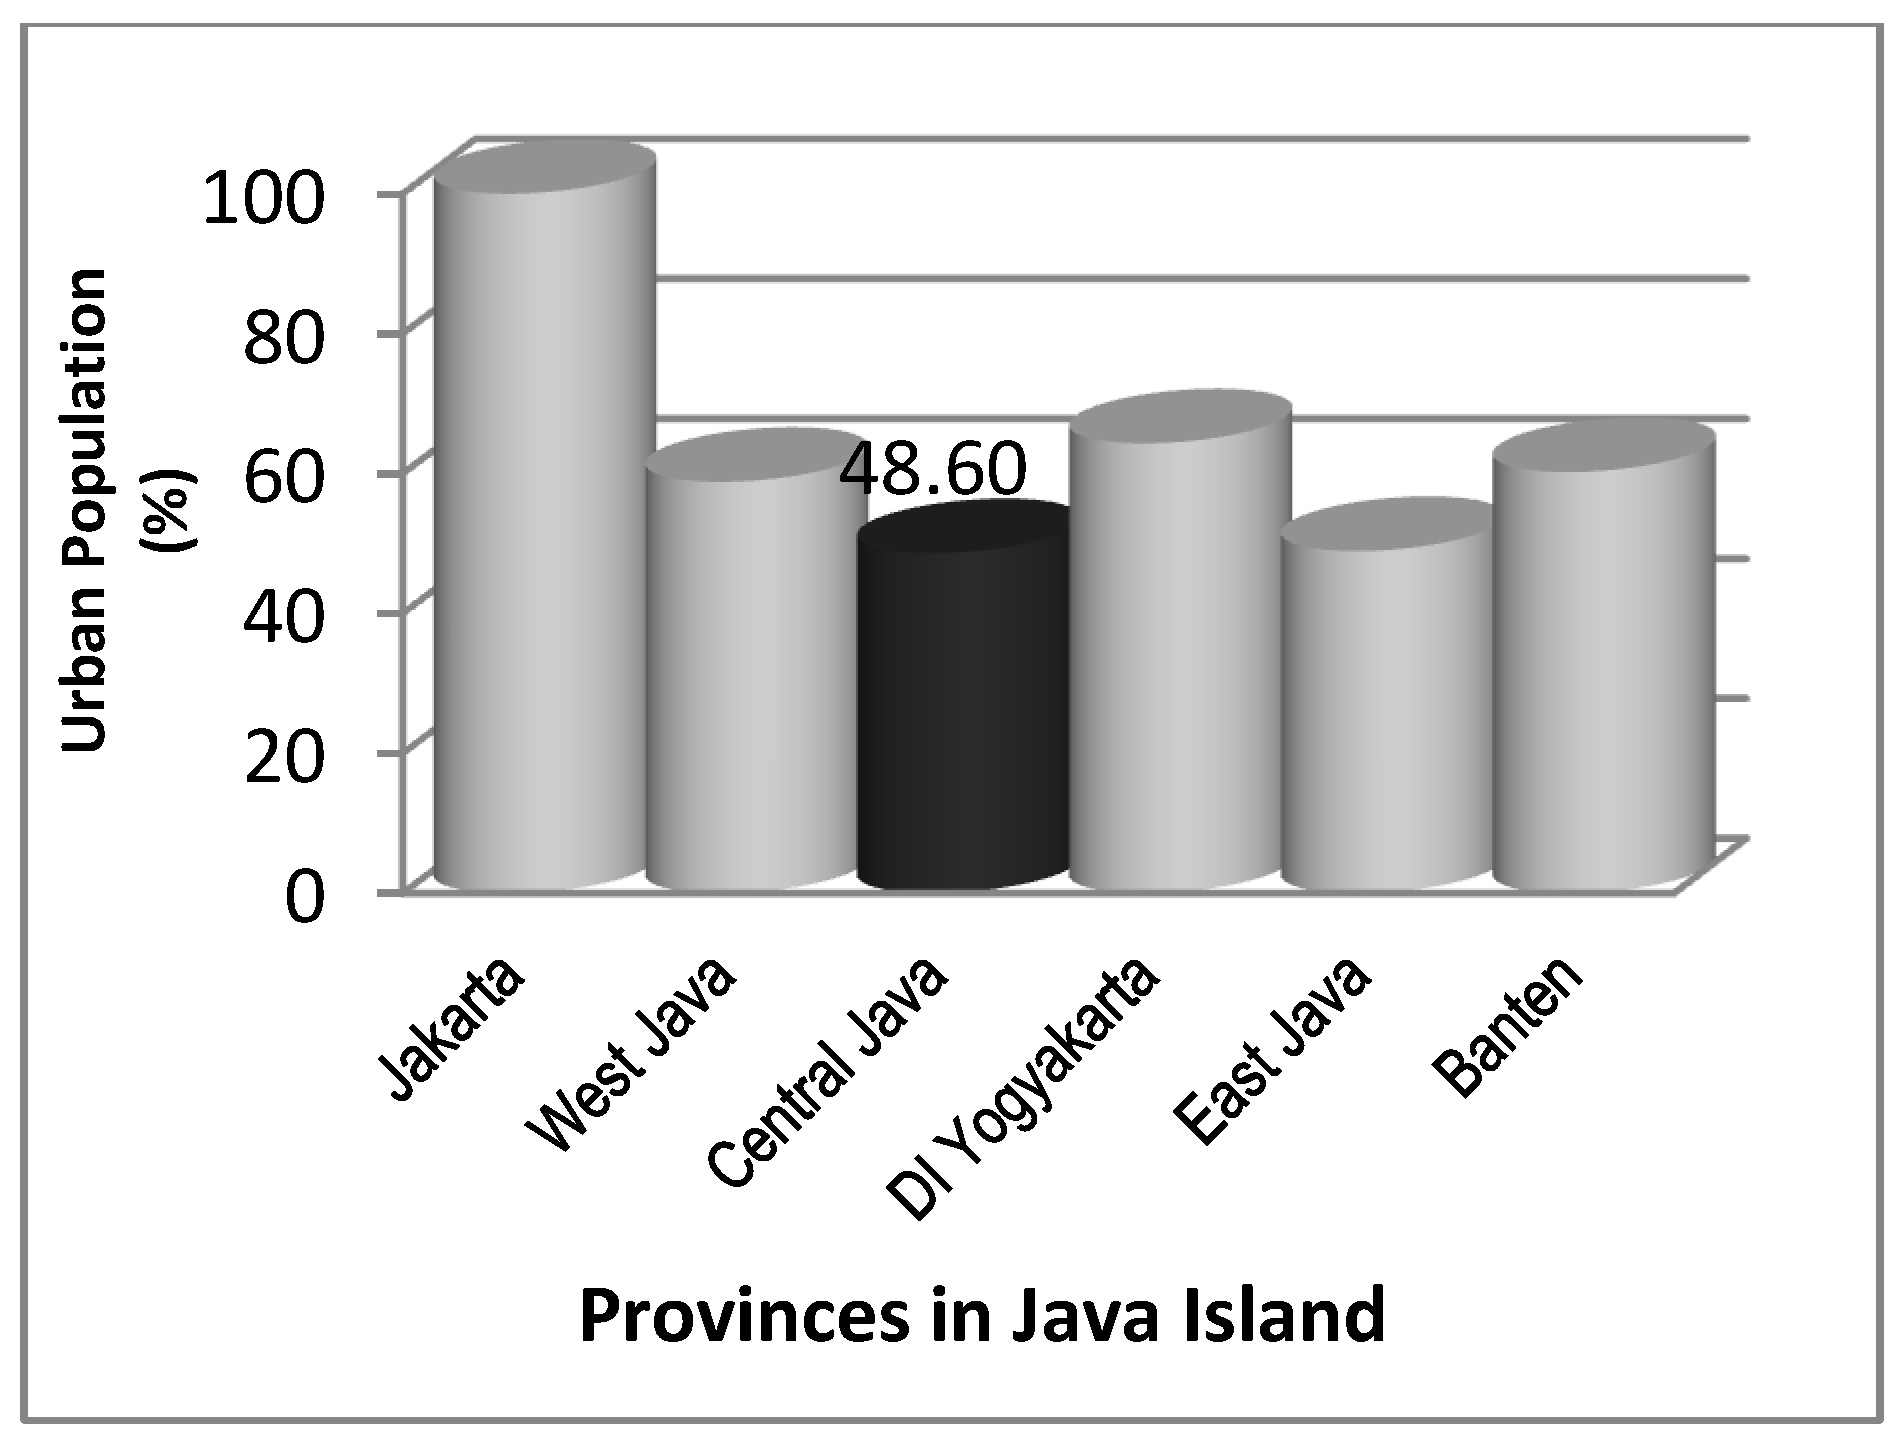
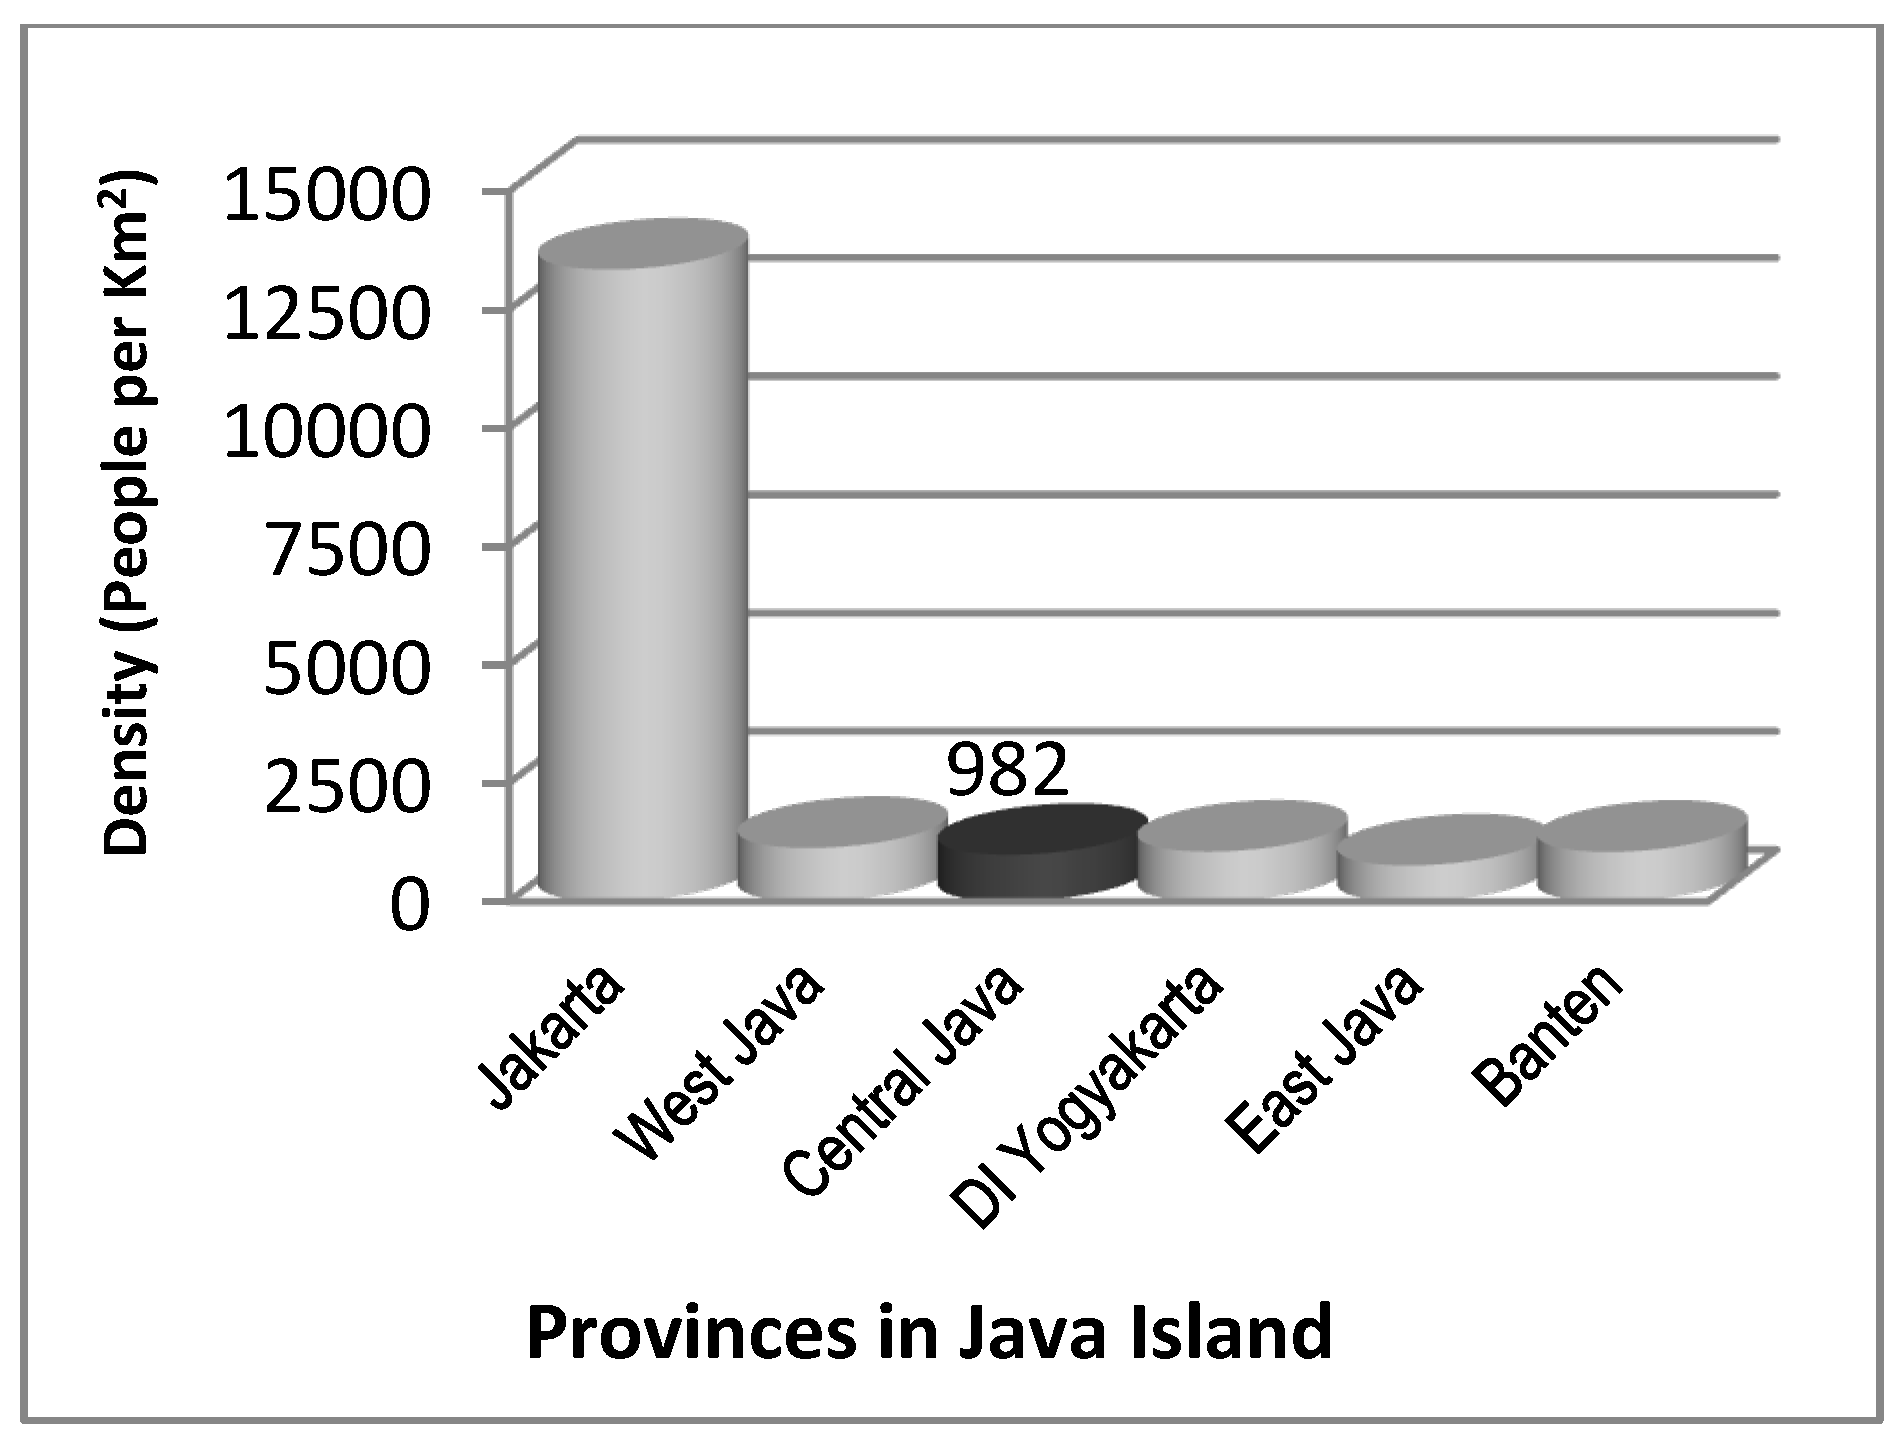
The rural-urban transition process is reflected in the shifting of the population that is defined as living in rural or urban areas. In this research, urban and rural areas are defined on the basis of their CBS classification, which is a function primarily of the population density, the percentage of farming households and accessibility to urban facilities. For each variable, a score ≥10 is classified as urban and ≤10 is classified as rural. For example, a district with a population density >8,500/km
2, a percentage of farming households <5 and all households served by electricity and a telephone network and having access to some other main urban facilities would have the highest score. As
Table 2 shows, apart from the dominant contribution of the urban population living in urban districts, there is a tendency toward significant urban population growth in Central Java Province as a whole.
The most rapid growth of the urban population took place in the districts in the Rural-Urban Type A group. This group is characterized by areas whose development depends mostly on locally based small- to medium-sized industries. These areas are not typically extensions of metropolitan regions (EMRs), which are defined primarily as highly urbanized areas, like the urban districts in most developing countries. The urban population of the Rural-Urban Type A group exceeded the rural population in the middle of the 1990s, while during the same period, the Rural-Urban Type B group, which actually represents the extended metropolitan regions, experienced a lower rate of urban growth, and the inhabitants were still predominantly categorized as belonging to a rural population. The data in
Table 2 show that there have been more people living in urban areas in the Rural-Urban Type A group since 1980 than in other subgroups, except urban districts. Moreover,
Table 2 clearly shows that the growth rate of the urban population in the Rural-Urban Type A group has been greater than that of other subgroups. Up to the year 2000, there were still more people categorized as rural than there were people categorized as urban in the Rural-Urban Type B group and, even more so, in the Rural-Urban Type C group.
Table 2.
Rural and urban populations in Central Java Province in 1980, 1990 and 2000 (percent). Source: CBS [
21,
22,
23,
24].
Table 2.
Rural and urban populations in Central Java Province in 1980, 1990 and 2000 (percent). Source: CBS [21,22,23,24].
| | 1980 | 1990 | 2000 |
|---|
| | Rural | Urban | Rural | Urban | Rural | Urban |
|---|
| Central Java | 81.05 | 18.95 | 73.01 | 26.99 | 59.82 | 40.18 |
| Urban Districts | 3.98 | 96.02 | 4.61 | 95.39 | 2.38 | 97.62 |
| Rural Districts | 87.11 | 12.89 | 80.97 | 19.03 | 69.73 | 30.27 |
| Rural-Urban Type A | 77.96 | 22.04 | 58.05 | 41.95 | 36.69 | 63.31 |
| Rural-Urban Type B | 88.59 | 11.41 | 80.04 | 19.96 | 60.40 | 39.60 |
| Rural-Urban Type C | 92.91 | 7.09 | 86.88 | 13.12 | 74.85 | 25.15 |
The Jepara, Klaten and Sukoharjo districts, classified as Rural-Urban Type A, are famous for their export-oriented wooden furniture industry. Klaten also has various marketable handicraft products, as well as developed metal industries. In addition, Kudus has been developing based on its famous cigarette industries, and its established textile and food industries have products that are marketed not only nationally, but also on an international level. All these industries are characterized primarily as small- to medium-sized industrial clusters that rely on local labor and local investment [
25,
26]. In contrast, the Karanganyar, Kendal and Semarang districts are classified as Rural-Urban Type B and are characterized by various types of large, foreign-based manufacturing industries.
The data in
Table 2 show that rural-urban population transition in the research area takes place in the regions with potentially endogenous resources, which are not necessarily located close to the highest urban center in the hierarchy or supported by typical foreign-based industries. This is a surprising finding, as population transition in Central Java follows a different pattern than that observed in other large provinces in Indonesia. The pattern is also clearly unlike the phenomenon that has generally been observed in developing countries, as reported by Jones [
27] and Douglass [
28] with respect to the role of extended metropolitan regions (EMRs) in Asian countries.
Jones [
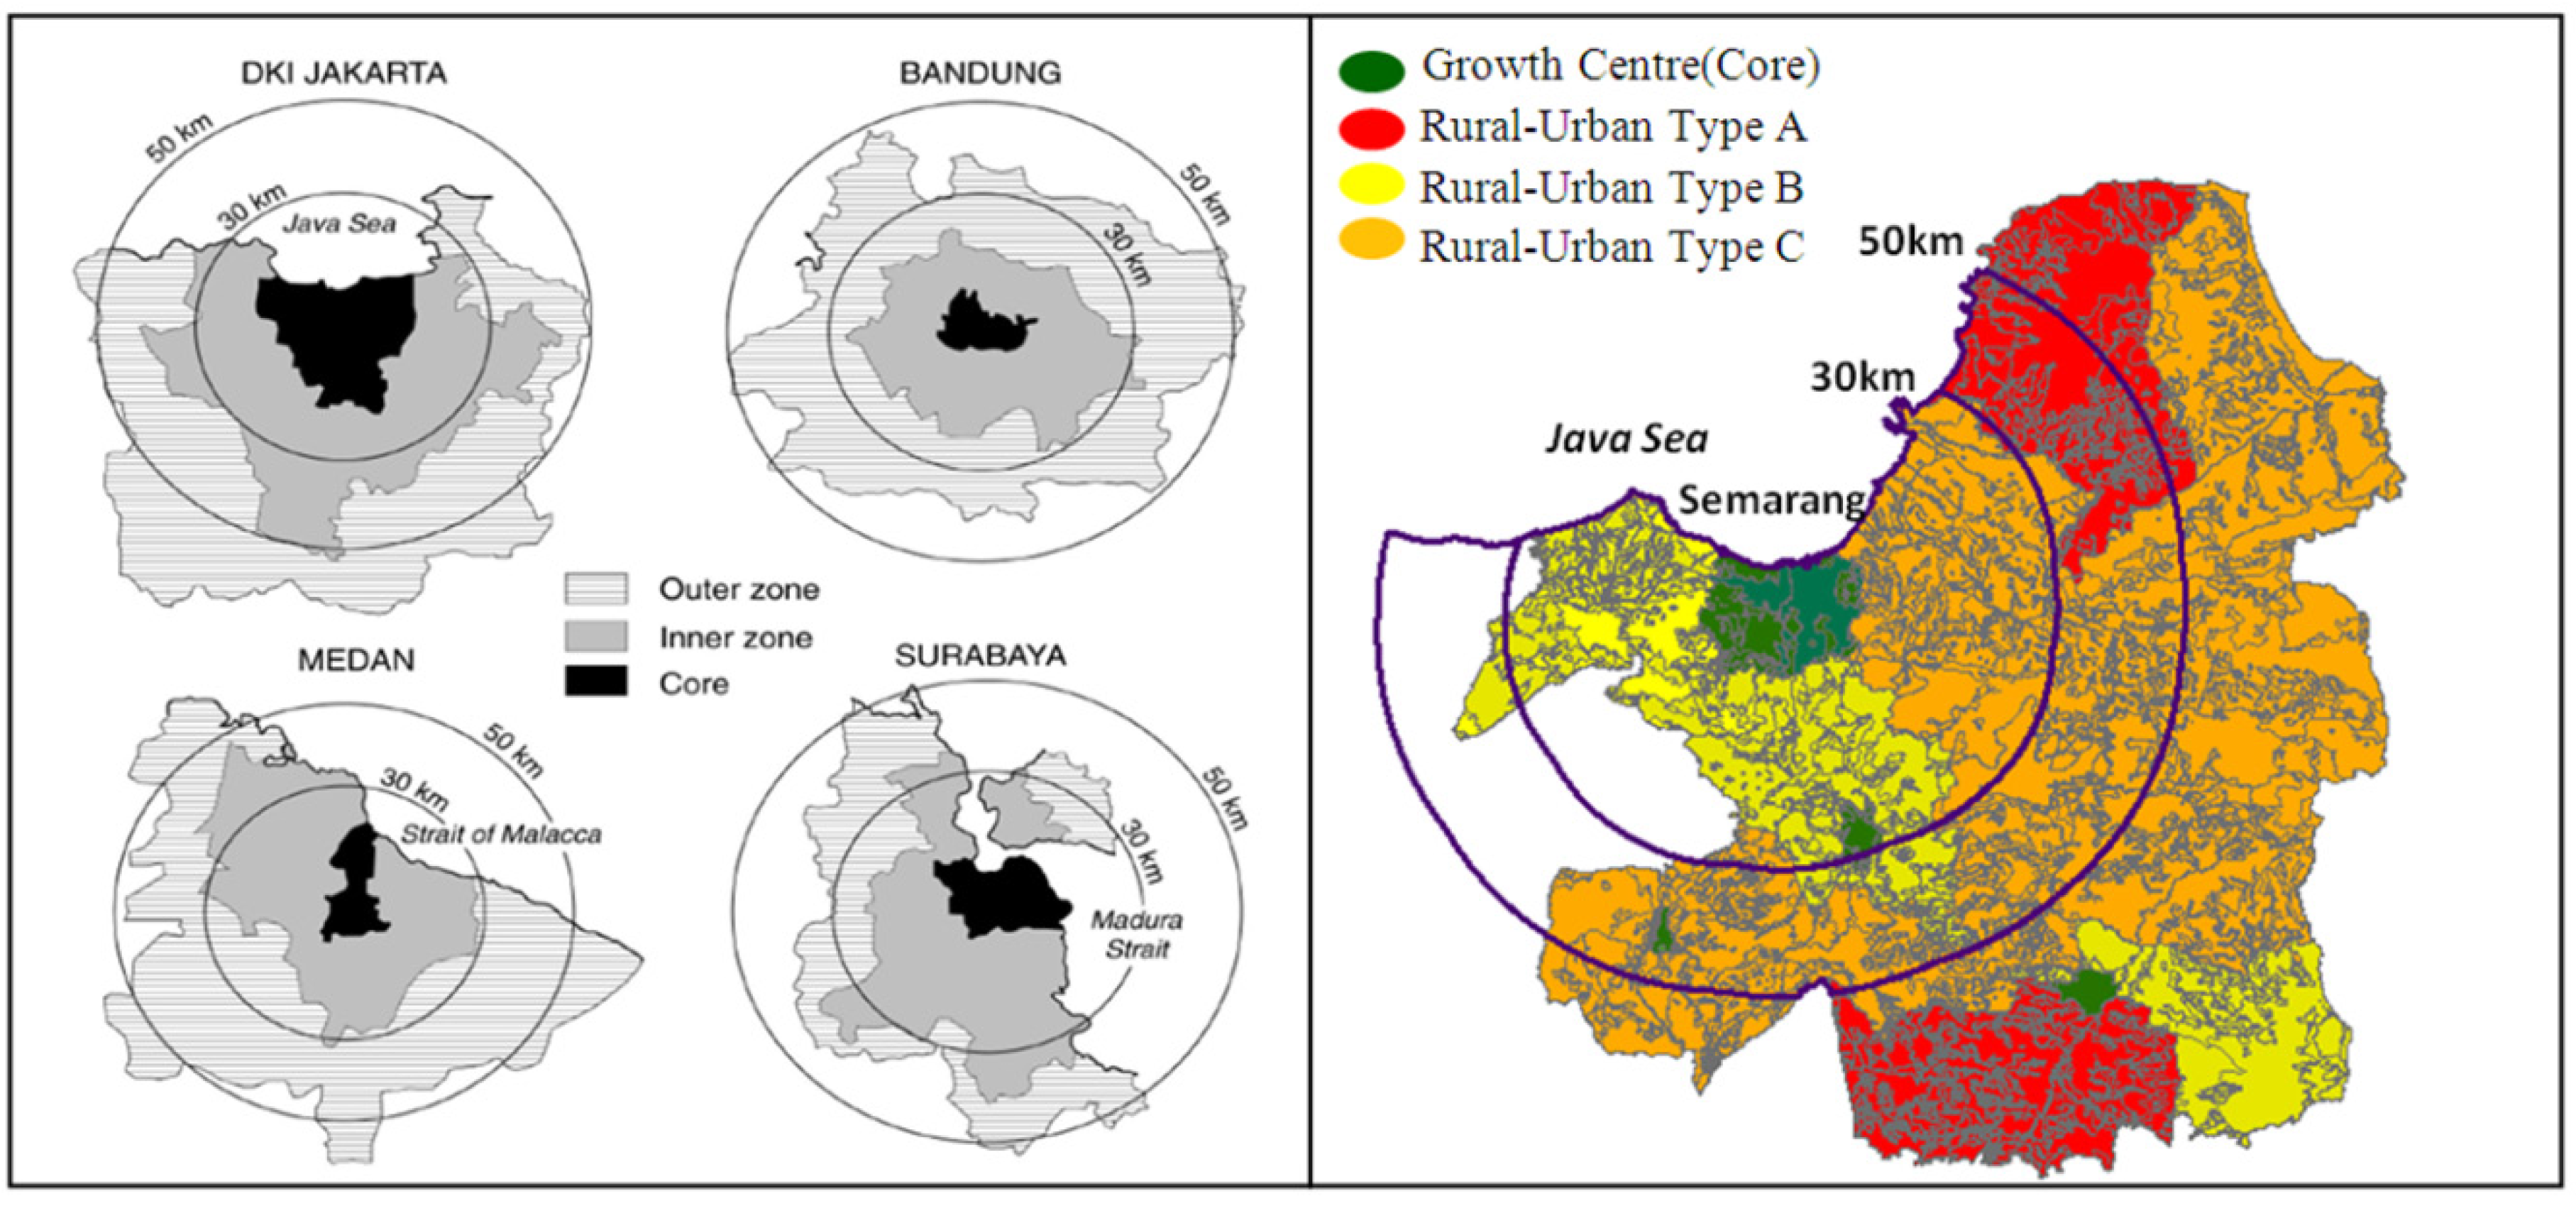
27] argues that many large cities in Southeast Asia, including Indonesia, are growing very rapidly and, therefore, have experienced very rapid growth in their urban populations in the areas surrounding these cities, which are called EMRs. In these EMRs, populations are highly concentrated only in particular urban centers, which has created an unbalanced form of development pattern. This industrialization path could be described as industrialization from above. Four selected large cities in Indonesia, as illustrated in
Figure 6, experienced a common pattern of population growth that is typical of most developing countries: a relatively higher population growth rate in the inner zone (closer to the capital city) than in the outer zone. Only Bandung in West Java and Semarang in Central Java have experienced relatively balanced growth in their cores, inner zones and outer zones.
Figure 6.
Zones of extended metropolitan regions (EMRs) in selected large cities in Indonesia. Source: the Jakarta, Bandung, Medan and Surabaya figures are taken from Mamas
et al. (2001) in Jones [
27]; the Semarang figures are based on the cluster analysis results.
Figure 6.
Zones of extended metropolitan regions (EMRs) in selected large cities in Indonesia. Source: the Jakarta, Bandung, Medan and Surabaya figures are taken from Mamas
et al. (2001) in Jones [
27]; the Semarang figures are based on the cluster analysis results.
Semarang, the capital city of Central Java, has experienced relatively lower growth than other large cities in Indonesia. Furthermore, as shown in
Figure 6 and
Table 3, the inner zone in Central Java also experienced a lower urban population growth rate than the inner zone in four other selected large cities in Indonesia.
There are at least two factors that explain this extraordinary population growth pattern in the study area. First, the role of foreign-based manufacturing industries that are mostly located in EMRs and have led to typical industrialization from above is less dominant in Central Java than in other developed provinces in Indonesia. As a result, less labor has migrated to the surrounding core regions in the province than in most cases, because foreign-based industries attract significant numbers of laborers. This has resulted in more gradual population growth in the area. Second, endogenous resources in particular regions in the study area have acted as potential engines of growth. In this sense, it is not always true that rapid development can only occur as part of the growth of a core region, as, in fact, it has resulted in unbalanced development in most regions in developing countries.
Table 3.
Rate of population growth of selected large cities in Indonesia. Source: the Jakarta, Bandung, Medan Surabaya data are taken from Mamas
et al. (2001) in Jones [
27]; the Semarang data are taken from CBS [
21,
23].
Table 3.
Rate of population growth of selected large cities in Indonesia. Source: the Jakarta, Bandung, Medan Surabaya data are taken from Mamas et al. (2001) in Jones [27]; the Semarang data are taken from CBS [21,23].
| Capital City and Zone | Average Annual Rate of Increase (%) |
|---|
| Core | Inner Zone | Outer Zone |
|---|
| Jakarta | 2.08 | 6.01 | 1.84 |
| Bandung | 2.75 | 2.93 | 2.77 |
| Surabaya | 1.73 | 2.50 | 0.89 |
| Medan | 1.91 | 5.46 | 0.54 |
| Semarang | 1.67 | 1.05 | 0.95 |
Figure 6 clearly illustrates that the development of Rural-Urban Type A areas is mostly based on more endogenous resources located relatively far from Semarang, the capital city. As the industrialization that has been taking place in these rural-urban areas has employed mostly local resources and has been located quite far from the large urban center (
i.e., Semarang), the path could be defined as industrialization from below. Accordingly, the existence of this particular rural-urban region, along with the fact that Central Java has a relatively balanced average annual rate of population growth, indicates that endogenous urbanization or urbanization from below should be considered a potential form of the rural-urban transition.
3.4. Rural-Urban Transition in Central Java Based on an Examination of Economic Structural Changes
Central Java Province has experienced a noteworthy economic transition over the last three decades. In 1976, the non-primary GDP exceeded the primary GDP. As shown in
Table 4, in 1976, the primary GDP contributed approximately 40 percent of the total GDP, but the proportion declined significantly to only approximately 20 percent in 2006. This shows that Central Java has developed considerably from being dominated by agriculture to being a more industrialized province, at least as indicated by GDP contribution.
Further examination of the performance of the subgroups revealed quite different population and economic transition paths. Economic transformation has occurred at similar rates in the Rural-Urban Type A and Rural-Urban Type B areas. In fact, the GDP contribution of the non-primary sector in the Urban, Rural-Urban Type A and Type B areas surpassed the contribution of the primary sector to GDP in 1976. This indicates that rapid industrialization, as an indicator of development from an economic perspective, had taken place to a notable degree in these areas. These were the only groups of rural districts to achieve transformation in the middle of the 1970s. The Rural-Urban Type C groups, which actually were characterized as rural, did not achieve transformation until the late 1980s.
Table 4.
Share of Gross domestic product (GDP) based on groups identified in the cluster analysis (percent).
Table 4.
Share of Gross domestic product (GDP) based on groups identified in the cluster analysis (percent).
| | | 1976 | 1986 | 1994 | 2006 |
|---|
| Central Java | Primary | 41.60 | 33.86 | 24.52 | 22.20 |
| | Non-Primary | 58.40 | 66.14 | 75.48 | 77.80 |
| Urban Districts | Primary | 6.50 | 6.30 | 6.46 | 5.86 |
| | Non-Primary | 93.50 | 93.70 | 93.54 | 94.14 |
| Rural Districts | Primary | 50.03 | 41.70 | 38.07 | 37.28 |
| | Non-Primary | 49.97 | 58.30 | 61.93 | 62.72 |
| Rural-Urban Type A | Primary | 38.65 | 33.47 | 23.90 | 18.06 |
| | Non-Primary | 61.35 | 66.53 | 76.10 | 81.94 |
| Rural-Urban Type B | Primary | 49.46 | 41.95 | 25.16 | 19.73 |
| | Non-Primary | 50.54 | 58.05 | 74.84 | 80.27 |
| Rural-Urban Type C | Primary | 59.91 | 50.79 | 42.49 | 37.62 |
| | Non-Primary | 40.09 | 49.21 | 57.51 | 62.38 |
Comparing Rural-Urban Type A, which represents local potential support, and Rural-Urban Type B, which represents the dominant role of multinational companies in the New International Division of Labor (NIDL) type of industries, it is interesting to note that the two types of regions have had similar economic transition paths. As illustrated in
Table 4, between 1994 and 2006, the contributions of the non-primary and primary sectors to GDP were similar for the Rural-Urban Type A and Type B areas. It is only the growth of the non-primary sector’s contribution to GDP in the Rural-Urban Type A areas that is more stable than that of the Rural-Urban Type B areas. The Rural-Urban Type B areas experienced quite rapid growth in non-primary GDP contributions between 1986 and 1994. The rate of growth then decreased slightly between 1994 and 2006, mostly due to the Asian economic crisis in the middle of the 1990s. Another finding is that the growth of the non-primary sector’s GDP contribution of the rural districts was very slow, as shown in the
Table 4; the non-primary GDP contribution of this subgroup was stagnant between 1994 and 2006.
With respect to the patterns observed, there are at least two important points that should be taken into account. The first point pertains to the growth pattern. The Rural-Urban Type A group experienced the steadiest growth, which indicates that external circumstances do not have a strong influence on local economic performance. In contrast, the growth of the Rural-Urban Type B group, which was highly dependent on external resources, was relatively unsteady. At least, a considerably slower growth rate was observed during the crisis (middle of 1990s) than during the previous period (1976–1986) and during the period after the crisis (the 2000s). The second point pertains to the contributions among the subgroups. There was a significant gap between the contribution of developed rural-urban regions (Rural-Urban Types A and B) and that of underdeveloped regions (Rural-Urban Type C and rural districts). These differences are evidence of a pattern of unbalanced development in the region.
The pattern of GDP contribution is likely to be somewhat congruent with economic performance based on employment in medium and large industries. As illustrated in
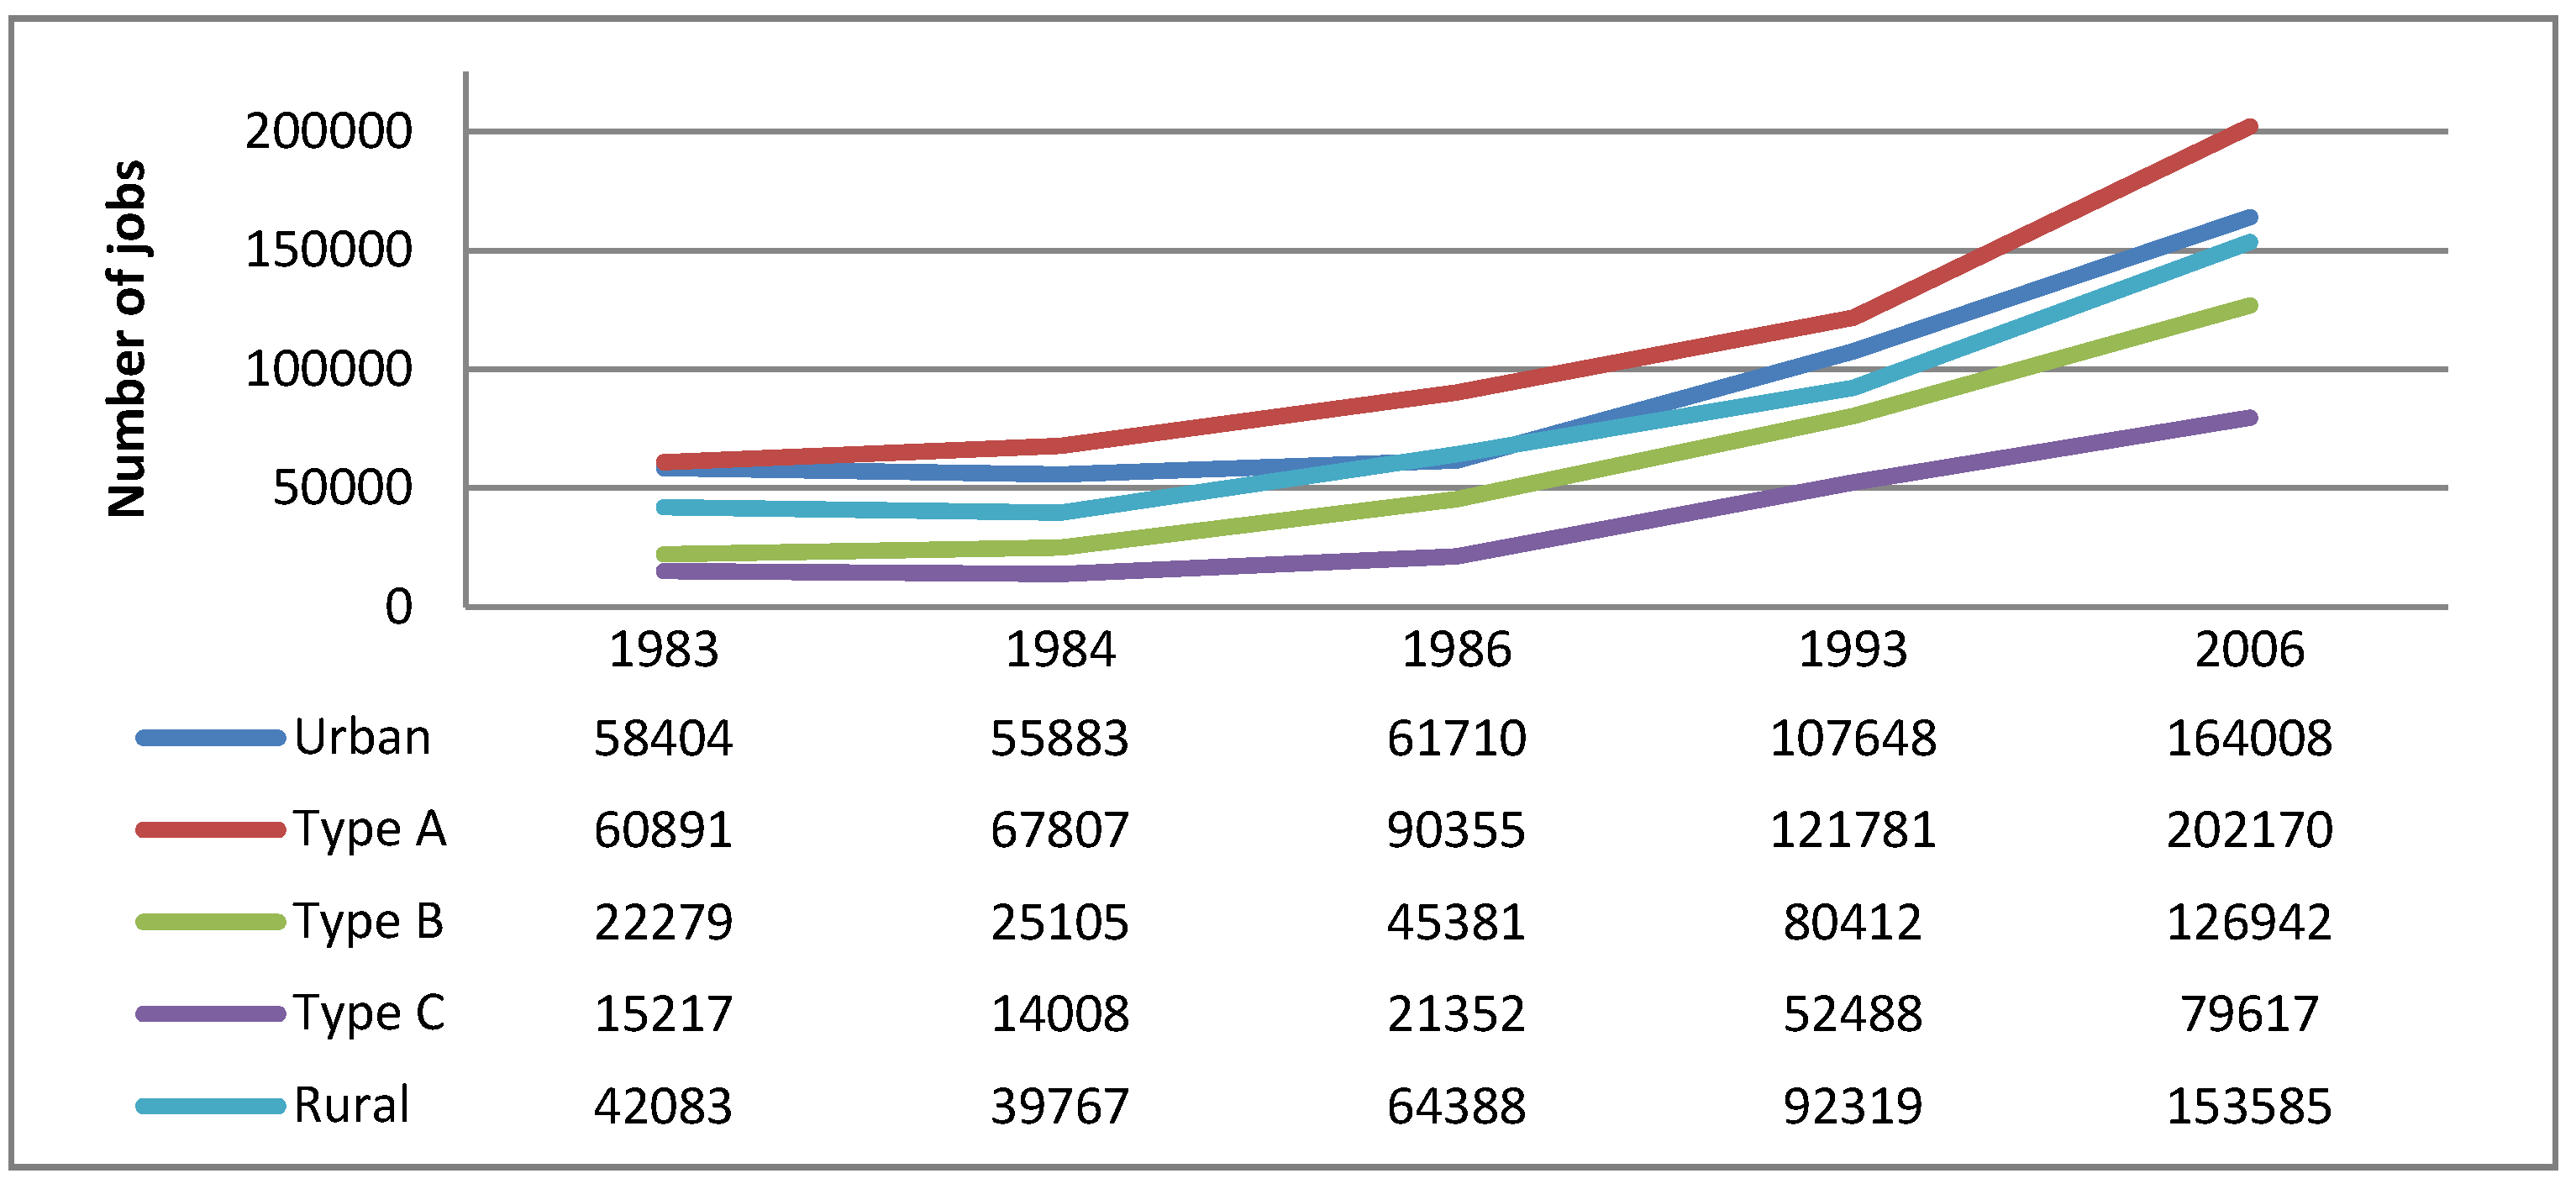
Figure 7, the Rural-Urban Type A groups have absorbed the largest number of employees in medium- and large-sized industries and have experienced the highest growth rates of employment in these types of industries, compared to other subgroups. During the period from 1993 to 2006, employment in medium- and large-sized industries in these rural-urban regions increased at the fastest rates, leaving behind other subgroups quite significantly. The Rural-Urban Type C group, which consists of six districts, had considerably less employment in medium- to large-sized industries than the Rural-Urban Type A group, which consists of four districts. However, it is important to note that 16 of the districts analyzed were rural, and therefore, the levels of employment in medium- and large-sized industries are higher in these districts than in Rural-Urban Type B and Rural-Urban Type C districts. In fact, the average number of people employed in these industries was only 9,600 per district in 2006, but was 31,440 for the rural-urban areas (Types A, B and C). Nevertheless, all subgroups experienced positive growth rates, which suggests that industrialization was quite significant at the provincial level.
Figure 7.
Number of jobs in medium- and large-sized industries.
Figure 7.
Number of jobs in medium- and large-sized industries.
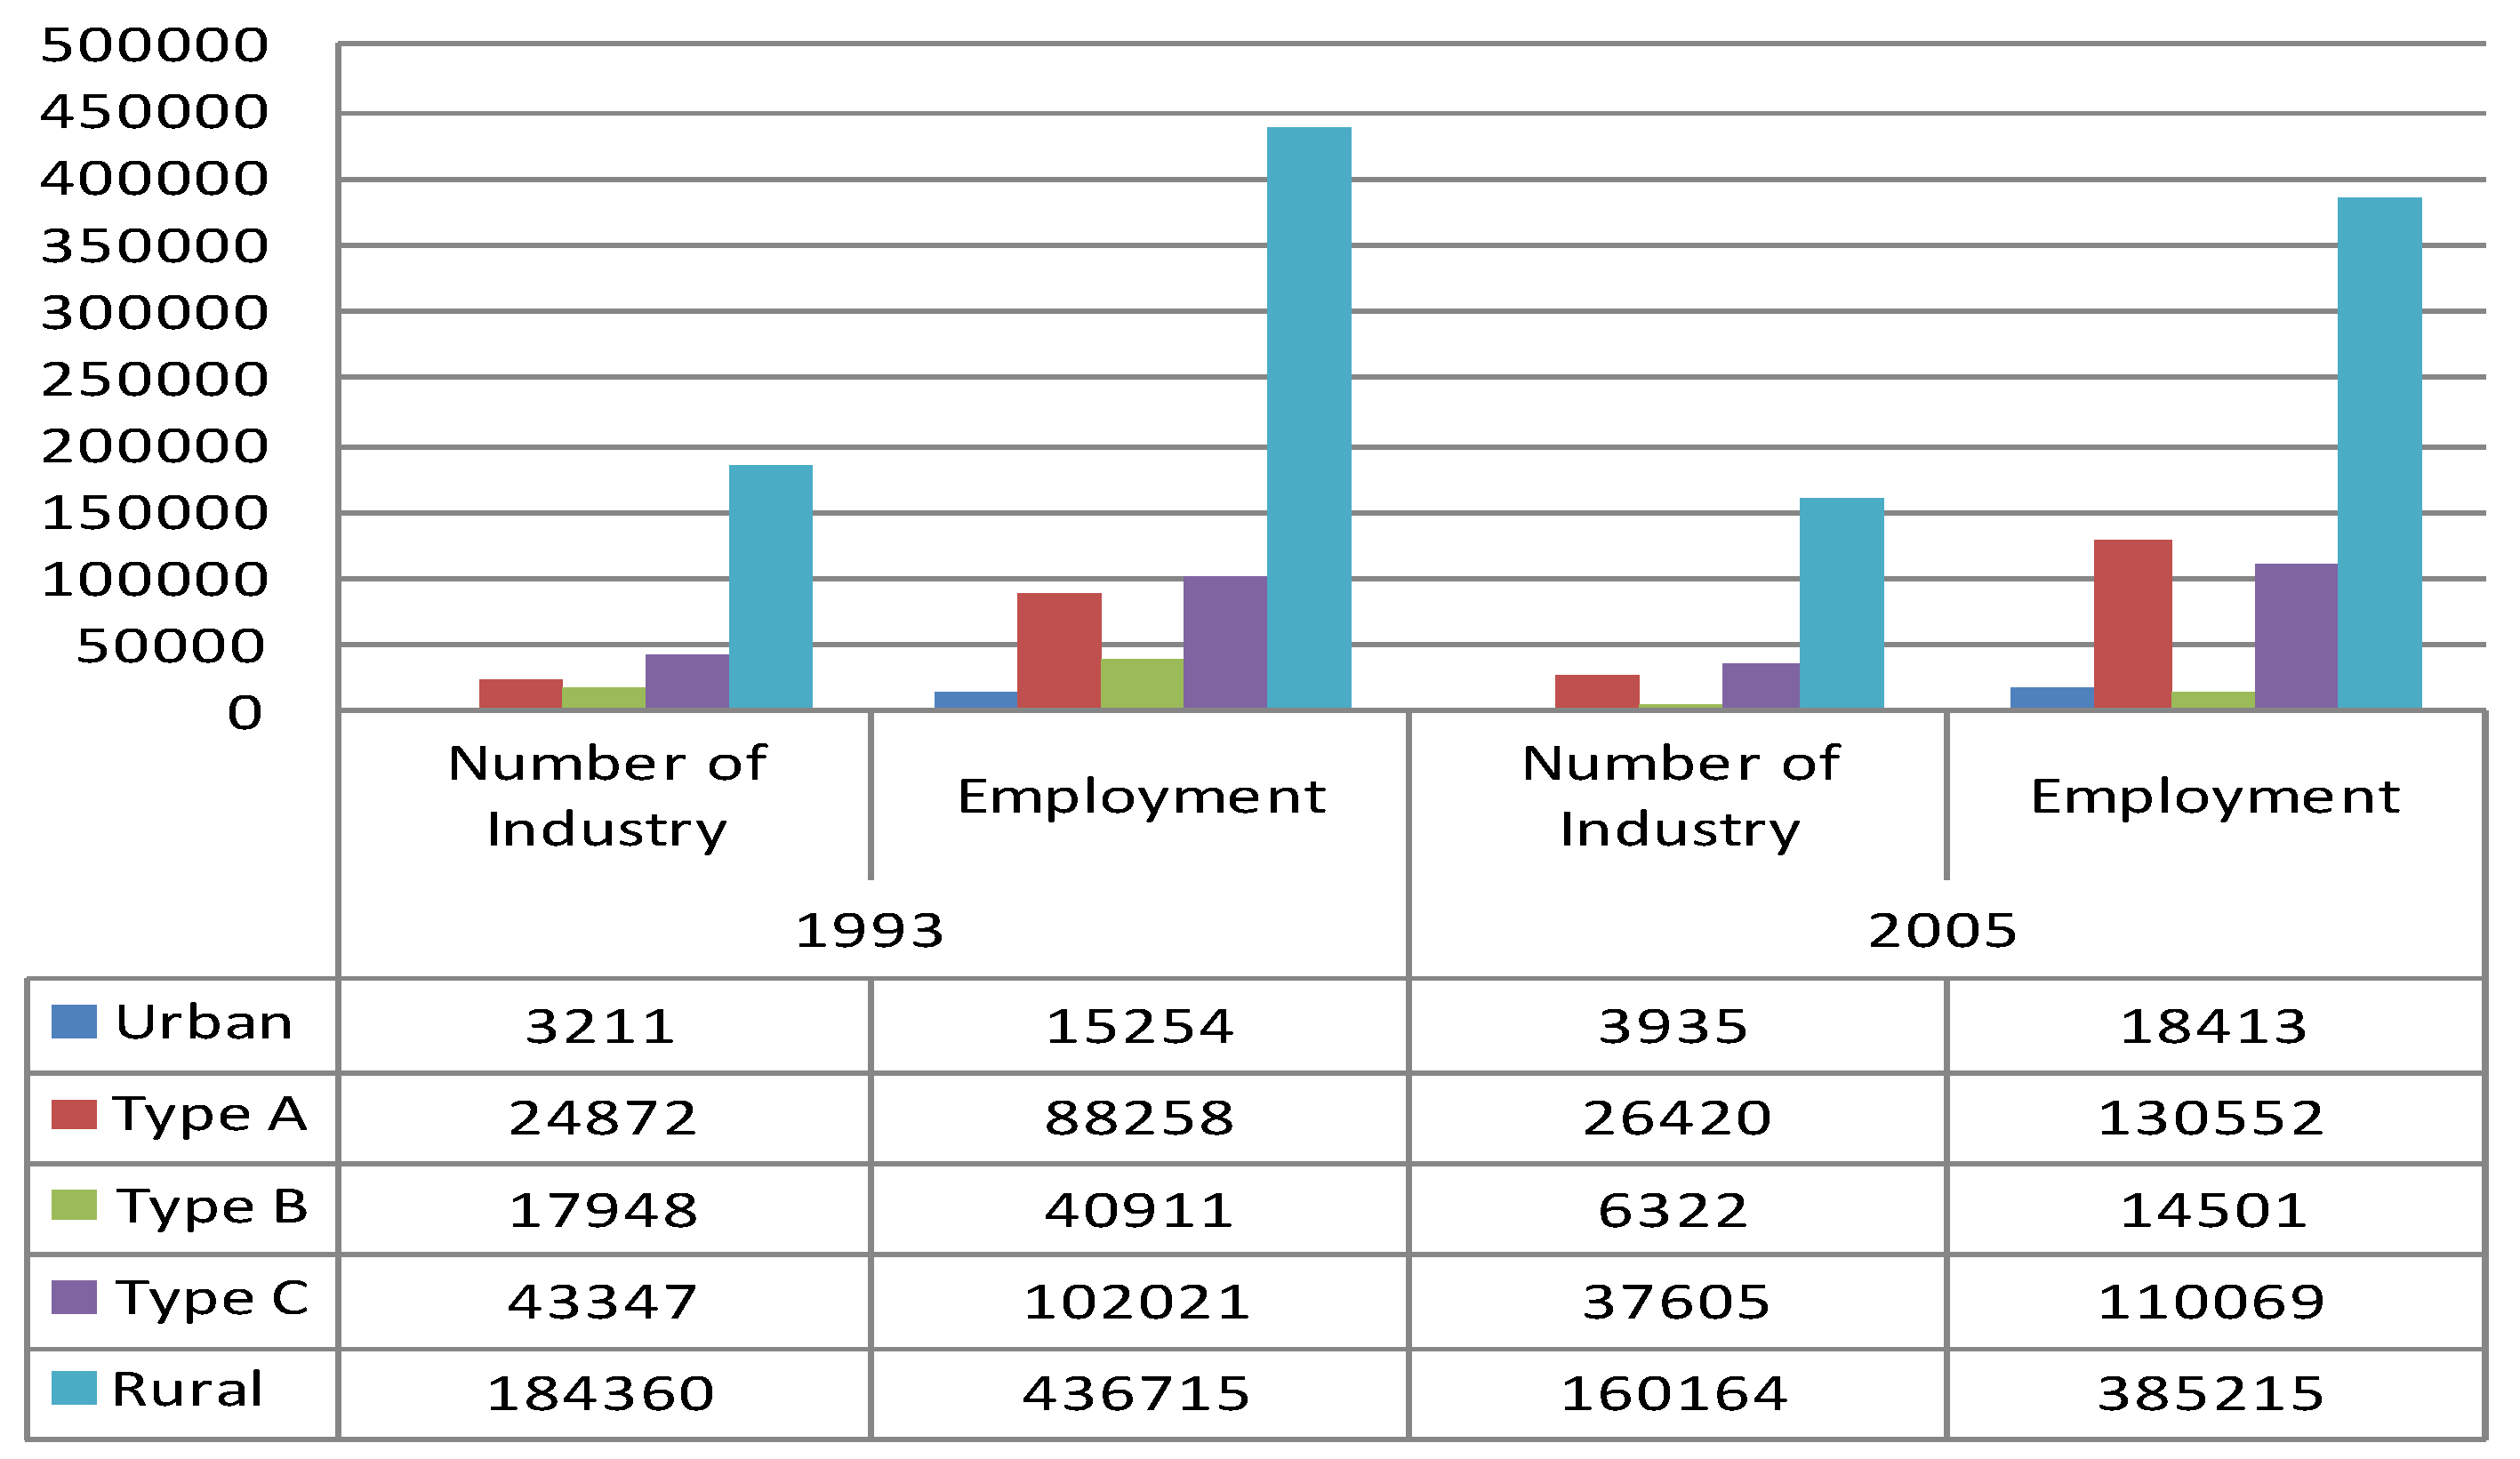
A similar trend was also observed for small industries (see
Figure 8). Both the number of industries and the number of jobs indicate significant growth in Rural-Urban Type A compared to the other subgroups. Although rural districts have contributed significantly to employment in small industries, the trend is likely to decline. The number of industries in rural districts decreased from 184,360 to 160,164, and the number of jobs decreased from 436,715 to 385,215. A similar pattern was observed for Rural-Urban Type B. The number of industries decreased from 17,948 to 6,322, and the number of jobs decreased to a quarter of the 1993 level, from 40,911 to 14,501. It is clear that only the Rural-Urban Type A districts, followed by the urban districts and Rural-Urban Type C districts, exhibited relatively stable performance.
The facts reported above revealed that the Rural-Urban Type A group exhibited the steadiest growth and the smoothest economic transition, compared to the other rural-urban subgroups. One important point that should be acknowledged as a key performance factor is the dominant role of local resources, which may reduce the influence of uncontrollable external situations. Zhu [
29] has reported quite similar results for Rural-Urban Type A areas in Fujian Province in China. The development of township and village enterprises (TVEs) in the province has led to what he calls “
in situ urbanization”. Qadeer [
8] has also discussed emerging settlement systems characterized as urban being located relatively distant from urban centers in Pakistan, India and Bangladesh.
Figure 8.
Numbers of industries and jobs in small industries.
Figure 8.
Numbers of industries and jobs in small industries.
With respect to Rural-Urban Type A areas, studies by Yu Zhu [
29] and Qadeer [
8] have also shown that small- and medium-sized enterprises (SMEs), which are mostly centered in rural areas, should be regarded as potential generators of new growth that reduce inequality among regions. Considering that SMEs are characterized as labor-intensive and that the distribution of income among enterprises is relatively more even, the dominant role of SMEs can be seen as a good sign, because it indicates a more equal income distribution. Weiss [
30], Weijland [
26], and Tambunan [
31] believe that SMEs play a strategic function in most developing countries, as they are very important to the survival of most rural households.


