Spatiotemporal Patterns and Socioeconomic Contexts of Vegetative Cover in Altamira City, Brazil

Abstract
:
1. Introduction
1.1. Urbanization and Global Land Use Cover Change
1.2. The Ecological and Social Contexts of Urban Vegetation
2. Materials and Methods
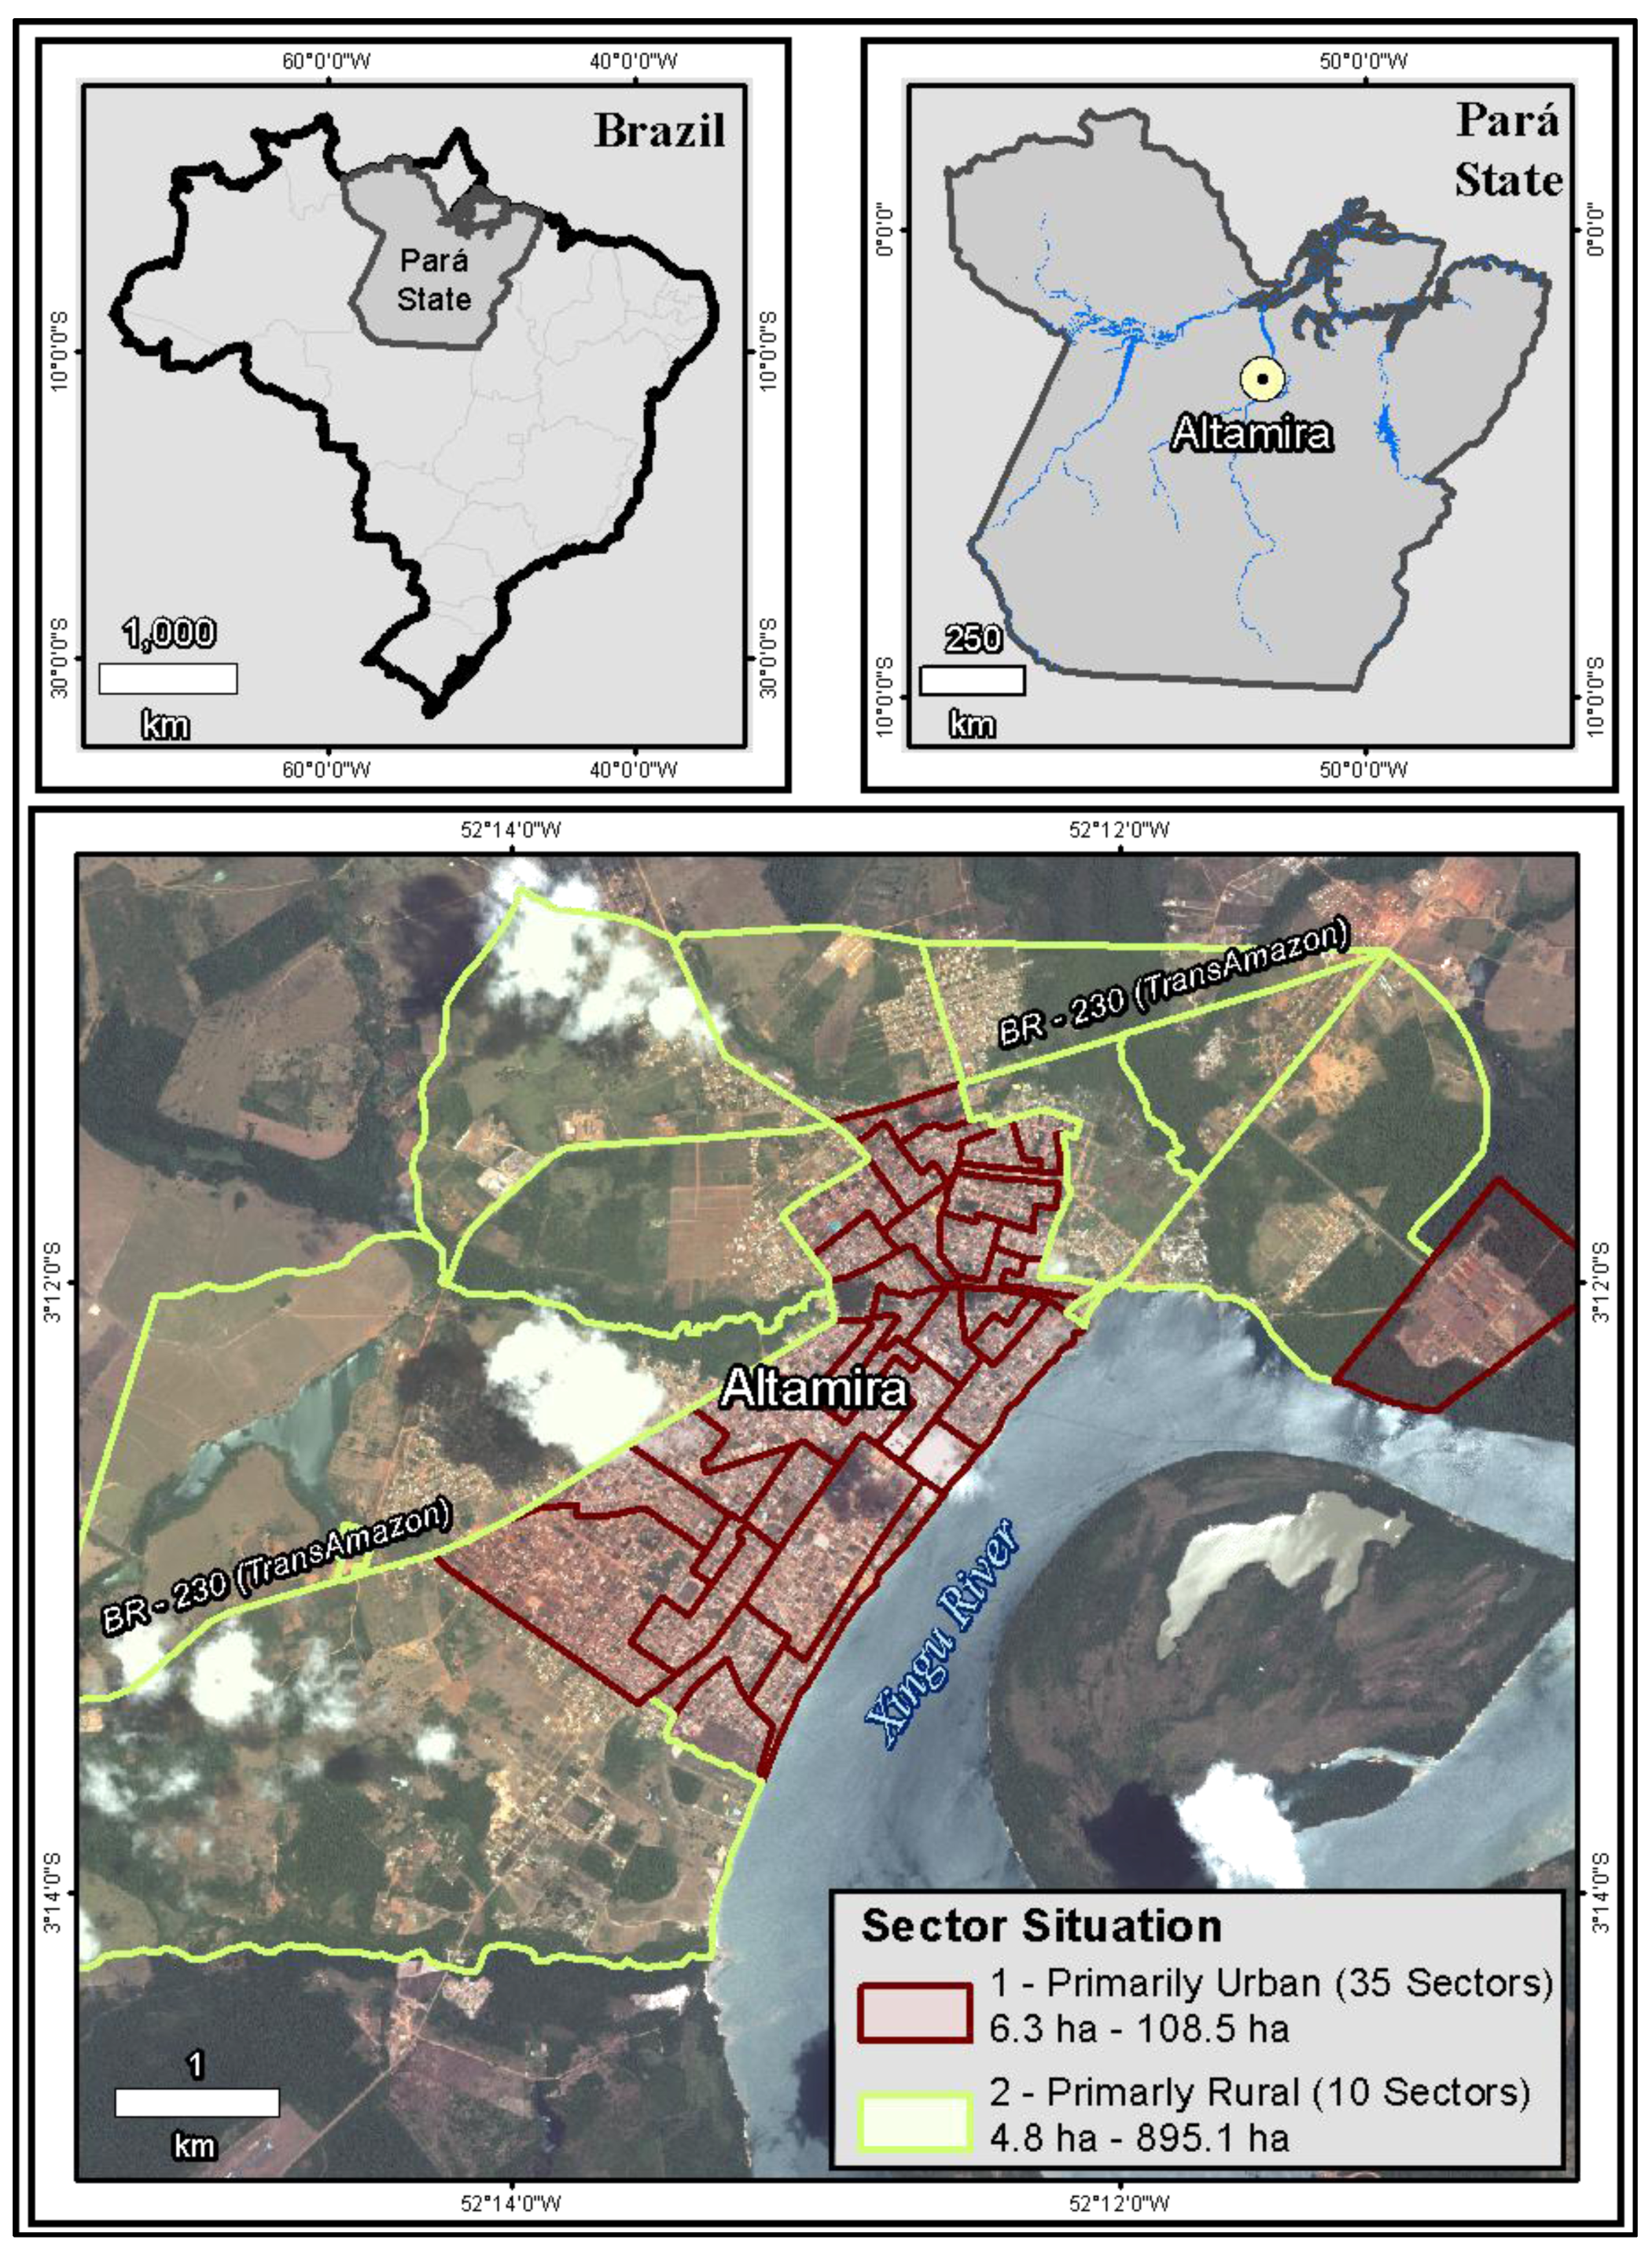
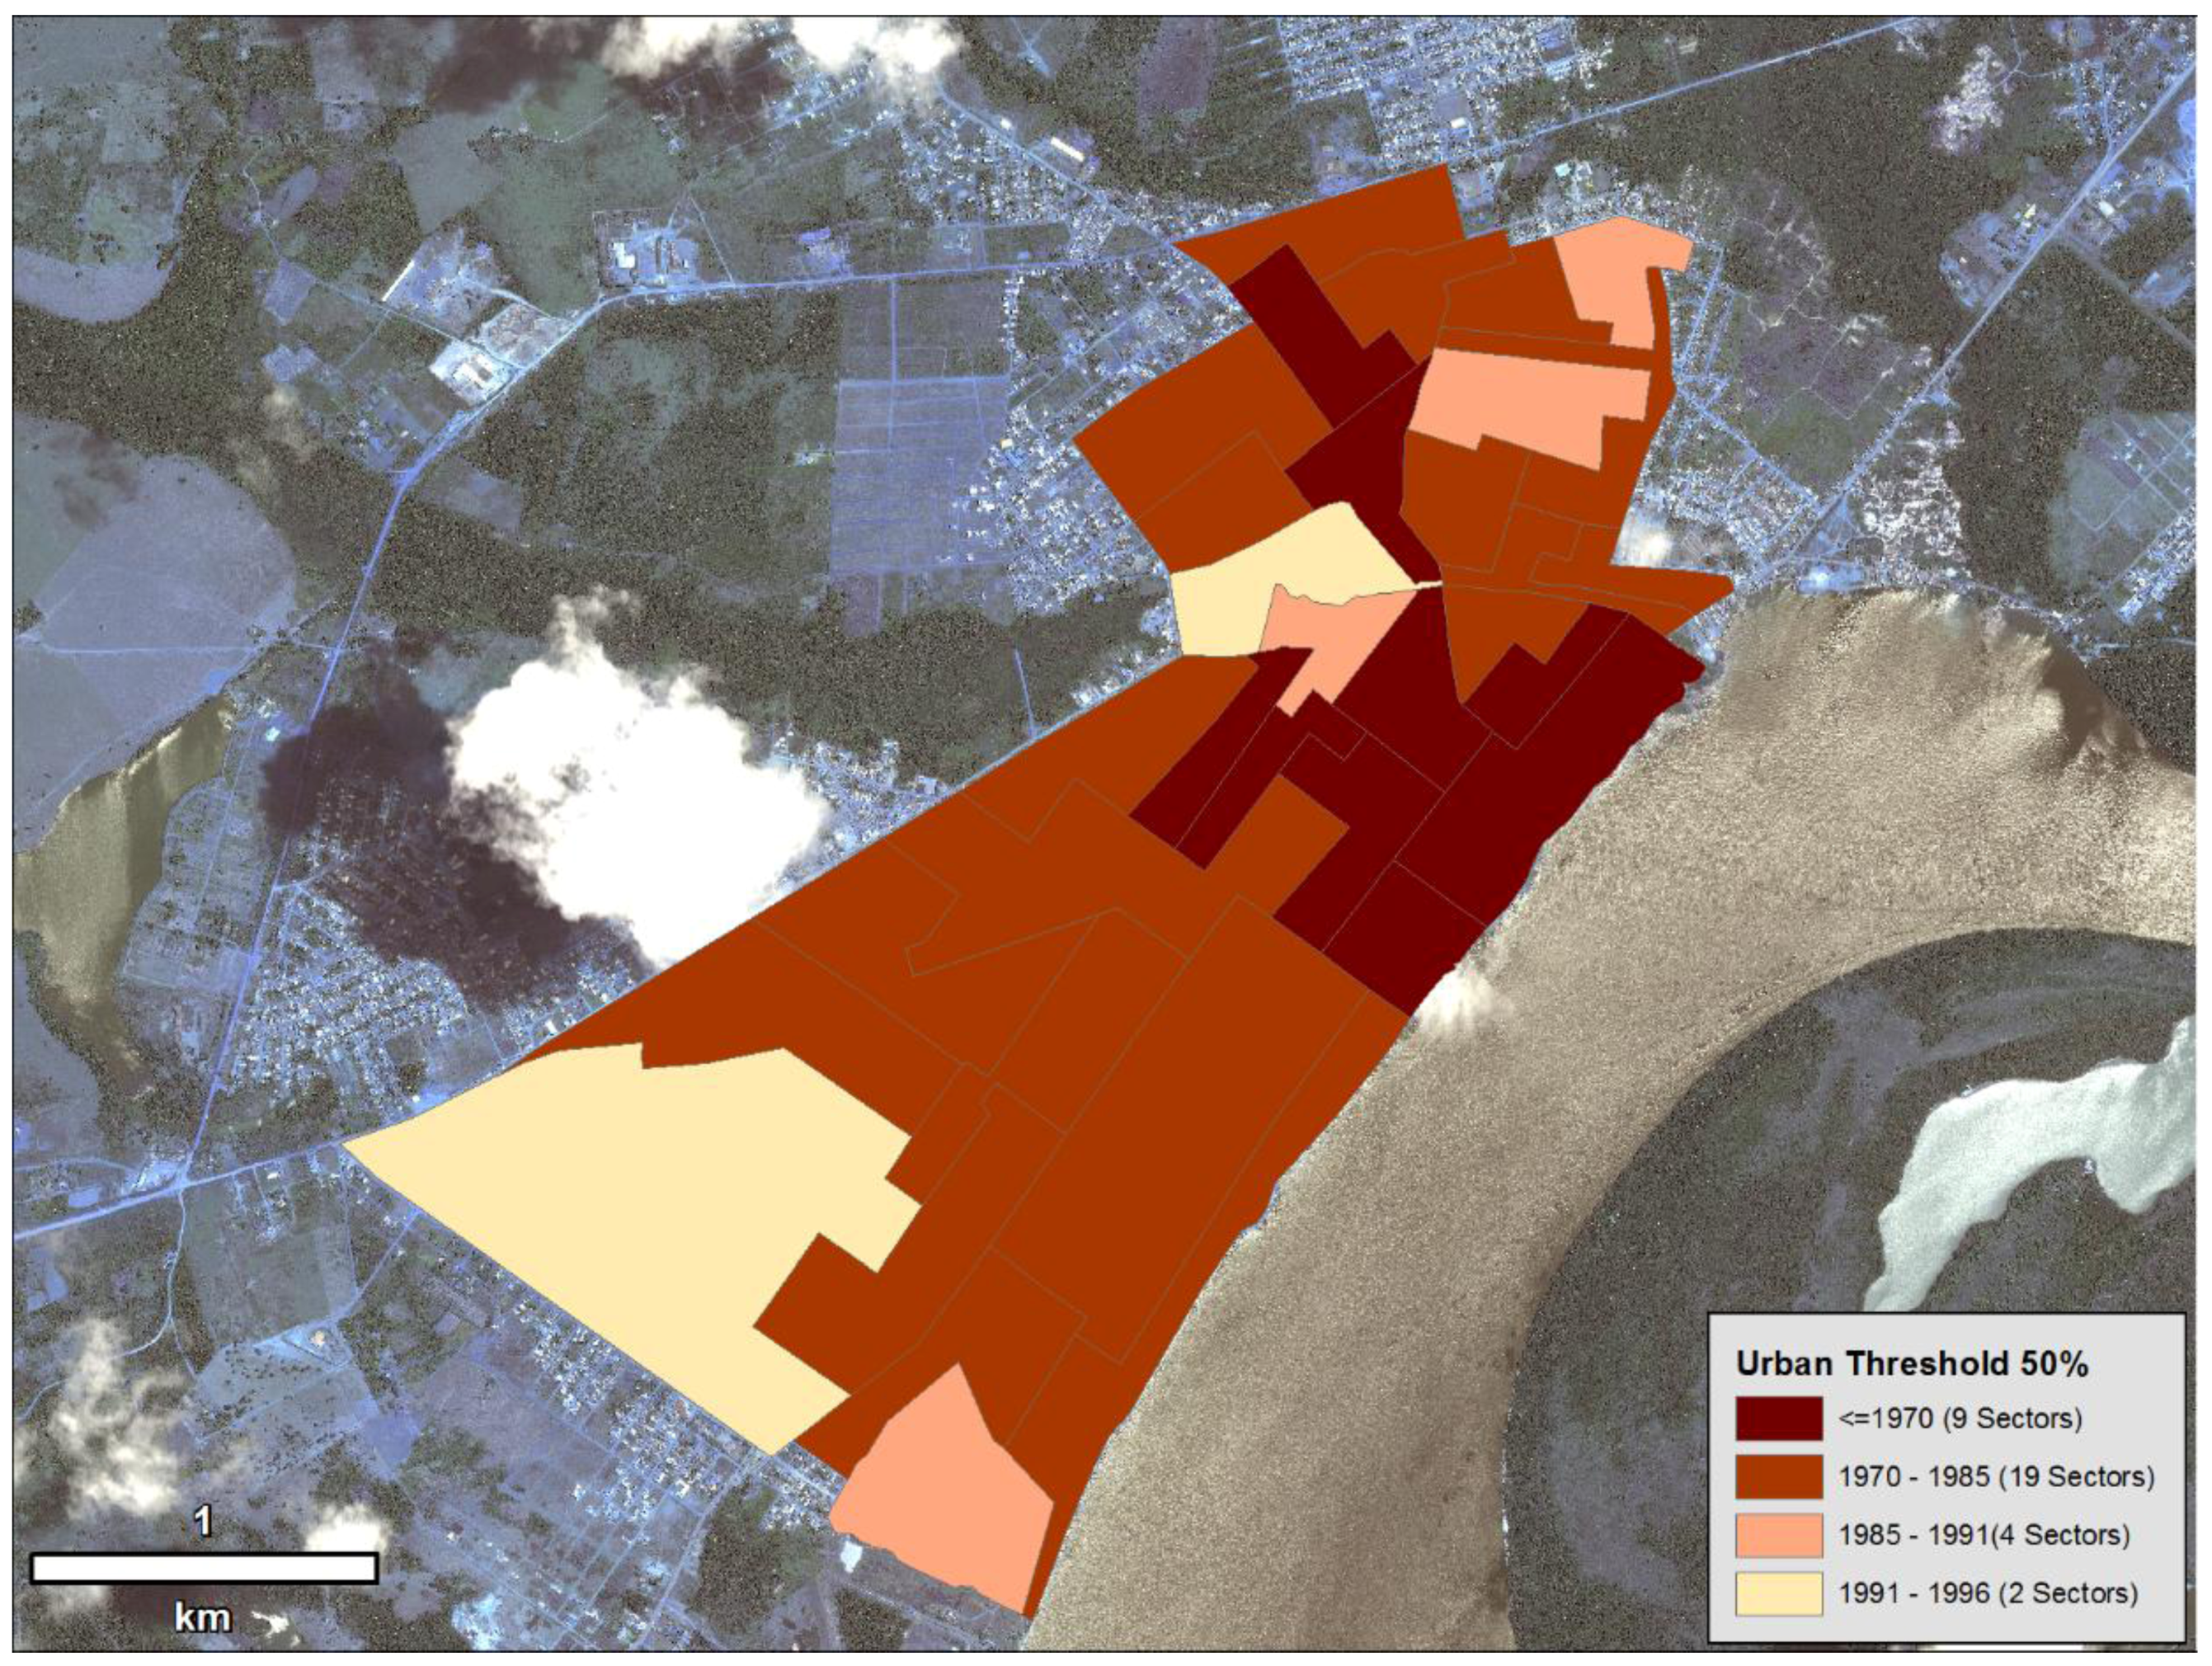
2.1. Study Area
2.2. Data Collection and Preprocessing
2.3. Vegetation Characterization, Urban Expansion and Statistical Analysis

| Remotely Sensed Data | ||||
| Sensor/Platform | Date | Spatial Resolution | Spectral Resolution | Derived Datasets |
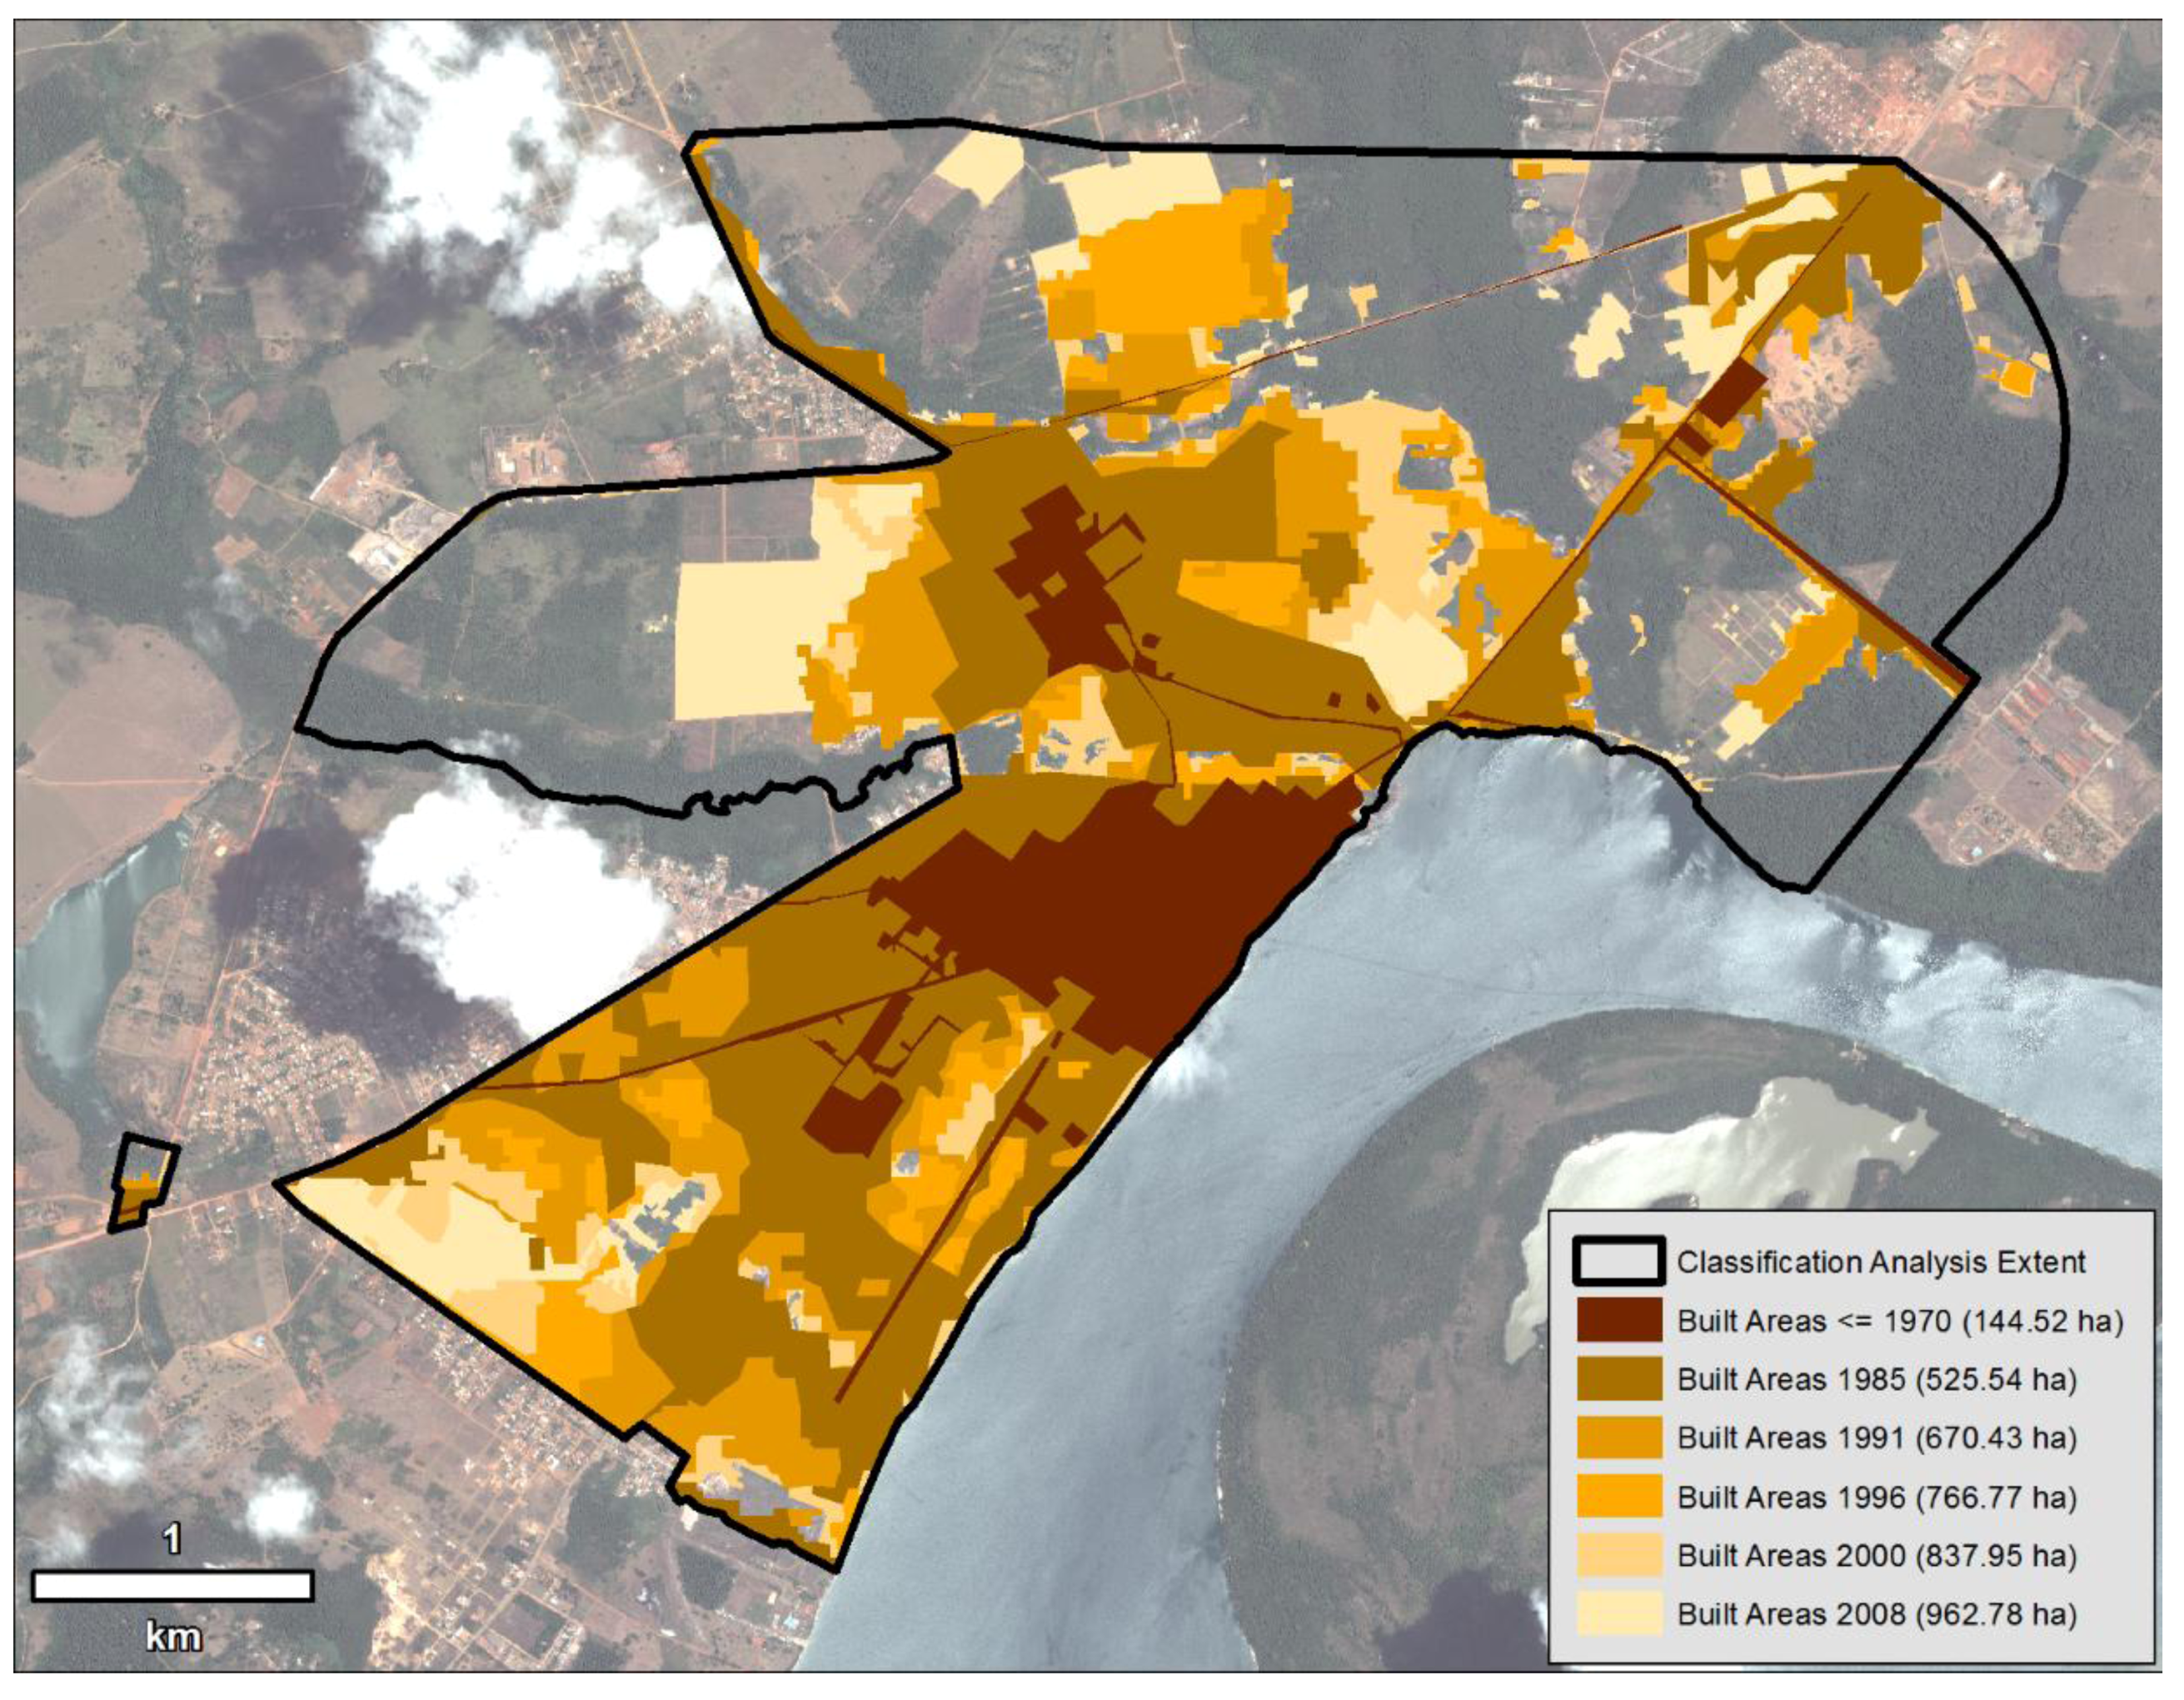
| QuickBird | 2008 | 1 m | Visible, NIR | NDVI, Land Cover Classification, Urban Trajectory |
| IKONOS | 2000 | 1 m | Visible, NIR | Urban Trajectory |
| Landsat TM & ETM+ | 1985, 1991, 1996, 2000, 2008 | 30 m | Visible, VNIR, SWIR, LWIR | Urban Trajectory |
| Aerial Photo | 1970 | 4 m | B&W | Urban Trajectory |
| Vector/Tabular Data | ||||
| Dataset | Date | Scale | Derived Datasets | |
| IBGE Census Data | 2000 | Aggregated to Census Tract | Independent Variables | |
| IBGE Census Tract Shapefile | 2000 | Census Tract | Spatial Unit of Analysis | |
| ACT Ground Truthing Data | 2008 | N/A | Land Cover Classification |

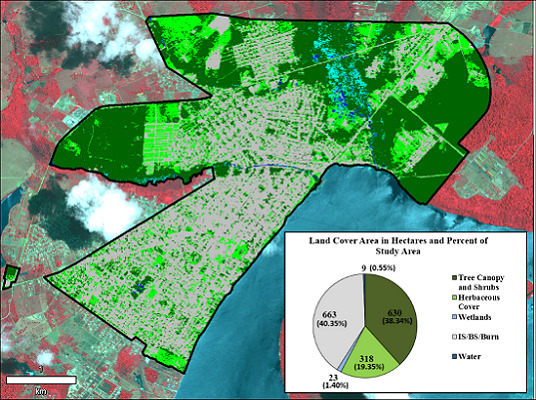
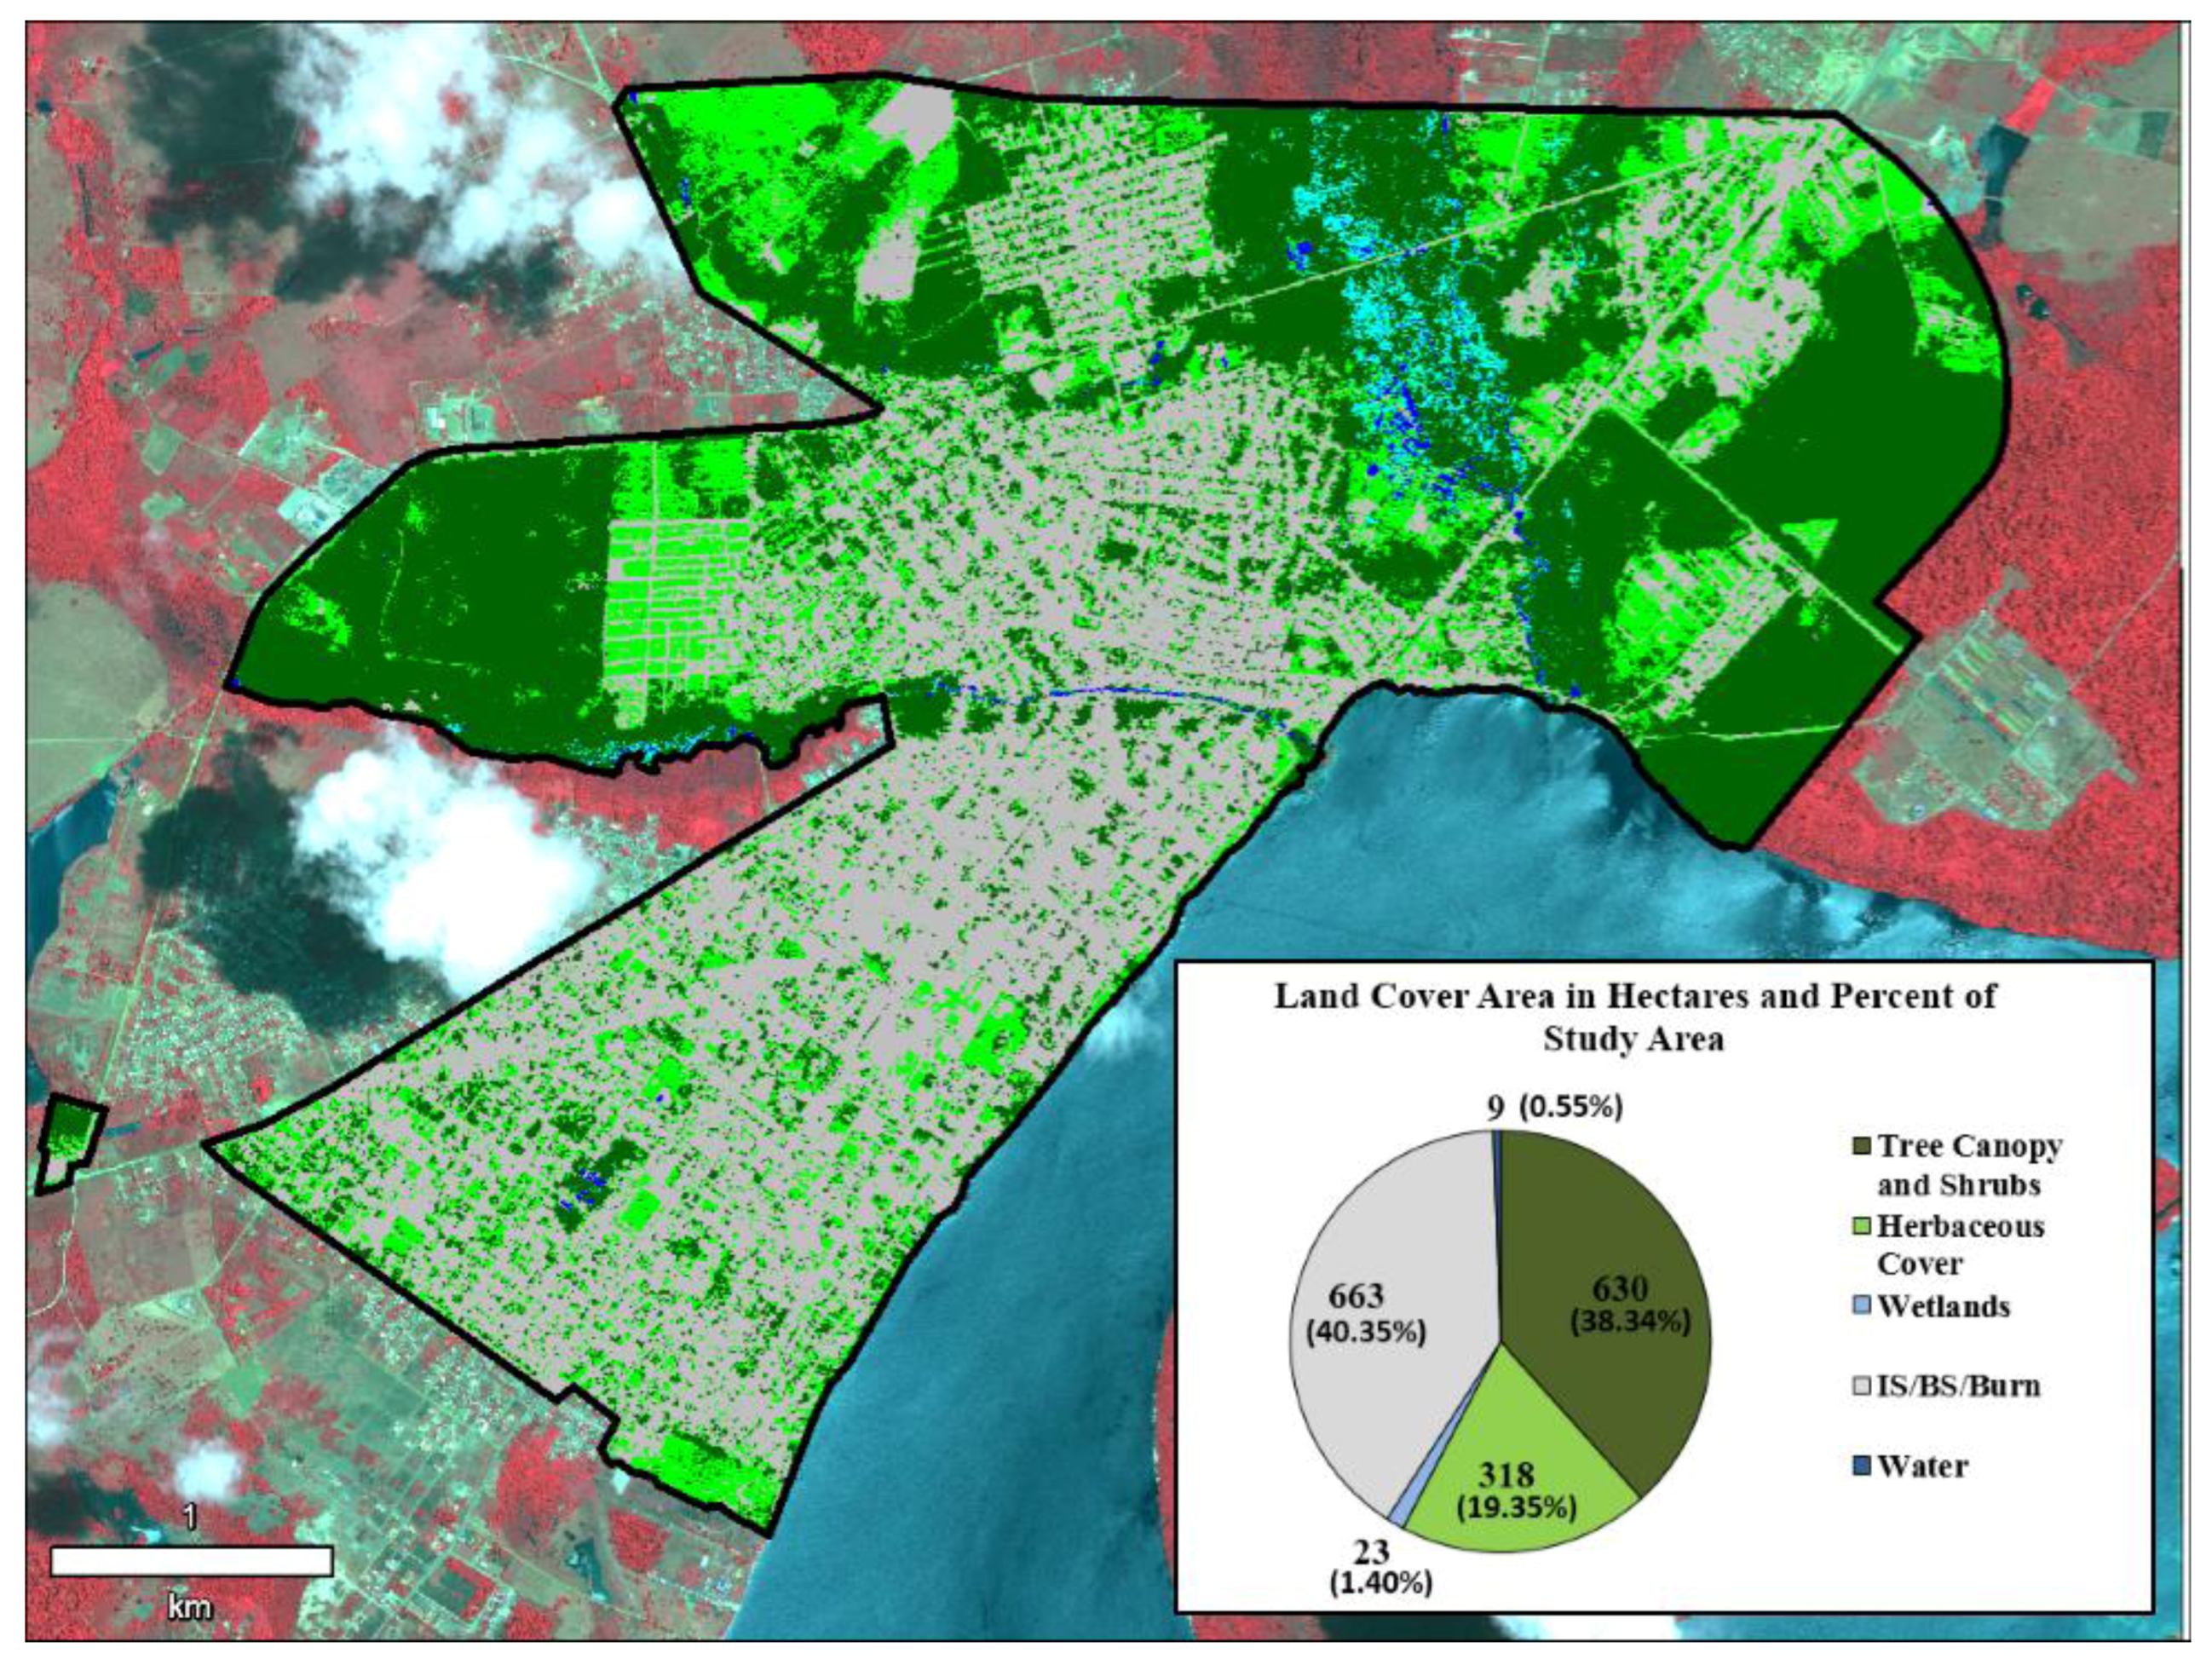
| Class Name | Producers Accuracy | Users Accuracy | Kappa Statistic |
|---|---|---|---|
| Tree Canopy | 92.00% | 100.00% | 1.0000 |
| Herbaceous Cover | 94.74% | 90.00% | 0.8765 |
| Wetland | 94.12% | 96.00% | 0.9518 |
| IS/BS/Burn | 93.15% | 95.77% | 0.9442 |
| Water | 100.00% | 88.00% | 0.8594 |

3. Results
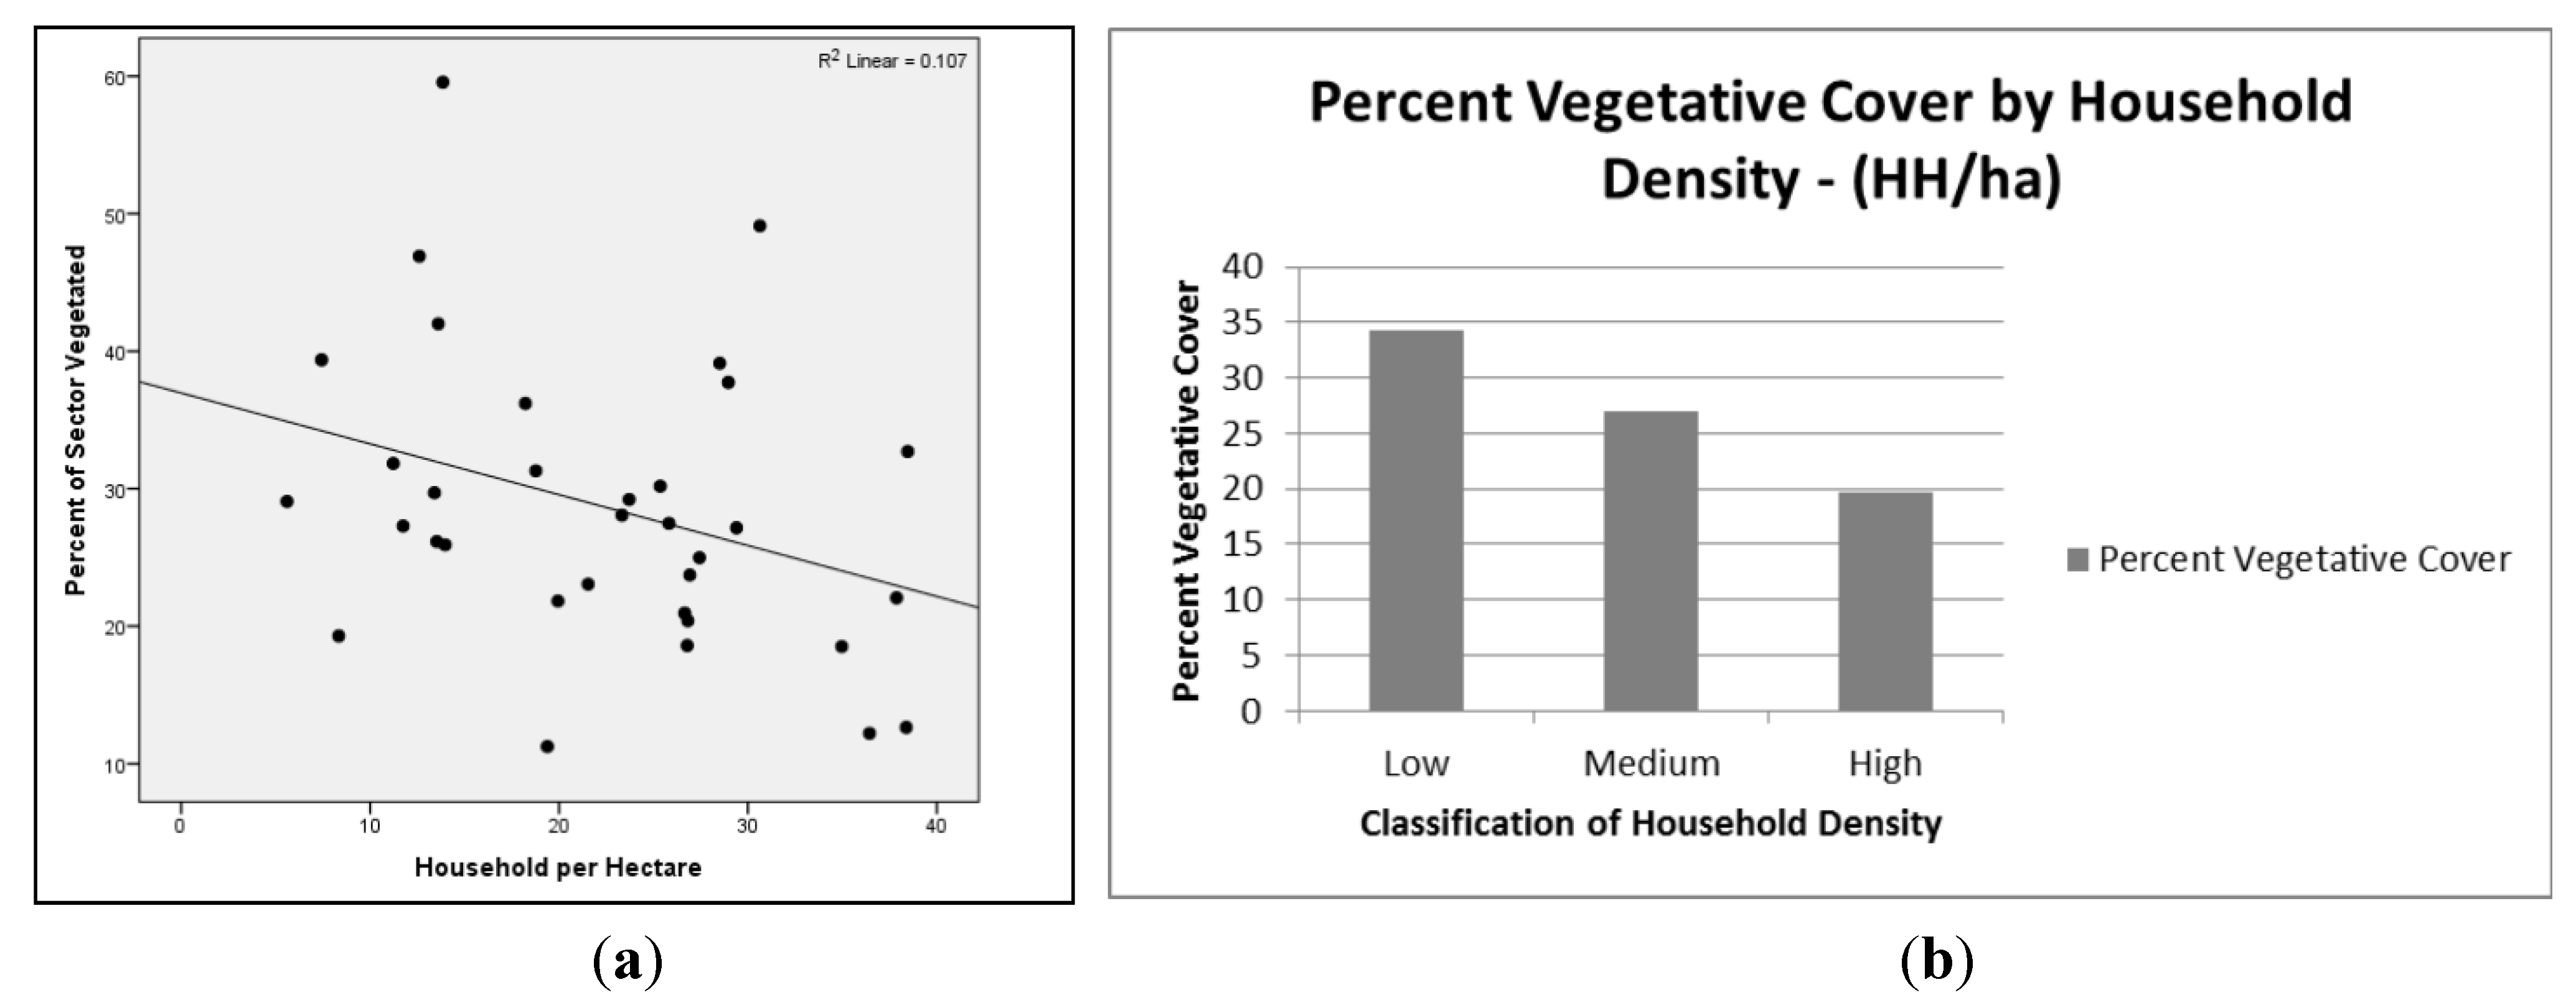
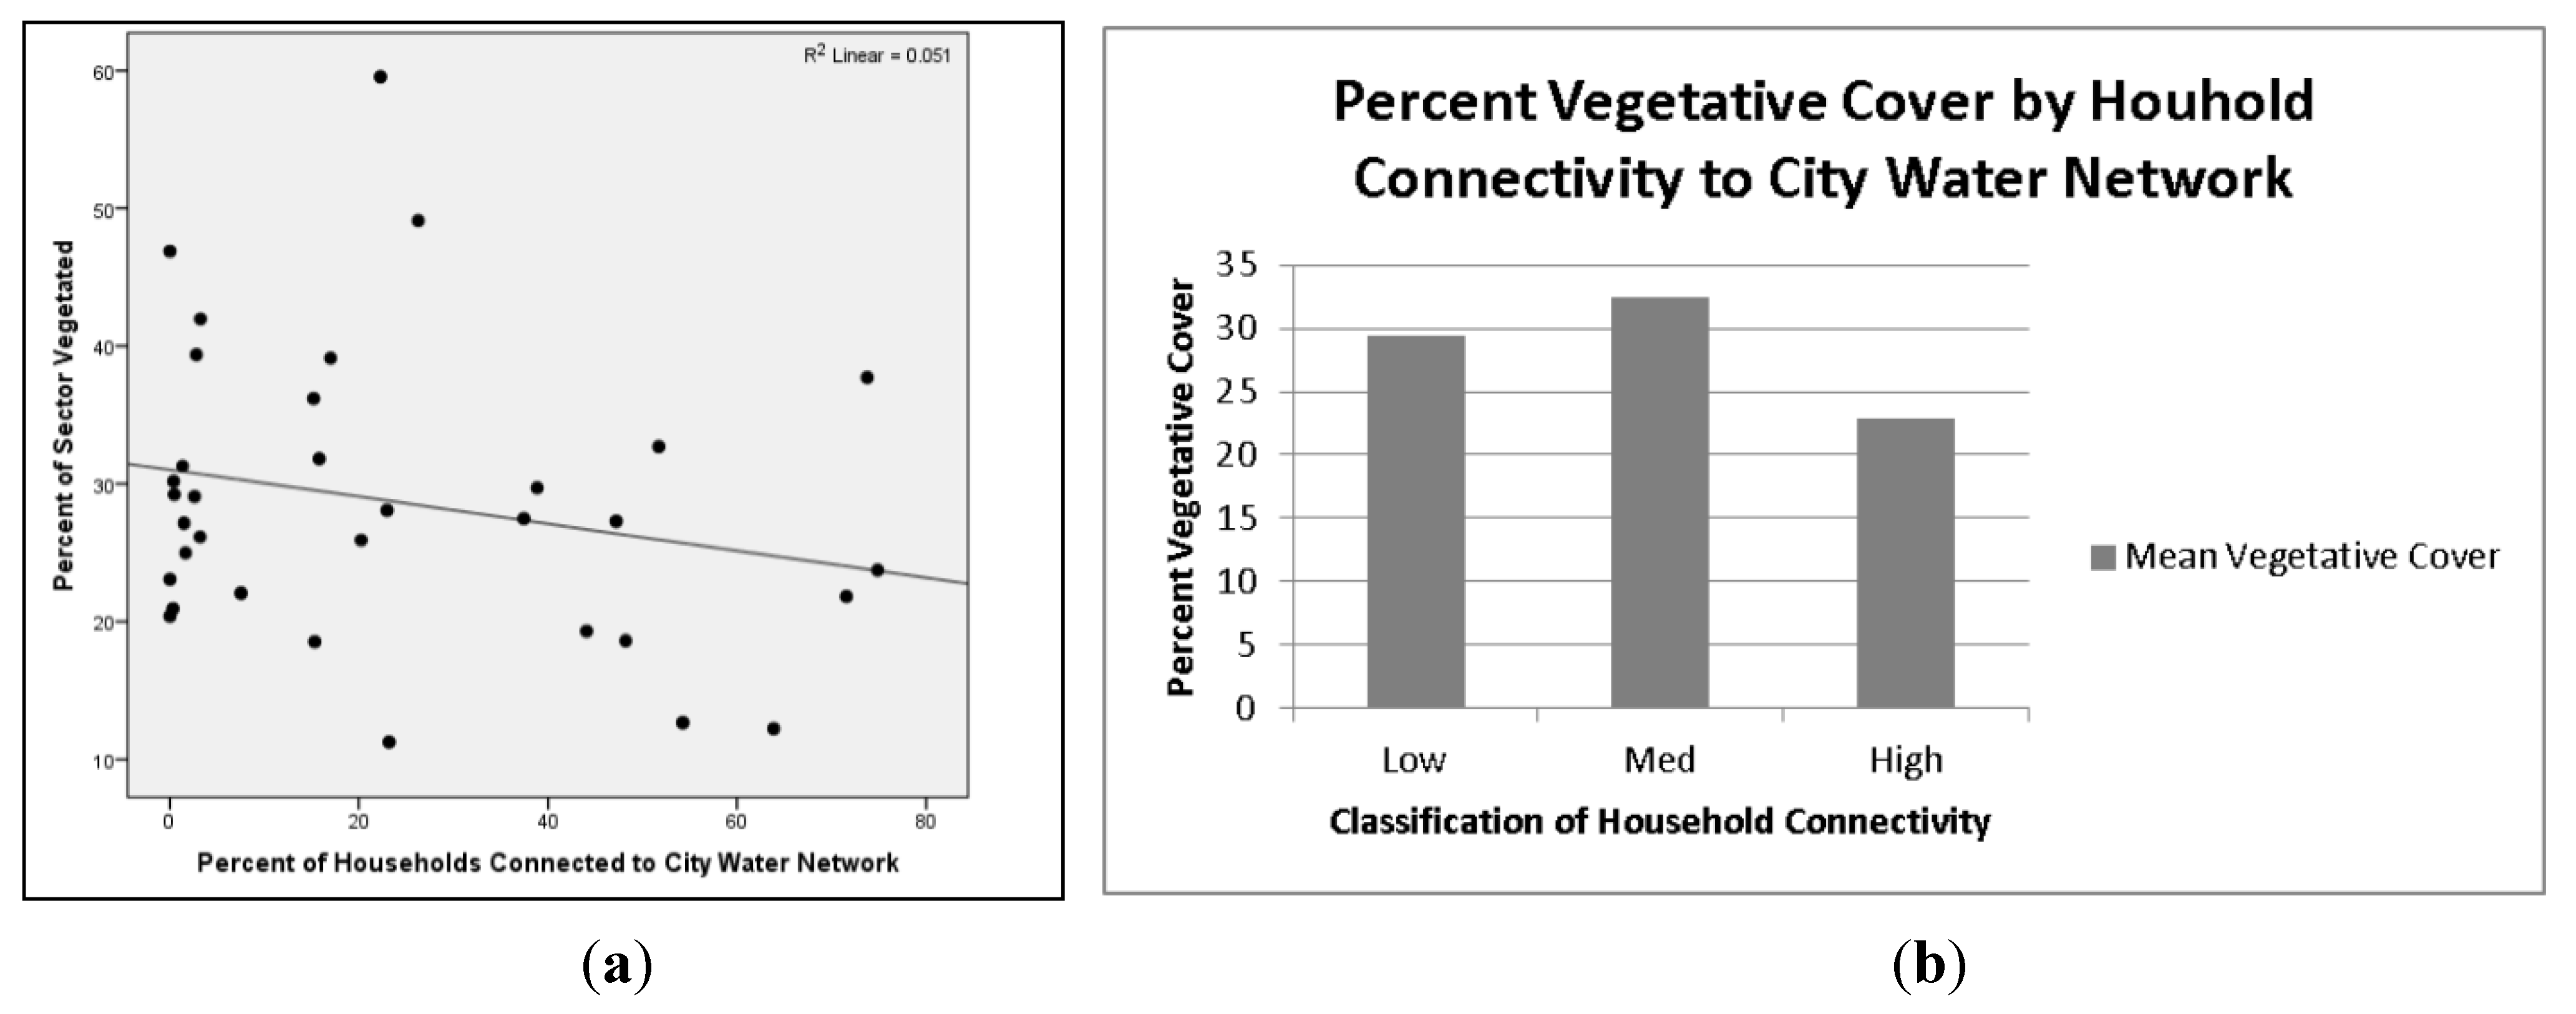
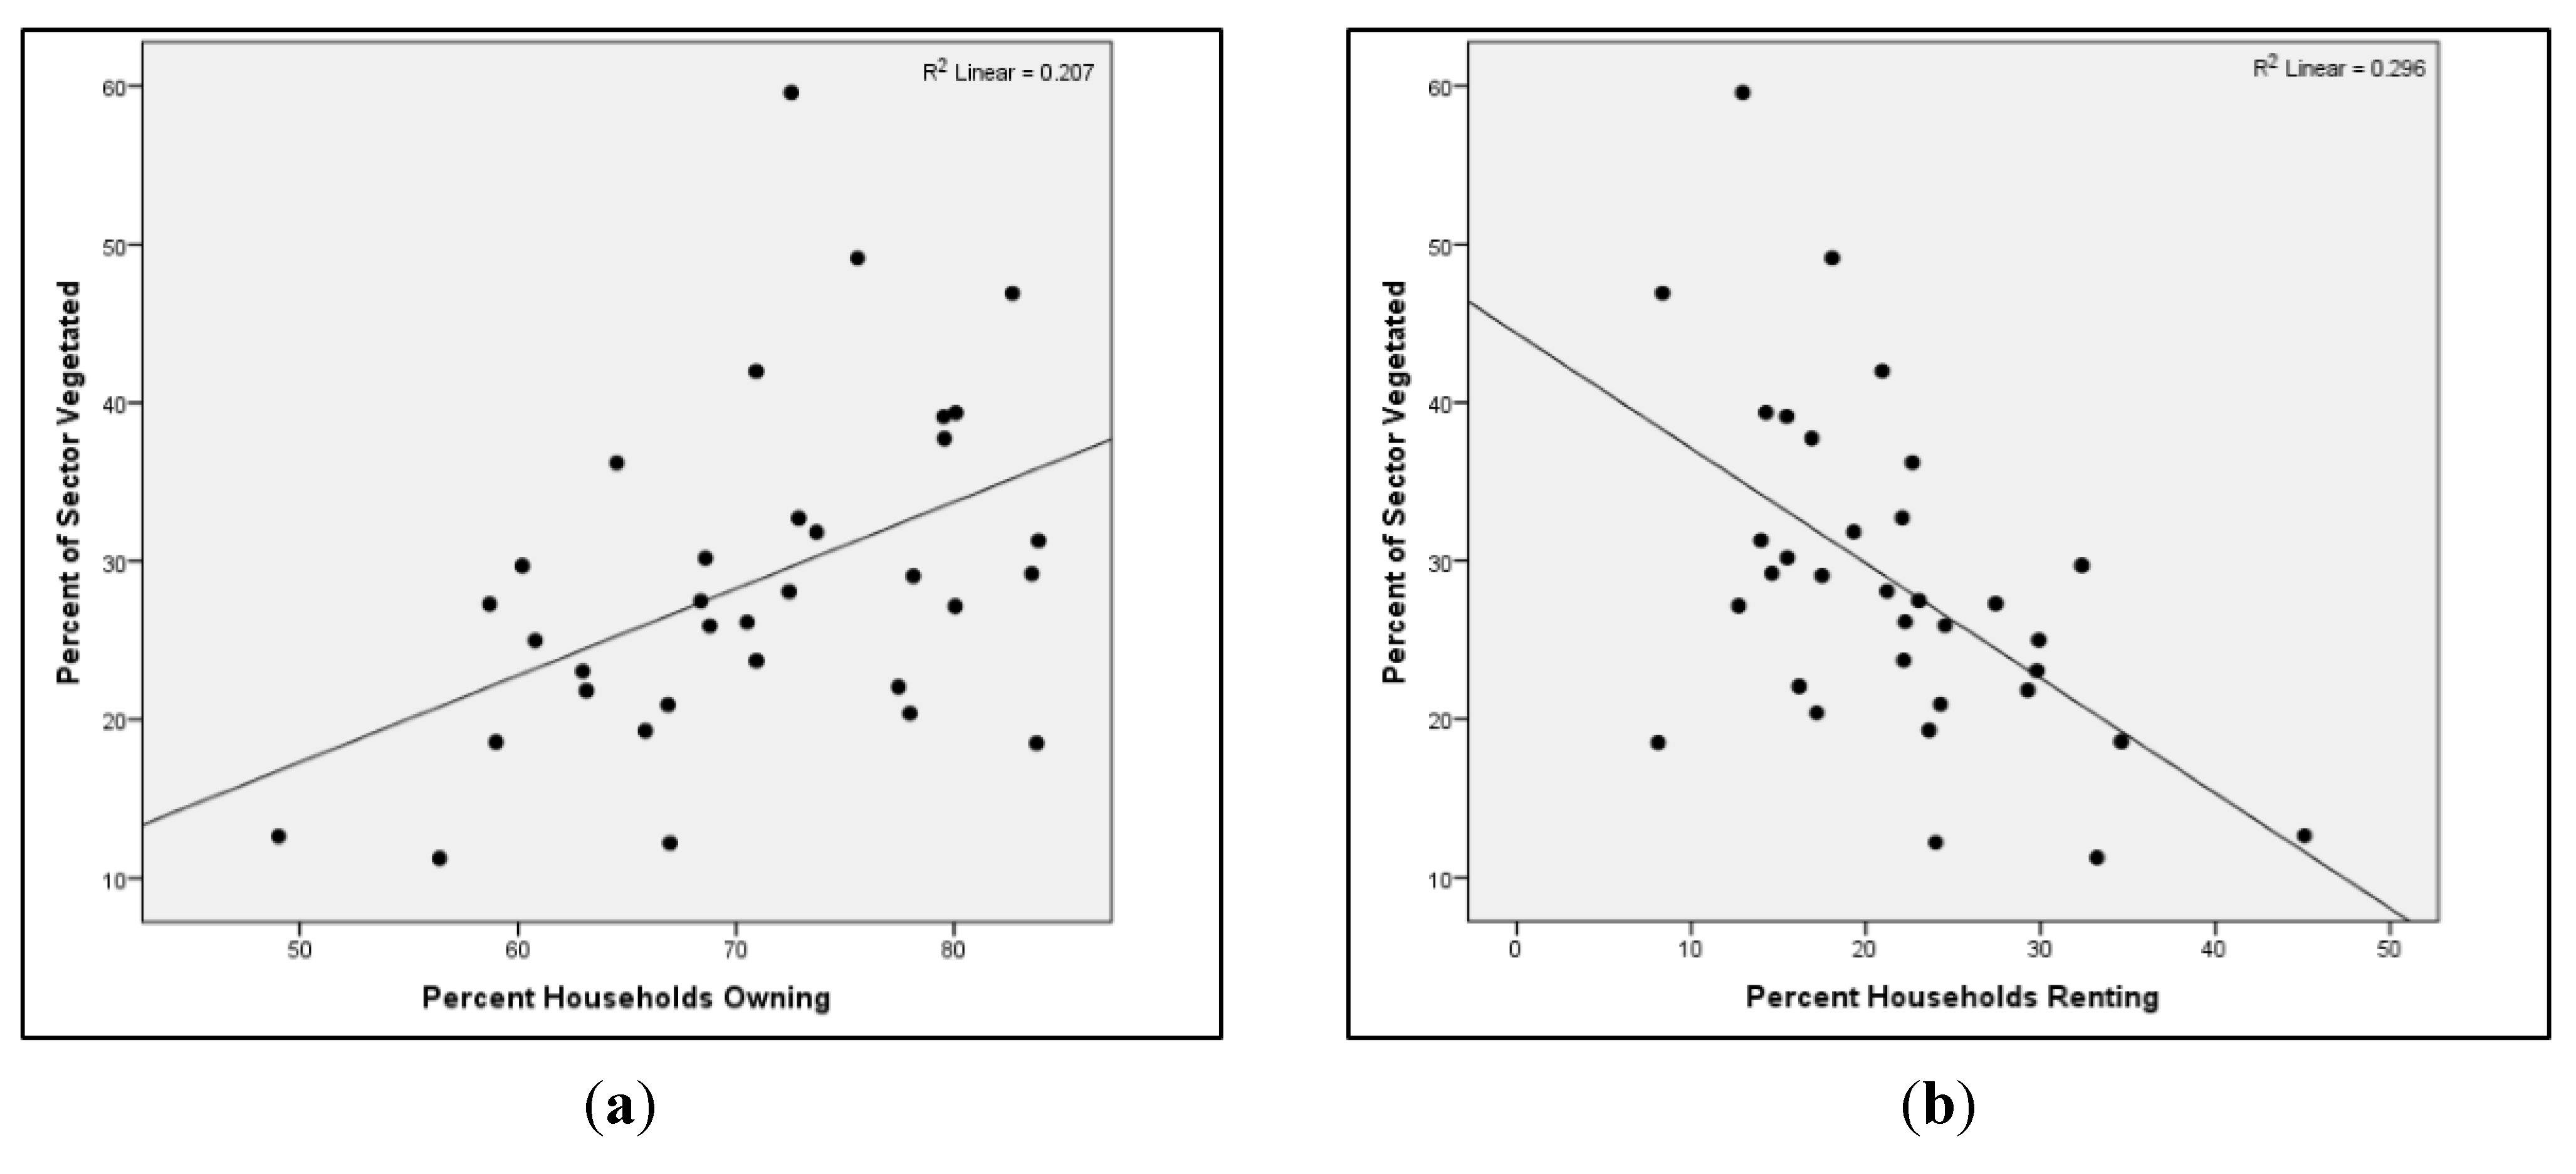
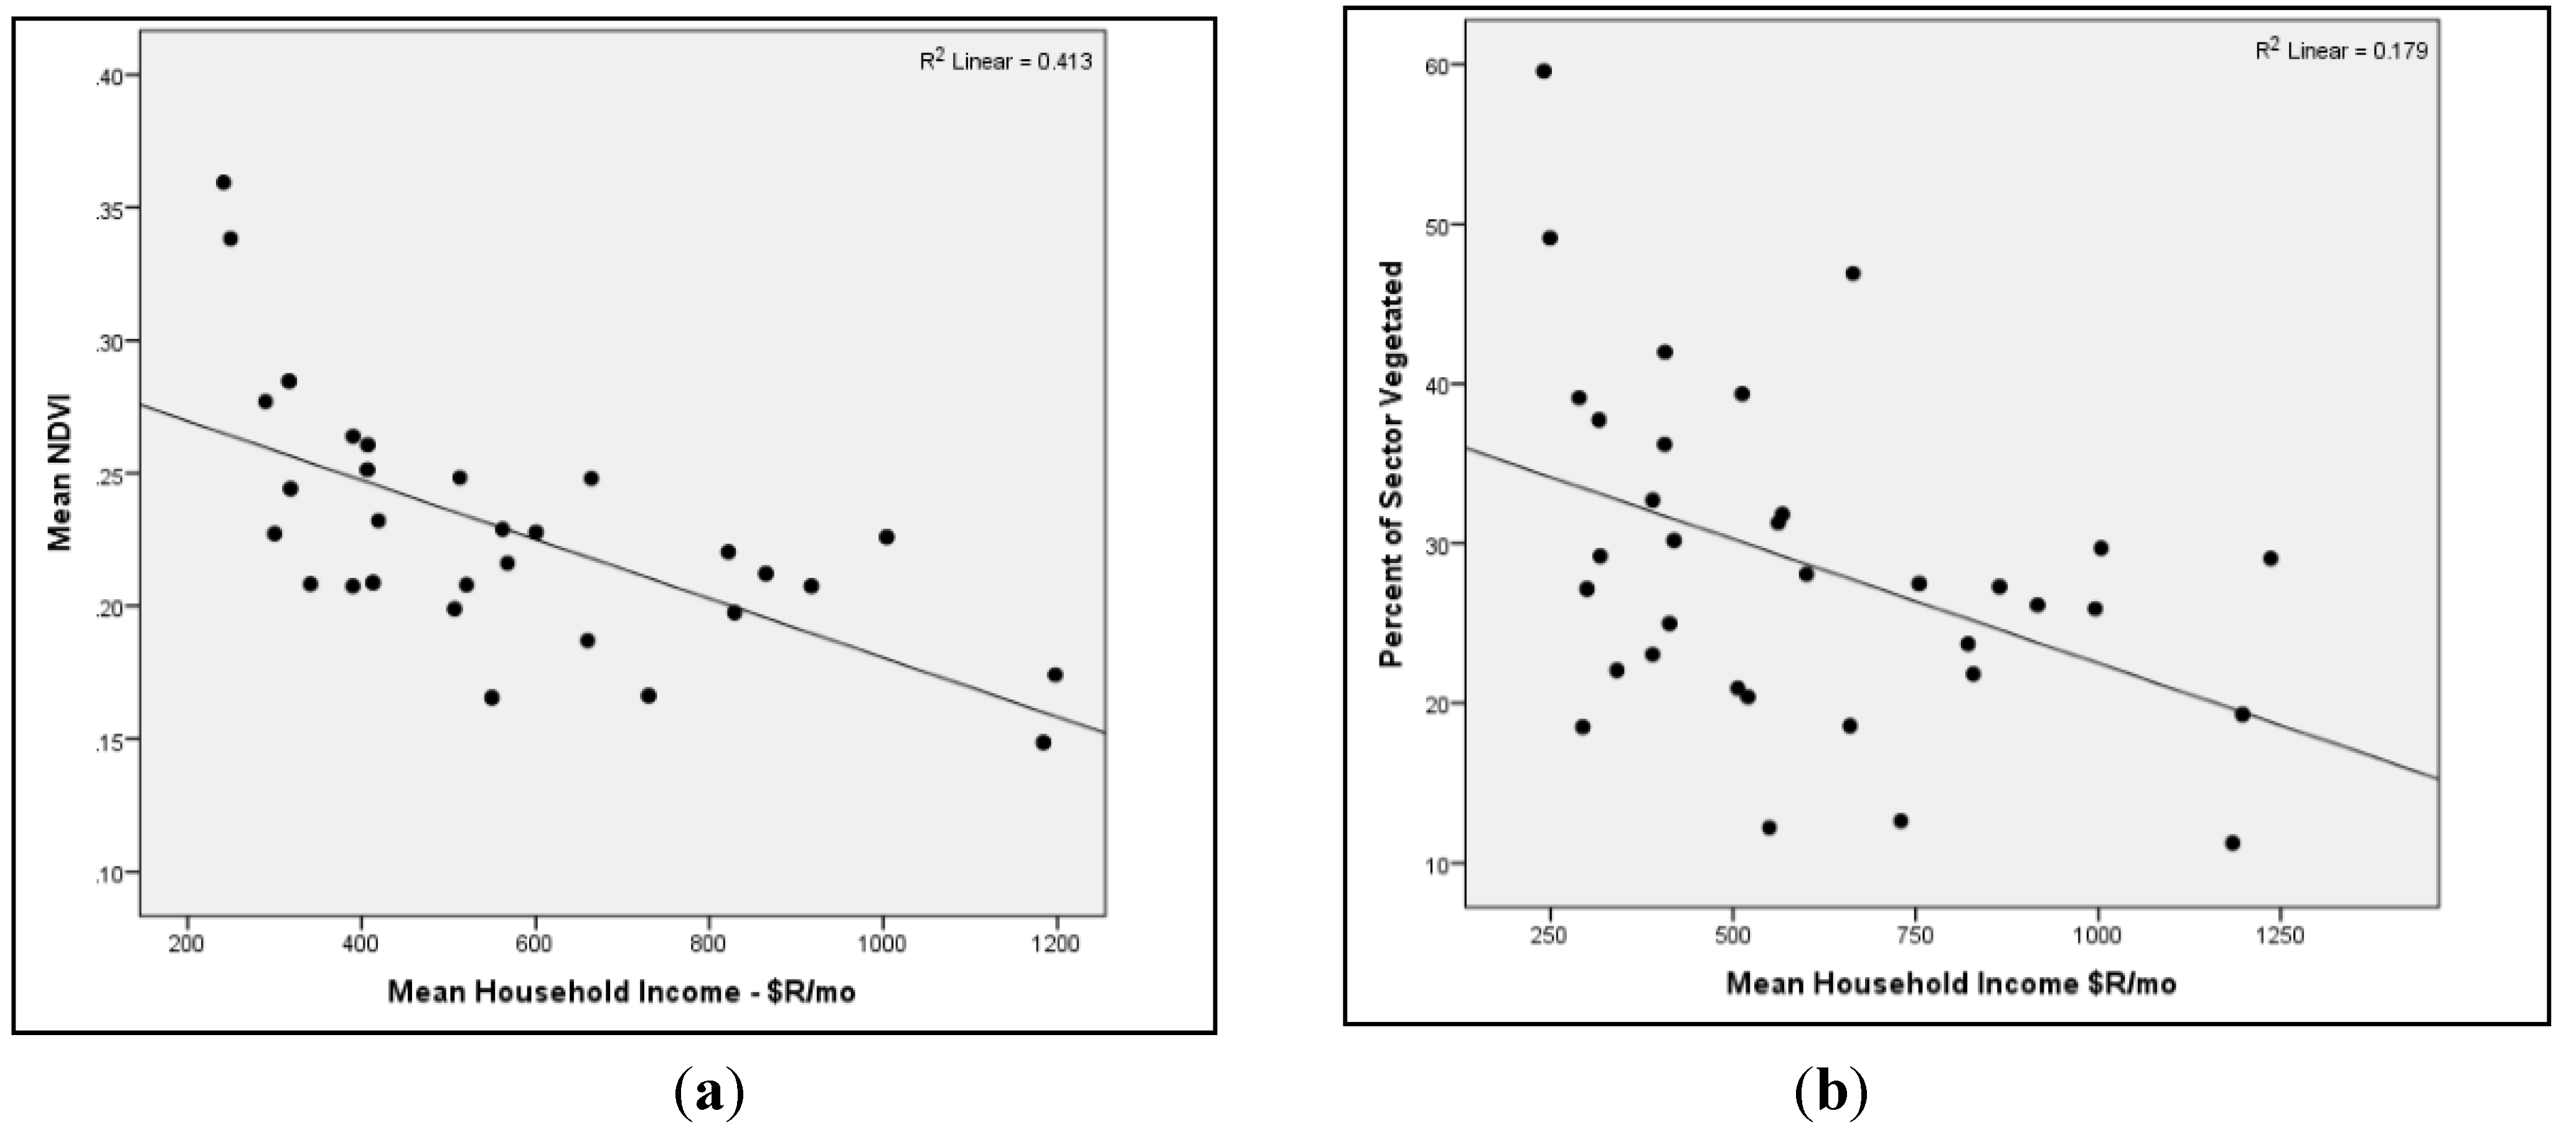
3.1. Exploratory Statistics


3.2. Multivariate Regression Model
| Coefficients | Mean (Std. Dev.) | Min | Max |
|---|---|---|---|
| Pct vegetative cover | 28.7 (10.5) | 11.2 | 59.6 |
| Households per ha | 22.3 (9.2) | 5.6 | 38.5 |
| Mean HH Income in R$ | 601.5 (285) | 241 | 1236.3 |
| Pct Water Piped | 23.8 (24.1) | 0 | 74.9 |
| Pct HH Owning | 70.8 (8.7) | 49 | 83.9 |
| Pct HH renting | 21.6 (7.8) | 8.1 | 45.1 |
| Coefficients | β | p |
|---|---|---|
| Constant | 100.083 | 0.0007 |
| Households per ha | −0.794 | <0.0005 |
| Mean HH Income | −0.025 | 0.001 |
| Pct Water Piped | 0.117 | 0.042 |
| Pct HH Owning | −0.414 | 0.294 |
| Pct HH renting | −0.614 | 0.168 |
| Urb Phase 1 (≤1970) | −2.117 | 0.517 |
| Urb Phase 3 (1985–1991) | 7.85 | 0.047 |
| Urb Phase 4 (1991–1996) | 9.066 | 0.081 |
| Urb Phase 2 (1970–1985) | Excluded Variable |
4. Discussion
5. Conclusions
Acknowledgments
Conflicts of Interest
References
- Vitousek, P.M.; Mooney, H.A.; Lubchenco, J.; Melillo, J. Human domination of Earth’s ecosystem. Science 1997, 277, 494–499. [Google Scholar] [CrossRef]
- Grimm, N.B.; Grove, J.M.; Pickett, S.T.; Redman, C.L. Integrated approaches to long-term studies of urban ecological systems. BioScience 2000, 50, 571–584. [Google Scholar] [CrossRef]
- Lambin, E.F.; Turner, B.L.; Geist, H.J.; Agbola, S.B.; Angelsen, A.; Bruce, J.W.; Coomes, O.T.; Dirzo, R.; Fischer, G.; Folke, C. The causes of land-use and land-cover change: Moving beyond the myths. Glob. Environ. Chang. 2001, 11, 261–269. [Google Scholar] [CrossRef]
- Lambin, E.F.; Geist, H.J.; Lepers, E. Dynamics of land-use and land-cover change in tropical regions. Annu. Rev. Environ. Resour. 2003, 28, 205–241. [Google Scholar] [CrossRef]
- McGranahan, G.; Satterthwaite, D. Urban Centers: An assessment of sustainability. Annu. Rev. Environ. Resour. 2003, 28, 243–274. [Google Scholar] [CrossRef]
- Munroe, D.K.; Croissant, C.; York, A.M. Land use policy and landscape fragmentation in an urbanizing region: Assessing the impact of zoning. Appl. Geogr. 2005, 25, 121–141. [Google Scholar] [CrossRef]
- Urbanization and Global Environmental Change—IHDP. Available online: http://www.ihdp.unu.edu/article/read/ugec-science-plan (accessed on 19 July 2013).
- Grey, G.; Deneke, F. Urban Forestry; Wiley: New York, NY, USA, 1986. [Google Scholar]
- Ulrich, R.S.; Simons, R.F.; Losito, B.D.; Fiorito, E.; Miles, M.A.; Zelson, M. Stress recovery during exposure to natural and urban environments. J. Environ. Psychol. 1991, 11, 201–230. [Google Scholar] [CrossRef]
- Hill, K. Design and Planning as Healing Arts: The Broader Context of Health and Environment. In Ecology and Design: Frameworks for Learning; Johnson, B.R., Hill, K., Eds.; Island Press: Washington, DC, USA, 2002; Volume 1, pp. 203–214. [Google Scholar]
- Heynen, N. The scalar production of injustice within the urban forest. Antipode 2003, 35, 980–998. [Google Scholar]
- Grove, J.; Troy, A.; O’Neil-Dunne, J.; Burch, W.R.; Cadenasso, M.; Pickett, S.T.A. Characterization of households and its implications for the vegetation of urban ecosystems. Ecosystems 2006, 9, 578–597. [Google Scholar] [CrossRef]
- Heynen, N.; Perkins, H.A.; Roy, P. The political ecology of uneven urban green space: The impact of political economy on race and ethnicity in producing environmental inequality in Milwaukee. Urban Aff. Rev. 2006, 42, 3–25. [Google Scholar] [CrossRef]
- Simon, D.; McGregor, D.; Nsiah-Gyabaah, K. The changing urban-rural interface of African cities: Definitional issues and an application to Kumasi, Ghana. Environ. Urban 2004, 16, 235–247. [Google Scholar]
- Aguilar, A.; Ward, P. Globalization, regional development, and megacity expansion in Latin America: Analyzing Mexico City’s peri-urban hinterland. Cities 2003, 20, 3–21. [Google Scholar] [CrossRef]
- Mbiba, B.; Huchzermeyer, M. Contentious development: Peri-urban studies in Sub-Saharan Africa. Prog. Dev. Stud. 2002, 2, 113–131. [Google Scholar] [CrossRef]
- Jackson, L.E. The relationship of urban design to human health and condition. Landsc. Urban Plan. 2003, 64, 191–200. [Google Scholar] [CrossRef]
- Grossmann, W.D. Integration of Social and Ecological Factors: Dynamic Area Models of Subtle Human Influences on Ecosystems. In Humans and Components of Ecosystems: The Ecology of Subtle Human Effects and Populated Areas; McDonnell, M.J., Pickett, S.T.A., Eds.; Springer-Verlag: New York, NY, USA, 2003; pp. 229–245. [Google Scholar]
- Tress, B.; Tress, G.; Decamps, H.; d’Hauteserre, A.-M. Bridging human and natural sciences in landscape research. Landsc. Urban Plan. 2001, 57, 137–141. [Google Scholar] [CrossRef]
- Madaleno, I. Urban agriculture in Belem, Brazil. Cities 2000, 17, 73–77. [Google Scholar] [CrossRef]
- Pauleit, S.; Duhme, F. Assessing the environmental performance of land cover types for urban planning. Landsc. Urban Plan. 2000, 52, 1–20. [Google Scholar] [CrossRef]
- Bolund, P.; Hunhammar, S. Ecosystem services in urban areas. Ecol. Econ. 1999, 29, 293–301. [Google Scholar] [CrossRef]
- Cities and the Environment; New Approaches to Eco-Cities; Inoguchi, T.; Newman, E.; Paoletti, G. (Eds.) United Nations University Press: Tokyo, Japan/New York, NY, USA, 1999.
- Roseland, M. Dimensions of the eco-city. Cities 1997, 14, 125–139. [Google Scholar] [CrossRef]
- Vliet, W.V. Cities in a globalizing world: From engines of growth to agents of change. Environ. Urban 2002, 14, 31–40. [Google Scholar] [CrossRef]
- United Nations Population Fund. Introduction and Chapter 1. The Promise of Urban Growth. State of World Population 2007; Online Report. United Nations Population Fund. Available online: http://www.unfpa.org/swp/2007/english/ introduction.html (accessed on 26 April 2013).
- Urban Population-Data-Table. Available online: http://data.worldbank.org/indicator/SP.URB.TOTL (accessed on 28 August 2013).
- Panel on Urban Population Dynamics; Montgomery, M.R.; Stren, R.; Cohen, B.; Reed, H.E. Cities Transformed: Demographic Change and Its Implications in the Developing World; National Academy Press: Washington, DC, USA, 2003. [Google Scholar]
- United Nations Centre for Human Settlements (Habitat) (UNCHS-Habitat). The State of the World Cities Report 2001; UN-Habitat: New York, NY, USA, 2001.
- Land, Rights and Innovation: Improving Tenure Security for the Urban Poor; Payne, G. (Ed.) ITDG Publishing: London, UK, 2002.
- Rakodi, C. Economic Development, Urbanization and Poverty. In Urban Livelihoods. A People-Centered Approach to Reducing Poverty; Rakodi, C., Lloyd-Jones, T., Eds.; Earthscan: London, UK, 2002. [Google Scholar]
- World Bank. Poverty Reduction and the World Bank: Progress in Fiscal 2000 and 2001; World Bank: Washington, DC, USA, 2001. [Google Scholar]
- Nowak, D.J. Atmospheric carbon reduction by urban trees. J. Environ. Manag. 1993, 17, 275–269. [Google Scholar]
- Oke, T.R. The micrometeorology of the urban forest. Philos. Trans. R. Soc. Lond. B 1989, 324, 335–349. [Google Scholar] [CrossRef]
- Nowak, D.J. Air Pollution Removal by Chicago’s Urban Forest. In Chicago’s Urban Forest Ecosystem: Results of the Chicago Urban Climate Project; McPherson, E.G., Nowak, D.J., Rowntree, R.A., Eds.; USDA GTR-NE-186; Northeastern Forest Experiment Station: Radnor, PA, USA, 1994; pp. 63–81. [Google Scholar]
- Cook, D.I. Trees, Solid Barriers, and Combinations: Alternatives for Noise Control. In Proceedings of the National Urban Forestry Conference; Hopkins, G., Ed.; USDA Forest Service/College of Environmental Science and Forestry, The State University of New York: Syracuse, NY, USA, 1978; pp. 330–339. [Google Scholar]
- Sanders, R.A. Urban vegetation impacts on the hydrology of Dayton, Ohio. Urban Ecol. 1986, 9, 361–376. [Google Scholar]
- Breuste, J.; Feldmann, H.; Uhlmann, O. Urban Ecology; Springer-Verlag: Berlin, Germany, 1998. [Google Scholar]
- Hough, M. City Form and Natural Process; Routledge: London, UK, 1989. [Google Scholar]
- Randolph, J. Environmental Land Use and Management; Island Press: Washington, DC, USA, 2004. [Google Scholar]
- Kuo, F.E.; Bacaicoa, M.; Sullivan, W.C. Transforming inner-city landscapes trees, sense of safety, and preference. Environ. Behav. 1998, 30, 29–59. [Google Scholar]
- Sullivan, W.C.; Kuo, F.E. Do Trees Strengthen Urban Communities, Reduce Domestic Violence? In Urban and Community Forestry Assistance Program Technology Bulletin No. 4; US Department of Agriculture, Forest Service: Southern Region, Atlanta, GA, USA, 1996. [Google Scholar]
- Ulrich, R. View through a window may influence recovery from surgery. Science 1984, 224, 420–421. [Google Scholar]
- Wells, N.M. At home with nature: Effects of “greenness” on children’s cognitive functioning. Environ. Behav. 2000, 32, 775–795. [Google Scholar] [CrossRef]
- Schroeder, H.W. Preference and meaning of arboretum landscapes: Combining quantitative and qualitative data. J. Environ. Psychol. 1989, 11, 231–248. [Google Scholar] [CrossRef]
- Kweon, B.S.; Sullivan, W.C.; Wiley, A.R. Green common spaces and the social integration of inner-city older adults. Environ. Behav. 1998, 30, 832–858. [Google Scholar] [CrossRef]
- Agarwal, C.; Green, G.M.; Grove, J.M.; Evans, T.; Schweik, C.M. A Review and Assessment of Land-Use Change Models. Dynamics of Space, Time, and Human Choice; Gen. Tech. Rep. NE-297; US Department of Agriculture, Forest Service, Northeastern Research Station: Newtown Square, PA, USA, 2002; p. 61. Available online: http://www.nrs.fs.fed.us/pubs/gtr/gtr_ne297.pdf (accessed on 28 August 2013).
- Logan, J.R.; Molotch, H.L. Urban Fortunes: The Political Economy of Place; University of California Press: Los Angeles, CA, USA, 1987. [Google Scholar]
- Heynen, N. Green urban political ecologies: Toward a better understanding of inner-city environmental change. Environ. Plan. A 2006, 38, 499–516. [Google Scholar] [CrossRef]
- Pedlowski, M.A.; Da Silva, V.A.C.; Adell, J.J.C.; Heynen, N.C. Urban forest and environmental inequality in Campos dos Goytacazes, Rio de Janeiro, Brazil. Urban Ecosyst. 2002, 6, 9–20. [Google Scholar]
- WinklerPrins, A.M.G.A. House-lot gardens in Santarém, Pará, Brazil: Linking rural with urban. Urban Ecosyst. 2002, 6, 43–65. [Google Scholar] [CrossRef]
- Padoch, C.; Brondızio, E.; Costa, S.; Pinedo-Vasquez, M.; Sears, R.R.; Siqueira, A. Urban forest and rural cities: Multi-sited households, consumption patterns, and forest resources in Amazonia. Ecol. Soc. 2008, 13. Available online: http://www.ecologyandsociety.org/vol13/iss2/art2/ (accessed on 28 August 2013). [Google Scholar]
- Guedes, G.; Costa, S.; Brondízio, E. Revisiting the hierarchy of urban areas in the Brazilian Amazon: A multilevel approach. Popul. Environ. 2009, 30, 159–192. [Google Scholar] [CrossRef]
- Moran, E.F. Developing the Amazon; Indiana University Press: Bloomington, IN, USA, 1981. [Google Scholar]
- Instituto Brasileiro de Geografia e Estatística. Censo Demográfico 2000; Agregado de Setores Censitários dos Resultados do Universo; Documentação dos Arquivos de Dados; Instituto Brasileiro de Geografia e Estatística: Rio de Janeiro, Brazil, 2002. [Google Scholar]
- Instituto Brasileiro de Geografia e Estatística. Censo Demográfico 2010. Resultados do Universo—Características da População e dos Domicílios. Available online: http://www.sidra.ibge.gov.br/bda/tabela/listabl.asp?c=1378&z=cd&o=5 (accessed on 28 August 2013).
- IBGE-Cidades@-Pará-Altamira. Available online: http://www.ibge.gov.br/cidadesat/xtras/perfil.php?codmun=150060&search=para|altamira (accessed on 28 August 2013).
- Moran, E. Field Notes at Altamira PA, Brazil, 2013; Unpublished Note.
- ERDAS IMAGINE 2010 v10.1, Intergraph-Geospatial Operations: Norcross, GA, USA.
- Lu, D.; Hetrick, S.; Moran, E. Land cover classification in a complex urban-rural landscape with QuickBird imagery. Photogramm. Eng. Remote. Sens. 2010, 76, 1159–1168. [Google Scholar] [CrossRef]
- Foody, G.M. Status of land cover classification accuracy assessment. Remote Sens. Environ. 2002, 80, 185–201. [Google Scholar] [CrossRef]
- Whitney, G.; Adams, D. Man as a maker of new plant communities. J. Appl. Ecol. 1980, 17, 431–448. [Google Scholar] [CrossRef]
- Hope, D.; Gries, C.; Zhu, W.; Fagan, W.F.; Redman, C.L.; Grimm, N.B.; Nelson, A.L.; Martin, C.; Kinzig, A. Socioeconomics drive urban plant diversity. Proc. Natl. Acad. Sci. USA 2003, 100, 8788–8792. [Google Scholar] [CrossRef]
- Martin, C.A.; Warren, P.S.; Kinzig, A.P. Neighborhood socioeconomic status is a useful predictor of perennial landscape vegetation in small parks surrounding residential neighborhoods in Phoenix, Arizona. Landsc. Urban Plan. 2004, 69, 355–368. [Google Scholar] [CrossRef]
- Costa, S.M.; Brondizio, E.S. Inter-urban dependency among Amazonian cities: Urban growth, infrastructure deficiencies, and socio-demographic networks. REDES 2009, 14, 211–234. [Google Scholar]
© 2013 by the authors; licensee MDPI, Basel, Switzerland. This article is an open access article distributed under the terms and conditions of the Creative Commons Attribution license (http://creativecommons.org/licenses/by/3.0/).
Share and Cite
Hetrick, S.; Roy Chowdhury, R.; Brondizio, E.; Moran, E. Spatiotemporal Patterns and Socioeconomic Contexts of Vegetative Cover in Altamira City, Brazil. Land 2013, 2, 774-796. https://doi.org/10.3390/land2040774
Hetrick S, Roy Chowdhury R, Brondizio E, Moran E. Spatiotemporal Patterns and Socioeconomic Contexts of Vegetative Cover in Altamira City, Brazil. Land. 2013; 2(4):774-796. https://doi.org/10.3390/land2040774
Chicago/Turabian StyleHetrick, Scott, Rinku Roy Chowdhury, Eduardo Brondizio, and Emilio Moran. 2013. "Spatiotemporal Patterns and Socioeconomic Contexts of Vegetative Cover in Altamira City, Brazil" Land 2, no. 4: 774-796. https://doi.org/10.3390/land2040774
APA StyleHetrick, S., Roy Chowdhury, R., Brondizio, E., & Moran, E. (2013). Spatiotemporal Patterns and Socioeconomic Contexts of Vegetative Cover in Altamira City, Brazil. Land, 2(4), 774-796. https://doi.org/10.3390/land2040774