

Investigation of Model Uncertainty in Rainfall-Induced Landslide Prediction under Changing Climate Conditions
1
Key Laboratory of VGE of Ministry of Education, Nanjing Normal University, Nanjing 210023, China
2
Department of Civil Engineering, University of Bristol, Bristol BS8 1TR, UK
*
Author to whom correspondence should be addressed.
Land 2023, 12(9), 1732; https://doi.org/10.3390/land12091732
Submission received: 2 August 2023
/
Revised: 21 August 2023
/
Accepted: 30 August 2023
/
Published: 6 September 2023
(This article belongs to the Special Issue Land, Geosciences Research and Application)
Abstract
:Climate change can exacerbate the occurrence of extreme precipitation events, thereby affecting both the frequency and intensity of rainfall-induced landslides. It is important to study the threat of rainfall-induced landslides under future climate conditions for the formulation of disaster prevention and mitigation policies. Due to the complexity of the climate system, there is great uncertainty in the climate variables simulated by a global climate model (GCM), which will be further propagated in landslide prediction. In this study, we investigate the spatial and temporal trends of future landslide hazards in China under climate change, using data from a multi-model ensemble of GCMs based on two scenarios, RCP4.5 and RCP8.5. The uncertainty characteristics are then estimated based on signal-to-noise ratios (SNRs) and the ratio of agreement in sign (RAS). The results show that the uncertainty of landslide prediction is mainly dominated by the GCM ensemble and the RCP scenario settings. Spatially, the uncertainty of landslide prediction is high in the western areas of China and low in the eastern areas of China. Temporally, the uncertainty of landslide prediction is evolving, with characteristics of high uncertainty in the near future and characteristics of low uncertainty in the distant future. The annual average SNRs in the 21st century are 0.44 and 0.50 in RCP4.5 and RCP8.5, respectively, and the RAS of landslide prediction in Southeastern China is only 50–60%. This indicates that more than half of the patterns show trends that are opposite to those of the ensemble, suggesting that their landslide change trends are not universally recognized in the pattern ensemble. Considering the uncertainty of climate change in landslide prediction can enable studies to provide a more comprehensive picture of the possible range of future landslide changes, effectively improving the reliability of landslide hazard prediction and disaster prevention.
1. Introduction
In recent years, increasing temperature has led to increased frequency and intensity of extreme events, which has indirectly given rise to a variety of natural hazards, posing multiple risks for ecosystems and for human societies. Among these extreme events, the occurrence of rainfall-induced landslides is extremely dependent on climatic conditions. Rainfall-induced landslides are among the most common and significant hazards caused by climate change.
There have been many studies on the effects of climate change on landslides. For example, Maraun et al. [1] studied potential severe landslide events in the Alpine foreland under climate and land-use change, and Araújo et al. [2] investigated the impact of extreme rainfall events on landslide activity in Portugal under climate change scenarios. Pei Y. et al. [3] investigated the role of elevation in landslide activity induced by climate change in the eastern Pamir Mountains.
Landslides pose a great threat to the safety of people and property [4,5]. According to statistics from the China National Geological Disaster Bulletin, a total of 200,000 geological disasters occurred from 2007 to 2020, 66.31% of which were landslides. These disasters led to 8170 deaths or missing persons and 3850 injuries. The direct economic losses reached CNY 60.51 billion.
Ninety percent of the landslides in China are triggered by heavy or prolonged rainfall [6]. Although landslides can be triggered by a variety of other factors, including earthquakes, snow and ice melt, volcanic activity, and human activities, rainfall-induced landslides continue to be a primary cause. Research on the spatial and temporal predictions of rainfall-induced landslide hazards can significantly reduce their adverse effects and improve the effectiveness of policymaking aimed at disaster prevention and mitigation. Accordingly, such research is of great scientific significance and practical value.
Climate change, represented by increasing temperatures, leads to increases in the atmospheric saturated water pressure and water vapor content [7,8]. These phenomena not only accelerate worldwide water cycle processes, but also exacerbate the occurrence of extreme precipitation events [9,10,11]. Furthermore, rising temperatures affect soil water saturation, causing the infiltration rate of rainfall into slopes to exceed the drainage rate of the slopes. This leads to a critical water content level that triggers landslides [12,13]. In addition, changes in rainfall can indirectly alter environmental and landscape conditions, including land cover types and land use status. Such changes can affect the stability of surface slopes, as well as the type, number, and frequency of landslides [14].
Studies on the response of landslide hazards to climate change have been conducted using global climate models (GCMs) developed by various countries and institutions to assess the possible impacts of climate change on the spatial and temporal distributions of future landslides [15,16,17]. Many studies have predicted changes in rainfall-induced landslides under different climate scenarios [18,19]. Related studies have also demonstrated non-stationary changes in rainfall-triggering thresholds and landslide susceptibility under future climate change scenarios [20,21].
However, climate predictions based on climate models are subject to large uncertainties arising from two main sources: future emission scenarios and climate model structures [22]. Instead of relying solely on a climate model, it is common to use a variety of plausible emission projection scenarios, as it is challenging to simulate the trajectory of future greenhouse gas (GHG) emissions, given the many possible political and economic developments [23].
In terms of climate model structures, cloud microphysical and energy exchange processes are often simplified in climate models due to limited human knowledge of the natural climate system. The structural and physical parameters of climate models represent additional sources of uncertainty [22].
These uncertainties could potentially affect the prediction of future landslides. According to Kim et al. [24], the probability of landslide occurrence, as well as the size of the hazard area, varies under distinct emission scenarios. Ciabatta et al. [25] used five GCMs to drive the PRESSCA early warning system in predicting the quantity of expected future landslides. They discovered noteworthy variations in the projections of the diverse models, suggesting that the choice of GCM may have a momentous impact on the projections. Therefore, it is necessary to consider the uncertainties associated with different emission scenarios and different climate patterns while conducting research on the impacts of climate change on landslides. In this way, the uncertainties in landslide prediction can be minimized and a comprehensive understanding of future landslide progression can be achieved.
This study applied a multi-model ensemble simulation method to explore climate change impacts on rainfall-induced landslides in China. We analyzed the impact of climate change on the spatial and temporal distribution of rainfall-induced landslides and their uncertainties by constructing a landslide hazard susceptibility model to predict the possible range and extent of future landslides. First, we processed CMIP5 GCMs with bias correction and spatial disaggregation, and then validated them with CHIRPS. Then, we constructed a landslide hazard susceptibility model to analyze the characteristics of landslide hazard changes in the 21st century under climate change. Based on our study, we quantitatively reveal the overall uncertainty characteristics of future landslide prediction and provide an intuitive and detailed picture of the changes in the distribution of rainfall-induced landslides in China in the future under different climate change scenarios.
2. Data and Methodology
Our study constructs a model for determining susceptibility to landslide hazards. This model allows for the analysis of changes in landslide hazard under the influence of climate change in the 21st century. In this assessment model, the uncertainty in the prediction process can be calculated. The methodological framework of this study is shown in Figure 1.
2.1. Data Sources
CHIRPS is a precipitation dataset developed by the U.S. Geological Survey (USGS) and the Climate Hazard Group at the University of California. This dataset combines precipitation climatology, synoptic thermal infrared observations, and ground station observations (http://chg.geog.ucsb.edu/data/chirps/, accessed on 4 May 2022). It covers multiple spatial and temporal scales (0.05–0.25°, day–month), quasi-global coverage (50° S–50° N), and a long record period (1981–present). In this study, CHIRPS daily precipitation data at 0.05° spatial resolution for China from 1981 to 2020 are used to validate the performance of the bias correction.
In order to gain insights into the possible temporal and spatial changes in China’s future climate and its uncertainty characteristics, the CMIP5 multi-model dataset is used in this study (Table 1). The 16 selected models in this collection are representative in terms of operational mechanisms, physical parameterization processes, and resolution in their design. This dataset includes the daily precipitation data output from 16 GCMs. The climate change scenarios use Representative Concentration Pathways (RCPs), which are based on the radiative forcing of the atmosphere by greenhouse gases. Two emission scenarios (RCP4.5 and RCP8.5) are used in this study to investigate the trend of landslide hazard changes in China under the moderate emission scenario compared with the high-emission scenario. The 1981–2005 period is selected as the historical period (base period), while the 2011–2100 period is selected as the future period, in which the 2011–2040 period is set as the medium future, the 2041–2070 period is set as the mid-future period, and the 2071–2100 period is set as the far future.
Five environmental factors including slope, distance to fracture zones, geology, roads, and forest loss were combined into a fuzzy superposition model by Stanley T et al. [26], resulting in a 1 km global landslide susceptibility map. The combination of multiple influencing factors through a heuristic approach leads to landslides and provides a susceptibility map with high accuracy.
The validation data for the effectiveness of landslide prediction is based on the Global Landslide Catalog (GLC), which spans the 2006–2020 period. It should be noted, however, that the database contains fewer landslide occurrences than those that actually transpired. Only landslides that occur in densely populated areas and those that are highly destructive and cause a large number of casualties and property losses are more likely to be recorded. In contrast, landslides in sparsely populated areas are often difficult to detect [27]. As a result, landslides in areas such as the Tibetan Plateau and Northwestern China are very poorly recorded.
2.2. Bias Correction and Spatial Disaggregation of GCMs
Global climate models (GCMs) tend to have systematic biases in their output. It was observed that climate models frequently overestimate rainy days and tend to underestimate precipitation extremes [28,29]. In some cases, errors occur in the timing of the monsoon or the amount of seasonal precipitation, or temperatures may be consistently too high or too low [30,31]. The use of uncorrected outputs in impact models or climate impact assessments can lead to unrealistic results. Therefore, a systematic bias correction was performed prior to conducting further analyses.
The bias of the GCM data makes them difficult to use to directly predict future climate change projections. The Quantile Delta Mapping (QDM) method is used to correct the bias in the precipitation data output from the GCM. QDM is based on the assumption that climate model biases transition smoothly into the future while preserving the characteristics of the historical periods. We therefore proceed as follows. First, the simulated precipitation is substituted into the inverse function of the observed precipitation distribution function to correct for systematic bias. Then, the relative change in the quantile is calculated between the historical period and the future period. Finally, the two values are multiplied to obtain the bias-corrected model precipitation values. Thus, the QDM corrects the systematic bias of the model relative to the observations while preserving the relative change in the model projection [32]. Due to the large intra-annual and monthly variability of precipitation in China, a monthly bias correction method is used to correct the precipitation data and to more accurately correct the simulated data. The specific calculation formulae are as follows:
where and represent the observed and simulated rainfall in the historical period and future period, respectively. and denote the model cumulative distribution functions for the historical and future periods, respectively. is the detrended simulated rainfall in the future period, is the trend prediction of the model, and stands for the bias-corrected rainfall for the future period.
The spatial disaggregation (SD) method is chosen to downscale the bias-corrected patterns, aligning the pattern resolution with the observed resolution (0.05° × 0.05°). This is necessary because the resolution of simulated precipitation from the GCM is significantly different from the observed precipitation. The resolution also varies among the models. First, we calculate the monthly mean rainfall of each model with the measured precipitation. Second, we divide the monthly mean precipitation of each model with the measured precipitation separately to obtain the “correction scale correction factor” and then interpolate it to a resolution of 0.05° × 0.05°. Finally, we interpolate the GCM at the original resolution and multiply it by the bias correction factor to obtain the downscaled GCM [33,34].
2.3. LHASA Model
The Landslide Hazard Assessment for Situational Awareness (LHASA) model was developed at NASA’s Goddard Space Flight Center to identify potential landslide hazards and provide near real-time situational awareness of landslide hazards [35]. Many studies have used the output of the LHASA model as an approximation of landslide hazard, highlighting areas that are vulnerable to rainfall-induced landslide hazards [36,37]. The model consists of two components: predisposing factors and static variables that can lead to slope destabilization. The probability of slope destabilization is represented by a landslide susceptibility map derived from five factors (slope, fault, geology, road, and forest), using a fuzzy overlay algorithm and categorizing the susceptibility values into low, moderate, and high. Low susceptibility indicates a low probability of landslides in the area, whereas high susceptibility indicates a high probability of landslides. Typically, areas of moderate to high susceptibility are found in regions with rugged topography, strong tectonic activity, and frequent human activity.
Landslide triggering factors are represented dynamically by the Antecedent Rainfall Index (ARI). The ARI is the weighted average of recent rainfall. The formulas are as follows:
where is the previous days, is the rainfall of the previous days, and stands for the weight of the rainfall of the previous days.
In this study, the 7-day preceding precipitation index is calculated for the 1981–2005 period to obtain a continuous dataset. The 95th percentile of the historical ARI is taken as the ARI threshold. By comparing the ARI value with the ARI threshold, it is possible to determine whether an extreme rainfall event has occurred in the region.
The decision-making process of the LHASA model is as follows. First, the ARI of the region for the previous 7 days is calculated and compared with the ARI thresholds. If the ARI is below the historical threshold, an extreme rainfall warning is not issued. Only if the ARI is above the historical threshold will susceptibility maps be considered further. Low susceptibility areas, with a low probability of landslide occurrence, do not receive a hazard warning. Similarly, moderate susceptibility results in a moderate hazard warning and high susceptibility results in a high hazard warning.
2.4. Uncertainty Analysis Method
To quantify the variability within the climate model ensemble, this study assesses the uncertainty in predicting future changes in landslide hazard. This is accomplished by evaluating the signal-to-noise ratio (SNR) and the ratio of agreement in sign (RAS) among the ensemble members [38]. The SNR characterizes the uncertainty in the future value of the changed quantity (variability uncertainty), while the RAS characterizes the uncertainty in the future positive and negative changes (increase/decrease uncertainty).
The signal-to-noise ratio is the ratio between the climate change signal and the cli-mate variability. The climate change signal is the absolute value of the relative change in landslide risk in different future periods relative to the reference period (M). The climate fluctuation is quantified by the standard deviation (Std) of the predicted landslide risk from different ensemble members of the GCMs [39]. Here, we choose the standard deviation of the predicted landslide hazard of the GCM ensemble members as the noise, which is calculated as follows:
where is different periods in the future, stands for different ensemble members, is the total number of ensemble members, and stands for the relative amount of change predicted for each pool member at different future periods relative to the base period. An SNR greater than 1 indicates that the climate change signal is greater than the natural internal variability of the climate system, at which point the uncertainty in the future predictions of the pool members is small enough to pass the SNR test.
The ratio of agreement in sign refers to the proportion of the total number of pool members whose predicted relative change in landslides is consistent with the average predicted relative change in landslides in the pool. Tebaldi et al. [40] argued that only when the ratio of agreement in sign is greater than 80% can it reflect the main trend in landslide hazard change, defined as passing the RAS test.
3. Results
3.1. GCM Rainfall Downscaling and Validation
Due to the large number and complexity of climate types in China, this study follows the method of Wang et al. [41] and divides China into seven subregions based on the similarity in regional climates. We divide China into Northeastern China (NEC), Northern China (NC), Southeastern China (SEC), Southwestern China (SWC), the east of Northwestern China (ENWC), the west of Northwestern China (WNWC), and the Tibet region of China (TC) (Figure 2) in order to analyze the climatic variability among regions.
To validate the downscaling results of the GCMs for the seven subregions under the two climate scenarios, we compared the monthly mean precipitation data from CHIRPS with the monthly mean precipitation produced by the 16 bias-corrected GCMs for the 2006−2020 period. As shown in Figure 3, although there are some differences between various GCMs, all GCMs after bias correction and downscaling are generally able to accurately characterize more precipitation in summer and less precipitation in winter. In particular, the mean of the GCM ensemble is in good agreement with the measured precipitation, which largely corrects the output bias of the GCM. In addition, the differences in precipitation between different subregions are well reproduced. High precipitation values are mainly found in the SEC and SWC, up to 200 mm or more in July. The ENWC and WNWC have lower precipitation values. However, for high rainfall areas such as the SEC and NC, precipitation is significantly underestimated in the period of June to October, while it shows some overestimation in the period of February to May. In regions with low precipitation like the WNWC and TC, there is an overestimation of precipitation throughout the year. This may be due to the fact that the QDM method has some deficiencies in the correction of extremes, leading to an underestimation in areas with more rainfall and an overestimation in areas with less rainfall; however, these biases are not notable. In general, the QDM bias correction method and the SD downscaling method can provide a more accurate rainfall forecast for China.
3.2. Changes in Future Landslide Hazards in China
Figure 4 demonstrates the relative change in the number of days when the ARI exceeds the historical threshold in (a) moderately and (b) highly susceptible areas in China in different future periods compared to the base period. Both Figure 4a,b show a general increase in the number of days with potential landslide disasters in China in the 21st century, and the spatial distribution characteristics of the relative changes in moderately and highly susceptible areas are similar.
At the beginning of the 21st century, most regions experienced an increase in relative change lower than 15%. However, areas such as the Tibetan Plateau, which borders the WNWC, have shown increases of over 80%. A few parts of the southwestern and southeastern regions exhibit decreasing trends in landslide hazards. Although there is not a significant difference in decreases between RCP4.5 and RCP8.5, the latter displays widespread decreases in many regions. In the mid-21st century, an upward trend in landslide hazards was observed in the Southwest and Southeast regions, with a 10% increase as compared to historical periods. Notably, the Tibetan Plateau region shows the highest increase, with a slightly higher increase under RCP8.5 than RCP4.5. Towards the end of the century, significant increases were observed under RCP8.5. Alternatively, under RCP4.5, the eastern and western regions depicted increases of approximately 15−20% and 40−60%, respectively. Under the RCP8.5 scenario, there was a projected increase of 20–40% in landslide risk in the eastern region, with a higher projected increase of 80–100% in the western region and more than 100% in most areas of the Tibetan Plateau. China displays a topographical feature of increasing elevation from the east to the west of the country. The higher landslide risk in the western region can be attributed to the presence of more mountainous areas. The increase in the susceptibility of landslides raises the potential risk of loss, particularly in the SWC, SEC, and NC, where nearly one billion people and the most developed regions are situated. This highlights the necessity for a comprehensive monitoring network and an early warning system.
Figure 5 shows the forecasted days of landslide disasters for each season in each subregion at different stages of the 21st century and the average increase relative to the base period. The model-predicted landslide hazards show more occurrences during the summer and fewer occurrences during the winter, with the forecasted days of landslide disasters reaching 10–15 days in the summer. The average increase in forecasted days under the RCP4.5 scenario is 1–3 days in the spring and summer. The absolute and percentile increases in the fall amount to 1 day and 20%, respectively. The percentages of increases in the forecasted days in the spring, summer, fall, and winter under the RCP8.5 scenario are 50%, 10%, 30%, and 100%, respectively, so the increases in the forecasted days of extreme rainfall in the spring and fall are greater under RCP8.5 than under RCP4.5.
When comparing the seasonal changes among the subregions, it is apparent that landslide hazards in the early 21st century have slightly decreased in the southeastern and southwestern regions during the summer. The largest relative increases in summer precipitation (about 20%) occurred in the WNWC and the TC. The increase reaches 35% in the TC under the RCP8.5 scenario, while the rest of the region has an increase of only about 10%. The subregion with the largest increase in forecasted days in winter is located in the SWC, with an absolute increase of 2 days under RCP4.5, and an increase of 3 days under RCP8.5. The numbers of forecasted days in the spring and fall show significant increases in all subregions of China, except for the SEC and SWC. The relative amount of change in landslides in the spring and fall is in the range of 10–20%. The number of forecasted days in the fall is slightly less compared to that in the spring, but still increased by about 30%. There is little difference in the increase in extreme precipitation across varying GHG concentrations, followed by a larger increase in the RCP8.5 scenario and a substantial increase in forecasted days.
3.3. Uncertainty Analysis of Rainfall-Induced Landslide Prediction
Table 2 shows the RAS and multi-year SNR average for various time periods in China, including each subregion. The annual average numbers of forecasted days in the next 100 years of all subregions of China predicted via the multi-model ensemble show an increasing trend, with a linear increase of about 0.43 days/10a for the whole country under the RCP4.5 scenario and an increase of 0.67 days/10a under the RCP8.5 scenario. The Tibetan Plateau and the southwestern region have the highest increasing trends, with increases of 0.78 and 1.53 days/10a in the Tibetan Plateau and 0.53 and 0.76 days/10a in the southwestern region under the two climate scenarios. Conversely, the smallest increase is observed in the northern region, which experiences an increase of 0.36 and 0.58 days/10a under the two climate scenarios.
From the comparison of the GCM ensembles, all 16 models agree that the number of future potential landslide disasters in China is on an upward trend, but the magnitude of the interannual changes between the different models are significantly different. The SNR of the relative change in the number of forecasted landslide days in China is less than 1 in the 21st century, indicating that the magnitude of change in the landslide hazard is much smaller than the internal natural variability of the climate system. This further implies that a large uncertainty exists in the prediction of landslide hazard. The RAS values of the two scenarios are 59.11% and 61.15%, respectively, which means they do not pass the RAS test and present large uncertainties in the positive and negative trends of landslide prediction. Despite the fact that neither the SNR nor the RAS pass the test, they steadily increase over time. Moreover, the consistency of the model-predicted hazard change magnitude and the direction of positive and negative trends are gradually strengthened.
For each subregion, the SNR values exhibit a notable rise over time. Of all the subregions, the WNWC region reports the highest average SNR annually, with 0.62 and 0.7 for the two scenarios. It indicates that the multi-model ensemble predicts the least discrepancy in the number of forecasting landslides in this region compared to the other areas, with minimal uncertainty. Except for the WNWC region, the SNRs in the remaining regions are mainly between 0.2 and 0.3 in the early 21st century. Although the climate system has significant natural internal variability, the average SNRs increase significantly in the mid-to-late 21st century. By the late 21st century, under the RCP4.5 scenario, coastal regions with higher precipitation, along with the NEC and SWC regions, may have SNRs of approximately 0.5. Compared to wetter regions, the SNR experiences a more substantial increase in the mid-to-late 21st century in the ENWC and the Tibetan Plateau region. In the late RCP8.5 scenario, the SNR in the WNWC is approximately 0.8, while in the Tibetan Plateau region, it is approximately 1. The results from the RAS test demonstrates that the WNWC region has the best results in the late 21st century under the RCP8.5 scenario; it can pass the RAS test in most instances. The model simulation shows consistent positive and negative changes. The ENWC region passes the test in the late 21st century within a few years. Furthermore, no other regions have an RAS exceeding 80%. A distinct trend of increased agreement over time also appears, as the later part of the 21st century shows greater agreement than the early part. There are certain regions and time periods that exhibit improved congruence in patterns. However, generally speaking, multi-modal assemblages still contain a significant amount of uncertainty in terms of positive and negative predictions, as well as in the variability.
When comparing the results of the SNR and the RAS tests under the two climate change scenarios, it can be found that the vast majority of regions exhibit lower SNR and RAS values under the RCP4.5 scenario than under the RCP8.5 scenario. This suggests that there is a greater degree of uncertainty in the prediction of landslide hazard under the RCP4.5 scenario. The potential explanation is that the scenarios with high carbon emission concentrations are generally recognized as having a greater degree of consistency in the frequency of extreme precipitation in the future. Nonetheless, the trend of extreme precipitation in the future is more contentious for scenarios with moderate carbon emission concentrations.
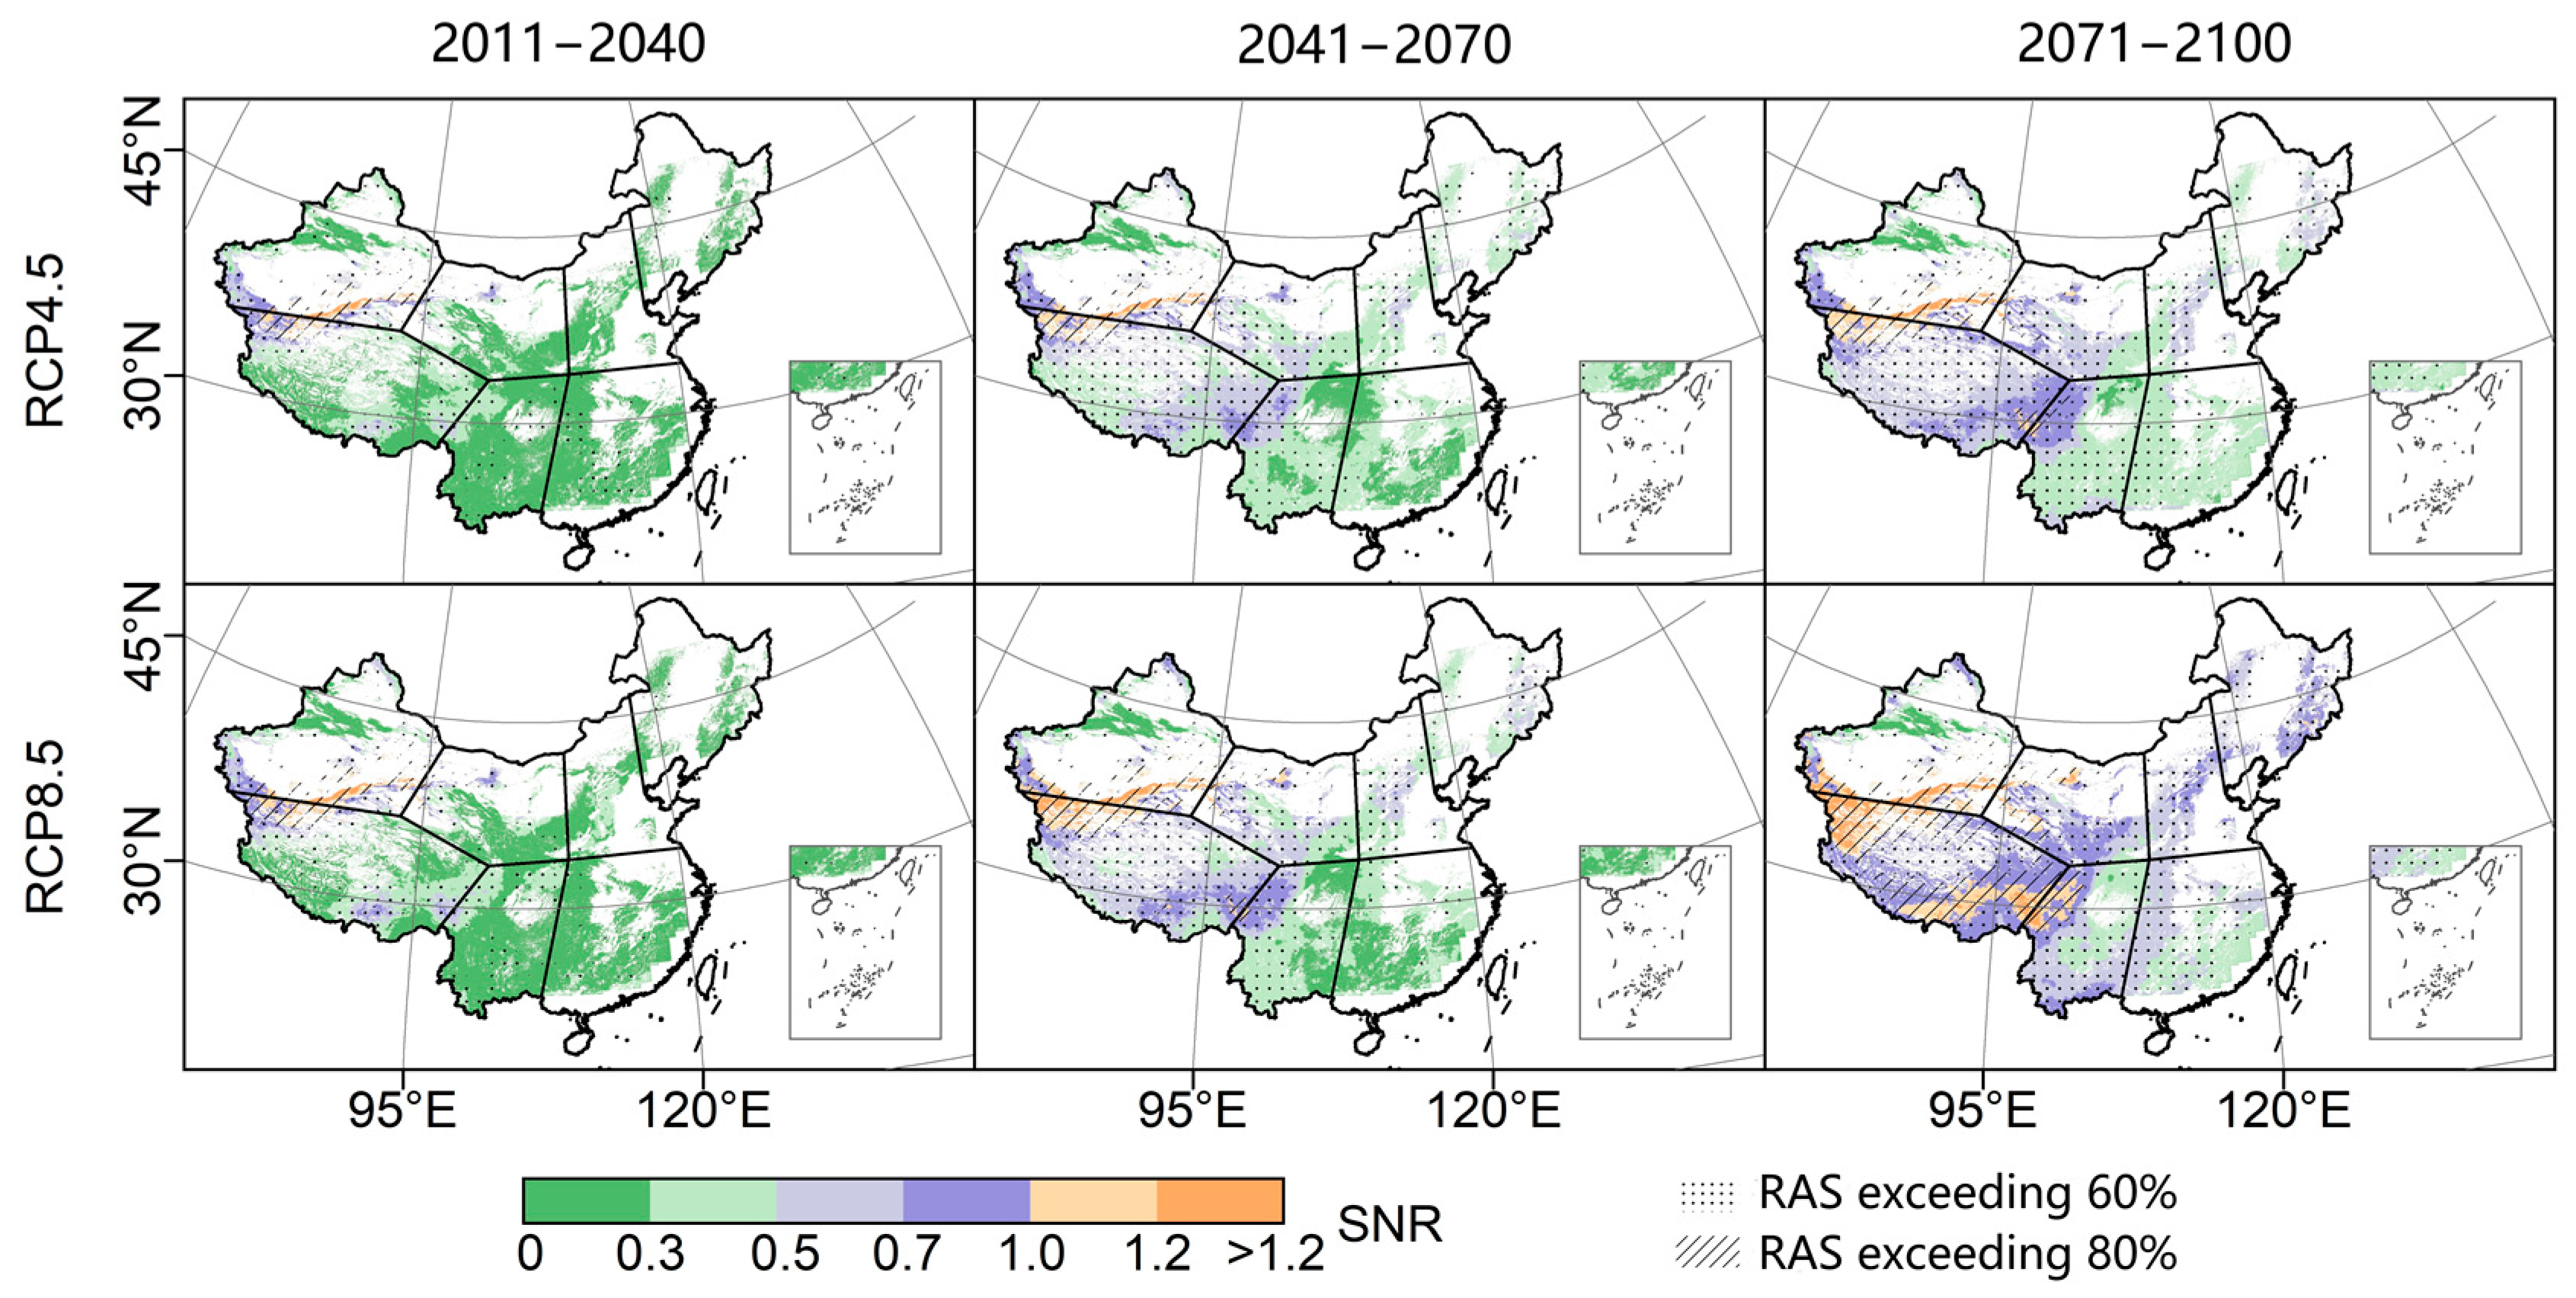
Figure 6 shows the spatial distribution of the multi-year average SNR and RAS values for the number of forecasted landslide days in different periods of the 21st century. The SNR tends to have high values in the west and low values in the east. A high SNR can only be observed at the beginning of the 21st century in the TC bordering the WNWC. The SNR values range from 0.7 to 1.2, and the RAS exceeds the 80% confidence level, indicating a lower degree of uncertainty in the increase in landslide forecasts for this region. In the rest of the region, the SNR is below 0.5 and the RAS also exceeds 60% only in the Tibetan Plateau and in a fraction of the SEC. As we approach the middle of the 21st century, only the northern section of the Tibetan Plateau will retain an SNR that is higher than 1 and an RAS higher than 80%, whereas the remainder of the Tibetan Plateau will retain an SNR of higher than 0.5 and an RAS higher than 60%. The rest of the plateau has a SNR below 0.5. Only the northeastern, northern, and southwestern regions have an RAS exceeding 60%, which indicates a large degree of uncertainty. As we progress further into the far future of the 21st century, the natural internal variability of most regions becomes significantly smaller. Except for the southwest and northwest regions, most of the regions have stabilized above 0.7, and the RAS is also greater than 60%, which shows a reduced uncertainty among the models compared with that in the early and middle of the 21st century.
It can be found from Figure 6 that in regions with a smaller variation in the relative change, the SNR and the RAS values are smaller, and the level of uncertainty is higher. Oppositely, in regions where the variation is more than 60%, the SNR and the RAS values are larger, and the level of uncertainty is smaller.
4. Discussion
The results of the prognostic studies above suggest that as global warming continues, extreme precipitation events in China will become more frequent. This will further contribute to the susceptibility of landslide hazards, revealing a steady rise from the east to the west, in line with China’s topography (where the elevation gradually increases while moving westwards). The greatest increases in landslide incidence are observed on the Tibetan Plateau and in Northwestern China. This observation corresponds with the conclusions drawn by Lin et al. in 2020 [42]. They found that under the RCP8.5 scenario from 2066 to 2095, landslides tended to increase significantly in the northwestern region, and the Tibetan Plateau and the southwestern region had increases of more than 25%. The southeastern hilly region exhibits a 10% increase in landslide frequency, while the southeastern coastal region presents a decline in incidence. Comparing the northeast and southeast regions of China, the rate of possible future landslide increase in the northeast region of China is significantly larger than that in the southeast region. The change in monsoon circulation may be one reason for the north–south difference. As the monsoon circulation strengthens, the rain band will push northward, resulting in a large increase in precipitation in the northern and northeastern regions of China, while the southeastern regions experience less increase or even a decrease in precipitation [43,44]. Similarly, Kirschbaum et al. [45] found that most of the Tibetan region also showed an increasing trend. They found that the most substantial alteration took place during the summer months and the monsoon played a major role in generating extreme rainfall in the region. As far as the time evolution trend is concerned, this study concludes that the trend of change at the end of the 21st century is more significant than at the beginning. He et al. [46] similarly concluded that the pattern of change at the end of the 21st century was basically the same as that of the mid-21st century. However, the extent of the increase was higher, with landslides increasing by 16.87% in the mid-21st century and by 20.53% at the end of the 21st century.
The aforementioned outcomes, derived from an ensemble of various models, offer a rational perspective on forecasting landslides in China. Nevertheless, the degree of uncertainty in rainfall-based landslide forecasting through extant climate models remains far from negligible. Illustratively, the region with the most pronounced uncertainty, i.e., the southeast region, manifests an SNR value in the 0.2 to 0.6 range. This indicates that the natural internal variability among the model ensembles is 2–5 times the mean value of the ensemble’s relative variability, resulting in significant differences in the model simulation results. In addition, the RAS in this region is only 50–60%, indicating conflicting trends in approximately half of the models when compared to the ensemble. Consequently, the trend of landslide change in the southeast is not universally recognized in the model ensemble. The weak simulation ability of GCMs for East Asian monsoon precipitation may be a possible reason, along with the deviation in the seasonal advancement process of rain bands from observation. Moreover, many models tend to underestimate rainfall and its variability [11], which may lead to the underestimation of landslide changes in the eastern region.
In the early part of the 21st century, there is roughly a 5% difference in the ensemble mean values between RCP4.5 and RCP8.5, with little difference in the SNR values. However, by the late 21st century, the discrepancy between the ensemble mean values increases to 20-40%, and the SNR values show evident divergence. This illustrates that especially in the late 21st century, the credibility of landslide prognosis is significantly different for various RCP scenarios. In the early stage, the RCP bears minimal impact on the uncertainty of landslide prognosis. However, towards the end of the 21st century, the RCP uncertainty gradually increases. This is consistent with the study by Wu et al. [47], which highlights that the GCM ensemble and RCP scenarios’ uncertainty portrayed interannual variability. This research provides valuable insights for the landslide susceptibility under climate change. The prediction framework can be utilized to other regions for landslide assessment and uncertainty analysis.
Although this study analyzes the uncertainty introduced by the natural internal variability of the GCM ensemble and climate development scenarios, there are still some limitations that prevent a complete investigation of the sources of uncertainty. For example, future precipitation predictions are highly susceptible to data sources [48]. Chen et al. [49] used different rainfall datasets in a slope stability model and found that there is a large uncertainty in the simulation results when there are significant differences in the rainfall data. More attention needs to be paid to the uncertainty of rainfall in slope stability models. In addition, the trend of rainfall characteristics can be significantly influenced by various bias correction and downscaling methods, leading to uncertainty. This can even alter the direction of the trend, as noted by Homsi et al. in 2020 [50].
Additionally, the NASA team has refined and developed version 2 of the LHASA model to further account for factors such as soil moisture, snow mass, and geological information [51]. There have been a number of studies applying soil moisture to landslide prediction [52,53]. Therefore, more landslide-triggering factors, such as soil moisture, need to be taken into account in landslide prediction studies in the future. More methods for the prediction of landslides should also be considered, such as the probabilistic threshold propose by Zhao, B. et al. [54]. Also, Khan et al. [55] introduced the global LHASA-Forecast (LHASA-F) framework, which incorporated the forecasted precipitation data. It demonstrates the feasibility of using rainfall prediction data to predict future landslide hazard.
5. Conclusions
In this study, the LHASH model is employed to scrutinize the attributes of upcoming landslide danger variations in China using 16 CMIP5 climatic models and two carbon release scenario predictions. The associated ambiguities of the multi-model and multi-scenario forecasts are also examined. Based on the analysis, we draw the following conclusions:
- (1)
- There is strong spatial and temporal heterogeneity in the variability of landslide hazard due to climate change. Compared with the historical period, the number of future landslide hazard basically shows an increasing trend, and the incidence of landslides under the RCP8.5 scenario is greater than that under the RCP4.5 scenario. In the early 21st century, there is expected to be a 5–10% increase in landslide hazards relative to the base period. The middle of the 21st century will see a more notable increase by 10–20%, with RCP8.5 having a slightly higher increase than RCP4.5, although not significantly. By the end of the 21st century, they will increase by 20–40% and 40–60% for RCP4.5 and RCP8.5, respectively. Spatially, the increase in the relative change in landslide hazards shows a spatial distribution characteristic of gradually increasing from east to west, corresponding to the topography of China. At the end of the 21st century, the relative increase in landslide hazard in the Tibetan Plateau, southwest, and southeast regions are 100%, 40%, and 20%, respectively. The seasonal differences in future landslide changes are significant, with the most increase in the spring and fall in most regions.
- (2)
- Overall, the GCM ensemble generally recognizes an upward trend in future landslide hazards in China, although the model has large uncertainties in the variability as well as the increase and decrease in changes. The SNR and the RAS are gradually increasing over time, and the consistency of the magnitude and positive and negative directions of the disaster changes predicted by the GCM are gradually strengthening. However, the uncertainty introduced by the RCP scenario is also rising. For each subregion, both the SNR and the RAS show high values in the west and lower values in the east. Except for parts of the Tibetan Plateau, where the SNR is greater than 1 and the RAS is more than 80%, uncertain levels are high in the remaining regions.
- (3)
- The characteristics of the distribution of uncertainty in the landslide prognoses are similar to those of the distribution of future variability in the landslide prognoses. In regions where the predicted future variability is small (<10%), both the SNR and RAS are low, resulting in high levels of uncertainty. Conversely, in locations where the variability is large (>60%), both the SNR and RAS are high, leading to reduced levels of uncertainty. Scenarios with high carbon emission concentrations will likely experience a greater degree of GCM ensemble for future extreme precipitation frequency compared to moderate and low carbon emission concentration scenarios, and will have stronger agreement and lower uncertainty in the variability, as well as incremental and decremental changes in landslide hazards.
Author Contributions
Conceptualization, J.Z. (Jun Zhang) and Q.D.; data curation, E.C. and Y.X.; formal analysis, Y.C. and E.C.; methodology, J.Z. (Jingxuan Zhu); software, E.C. and Y.C.; writing—original draft, Y.C.; writing—review and editing, J.Z. (Jun Zhang) and Q.D. All authors have read and agreed to the published version of the manuscript.
Funding
This research was funded by The National Natural Science Foundation of China (41871299); The National Natural Science Foundation of China (42201020); The Natural Science Foundation of Jiangsu Higher Education Institutions of China (no. 22KJB170002).
Data Availability Statement
Data sharing is not applicable.
Conflicts of Interest
The authors declare no conflict of interest.
References
- Maraun, D.; Knevels, R.; Mishra, A.N.; Truhetz, H.; Bevacqua, E.; Proske, H.; Zappa, G.; Brenning, A.; Petschko, H.; Schaffer, A.; et al. A severe landslide event in the Alpine foreland under possible future climate and land-use changes. Commun. Earth Environ. 2022, 3, 87. [Google Scholar] [CrossRef]
- Araújo, J.R.; Ramos, A.M.; Soares, P.M.M.; Melo, R.; Oliveira, S.C.; Trigo, R.M. Impact of extreme rainfall events on landslide activity in Portugal under climate change scenarios. Landslides 2022, 19, 2279–2293. [Google Scholar] [CrossRef]
- Pei, Y.; Qiu, H.; Zhu, Y.; Wang, J.; Yang, D.; Tang, B.; Wang, F.; Cao, M. Elevation dependence of landslide activity induced by climate change in the eastern Pamirs. Landslides 2023, 20, 1115–1133. [Google Scholar] [CrossRef]
- Thom, B.; Roberto, G. Invited perspectives: Hydrological perspectives on precipitation intensity-duration thresholds for landslide initiation: Proposing hydro-meteorological thresholds. Nat. Hazards Earth Syst. Sci. 2018, 18, 31–39. [Google Scholar]
- Valenzuela, P.; Zêzere, J.L.; Domínguez-Cuesta, M.J.; García, M.A.M. Empirical rainfall thresholds for the triggering of landslides in Asturias (NW Spain). Landslides 2019, 16, 1285–1300. [Google Scholar] [CrossRef]
- Liu, H.Z.; Xu, H.; Bao, H.J.; Xu, W.; Yan, X.F.; Xu, C.P. Characteristics analysis of rainfall-induced landslide thresholds in local regions. J. Nat. Disasters 2021, 30, 181–190. (In Chinese) [Google Scholar] [CrossRef]
- Giorgi, F.; Raffaele, F.; Coppola, E. The response of precipitation characteristics to global warming from climate projections. Earth Syst. Dyn. 2019, 10, 73–89. [Google Scholar] [CrossRef]
- O’gorman, P.A. Precipitation Extremes Under Climate Change. Curr. Clim. Chang. Rep. 2015, 1, 49–59. [Google Scholar] [CrossRef]
- Donat, M.G.; Lowry, A.L.; Alexander, L.V.; O’Gorman, P.A.; Maher, N. Addendum: More extreme precipitation in the world’s dry and wet regions. Nat. Clim. Chang. 2016, 6, 508–513. [Google Scholar] [CrossRef]
- O’gorman, P.A.; Schneider, T. Scaling of Precipitation Extremes over a Wide Range of Climates Simulated with an Idealized GCM. J. Clim. 2009, 22, 5676–5685. [Google Scholar] [CrossRef]
- Zhang, W.; Zhou, T. Increasing impacts from extreme precipitation on population over China with global warming. Sci. Bull. 2020, 65, 243–252. [Google Scholar] [CrossRef] [PubMed]
- Crozier, M.J. Deciphering the effect of climate change on landslide activity: A review. Geomorphology 2010, 124, 260–267. [Google Scholar] [CrossRef]
- Gao, Y.; Li, B.; Feng, Z.; Zuo, X. Global climate change and geological disaster response analysis. J. Geomech. 2017, 23, 65–77. (In Chinese) [Google Scholar]
- Gariano, S.L.; Fausto, G. Landslides in a changing climate. Earth-Sci. Rev. 2016, 162, 227–252. [Google Scholar] [CrossRef]
- Chen, C.-W.; Tung, Y.-S.; Liou, J.-J.; Li, H.-C.; Cheng, C.-T.; Chen, Y.-M.; Oguchi, T. Assessing landslide characteristics in a changing climate in northern Taiwan. Catena 2019, 175, 263–277. [Google Scholar] [CrossRef]
- Lee, M.J.; Song, W.K.; Won, J.S.; Park, I.; Lee, S. Spatial and temporal change in landslide hazard by future climate change scenarios using probabilistic-based frequency ratio model. Geocarto Int. 2014, 29, 639–662. [Google Scholar]
- Sobie, S.R. Future changes in precipitation-caused landslide frequency in British Columbia. Clim. Chang. 2020, 162, 465–484. [Google Scholar] [CrossRef]
- Janizadeh, S.; Bateni, S.M.; Jun, C.; Pal, S.C.; Band, S.S.; Chowdhuri, I.; Saha, A.; Tiefenbacher, J.P.; Mosavi, A. Potential impacts of future climate on the spatio-temporal variability of landslide susceptibility in Iran using machine learning algorithms and CMIP6 climate-change scenarios. Gondwana Res. 2023, 124, 1–17. [Google Scholar] [CrossRef]
- Yin, H.; Zhang, J.; Mondal, S.K.; Wang, B.; Zhou, L.; Wang, L.; Lin, Q. Projected Rainfall Triggered Landslide Susceptibility Changes in the Hengduan Mountain Region, Southwest China under 1.5–4.0 °C Warming Scenarios Based on CMIP6 Models. Atmosphere 2023, 14, 214. [Google Scholar] [CrossRef]
- Alvioli, M.; Melillo, M.; Guzzetti, F.; Rossi, M.; Palazzi, E.; von Hardenberg, J.; Brunetti, M.T.; Peruccacci, S. Implications of climate change on landslide hazard in Central Italy. Sci. Total. Environ. 2018, 630, 1528–1543. [Google Scholar] [CrossRef]
- Lin, Q.; Steger, S.; Pittore, M.; Zhang, J.; Wang, L.; Jiang, T.; Wang, Y. Evaluation of potential changes in landslide susceptibility and landslide occurrence frequency in China under climate change. Sci. Total Environ. 2022, 850, 158049. [Google Scholar] [CrossRef] [PubMed]
- Deser, C.; Phillips, A.; Bourdette, V.; Teng, H. Uncertainty in climate change projections: The role of internal variability. Clim. Dyn. 2012, 38, 527–546. [Google Scholar] [CrossRef]
- Asseng, S.; Ewert, F.; Rosenzweig, C.; Jones, J.W.; Hatfield, J.L.; Ruane, A.C.; Boote, K.J.; Thorburn, P.J.; Rötter, R.P.; Cammarano, D.; et al. Uncertainty in simulating wheat yields under climate change. Nat. Clim. Chang. 2013, 3, 827–832. [Google Scholar] [CrossRef]
- Kim, H.G.; Lee, D.K.; Park, C.; Kil, S.; Son, Y.; Park, J.H. Evaluating landslide hazards using RCP 4.5 and 8.5 scenarios. Environ. Earth Sci. 2015, 73, 1385–1400. [Google Scholar] [CrossRef]
- Ciabatta, L.; Camici, S.; Brocca, L.; Ponziani, F.; Stelluti, M.; Berni, N.; Moramarco, T. Assessing the impact of climate-change scenarios on landslide occurrence in Umbria Region, Italy. J. Hydrol. 2016, 541, 285–295. [Google Scholar] [CrossRef]
- Stanley, T.; Kirschbaum, D.B. A heuristic approach to global landslide susceptibility mapping. Nat. Hazards 2017, 87, 145–164. [Google Scholar] [CrossRef]
- Kirschbaum, D.; Stanley, T.; Zhou, Y. Spatial and temporal analysis of a global landslide catalog. Geomorphology 2015, 249, 4–15. [Google Scholar] [CrossRef]
- Miao, C.; Su, L.; Sun, Q.; Duan, Q. A nonstationary bias-correction technique to remove bias in GCM simulations. J. Geophys. Res. Atmos. 2016, 121, 5718–5735. [Google Scholar] [CrossRef]
- Rosa, D.; Collins, W.D. A case study of subdaily simulated and observed continental convective precipitation: CMIP5 and multiscale global climate models comparison. Geophys. Res. Lett. 2013, 40, 5999–6003. [Google Scholar] [CrossRef]
- Jia, K.; Ruan, Y.; Yang, Y.; You, Z. Assessment of CMIP5 GCM Simulation Performance for Temperature Projection in the Tibetan Plateau. Earth Space Sci. 2019, 6, 2362–2378. [Google Scholar] [CrossRef]
- Lovino, M.A.; Müller, O.V.; Berbery, E.H.; Müller, G.V. Evaluation of CMIP5 retrospective simulations of temperature and precipitation in northeastern Argentina. Int. J. Clim. 2018, 38, e1158–e1175. [Google Scholar] [CrossRef]
- Cannon, A.J.; Sobie, S.R.; Murdock, T.Q. Bias Correction of GCM Precipitation by Quantile Mapping: How Well Do Methods Preserve Changes in Quantiles and Extremes? J. Clim. 2015, 28, 6938–6959. [Google Scholar] [CrossRef]
- Wood, A.W.; Maurer, E.P.; Kumar, A.; Lettenmaier, D. Long-range experimental hydrologic forecasting for the eastern United States. J. Geophys. Res. 2002, 107, 4429. [Google Scholar] [CrossRef]
- Xu, L.; Wang, A. Application of the Bias Correction and Spatial Downscaling Algorithm on the Temperature Extremes from CMIP5 Multimodel Ensembles in China. Earth Space Sci. 2019, 6, 2508–2524. [Google Scholar] [CrossRef]
- Kirschbaum, D.; Stanley, T. Satellite-based assessment of rainfall-triggered landslide hazard for situational awareness. Earths Future 2018, 6, 505–523. [Google Scholar] [CrossRef] [PubMed]
- Amatya, P.; Kirschbaum, D.; Stanley, T. Rainfall-induced landslide inventories for Lower Mekong based on Planet imagery and a semi-automatic mapping method. Geosci. Data J. 2022, 9, 315–327. [Google Scholar] [CrossRef]
- Emberson, R.; Kirschbaum, D.; Stanley, T. New global characterisation of landslide exposure. Nat. Hazards Earth Syst. Sci. 2020, 20, 3413–3424. [Google Scholar] [CrossRef]
- Han, Z.Y.; Gao, X.J.; Xu, Y. Mean and extreme precipitation projection over land area of East Asia based on multiple regional climate models. Chin. J. Geophys. 2021, 64, 1869–1884. (In Chinese) [Google Scholar]
- Gu, L.; Chen, J.; Xu, C.-Y.; Kim, J.-S.; Chen, H.; Xia, J.; Zhang, L. The contribution of internal climate variability to climate change impacts on droughts. Sci. Total. Environ. 2019, 684, 229–246. [Google Scholar] [CrossRef]
- Tebaldi, C.; Arblaster, J.M.; Knutti, R. Mapping model agreement on future climate projections. Geophys. Res. Lett. 2011, 38, L23701. [Google Scholar] [CrossRef]
- Wang, A.; Lettenmaier, D.P.; Sheffield, J. Soil Moisture Drought in China, 1950–2006. J. Clim. 2011, 24, 3257–3271. [Google Scholar] [CrossRef]
- Lin, Q.; Wang, Y.; Glade, T.; Zhang, J.; Zhang, Y. Assessing the spatiotemporal impact of climate change on event rainfall characteristics influencing landslide occurrences based on multiple GCM projections in China. Clim. Chang. 2020, 162, 761–779. [Google Scholar] [CrossRef]
- Wang, T.; Miao, J.-P.; Sun, J.-Q.; Fu, Y.-H. Intensified East Asian summer monsoon and associated precipitation mode shift under the 1.5 °C global warming target. Adv. Clim. Chang. Res. 2018, 9, 102–111. [Google Scholar] [CrossRef]
- Wu, Y.; Wu, S.-Y.; Wen, J.; Tagle, F.; Xu, M.; Tan, J. Future Changes in Mean and Extreme Monsoon Precipitation in the Middle and Lower Yangtze River Basin, China, in the CMIP5 Models. J. Hydrometeorol. 2016, 17, 2785–2797. [Google Scholar] [CrossRef]
- Kirschbaum, D.; Kapnick, S.B.; Stanley, T.; Pascale, S. Changes in Extreme Precipitation and Landslides Over High Mountain Asia. Geophys. Res. Lett. 2020, 47, e2019GL085347. [Google Scholar] [CrossRef]
- He, S.; Wang, J.; Wang, H. Projection of Landslides in China during the 21st Century under the RCP8.5 Scenario. J. Meteorol. Res. 2019, 33, 138–148. [Google Scholar] [CrossRef]
- Wu, C.; Yeh, P.J.-F.; Ju, J.; Chen, Y.-Y.; Xu, K.; Dai, H.; Niu, J.; Hu, B.X.; Huang, G. Assessing the Spatiotemporal Uncertainties in Future Meteorological Droughts from CMIP5 Models, Emission Scenarios, and Bias Corrections. J. Clim. 2021, 34, 1903–1922. [Google Scholar] [CrossRef]
- Gao, J.; Sheshukov, A.Y.; Yen, H.; Douglas-Mankin, K.R.; White, M.J.; Arnold, J.G. Uncertainty of hydrologic processes caused by bias-corrected CMIP5 climate change projections with alternative historical data sources. J. Hydrol. 2019, 568, 551–561. [Google Scholar] [CrossRef]
- Chen, Y.; Zhao, L.; Wang, Y.; Jiang, Q.; Qi, D. Precipitation data and their uncertainty as input for rainfall-induced shallow landslide models. Front. Earth Sci. 2019, 13, 695–704. [Google Scholar] [CrossRef]
- Homsi, R.; Shiru, M.S.; Shahid, S.; Ismail, T.; Bin Harun, S.; Al-Ansari, N.; Chau, K.-W.; Yaseen, Z.M. Precipitation projection using a CMIP5 GCM ensemble model: A regional investigation of Syria. Eng. Appl. Comput. Fluid Mech. 2020, 14, 90–106. [Google Scholar] [CrossRef]
- Stanley, T.A.; Kirschbaum, D.B.; Benz, G.; Emberson, R.A.; Amatya, P.M.; Medwedeff, W.; Clark, M.K. Data-Driven Landslide Nowcasting at the Global Scale. Front. Earth Sci. 2021, 9, 640043. [Google Scholar] [CrossRef]
- Zhuo, L.; Dai, Q.; Han, D.; Chen, N.; Zhao, B.; Berti, M. Evaluation of Remotely Sensed Soil Moisture for Landslide Hazard Assessment. IEEE J. Sel. Top. Appl. Earth Obs. Remote Sens. 2019, 12, 162–173. [Google Scholar] [CrossRef]
- Zhao, B.; Dai, Q.; Han, D.; Mao, J.; Zhuo, L.; Rong, G. Estimation of soil moisture using modified antecedent precipitation index with application in landslide predictions. Landslides 2019, 16, 2381–2393. [Google Scholar] [CrossRef]
- Zhao, B.; Dai, Q.; Han, D.; Dai, H.; Mao, J.; Zhuo, L. Probabilistic thresholds for landslides warning by integrating soil moisture conditions with rainfall thresholds. J. Hydrol. 2019, 574, 276–287. [Google Scholar] [CrossRef]
- Khan, S.; Kirschbaum, D.B.; Stanley, T.A.; Amatya, P.M.; Emberson, R.A. Global Landslide Forecasting System for Hazard Assessment and Situational Awareness. Front. Earth Sci. 2022, 10, 878996. [Google Scholar] [CrossRef]
Figure 1.
Methodological framework.
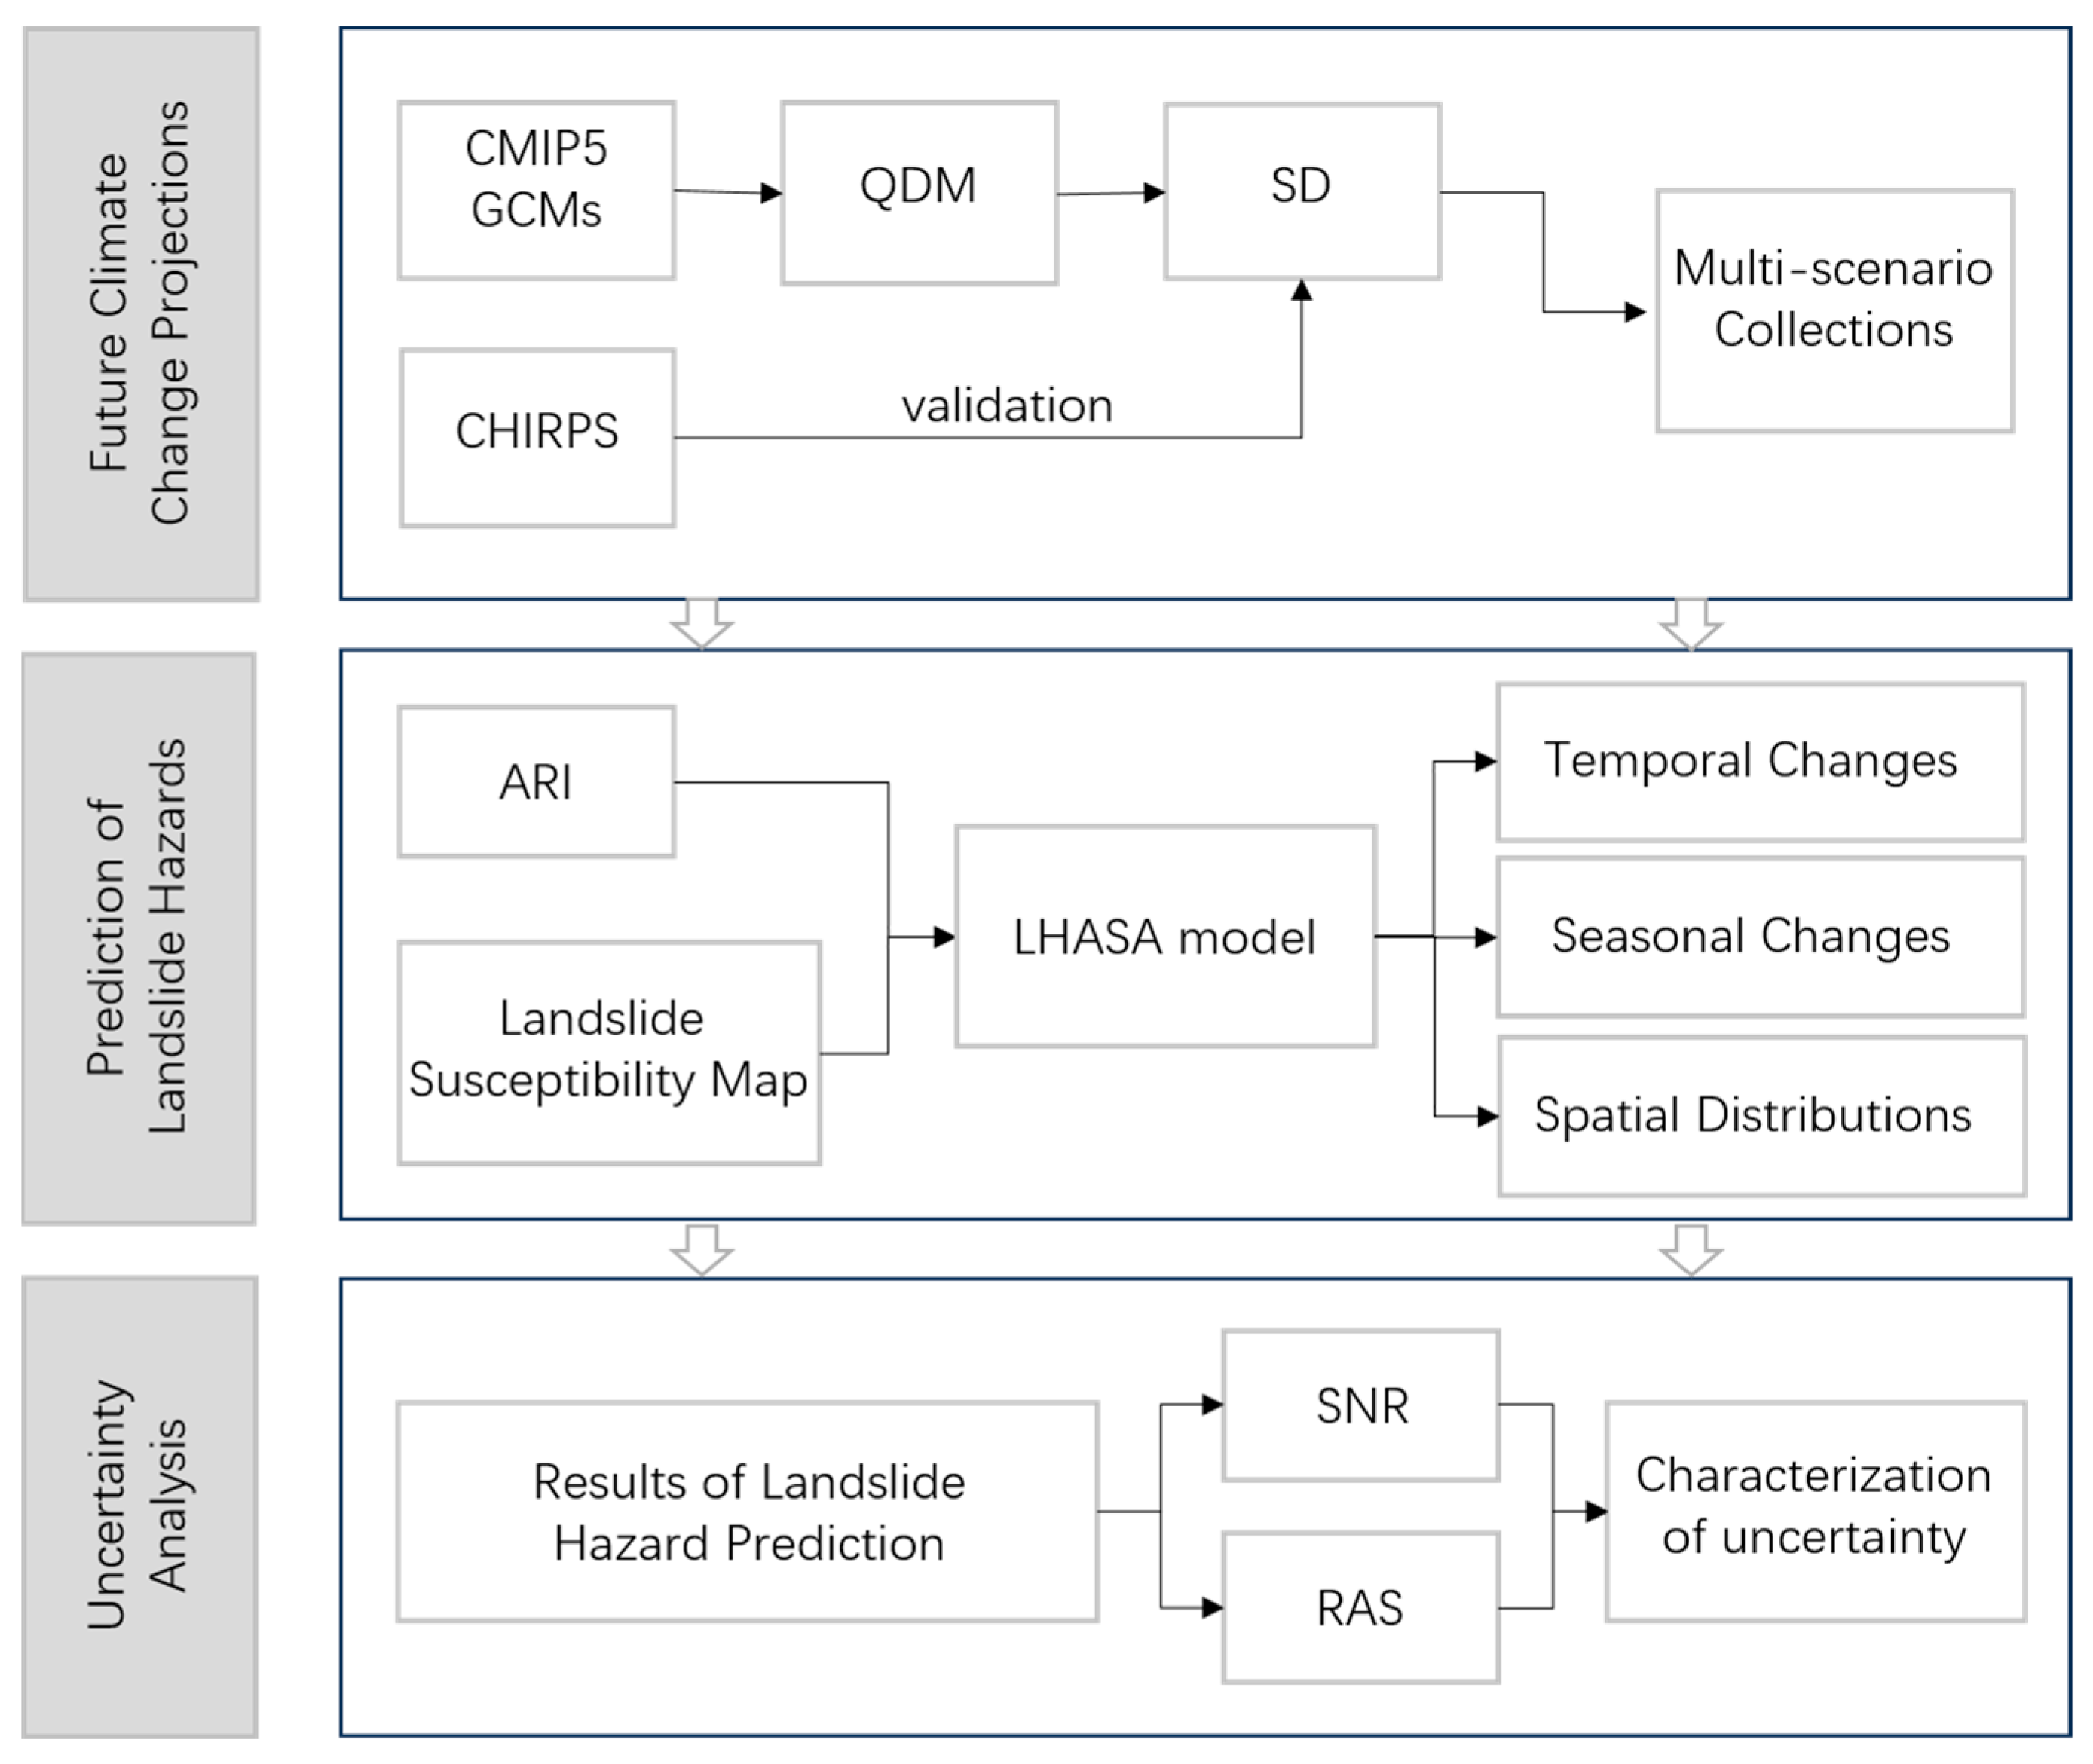
Figure 2.
Seven geographical divisions of China (NEC: Northeastern China; NC: Northern China; SEC: Southeastern China; SWC: Southwestern China; ENWC: east of Northwestern China; WNWC: west of Northwestern China; TC: Tibet region of China).
Figure 2.
Seven geographical divisions of China (NEC: Northeastern China; NC: Northern China; SEC: Southeastern China; SWC: Southwestern China; ENWC: east of Northwestern China; WNWC: west of Northwestern China; TC: Tibet region of China).

Figure 3.
Comparison of downscaled GCM data and measured precipitation data in different subregions of China, 1981−2005.
Figure 3.
Comparison of downscaled GCM data and measured precipitation data in different subregions of China, 1981−2005.
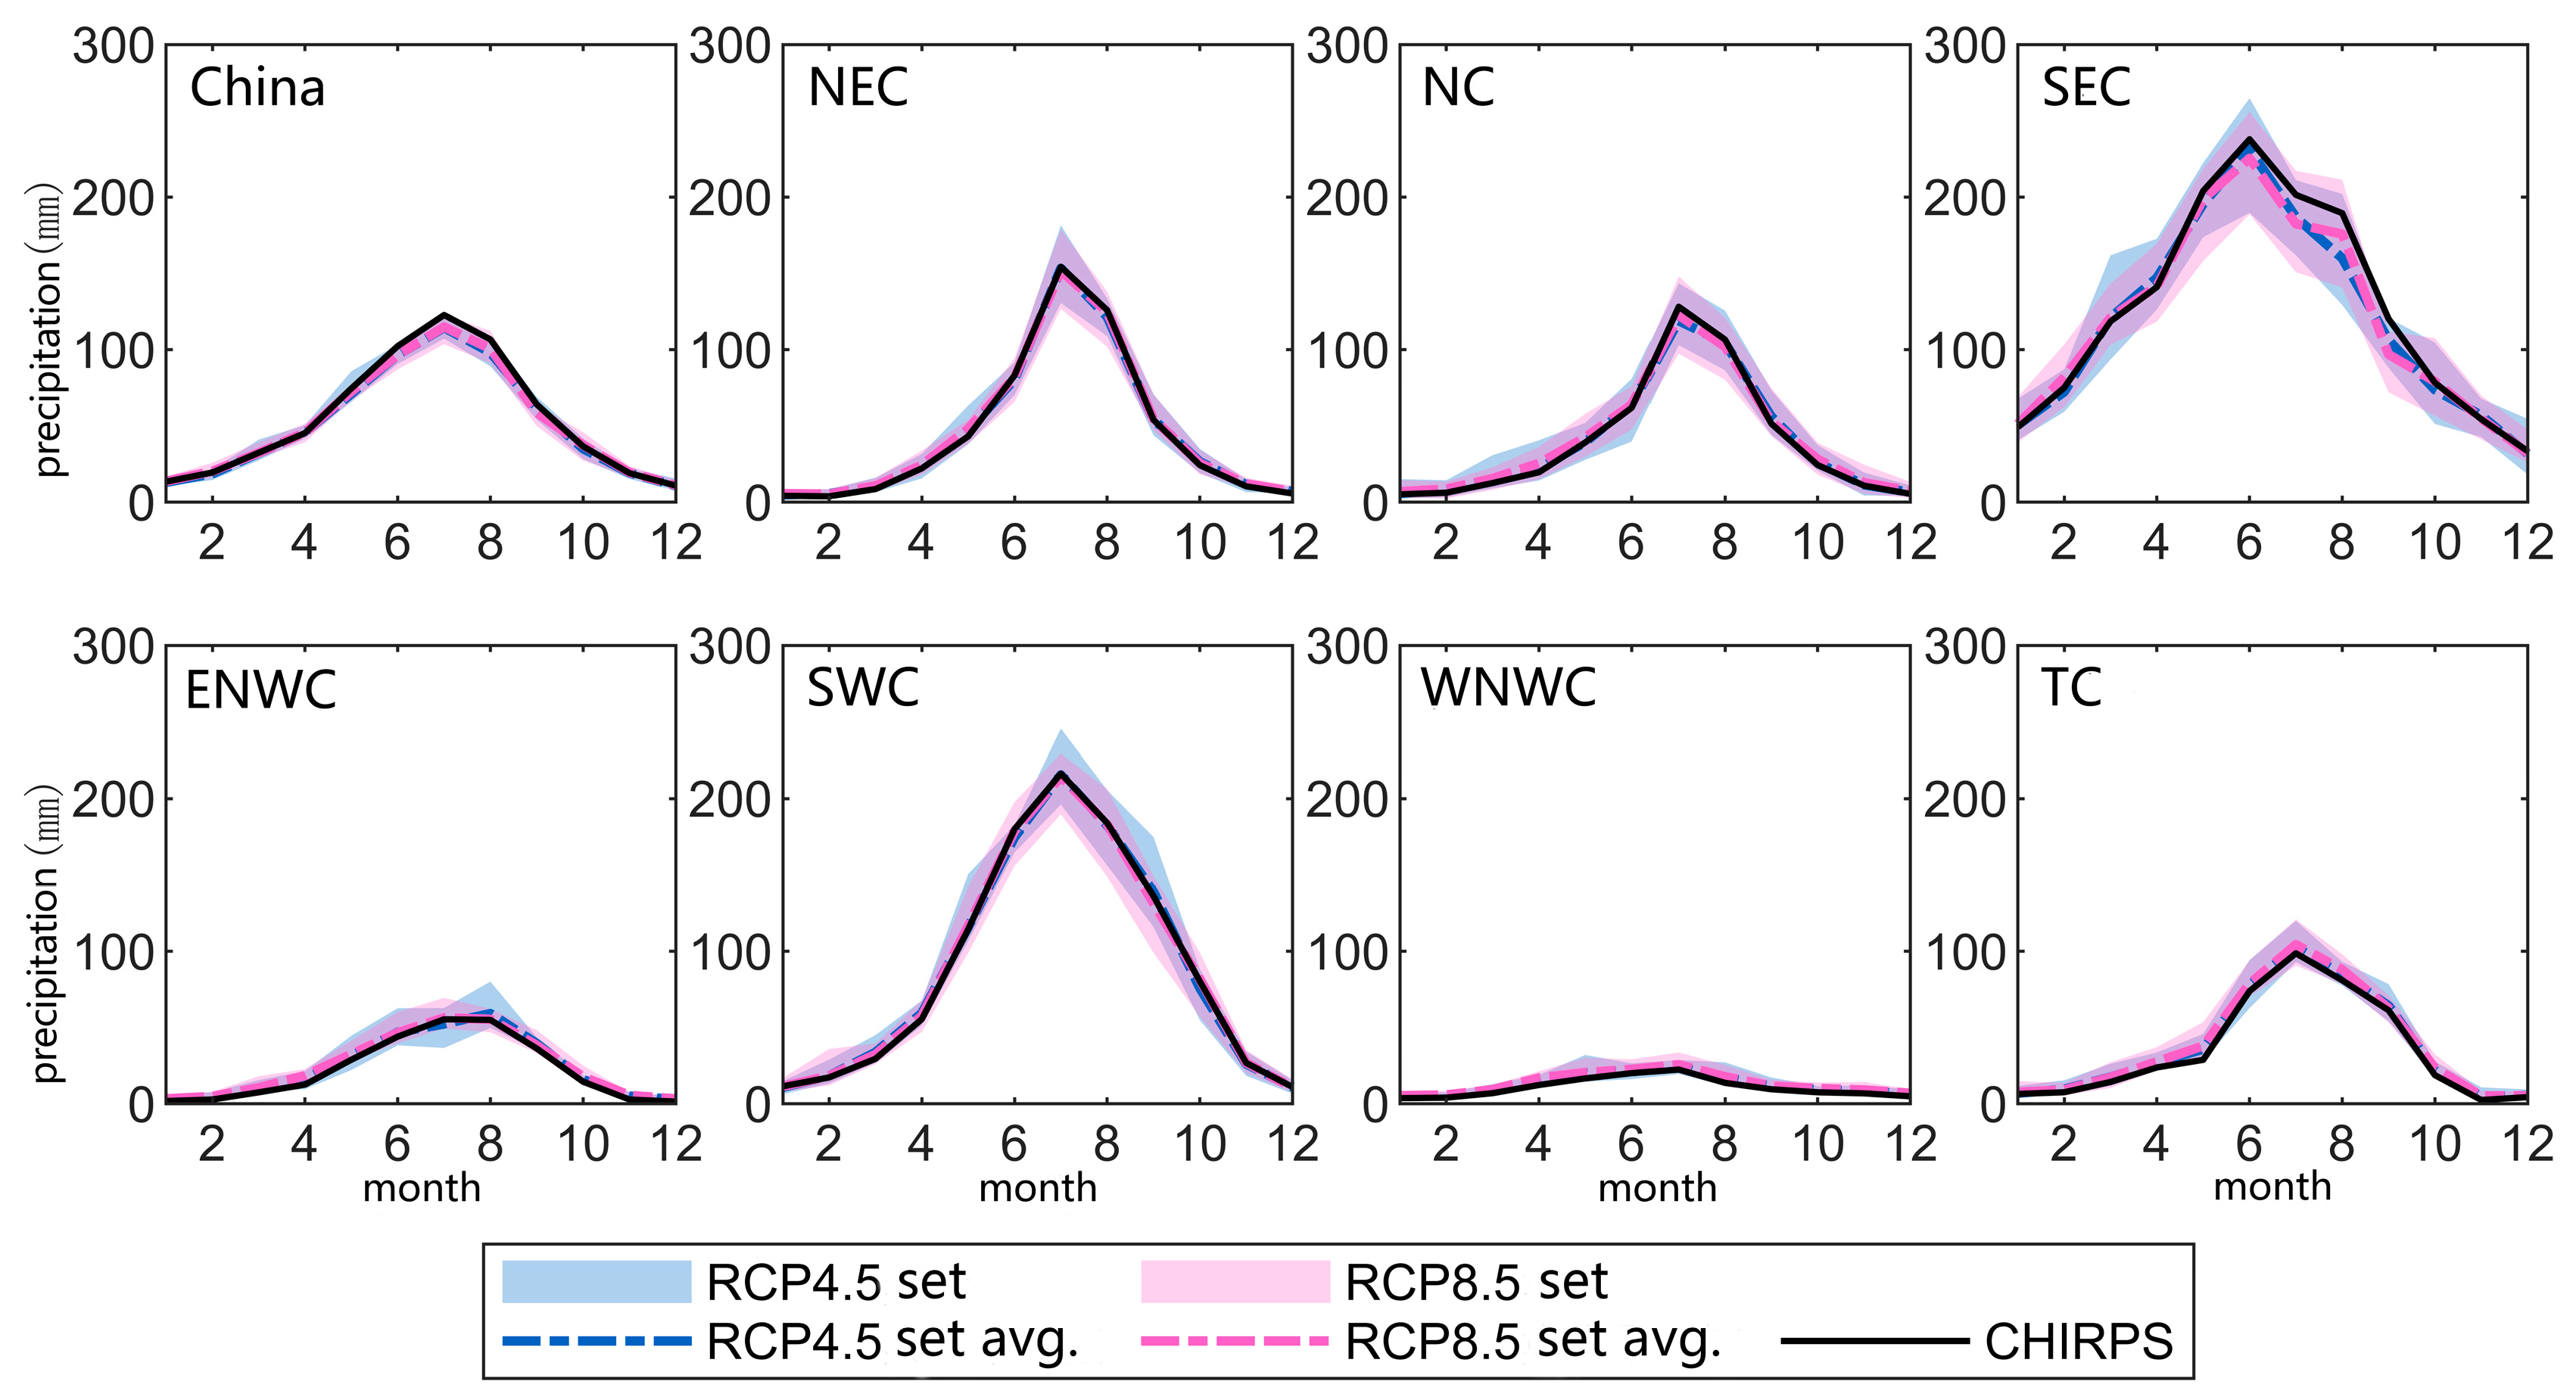
Figure 4.
Spatial distribution of relative changes in rainfall-induced landslides in China in different future periods (relative to 1981–2005). (a) Moderately susceptible areas; (b) highly susceptible areas.
Figure 4.
Spatial distribution of relative changes in rainfall-induced landslides in China in different future periods (relative to 1981–2005). (a) Moderately susceptible areas; (b) highly susceptible areas.
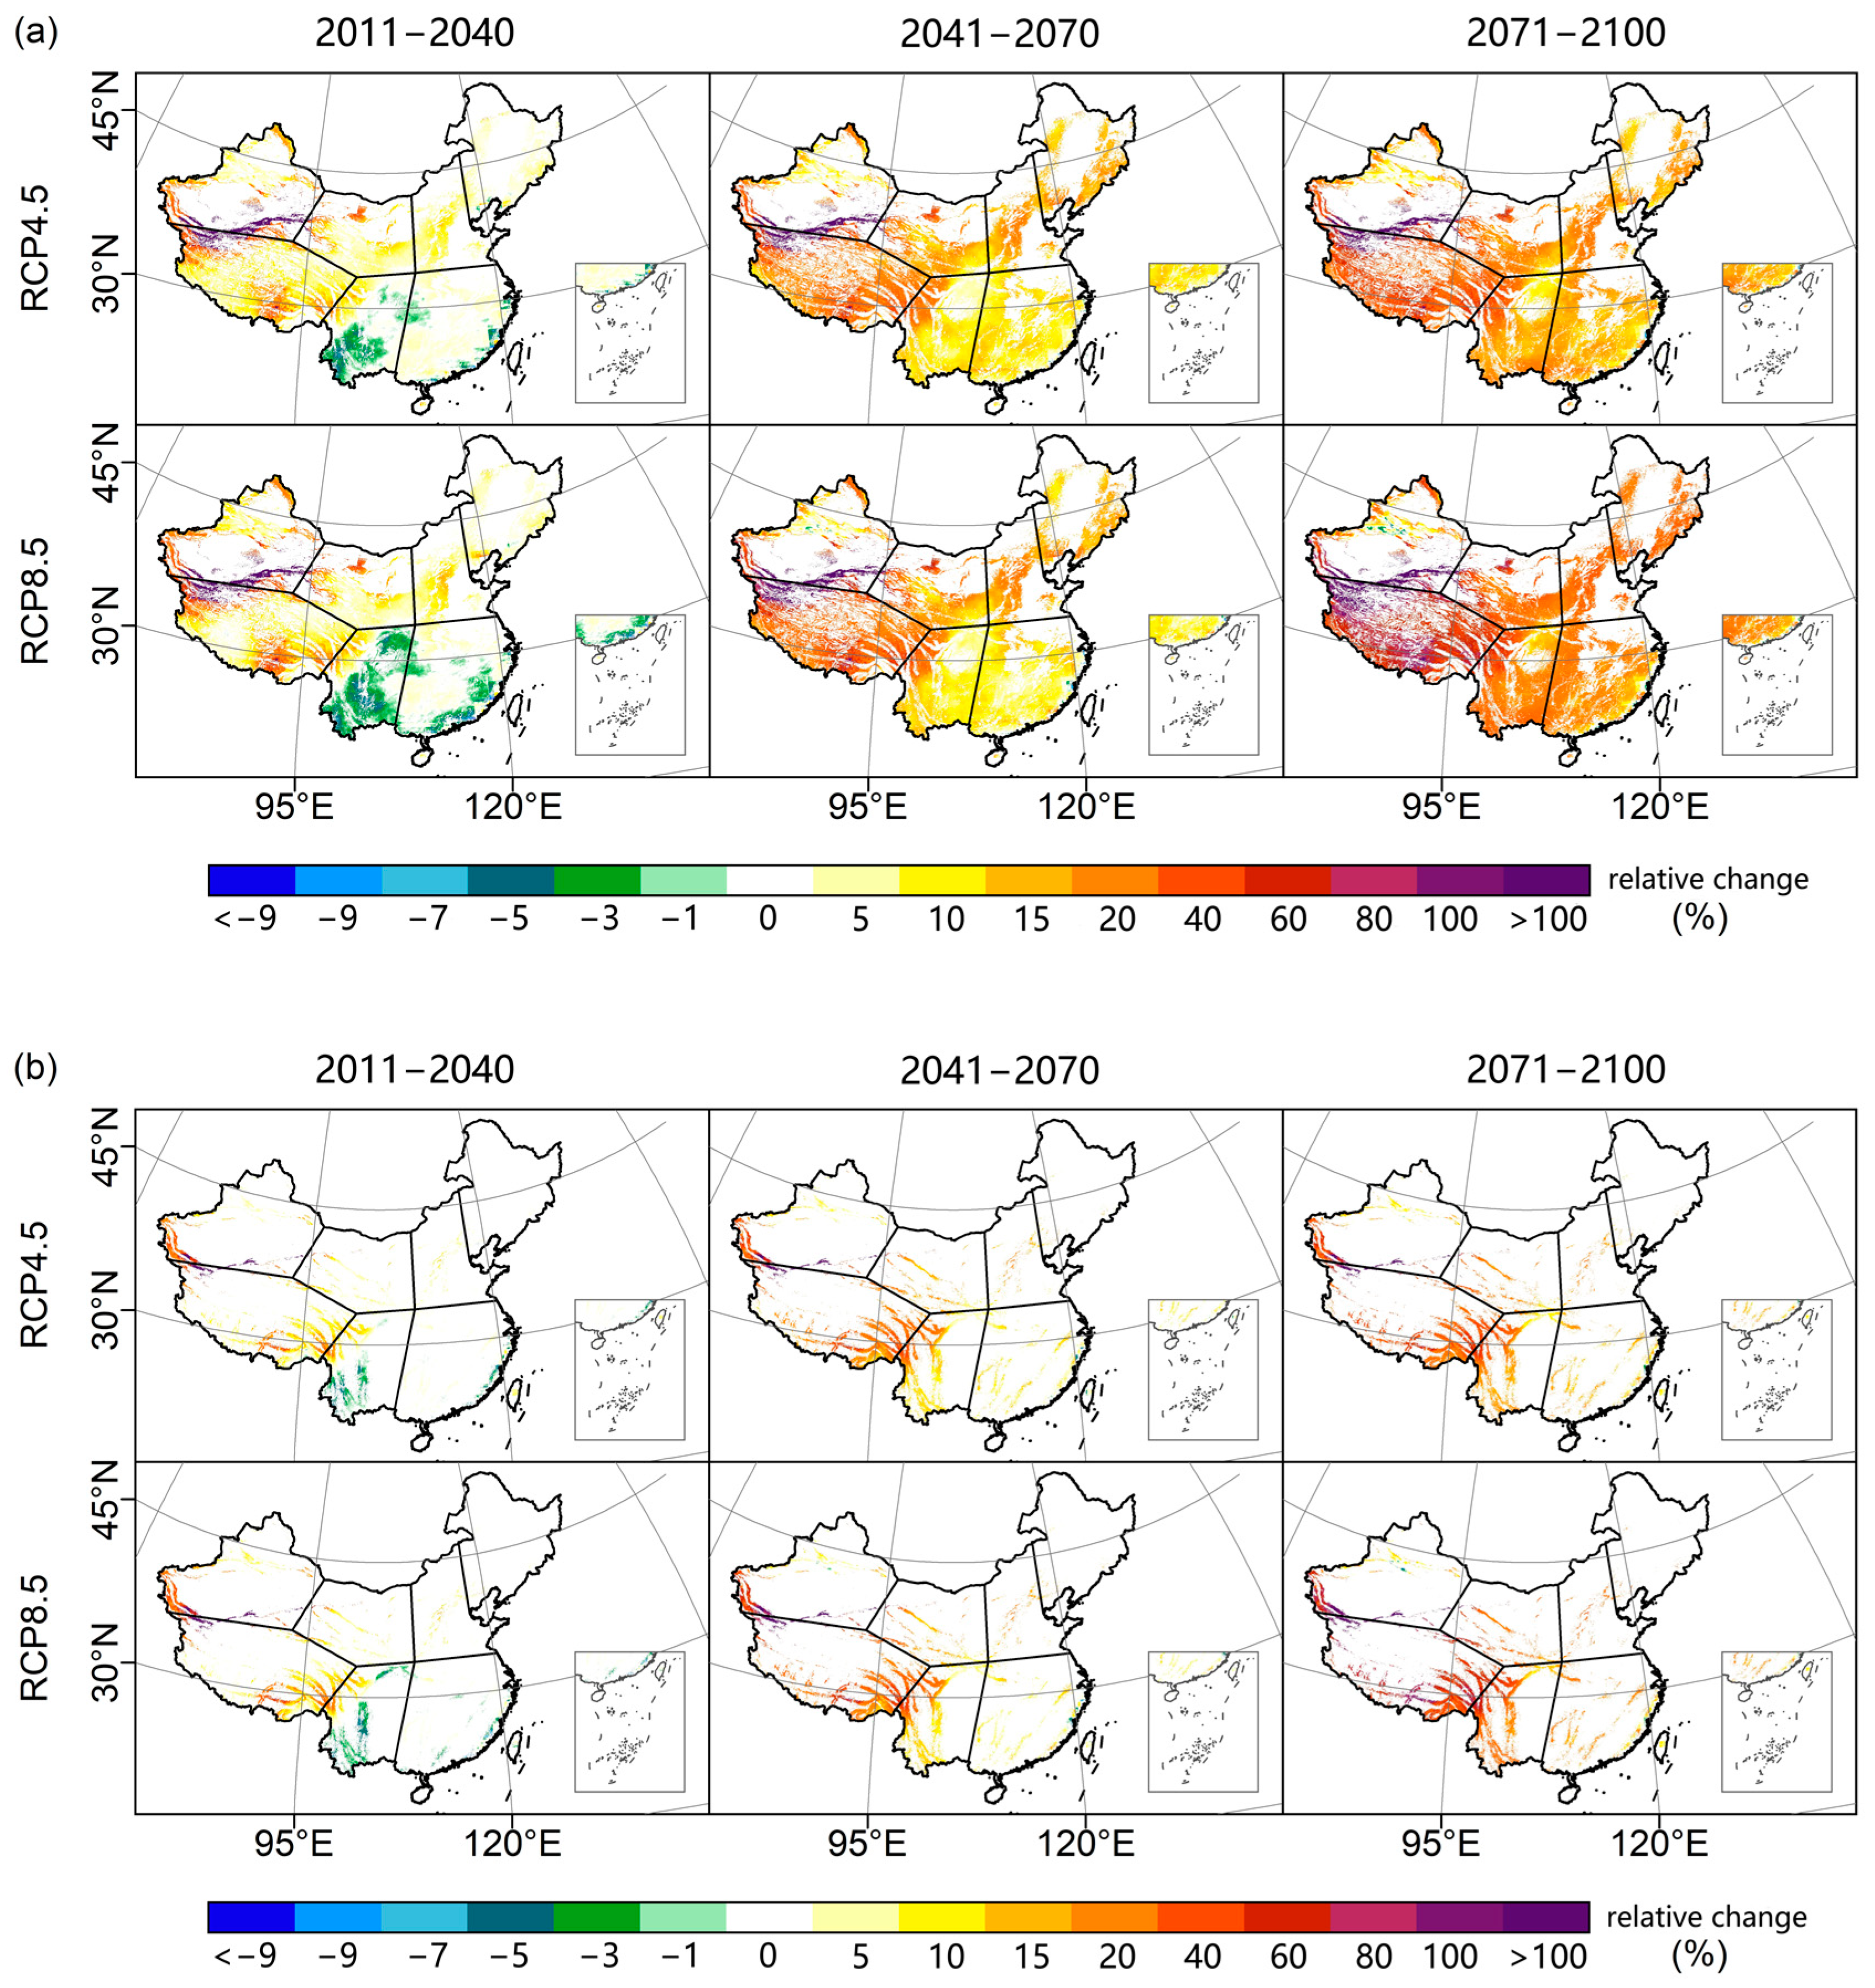
Figure 5.
Seasonal changes in the number of forecasted landslide days and relative changes (relative to 1981–2005) in different periods in various subregions of China.
Figure 5.
Seasonal changes in the number of forecasted landslide days and relative changes (relative to 1981–2005) in different periods in various subregions of China.

Figure 6.
Spatial distribution of SNR and RAS in China in different periods in the future.

Table 1.
Basic information of CMIP5.
| Paradigm | Country | Institution (Abbr.) | Resolution (Grid Points in Latitude × Longitude Directions) |
|---|---|---|---|
| ACCESS1-0 | Australia | CSIRO-BOM | 192 × 145 |
| ACCESS1-3 | Australia | CSIRO-BOM | 192 × 145 |
| CMCC-CM | Italy | CMCC | 480 × 240 |
| CMCC-CMS | Italy | CMCC | 192 × 96 |
| CNRM-CM5 | France | CNRM-CERFACS | 256 × 128 |
| FGOALS-g2 | China | LASG-CESS | 128 × 60 |
| GFDL-CM3 | USA | NOAA-GFDL | 144 × 90 |
| GFDL-ESM2G | USA | NOAA-GFDL | 144 × 90 |
| GFDL-ESM2M | USA | NOAA-GFDL | 144 × 90 |
| INM-CM4 | Russia | INM | 180 × 120 |
| IPSL-CM5A-MR | France | IPSL | 144 × 143 |
| MIROC5 | Japan | MIROC | 256 × 128 |
| MPI-ESM-LR | Germany | MPI-M | 192 × 96 |
| MPI-ESM-MR | Germany | MPI-M | 192 × 96 |
| MRI-CGCM3 | Japan | MRI | 320 × 160 |
| NorESM1-M | Norway | NCC | 144 × 96 |
Table 2.
Average SNR and RAS values of Chinese subdivisions in different time periods.
| China | NEC | NC | SEC | ENWC | SWC | WNWC | TC | |||
|---|---|---|---|---|---|---|---|---|---|---|
| SNR | RCP4.5 | 2011–2100 | 0.44 | 0.43 | 0.40 | 0.37 | 0.47 | 0.36 | 0.62 | 0.53 |
| 2011–2040 | 0.33 | 0.29 | 0.28 | 0.31 | 0.32 | 0.24 | 0.56 | 0.35 | ||
| 2041–2070 | 0.46 | 0.50 | 0.44 | 0.36 | 0.50 | 0.38 | 0.62 | 0.57 | ||
| 2071–2100 | 0.54 | 0.51 | 0.52 | 0.44 | 0.63 | 0.50 | 0.68 | 0.71 | ||
| RCP8.5 | 2011–2100 | 0.50 | 0.51 | 0.47 | 0.38 | 0.57 | 0.42 | 0.70 | 0.65 | |
| 2011–2040 | 0.35 | 0.27 | 0.28 | 0.27 | 0.36 | 0.26 | 0.63 | 0.39 | ||
| 2041–2070 | 0.49 | 0.50 | 0.49 | 0.35 | 0.57 | 0.40 | 0.70 | 0.67 | ||
| 2071–2100 | 0.69 | 0.81 | 0.68 | 0.54 | 0.80 | 0.63 | 0.78 | 0.94 | ||
| RAS (%) | RCP4.5 | 2011–2100 | 59.11 | 51.66 | 59.06 | 50.97 | 63.93 | 61.38 | 69.09 | 66.62 |
| 2011–2040 | 56.75 | 49.00 | 55.52 | 50.76 | 59.14 | 58.50 | 67.36 | 60.22 | ||
| 2041–2070 | 59.10 | 52.89 | 59.76 | 49.83 | 64.42 | 61.09 | 69.18 | 67.62 | ||
| 2071–2100 | 61.86 | 53.53 | 62.48 | 52.35 | 69.03 | 65.02 | 71.02 | 73.09 | ||
| RCP8.5 | 2011–2100 | 61.15 | 53.87 | 61.54 | 51.85 | 67.27 | 63.17 | 71.56 | 71.38 | |
| 2011–2040 | 57.17 | 48.20 | 55.40 | 49.87 | 60.40 | 59.53 | 69.35 | 62.13 | ||
| 2041–2070 | 60.55 | 52.99 | 62.39 | 50.28 | 67.48 | 62.03 | 71.64 | 71.39 | ||
| 2071–2100 | 66.40 | 61.35 | 67.86 | 55.73 | 75.06 | 68.57 | 74.07 | 82.15 |
Disclaimer/Publisher’s Note: The statements, opinions and data contained in all publications are solely those of the individual author(s) and contributor(s) and not of MDPI and/or the editor(s). MDPI and/or the editor(s) disclaim responsibility for any injury to people or property resulting from any ideas, methods, instructions or products referred to in the content. |
© 2023 by the authors. Licensee MDPI, Basel, Switzerland. This article is an open access article distributed under the terms and conditions of the Creative Commons Attribution (CC BY) license (https://creativecommons.org/licenses/by/4.0/).
Share and Cite
MDPI and ACS Style
Chen, Y.; Chen, E.; Zhang, J.; Zhu, J.; Xiao, Y.; Dai, Q. Investigation of Model Uncertainty in Rainfall-Induced Landslide Prediction under Changing Climate Conditions. Land 2023, 12, 1732. https://doi.org/10.3390/land12091732
AMA Style
Chen Y, Chen E, Zhang J, Zhu J, Xiao Y, Dai Q. Investigation of Model Uncertainty in Rainfall-Induced Landslide Prediction under Changing Climate Conditions. Land. 2023; 12(9):1732. https://doi.org/10.3390/land12091732
Chicago/Turabian StyleChen, Yulin, Enze Chen, Jun Zhang, Jingxuan Zhu, Yuanyuan Xiao, and Qiang Dai. 2023. "Investigation of Model Uncertainty in Rainfall-Induced Landslide Prediction under Changing Climate Conditions" Land 12, no. 9: 1732. https://doi.org/10.3390/land12091732
Note that from the first issue of 2016, this journal uses article numbers instead of page numbers. See further details here.