

Measuring the Spatial Match between Service Facilities and Population Distribution: Case of Lanzhou
by
 , ,
, ,
Yanbi Chen
1,2,3,
Zilong Zhang
1,2,4 ,
,
Lixia Lang
1,2,3,
Zhi Long
1,2,3,
Ningfei Wang
1,2,3,
Xingpeng Chen
1,2,3,*,
Bo Wang
5 and
Ya Li
6 1
College of Earth and Environmental Sciences, Lanzhou University, Lanzhou 730000, China
2
Key Laboratory of Western China’s Environmental Systems (Ministry of Education), College of Earth and Environmental Sciences, Lanzhou University, Lanzhou 730000, China
3
Research Institute for Circular Economy in Western China, Lanzhou University, Lanzhou 730000, China
4
Institute of Green Development for the Yellow River Drainage Basin, Lanzhou University, Lanzhou 730000, China
5
CAUPD Beijing Planning and Design Consultants Ltd. (Northwest Branch Office), Lanzhou 730000, China
6
College of Pastoral Agriculture Science and Technology, Lanzhou University, Lanzhou 730000, China
*
Author to whom correspondence should be addressed.
Land 2023, 12(8), 1549; https://doi.org/10.3390/land12081549
Submission received: 7 July 2023
/
Revised: 24 July 2023
/
Accepted: 3 August 2023
/
Published: 4 August 2023
(This article belongs to the Section Land, Biodiversity, and Human Wellbeing)
Abstract
:With rapid urbanization and population growth, achieving equitable distribution of urban facilities in the city center has become a critical research focus due to limited land space and high population density. In this study, we propose a technical method to measure the spatial matching between urban service facilities and population at the grid resolution scale, using Baidu heat map and POI data. The method includes spatial heterogeneity analysis and spatial matching analysis between population density and service facilities. We apply the method to the main urban area of Lanzhou, a valley-type city in the upper reaches of the Yellow River, and measure the spatial matching between service facilities and population aggregation. Our results reveal the distribution characteristics of various service facilities and population aggregation in different time slots, and demonstrate that transportation facilities have the highest spatial matching with population aggregation, followed by real estate and education services, with rental business services exhibiting the lowest. The proposed method offers a new perspective for urban planners and decision-makers to understand the matching state between residents’ activity patterns and service facilities. Our findings can provide theoretical support for urban planning and optimize the layout of service facilities and regional function allocation.
1. Introduction
The provision of service facilities, which are a critical component of urban social infrastructure supporting residents’ daily life, encompasses various public goods and services such as educational, medical, transportation, recreational, and commercial facilities [1,2]. Optimizing their spatial distribution is essential for enhancing the quality of life and ensuring the equitable distribution of services [2,3,4,5]. However, spatial inequity in service provision has emerged in the past decades due to population growth and rapid urbanization [6,7,8], necessitating adjustments in service facilities’ unbalanced structure. Scientifically evaluating the relationship between the supply and demand of facilities is a necessary analytical tool for promoting sustainable urban development [9,10,11,12,13,14,15] and informing facility allocation decisions [16,17]. In this study, we propose a methodological framework and a novel index for visually analyzing the spatial matching degree between the distribution of urban service facilities and dynamic population patterns based on Baidu heat map and POI data. Our research objectives are to comprehend the spatiotemporal distribution of population aggregation and spatial matching with urban service facilities, and to provide insights for planners to examine urban development and plan service facilities.
People are the primary actors of activities in urban spaces, and evaluating the spatial congruence between the population and service facilities provides a better perspective for improving the spatial configuration of cities [18]. Prior research on service facilities has tended to focus on location choice and land use structure [19,20], equity and accessibility [21,22], and residents’ satisfaction with services [23,24]. Considerable research has been conducted on the spatial effect of population and the mechanisms of population density on service facilities [25,26,27,28]. These studies have revealed a mismatch between population and service facilities in cities. However, little literature addresses the detailed spatiotemporal features of human activities on holidays and weekdays [29], and few recent studies have employed a systematic approach for measuring spatial matching between population and service facilities [8,9,17].
Previous research on the evaluation of the spatial matching between population and service facilities has primarily relied on survey or statistical data, which fail to reflect the genuine characteristics of population activities in urban areas. However, recent advances in big data and mobile technologies have significantly expanded the range of methodologies available for urban research. The chief benefit of big data is that it enables a more comprehensive description of the spatiotemporal behaviors of urban residents at different scales, with a focus on cost–efficiency, convenience, and time optimization [30,31,32,33,34]. Baidu heat map and POI data have been widely applied to a range of urban research topics, including urban functional area identification [35,36,37], urban environmental assessment [38,39], spatial analysis of urban facilities [40,41], and the equity and accessibility [42,43].
In contrast, our study employs a systematic approach for measuring spatial matching between population and service facilities. By utilizing Baidu heat map and urban POI data, we propose a methodological framework and a novel index for visually analyzing the spatial matching degree between the distribution of urban service facilities and dynamic population patterns. To achieve this, we develop a coupling model between service facilities and population activities, investigating their coordinated characteristics [44]. To further quantify the coupling coordination relationship between service facilities and population aggregation, we introduce the Population Aggregation and Service Facilities Matching Index (PSMI) by utilizing the weighted heat effect index. It provides a more accurate method to evaluate the frequency and coverage of various service facilities, and provides a more scientific basis for urban planning and management.
2. Data and Methodology
2.1. Study Area
China has experienced a rapid increase in urbanization, rising from 11.18% in 1950 to 65.22% in 2022 (National Bureau of Statistics of China, http://www.stats.gov.cn, accessed on 18 February 2023), with a projected urbanization rate of 75.8% by 2050 according to the World Urbanization Prospects. This trend has fundamentally transformed the internal structure of cities and generated a higher demand for service facilities, leading to significant variations in the supply and demand of such facilities. As a representative provincial capital in the underdeveloped northwestern region of China, Lanzhou still faces challenges such as urban land resource shortages and uncoordinated space allocation of facilities. By selecting the city center of Lanzhou as the research area, the matching situation of service facilities and population distribution in an underdeveloped area can be preliminarily identified and explained, thus providing a foundation for further research.
Lanzhou is located in the transition zone between the Qinghai–Tibet Plateau and the Loess Plateau, with an altitude of approximately 1520 m and covers an area of 13,100 km2. It serves as the political, cultural, economic, scientific, and educational center of Gansu, as well as an essential node city of the Silk Road Economic Belt and an significant industrial base and transportation hub in the northwest region of China. The present study employed the dataset of urban built–up areas in China [45] to investigate the built–up area in the central urban region of Lanzhou, covering five districts: the Chengguan, Qilihe, Anning, Xigu, and Yuzhong County (Figure 1). By the end of 2020, Lanzhou had a registered population of 3.34 million, among which the urban population was 2.46 million, with a built–up area of 366.84 km2 and the gross regional product was 288.674 billion yuan, where the tertiary industry accounted for 65.68%.
2.2. Data Sources
2.2.1. Urban POI Data
The data pertaining to points of interest (POIs) include various attributes such as name, address, type, latitude, and longitude. For this study, the POI data was sourced from Baidu Maps (https://map.baidu.com, accessed on 24 July 2019). The POI data obtained from Baidu Maps are grouped into 22 distinct categories, with each category containing multiple subcategories. We classified the POI data collected, in accordance with the classification standards of the National Economic Industry Classification and Code (GBT4754-2017), into 11 categories (refer to Table 1). The final dataset consisted of 138,937 POIs, which were extracted after screening, deduplication, spatial matching, and other relevant operations conducted on the internal active service facilities within the study area.
2.2.2. Baidu Heat Map
In accordance with the principle of excluding times with extreme weather, holidays, or special events, the Baidu heat map data was collected for the study area on 17 May 2020 (Sunday) to represent the weekend and on 18 May 2020 (Monday) to represent workdays. It is important to note that the impact of the COVID-19 pandemic on the data used in our study is likely to be minimal. During the population activity period, spanning from 7:00 to 24:00, the heat map data was collected every 3 h, resulting in a total of 14 heat maps. The fourth band of the data was loaded into the ArcGIS 10.1 software, and the natural breakpoint method was employed for the reclassification and assignment based on the thermal value, which was divided into 7 grades ranging from 1 to 7.
2.3. Research Methods
Figure 2 depicts the flowchart of the proposed spatial matching method. The method involves three primary processes: data preparation and processing, analysis of the spatial distribution of population and facilities, and coupling coordination degree between facilities and population.
2.3.1. Kernel Density Estimation
Kernel density estimation (KDE), which was originally proposed by Rosenblatt and Emanuel Parzen, is a method used to estimate the density of unknown points by means of a non–fixed function based on known points. Given the sample points x1, x2, …, xn, the core estimation is used to simulate the detailed distribution of the variable attribute data. Kernel density analysis was employed to calculate the density values of spatial point and line features in neighborhoods, simulating the continuity of the density distribution [46,47], as follows:
where f(s) is the kernel density calculation function at spatial location s; h is the distance attenuation threshold; n is the number of feature points whose distances from location s are less than or equal to h; and k is the spatial weight function. The geometric meaning of this formula is that the density value is the largest at each core element , and it continues to decrease with increasing distance from until the distance from reaches the threshold h and the kernel density value drops to 0. In the present study, values of 1000 m, 500 m, and 300 m were employed as h, and the results obtained with a 500 m search radius were able to accurately characterize the overall spatial characteristics of POI points.
2.3.2. Data Gridding and Overlay
The research area focuses on the urban district and county scale. To avoid spatial homogenization and information redundancy, a 200 m × 200 m grid was selected as the statistical unit [48]. The thermal map data and the POI kernel density estimation results were subjected to spatial gridding. Subsequently, the spatial aggregation characteristics of the population during different time periods in Lanzhou were analyzed, along with differences in the spatial distribution of various POIs.
In this study, all of the Baidu heat maps for a time period were superimposed and aggregated to represent the distribution of the population aggregation in this time period [49], following the equation:
where is the average value during a certain period; is the value during the nth period of the day; and N is the number of heat maps for this period.
2.3.3. Population Aggregation and Service Facilities Matching Index
The coupling coordination degree model can reasonably measure the correlation between systems. The coupling coordination degree model was used to reflect the coordination between the two systems of urban population aggregation and the distribution of the service facilities density. Based on the capacity coupling coefficient model in physics, a coupling degree model was developed [50], which is expressed as follows:
where C is the coupling degree, and the value range is [0, 1]. The larger the value is, the higher the coupling between the degree of population aggregation and the spatial distribution of the service facilities is. is the degree of population aggregation after normalization, and is the density of the service facilities after normalization.
The degree of coupling can reflect the degree of interaction between systems, but it cannot reflect the relative levels of the two. For example, when the population concentration and service facilities density are both at a low level, the coupling degree is at a high level. Therefore, it is necessary to establish a model of evenness and coordination [51].
where D is the coupling coordination degree between the urban population aggregation and the distribution of service facilities; and T is the comprehensive coordination index of the population aggregation and the distribution of service facilities, which reflects the overall synergistic effect of the population aggregation and the distribution of service facilities. a and b are undermined coefficients. In this study, it is assumed that the population and service facilities are equally important; so, a = b = 0.5. The higher the coupling coordination degree D is, the stronger the coordination is, and vice versa. According to Ma (2013) [52] and Lv (2016) [51], the coupling coordination degree in Table 2 is classified into four levels.
By quoting and converting the weighted heat effect index [53], we constructed index Population–Service Match Index (PSMI) to describe the spatial match of population and service facilities. This index considers the overall average coupling coordination degree as the standard coupling coordination degree, and the sum of the coupling coordination indicators in the study area is zero, which means that the average coupling coordination degree of the region is achieved under the net effect of the positive and negative effects. The PSMI index quantitatively characterizes the coupling and coordination relationship between each service facility and the urban population density. Given a set with I types of service facilities, PSMI = {PSMIi|i = 1 … I}, as follows:
where A is the total area of the region, is the distribution area of service facility type i in coupling coordination level j, is the average coupling coordination degree of the region, and is the average coupling coordination degree of service type i in coupling coordination level j.
3. Results
3.1. Spatiotemporal Trend of Urban Population Density
3.1.1. Characteristics of the Temporal Evolution of Urban Population Density
The study utilized the natural breakpoint classification to characterize the population aggregation intensity. High–aggregation areas were defined as those with heatmap values of 6 and 7, while sub–aggregation areas were those with values of 4 and 5. Proportions of population activity were computed for seven time points on both workdays and weekends, and significant temporal variations were observed (Figure 3). On workdays, population activity was lowest at 7:00 a.m. Between 7:00 and 9:00, both high–aggregation and sub–aggregation areas increased, and population activity intensity rapidly rose, reaching its first peak, marking the regularity of the morning peak for work. The working period (9:00–12:00) saw people gathering at workplaces, leading to a decrease in the proportion of sub–aggregation areas. Between 12:00 and 18:00, there was little fluctuation. After 18:00, most people got off work, went home for meals, went shopping, or engaged in other activities, which decreased the proportion of high–aggregation areas, while the proportion of sub–aggregation areas began to increase.
Weekends exhibited greater demographic activity fluctuations than workdays. At 7:00 a.m., population activity intensity was at its lowest point and was much lower than that at 24:00. At 9:00 a.m., high–aggregation areas remained at a low value, while sub–aggregation areas reached the first peak, and population activity intensity gradually increased. At 12:00 p.m., secondary gathering areas peaked throughout the day, and at 18:00, high gathering areas reached the highest value of the day. The proportion of high–aggregation areas during the day was generally lower on weekends than on workdays. People on workdays were restricted by working hours and location, resulting in higher proportions of high–aggregation areas than on weekends. After 9:00 a.m., the proportion of sub–aggregation areas was generally higher on weekends than on workdays. This is likely because there were no strong time constraints for commuting or going to school on weekends compared to workdays. People were more willing to travel at later times and participate in a wider range of activities, resulting in a higher proportion of sub–aggregation areas on weekends than on workdays.
3.1.2. Spatial Distribution Characteristics of Urban Population Density
In this study, the urban population density data were analyzed using Equation (2), which classified the data into three time periods: morning (7:00–12:00), afternoon (12:00–18:00), and evening (18:00–24:00) (Figure 4). The names and locations labeled as 1–10 in the figure represent the areas with high population density in the study region, which we identified using a heat map obtained from Baidu. We hypothesized that the aggregation degree is related to these representative places. Overall, these ten points have different characteristics and importance in terms of location, aggregation, and economic significance. Xiguan, Dongfanghong Square, Railway Station, Wulipu, Industry and Trade Building, Xizhan, Jinniu Street, and Hongsheng Square are all major commercial and high–foot–traffic areas in Lanzhou, while the High–tech Zone and Yantan are emerging areas in technology, high–end residential, and consumption, with important economic and social values.
The population activity was found to be the weakest in the morning, with high concentration areas being smaller and more dispersed on weekends compared to workdays. On weekends, high concentration areas were mainly located in the Chengguan and Qilihe districts. In the afternoon, the population activity peaked, and the high concentration areas were found in patches in the Chengguan and Qilihe districts, as well as in spots in the Anning and Xigu districts. Areas with high employment density, such as the Chengguan High–tech Zone and Industrial and Trade Buildings, had significantly lower heat levels on weekends than on workdays. On the other hand, areas with a high functional mix and convenient transportation, such as Xiguan and Xizhan, had higher travel density on weekdays than on weekends. Moreover, the Yantan Business District had a higher travel density on weekends due to the presence of multiple shopping and retail centers and green parks. In the evening, the intensity of population activity decreased significantly, and the distribution of high concentration areas was similar to that in the afternoon, but with a much smaller area.
3.2. Spatial Distribution Characteristics of Urban Service Facilities
A kernel density analysis was performed to obtain the kernel density distribution of service facilities in the study area (Figure 5). The spatial pattern of service facilities in the study area showed a northwest to southeast trend, with higher density in the east and lower density in the west. The overall pattern formed a circular structure, with Xiguan and Wulipu identified as the core area, and density decreasing from the center to the periphery. Small gathering centers were found in Dongfanghong and Yantan, while multiple gathering centers existed in locations such as Xizhan, Jinniu Street, and Hongsheng Square, forming a center–periphery structure with dense interior and sparse exterior.
Based on the kernel density distribution of various service facilities (Figure 6), three categories of distribution types were identified. (a) Results from the kernel density analysis for real estate management services (RM), medical services (MS), accommodation and catering services (AC), education services (E), and banking/finance services (BF) were similar, with contiguous massive aggregation occurring around the core area of the Chengguan District, and punctuated non–contiguous aggregations in the periphery. In addition, Xizhan in the Qilihe District, Jinniu Street in the Anning District, Hongsheng Square in the Xigu District, and the southern part of Yuzhong County contained clear aggregation centers. (b) Leasing and business services (LB), community living services (CL), wholesale and retail trade services (WR), and entertainment services (ES) formed a few clustered areas in the core area, but the contiguous area was small, and clustering characteristics in the surrounding counties were not obvious. (c) Transportation, storage, and postal services (TS) and information and technology services (IT) were clustered in a point–like manner within the study area. Fewer high–value points were found for transportation services compared to information technology services, and the overall spatial distribution of the two was relatively uniform compared to other facilities.
3.3. Spatial Coupling Relationship between Urban Population Density and Service Facilities
3.3.1. Analysis of the Match Degree
Formulas (3)–(5) were utilized to compute the degree of coupling coordination between urban population density and service facilities. Based on the work of Ma (2013) and Lv (2016) [51,52], we classified the results into four types: low–level coordination, medium coordination, good coordination, and extreme coordination, using a gradient of 0, 0.3, 0.5, 0.8, and 1. The classification results were visualized using a color map, where each color represents a different degree of coupling. Figure 7 presents the coupling coordination degree map of the overall service factor and population density. There was a significant spatial differentiation in the coupling coordination between the population activities and service facilities in the main urban area of Lanzhou, with high coordination in the middle and low coordination in the surrounding areas, which decreased from inside to outside. The areas of extreme coordination mainly formed three centers in the Chengguan District, Qilihe District, and Xigu District, corresponding to the core urban commercial areas. The good coordination area mainly revolved around the three central peripheries formed by the extreme coordination areas, followed by the Anning District and the central part of Yuzhong County, which was the transitional area between the commercial core area and the periphery. The medium coordination areas were distributed in a ring or as points on the periphery of the good coordination areas, which was the transition area between the central area of the city and the suburbs. The low–level coordination areas were distributed in the outermost part of the built–up area, and most were located in the suburbs.
Figure 8 showed the coupling characteristics of each service facility, which were similar to the overall service facility. Based on the three categories described in Section 3.2, (a) the extreme coordination areas of the service facilities and population density were mainly concentrated in the Chengguan District, Qilihe District, and Xigu District. Among them, the RM and MS were significantly larger in the extreme coordination areas in the Qilihe District, while the AC and E had larger areas in the extreme coordination areas in the Anning District. The area of the extreme coordination area for the (b) service facilities was smaller than that of type (a) and was mainly distributed in the Chengguan District and Qilihe District. Among them, the WR, CL, and ES formed a point–like extreme coordination area in the Xigu District, and the Anning District also contained a coupling center of the ES. In the type (c) service facilities, the IT extreme coordination areas formed a point–like non–contiguous distribution in various counties, while the TS was mainly located in the good coordination areas.
The reason for this pattern may be that the Chengguan District was located at the center of Lanzhou, making it the traditional commercial center, the tourism and cultural center, the high–tech research and development center, and the provincial administrative center. Therefore, the coupling between the various services and the population is the best in the Chengguan District. As the sub–center of the city, the Aning–Qilihe core area undertakes the functions of science and education innovation, business, and accommodation of the old town. Based on Lanzhou Petrochemical, the Xigu District carries a large number of manufacturing functions, attracting a large number of people and leading to the development of services such as real estate, food and accommodations, education services, and entertainment services.
3.3.2. PSMI of Various POIs
The PSMI method was used to measure the coupling state of urban population density and 11 types of service facilities in the main urban area of Lanzhou in each time period. As shown in Table 3, the PSMI values of different service facilities were significantly different, with TS having the highest PSMI, followed by RM and E. These service facilities interacted with and influenced urban population density more strongly, especially transportation services. However, the coupling coordination index of AC, WR, BF, ES, and LB had negative values, indicating that the degree of mutual promotion between them and the urban population density was relatively weak.
Furthermore, the PSMI values of the service facilities varied in the different time periods. In the morning, except for BF, the PSMI values of the other service facilities were higher on workdays than on weekends. In the afternoon, the PSMI values of WR, IT, RM, E, and ES were higher on weekends than on workdays. In the evening, the PSMI values of the WR, TS, RM, and ES were higher on weekends than on workdays. These findings suggest that the interaction between population density and service facilities varies across different service types and time periods, which has important implications for urban planning and service provision.
4. Discussion
4.1. Methodological Contributions
Previous studies on the coupling between population and the service facilities have primarily relied on statistical yearbook data or census data to obtain population data [54]. However, using such data may result in inaccuracies when attempting to describe the spatial distribution of the population. Moreover, there is a dearth of small–scale studies within cities. With the availability of big data, such as network platform data, mobile phone signal data, and bus card swiping data, researchers can now explore the relationship between the development of service facilities and population activities. For instance, Li, J. and Li, W. [55] demonstrated that Baidu heat maps can accurately depict population distribution in a region.
In this study, a quantitative method was developed to analyze the coupling and coordination characteristics of crowd activities and service facilities. This method utilized the Baidu heat map and POI data and provides a feasible and replicable means of studying the matching between urban service facilities and populations. Compared with previous studies, our method has several advantages. Firstly, we used a data–driven quantitative description method to obtain the dynamic pattern of the population in each grid on the Baidu heat maps for 17–18 May 2020 and to describe the distribution of the service facilities based on 138,937 POIs. Secondly, unlike previous studies which used multiple regression models to explore the factors affecting the urban population distribution characteristics, we transformed the Population–Service Match Index (PSMI) using the weighted thermal effect index to quantify the coupling and coordination relationship between various service facilities and the urban population distribution characteristics.
4.2. Characteristics of Coupling Coordination Degree
The study investigated the spatiotemporal changes in the distribution of urban population density between workdays and weekends. Results indicated significant differences between the two time periods. The smallest aggregation on both workdays and weekends occurred in the morning. The duration of crowd gathering was shorter on weekends than on weekdays, and there were lag and delay factors. This finding was consistent with previous studies [55,56,57]. Residents traveled more freely on weekends, but they woke up later on weekends, resulting in the first peak in activity at 12:00, with significant peaks at 18:00 and 21:00 on weekends. In contrast, the timing of people’s activities on workdays was influenced by cyclic activities such as commuting and going to school, resulting in a high degree of gathering from 9:00 to 21:00.
From a spatial perspective, the distribution of population aggregation exhibited the characteristics of multi–center aggregation and spreading along the main road. The high–aggregation areas on weekends and workdays were mostly in the same locations, but the population distribution was relatively scattered on weekends. This finding contradicts the results of a study conducted in Shanghai [49]. However, studies conducted in Shehong County, Guangzhou, and Wuhan have shown that high–aggregation areas overlap on weekends and workdays [56,57,58]. Comparing the differences in population activities during peak periods on weekends and workdays, high–aggregation areas on workdays were relatively compact, and the proportion of sub–aggregation areas was lower than that on weekends, indicating that the traffic congestion was more serious on weekdays. The results indicate uneven development of the planned center on the periphery of the central activity area. The distribution of service facilities such as wholesale and retail services, comprehensive services for residents, and medical services in Xigu District and Anning District was relatively unbalanced, while the service facilities in the Qilihe District and Chengguan District were relatively more complete.
Using the coupling coordination degree index, we explored the coupling coordination relationship between the distribution of the urban population density during different time periods and the service facilities. The results revealed an unbalanced spatial distribution of coupling coordination between population activities and service facilities in the main urban area, with high coupling in the middle and low coupling in the surrounding areas, decreasing from the inside to the outer ring. TS, RM, and E exhibited the strongest coupling with population activity.
From the temporal perspective, crowd activities on workdays mainly revolved around work and rest activities. People went to work around 9:00 a.m., resulting in greater crowd gathering than weekends; thus, the PSMI values of the various facilities were also higher than on weekends. As the afternoon was the main working time, the intensity of population activity reached the highest level of the day, resulting in the highest PSMI values of the day at workplaces such as the TS, BF, WR, and LB. In the evening, people finished work, and the PSMI values of AC, RM, and CL increased. On weekends, people had more free time and participated in more casual activities. On weekends, people traveled later in the morning, resulting in lower PSMI values in the morning. In the afternoon and evening, residents had more free time for shopping, entertainment, and other activities, resulting in higher PSMI values for WR, ES, and RM.
4.3. Implications
Optimizing the spatial distribution of the urban population and promoting the healthy development of the service facilities are crucial in improving quality of life of residents, optimizing the urban spatial structure, and alleviating urban problems. Our study has developed methods for monitoring and evaluating the spatial arrangement of service facilities, as well as their coupling and coordination with the population. This method can be applied to urban planning and policy making to optimize the distribution of service facilities and improve the accessibility and quality of urban services. For example, it can help decision–makers to identify areas with low levels of service facility provision that require investment and development. Furthermore, the method can be used to evaluate the effectiveness of urban development policies and to monitor the impact of changes in the spatial arrangement of service facilities on population distribution and urban sustainability. This provides urban planners and policy–makers with a more precise understanding of residents’ activity patterns and service facilities, which can improve public transportation services and the local functional configuration. Compared with existing methods, our method has higher accuracy and reliability, providing more accurate data support for policy making and planning. Additionally, the methodological framework can serve as a model for evaluating the development level of rapid urbanization service facilities and related factors.
Based on the results of this study, we propose the following suggestions for Lanzhou to optimize its urban spatial structure and rationally allocate resources: Improve the urban multi–center space development system. To address the issue of unbalanced spatial development, Lanzhou could strengthen the core driving role of Chengguan District and Anning–Qilihe District and make up for the lack of central development forces. Strengthen guidance and support for resource allocation in underserved areas. Our study revealed that certain areas of the city have poor configuration of commercial, educational, and medical facilities. To address this issue, Lanzhou should provide guidance and support for resource allocation in these areas to promote the coordinated development of various service industries in the city. This would improve the level of livability and workability in the city and promote more equitable access to services for all residents.
4.4. Limitations and Future Research Prospects
In terms of limitations, our study has several potential issues. Firstly, the data collection period was limited to focusing on the difference between workdays and weekends in May during the COVID-19 pandemic. This may not fully reflect the characteristics of urban service facilities and population density in different seasons, holidays, and other situations. Additionally, the data source we used does not provide accurate information about individual activities, such as age, gender, and occupation, which could affect the spatial matching analysis. Secondly, the Baidu heat map used in our study has limitations in that the specific definition of heat is not provided, and the heat maps obtained at different scales may vary. However, future studies could consider using other data sources or conducting more extensive data collection to further validate our findings. Despite these limitations, we believe that our study provides valuable insights into the spatial matching between population and service facilities. We hope that future studies can build upon our work to further explore and improve the spatial matching between population and service facilities.
To address these limitations, further research can be carried out in the following two aspects:
- Using data sources with more demographic information, such as mobile phone signals, to explore the characteristics of urban population aggregation.
- Analyzing and comparing the population aggregation characteristics throughout the year, including holidays, based on the results of this research.
- Future studies could incorporate additional variables to better understand the factors that affect the spatial matching, such as land use, transportation, and socioeconomic status.
5. Conclusions
In conclusion, this study has developed a methodological framework to quantitatively analyze the spatial matching between service facilities and population activities in Lanzhou using Baidu heat map data and service facility POI data. The combination of kernel density, grid overlay, gridding, and PSMI methods provided a more comprehensive and accurate understanding of the spatial distribution of service facilities and population aggregation. The key findings of this study indicate that population aggregation in Lanzhou was higher on workdays than on weekends, and service facilities were unevenly distributed in the city, with a concentration in the eastern region. The transportation facilities had the highest PSMI, followed by real estate services and education services, while the rental business services had the lowest PSMI. The coupling between service facilities and population aggregation varied spatially, with good coordination in the urban commercial core area and transition area, and a state of imbalance in the urban fringe area.
Furthermore, this study highlights the potential of using Baidu heat map data and service facility POI data in urban research, providing a more accurate and efficient approach to understanding the spatial matching between service facilities and population activities. Additionally, this study demonstrates the value of using open–source software, such as QGIS and R, for spatial analysis in urban research, which can reduce research costs, facilitate data sharing and transparency, and promote greater collaboration among researchers and practitioners.
Overall, this study contributes to the understanding of the spatial distribution of service facilities and population activities in Lanzhou, providing valuable insights for urban planning and management. Future research can build upon the proposed methodological framework to analyze the spatial matching of service facilities and population activities in other cities and regions.
Author Contributions
Conceptualization, Y.C. and Z.Z.; methodology, L.L.; software, Y.C.; validation, Z.L. and N.W.; formal analysis, Z.Z., L.L. and Y.C.; data curation, N.W. and B.W.; writing—original draft preparation, Y.C., Z.Z., L.L. and Z.L.; writing—review and editing, X.C., Y.L. and Y.C.; visualization, Y.C. and Y.L.; supervision, X.C.; funding acquisition, Z.Z. All authors have read and agreed to the published version of the manuscript.
Funding
This research was funded by the National Natural Science Foundation of China (Grant No. 72050001).
Data Availability Statement
Not applicable.
Conflicts of Interest
The authors declare no conflict of interest.
References
- Wang, S.; Zheng, S.; Feng, J. Spatial accessibility of housing to public services and its impact on housing price: A case study of Beijing’s inner city. Prog. Geogr. 2007, 26, 78–85. [Google Scholar]
- Chang, F.; Wang, L.; Ma, Y.; Yan, C.; Liu, H. Do urban public service facilities match population demand? Assessment based on community life circle. Prog. Geogr. 2021, 40, 607–619. [Google Scholar] [CrossRef]
- Witten, K.; Exeter, D.; Field, A. The Quality of Urban Environments: Mapping Variation in Access to Community Resources. Urban Stud. 2003, 40, 161–177. [Google Scholar] [CrossRef]
- Wang, D.; Brown, G.; Liu, Y.; Mateo-Babiano, I. A Comparison of Perceived and Geographic Access to Predict Urban Park Use. Cities 2015, 42, 85–96. [Google Scholar] [CrossRef]
- Zhan, Y.; Sui, L.; Wang, M.; Huang, J.; Zhu, J.; Chen, D.; Fan, J. Multiperspective Evaluation Model for the Spatial Distribution of Public Service Facilities Based on Service Capability and Subjective Preferences. J. Urban Plan. Dev. 2022, 148, 04022015. [Google Scholar] [CrossRef]
- Jones, K.; Kirby, A. Provision and Wellbeing: An Agenda for Public Resources Research. Environ. Plan. A 1982, 14, 297–310. [Google Scholar] [CrossRef]
- Kirby, A.; Knox, P.; Pinch, S. Developments in Public Provision and Urban Politics: An Overview and Agenda. Area 1983, 15, 295–300. [Google Scholar]
- Taleai, M.; Sliuzas, R.; Flacke, J. An Integrated Framework to Evaluate the Equity of Urban Public Facilities Using Spatial Multi-Criteria Analysis. Cities 2014, 40, 56–69. [Google Scholar] [CrossRef]
- Chang, H.-S.; Liao, C.-H. Exploring an Integrated Method for Measuring the Relative Spatial Equity in Public Facilities in the Context of Urban Parks. Cities 2011, 28, 361–371. [Google Scholar] [CrossRef]
- Dadashpoor, H.; Rostami, F.; Alizadeh, B. Is Inequality in the Distribution of Urban Facilities Inequitable? Exploring a Method for Identifying Spatial Inequity in an Iranian City. Cities 2016, 52, 159–172. [Google Scholar] [CrossRef]
- Deng, C.; Wu, C.; Wang, L. Improving the Housing-Unit Method for Small-Area Population Estimation Using Remote-Sensing and GIS Information. Int. J. Remote Sens. 2010, 31, 5673–5688. [Google Scholar] [CrossRef]
- Li, H.; Wang, Q.; Shi, W.; Deng, Z.; Wang, H. Residential Clustering and Spatial Access to Public Services in Shanghai. Habitat Int. 2015, 46, 119–129. [Google Scholar] [CrossRef]
- Omer, I. Evaluating Accessibility Using House-Level Data: A Spatial Equity Perspective. Comput. Environ. Urban Syst. 2006, 30, 254–274. [Google Scholar] [CrossRef]
- Seyedashraf, O.; Bottacin-Busolin, A.; Harou, J.J. A Design Framework for Considering Spatial Equity in Sustainable Urban Drainage Infrastructure. Sustain. Cities Soc. 2022, 85, 103960. [Google Scholar] [CrossRef]
- Tahmasbi, B.; Mansourianfar, M.H.; Haghshenas, H.; Kim, I. Multimodal Accessibility-Based Equity Assessment of Urban Public Facilities Distribution. Sustain. Cities Soc. 2019, 49, 101633. [Google Scholar] [CrossRef]
- Smoyer-Tomic, K.E.; Hewko, J.N.; Hodgson, M.J. Spatial Accessibility and Equity of Playgrounds in Edmonton, Canada. Can. Geogr./Le Géogr. Can. 2004, 48, 287–302. [Google Scholar] [CrossRef]
- Tsou, K.-W.; Hung, Y.-T.; Chang, Y.-L. An Accessibility-Based Integrated Measure of Relative Spatial Equity in Urban Public Facilities. Cities 2005, 22, 424–435. [Google Scholar] [CrossRef]
- Chen, Y.; Hu, Y.; Lai, L. Demography-Oriented Urban Spatial Matching of Service Facilities: Case Study of Changchun, China. Land 2022, 11, 1660. [Google Scholar] [CrossRef]
- Teitz, M.B. Toward a Theory of Urban Public Facility Location. Papers of the Regional Science Association; Springer: Berlin/Heidelberg, Germany, 1968; Volume 21, pp. 35–51. [Google Scholar]
- Niu, S.; Hu, A.; Shen, Z.; Lau, S.S.Y.; Gan, X. Study on Land Use Characteristics of Rail Transit TOD Sites in New Towns—Taking Singapore as an Example. J. Asian Archit. Build. Eng. 2019, 18, 16–27. [Google Scholar] [CrossRef] [Green Version]
- Berry, D.; Steiker, G. The Concept of Justice in Regional Planning: Justice as Fairness. J. Am. Inst. Plan. 1974, 40, 414–421. [Google Scholar] [CrossRef]
- Reyes, M.; Páez, A.; Morency, C. Walking Accessibility to Urban Parks by Children: A Case Study of Montreal. Landsc. Urban Plan. 2014, 125, 38–47. [Google Scholar] [CrossRef]
- Song, X.; Deng, W.; Liu, Y.; Zhao, C.; Wan, J. Residents’ Satisfaction with Public Services in Mountainous Areas: An Empirical Study of Southwestern Sichuan Province, China. Chin. Geogr. Sci. 2017, 27, 311–324. [Google Scholar] [CrossRef] [Green Version]
- Węziak-Białowolska, D. Quality of Life in Cities–Empirical Evidence in Comparative European Perspective. Cities 2016, 58, 87–96. [Google Scholar] [CrossRef]
- Yin, C.; He, Q.; Liu, Y.; Chen, W.; Gao, Y. Inequality of Public Health and Its Role in Spatial Accessibility to Medical Facilities in China. Appl. Geogr. 2018, 92, 50–62. [Google Scholar] [CrossRef]
- Chin, H.C.; Foong, K.W. Influence of School Accessibility on Housing Values. J. Urban Plan. Dev. 2006, 132, 120–129. [Google Scholar] [CrossRef]
- Comber, A.; Brunsdon, C.; Green, E. Using a GIS-Based Network Analysis to Determine Urban Greenspace Accessibility for Different Ethnic and Religious Groups. Landsc. Urban Plan. 2008, 86, 103–114. [Google Scholar] [CrossRef] [Green Version]
- Lotfi, S.; Koohsari, M.J. Measuring Objective Accessibility to Neighborhood Facilities in the City (A Case Study: Zone 6 in Tehran, Iran). Cities 2009, 26, 133–140. [Google Scholar] [CrossRef]
- Wang, D.; Dewancker, B.; Duan, Y.; Zhao, M. Exploring Spatial Features of Population Activities and Functional Facilities in Rail Transit Station Realm Based on Real-Time Positioning Data: A Case of Xi’an Metro Line 2. ISPRS Int. J. Geo-Inf. 2022, 11, 485. [Google Scholar] [CrossRef]
- Fan, Z.; Duan, J.; Lu, Y.; Zou, W.; Lan, W. A Geographical Detector Study on Factors Influencing Urban Park Use in Nanjing, China. Urban For. Urban Green. 2021, 59, 126996. [Google Scholar] [CrossRef]
- Heikinheimo, V.; Tenkanen, H.; Bergroth, C.; Järv, O.; Hiippala, T.; Toivonen, T. Understanding the Use of Urban Green Spaces from User-Generated Geographic Information. Landsc. Urban Plan. 2020, 201, 103845. [Google Scholar] [CrossRef]
- Hu, X.; Shen, P.; Shi, Y.; Zhang, Z. Using Wi-Fi Probe and Location Data to Analyze the Human Distribution Characteristics of Green Spaces: A Case Study of the Yanfu Greenland Park, China. Urban For. Urban Green. 2020, 54, 126733. [Google Scholar] [CrossRef]
- Min, M.; Lin, C.; Duan, X.; Jin, Z.; Zhang, L. Spatial Distribution and Driving Force Analysis of Urban Heat Island Effect Based on Raster Data: A Case Study of the Nanjing Metropolitan Area, China. Sustain. Cities Soc. 2019, 50, 101637. [Google Scholar] [CrossRef]
- Zhang, N.; Zhang, J.; Chen, W.; Su, J. Block-Based Variations in the Impact of Characteristics of Urban Functional Zones on the Urban Heat Island Effect: A Case Study of Beijing. Sustain. Cities Soc. 2022, 76, 103529. [Google Scholar] [CrossRef]
- Long, Y.; Song, Y.; Chen, L. Identifying Subcenters with a Nonparametric Method and Ubiquitous Point-of-Interest Data: A Case Study of 284 Chinese Cities. Environ. Plan. B Urban Anal. City Sci. 2021, 49, 58–75. [Google Scholar] [CrossRef]
- Niu, H.; Silva, E.A. Delineating Urban Functional Use from Points of Interest Data with Neural Network Embedding: A Case Study in Greater London. Comput. Environ. Urban Syst. 2021, 88, 101651. [Google Scholar] [CrossRef]
- Song, J.; Lin, T.; Li, X.; Prishchepov, A.V. Mapping Urban Functional Zones by Integrating Very High Spatial Resolution Remote Sensing Imagery and Points of Interest: A Case Study of Xiamen, China. Remote Sens. 2018, 10, 1737. [Google Scholar] [CrossRef] [Green Version]
- Kunze, C.; Hecht, R. Semantic Enrichment of Building Data with Volunteered Geographic Information to Improve Mappings of Dwelling Units and Population. Comput. Environ. Urban Syst. 2015, 53, 4–18. [Google Scholar] [CrossRef]
- Wu, H.; Wang, L.; Zhang, Z.; Gao, J. Analysis and Optimization of 15-Minute Community Life Circle Based on Supply and Demand Matching: A Case Study of Shanghai. PLoS ONE 2021, 16, e0256904. [Google Scholar] [CrossRef]
- Li, G.; Jin, F.; Chen, Y.; Jiao, J.; Liu, S. Location Characteristics and Differentiation Mechanism of Logistics Nodes and Logistics Enterprises Based on Points of Interest (POI): A Case Study of Beijing. J. Geogr. Sci. 2017, 27, 879–896. [Google Scholar] [CrossRef] [Green Version]
- Xu, D.; Huang, Z.; Lv, L.; Chen, X.; Cao, F. Research on Spatial Characteristic of Urban Leisure Tourism Based on POI Mining: A Case Study of Nanjing City. Geogr. Geo-Inf. Sci. 2018, 34, 59–64. [Google Scholar]
- Zhang, W.; Yang, J.; Ma, L.; Huang, C. Factors Affecting the Use of Urban Green Spaces for Physical Activities: Views of Young Urban Residents in Beijing. Urban For. Urban Green. 2015, 14, 851–857. [Google Scholar] [CrossRef]
- Zhao, P.; Luo, J.; Hu, H. Spatial match between residents’ daily life circle and public service facilities using big data analytics: A case of Beijing. Prog. Geogr. 2021, 40, 541–553. [Google Scholar] [CrossRef]
- Wei, H.; Tao, Z.; Pan, K. Spatial Coupling Characteristics and Influencing Mechanism of Recreation Space and Recreation Activity in Urban Waterfront: Take the Qinhuai River in Nanjing as an Example. Resour. Environ. Yangtze Basin 2022, 31, 840–850. [Google Scholar]
- Sun, J.; Sun, S.; Guo, H.; Wang, J.; Jiang, H.; Gao, J. A dataset of built-up areas of Chinese cities in 2020. China Sci. Data 2022, 7, 190–204. [Google Scholar]
- O’sullivan, D.; Unwin, D. Geographic Information Analysis; John Wiley & Sons: Hoboken, NJ, USA, 2003; ISBN 0-471-21176-1. [Google Scholar]
- Eck, J.; Chainey, S.; Cameron, J.; Wilson, R. Mapping Crime: Understanding Hotspots; National Institute of Justice: Washington, DC, USA, 2005.
- Long, Z.; Zhang, Z.; Liang, S.; Chen, X.; Ding, B.; Wang, B.; Chen, Y.; Sun, Y.; Li, S.; Yang, T. Spatially Explicit Carbon Emissions at the County Scale. Resour. Conserv. Recycl. 2021, 173, 105706. [Google Scholar] [CrossRef]
- Wu, Z.Q.; Ye, Z.N. Research on urban spatial structure based on Baidu heat map: A case study on the central city of Shanghai. City Plan. Rev. 2016, 40, 33–40. [Google Scholar]
- Chang, J.; Yu, H. The coupling development of tourism and urbanization in Daxiangxi area. Econ. Geogr. 2016, 36, 204–208. [Google Scholar]
- Tiangui, L.; Cifang, W.; Hongyi, L.; Heyuan, Y.; Xiao, C. The coordination and its optimization about population and land of urbanization: A case study of Nanchang city. Sci. Geogr. Sin. 2016, 36, 239–246. [Google Scholar]
- Ma, L.; Jin, F.; Song, Z.; Liu, Y. Spatial Coupling Analysis of Regional Economic Development and Environmental Pollution in China. J. Geogr. Sci. 2013, 23, 525–537. [Google Scholar] [CrossRef]
- Xie, M.M.; Zhou, W.; Wang, Y.L.; Chang, Q. Thermal environment effect of land use in urban area: A case study in Ningbo urban area. Acta Sci. Nat. Univ. Pekin. 2008, 44, 815–821. [Google Scholar]
- Li, J.; Li, J.; Shao, L.; Sun, S. Evaluation of Spatial Matching between Urban Green Space and Population: Dynamics Analysis of Winter Population Data in Xi’an. J. Urban Plan. Dev. 2021, 147, 05021012. [Google Scholar] [CrossRef]
- Li, J.; Li, J.; Yuan, Y.; Li, G. Spatiotemporal Distribution Characteristics and Mechanism Analysis of Urban Population Density: A Case of Xi’an, Shaanxi, China. Cities 2019, 86, 62–70. [Google Scholar] [CrossRef]
- Peng, Y.; Liu, J.; Zhang, T.; Li, X. The Relationship between Urban Population Density Distribution and Land Use in Guangzhou, China: A Spatial Spillover Perspective. Int. J. Environ. Res. Public Health 2021, 18, 12160. [Google Scholar] [CrossRef]
- Shi, P.; Xiao, Y.; Zhan, Q. A Study on Spatial and Temporal Aggregation Patterns of Urban Population in Wuhan City Based on Baidu Heat Map and POI Data. Int. Rev. Spat. Plan. Sustain. Dev. 2020, 8, 101–121. [Google Scholar] [CrossRef]
- Feng, D.; Tu, L.; Sun, Z. Research on Population Spatiotemporal Aggregation Characteristics of a Small City: A Case Study on Shehong County Based on Baidu Heat Maps. Sustainability 2019, 11, 6276. [Google Scholar] [CrossRef] [Green Version]
Figure 1.
Location of the study area.

Figure 2.
Technical framework of the study.

Figure 3.
Proportions of high–aggregation areas and sub–aggregation areas.

Figure 4.
Aggregation degree during three different time periods.

Figure 5.
Kernel density analysis results for overall service factor.

Figure 6.
Kernel density analysis results for each service category. Type (a) showed massive aggregation around the core area of Chengguan District, with some non-contiguous aggregation in the periphery. Type (b) formed small clustered areas in the core area, with no obvious clustering characteristics in the surrounding counties. Type (c) clustered in a point-like manner within the study area.
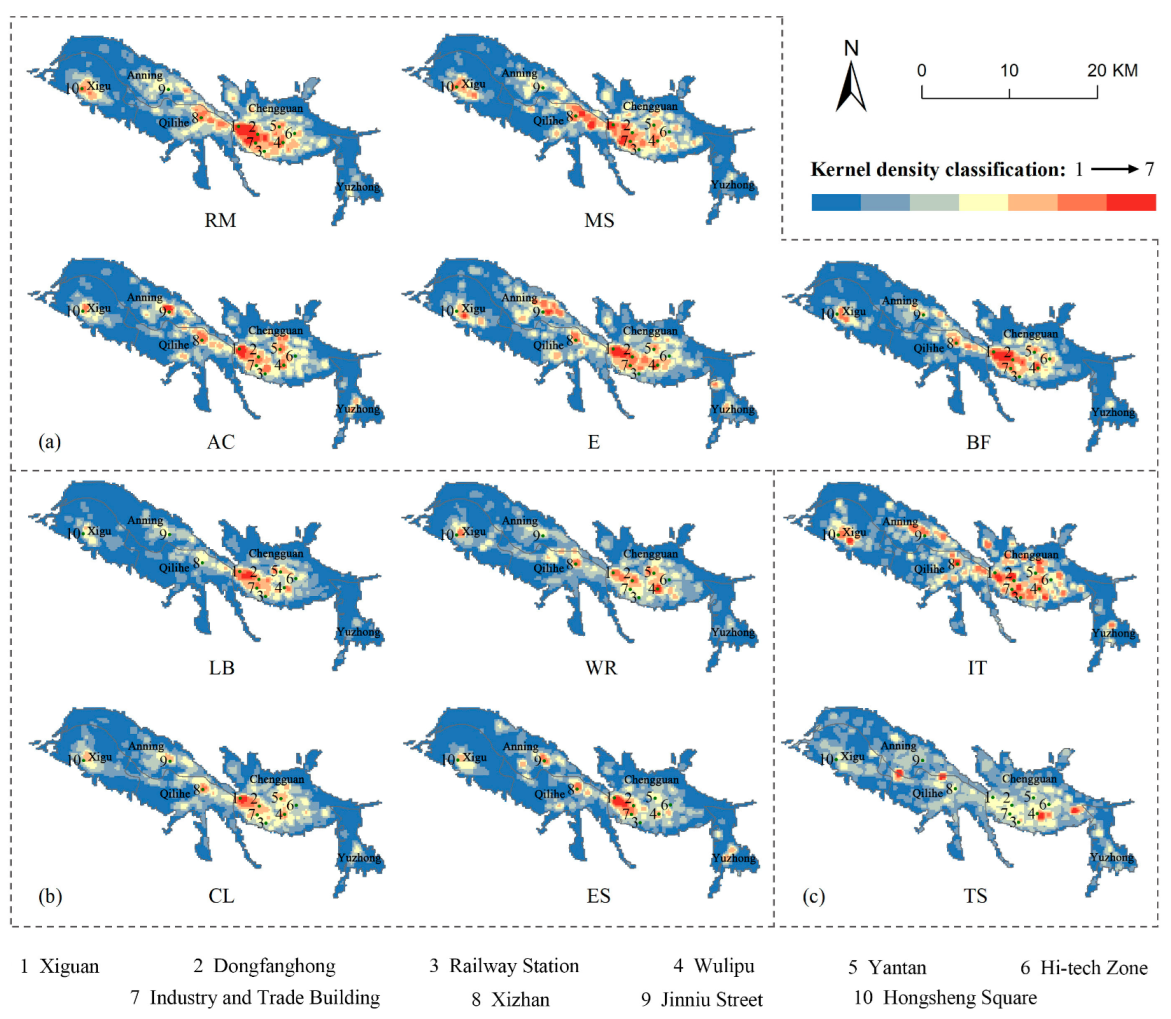
Figure 7.
Coupling map of the overall service factor and the population density.

Figure 8.
Coupling map of the different categories of service factors and the population density. Type (a) showed that the extreme coordination areas of service facilities and population density were concentrated mainly in Chengguan District, Qilihe District, and Xigu District. Type (b) had a smaller extreme coordination area than (a) and was mainly distributed in Chengguan District and Qilihe District. Type (c) showed that the extreme coordination areas of IT service facilities formed a point-like non-contiguous distribution in various counties, while TS services were mainly located in areas with good coordination.


Table 1.
Classification and statistics of the service facilities POI data for Lanzhou.
| Categories | Acronyms | POI Data Content | Count |
|---|---|---|---|
| Wholesale and Retail Trade Services | WR | Convenience stores, supermarkets, shopping malls, home appliance, electronic, and building materials stores, sporting goods stores, stationery stores, specialty stores, comprehensive markets, charging stations, LPG stations, gas stations, motorcycle and second hand vehicle sales, car decoration related | 56,484 |
| Transportation, Storage and Postal Services | TS | Bus stations, railway stations, airports, transportation ticket offices, post offices, logistics express sites | 3189 |
| Accommodation and Catering Services | AC | Chinese and western restaurants, fast food restaurants, coffee shops, tea houses, cold drink shops, pastry and dessert shops, leisure restaurants, hotels, guest houses, accommodation service related | 33,744 |
| Information and Technology Services | IT | China Mobile Office, China Telecom Office, China Unicom Office | 898 |
| Banking, Finance Services | BF | Banks, securities companies, insurance companies, finance companies, futures companies, automatic teller machines | 3079 |
| Real Estate Management Services | RM | Commercial office buildings, residential areas, sales centers, real estate agents, property companies | 6130 |
| Leasing and Business Services | LB | Car rental companies, machinery rental companies, daily necessities rental companies, travel agencies, advertising agencies, offices | 2426 |
| Education Services | E | Kindergartens, primary schools, middle schools, universities, training institutions, adult education, vocational and technical education | 5671 |
| Community Living Services | CL | Beauty salons, baths, car and motorcycle maintenance, daily necessities and household appliances maintenance, laundries, weddings, funerals, cleaning | 18,090 |
| Medical Service | MS | Hospitals, clinics, first aid centers, disease prevention institutions, animal medical facilities | 4933 |
| Entertainment Services | ES | Science and technology museums, museums, archives, periodical magazines, sports stadiums, recreation and leisure places, resorts and recuperation fields, cinemas and theaters | 4329 |
Table 2.
Classification criteria of the coupling coordination degree.
| Degree of Coupling Coordination | Coordination Level | Type |
|---|---|---|
| 0 < D ≤ 0.30 | Low–level coordination | Seriously unbalanced development |
| 0.30 < D ≤ 0.50 | Medium coordination | Slightly unbalanced development |
| 0.50 < D ≤ 0.80 | Good coordination | Slightly balanced development |
| 0.80 < D ≤ 1 | Extreme coordination | Superior balanced development |
Table 3.
Coupling coordination degree index (%).
| Categories | Morning | Afternoon | Evening | |||
|---|---|---|---|---|---|---|
| Weekend | Workday | Weekend | Workday | Weekend | Workday | |
| TS | 9.26 | 10.42 | 10.53 | 10.60 | 10.06 | 10.04 |
| RM | 5.26 | 6.35 | 6.21 | 6.14 | 6.49 | 6.47 |
| E | 4.80 | 5.93 | 5.92 | 5.89 | 5.96 | 5.99 |
| IT | 3.36 | 4.41 | 4.44 | 4.42 | 4.45 | 4.45 |
| MS | 0.29 | 1.32 | 1.15 | 1.16 | 1.42 | 1.43 |
| CS | −0.99 | 0.00 | −0.03 | 0.01 | 0.01 | 0.03 |
| AC | −2.41 | −1.42 | −1.48 | −1.46 | −1.32 | −1.31 |
| WR | −3.40 | −2.41 | −2.33 | −2.33 | −2.45 | −2.48 |
| BF | 3.36 | −7.05 | −7.12 | −7.01 | −7.12 | −7.12 |
| ES | −8.19 | −7.21 | −6.97 | −7.13 | −7.07 | −7.08 |
| LB | −11.34 | −10.35 | −10.33 | −10.28 | −10.43 | −10.42 |
Disclaimer/Publisher’s Note: The statements, opinions and data contained in all publications are solely those of the individual author(s) and contributor(s) and not of MDPI and/or the editor(s). MDPI and/or the editor(s) disclaim responsibility for any injury to people or property resulting from any ideas, methods, instructions or products referred to in the content. |
© 2023 by the authors. Licensee MDPI, Basel, Switzerland. This article is an open access article distributed under the terms and conditions of the Creative Commons Attribution (CC BY) license (https://creativecommons.org/licenses/by/4.0/).
Share and Cite
MDPI and ACS Style
Chen, Y.; Zhang, Z.; Lang, L.; Long, Z.; Wang, N.; Chen, X.; Wang, B.; Li, Y. Measuring the Spatial Match between Service Facilities and Population Distribution: Case of Lanzhou. Land 2023, 12, 1549. https://doi.org/10.3390/land12081549
AMA Style
Chen Y, Zhang Z, Lang L, Long Z, Wang N, Chen X, Wang B, Li Y. Measuring the Spatial Match between Service Facilities and Population Distribution: Case of Lanzhou. Land. 2023; 12(8):1549. https://doi.org/10.3390/land12081549
Chicago/Turabian StyleChen, Yanbi, Zilong Zhang, Lixia Lang, Zhi Long, Ningfei Wang, Xingpeng Chen, Bo Wang, and Ya Li. 2023. "Measuring the Spatial Match between Service Facilities and Population Distribution: Case of Lanzhou" Land 12, no. 8: 1549. https://doi.org/10.3390/land12081549
Note that from the first issue of 2016, this journal uses article numbers instead of page numbers. See further details here.