
Capacity Assessment of Urban Green Space for Mitigating Combined Sewer Overflows in the Tokyo Metropolitan Area

Department of Civil and Environmental Engineering, Tokyo Institute of Technology, Meguro-ku, Tokyo 152-8552, Japan
*
Author to whom correspondence should be addressed.
Land 2023, 12(5), 993; https://doi.org/10.3390/land12050993
Submission received: 20 January 2023
/
Revised: 15 March 2023
/
Accepted: 26 April 2023
/
Published: 29 April 2023
(This article belongs to the Special Issue Imbricating Socioeconomic and Environmental Data to Model Spatial Patterns of Peri-Urbanisation and Their Consequences)
Abstract
:Among the countermeasures against combined sewer overflow (CSO), urban green space (UGS) has been proven effective. However, few studies have examined the effects of UGS on CSO at the municipal scale. Therefore, this study aimed to develop a novel method for estimating the relation of the area of UGS to CSO based on a case study in the Tokyo metropolitan area, which includes 10 sewersheds. This method integrates surface runoff modeling, sewer network analysis, and response analysis for estimating CSO and its response to the UGS proportion in each sewershed. This method is based on public data of topographic features, land-related data, and rainfall characteristics. Specifically, the CSO discharge is estimated to be the difference between the rainwater inflow to a terminal treatment plant and the maximum capacity of the sewer systems in each sewershed. The results revealed that the amount of CSO increases exponentially with the intensity of rainfall. In addition, a response analysis showed that the increase in UGS proportion would mitigate CSO in all sewersheds, particularly in the case where the UGS proportion increased from 5% to 10%. Overall, the present method allows us to estimate CSO in relation to rainfall pattern and the distribution of UGS in a sewershed without actual CSO records.
1. Introduction
In combined sewer systems, sewer pipes are designed to collect both wastewater and rainwater runoff. In principle, up to a certain level of stormwater input, a wastewater treatment plant can accept and effectively treat a mixture of wastewater and rainwater. However, in the case of heavy rains, the mixture of sewage wastewater and rainwater flowing in the combined sewer systems may exceed capacity. To prevent treatment plant overcapacity, a portion of sewer water is diverted directly to the water environment without treatment, a procedure referred to as combined sewer overflow (CSO) [1]. In many cities, CSO has been known to cause environmental pollution and, consequently, deterioration of the aquatic ecosystem [2,3,4,5]. For instance, CSO has been reported to drastically increase the concentration of microbes indicating fecal contamination in an urban river in Paris [6] and in coastal water in Tokyo [7,8]. It has also been reported that CSO contributes 40–90% of the annual load of various micropollutants in a lake in Burlington, Vermont, although its discharge accounts for only 10% of the annual water discharge [9]. Therefore, CSO needs to be alleviated in order to maintain the health of the aquatic environment, particularly in urban areas.
Urban green space (UGS) is the term for open-space areas such as parks and other “green spaces,” which may include vegetation, water, and other elements of the natural environment [10]. Such natural spaces are considered to act as a kind of countermeasure against CSO because they enhance ecosystem services in urban areas [11]. In a broad sense, green spaces are a type of green infrastructure because they serve various functions that aid disaster prevention/mitigation, environmental protection, regional promotion, and so on [12,13,14]. They are thus utilized to solve social issues, a process referred to as a nature-based solution [15]. Thus, government and academic investigations have been conducted to elucidate urban ecosystem services and how they help cities to enhance their resilience [16].
From an environmental perspective, UGS has several functions, including mitigating floods and stormwater, maintaining a healthy hydrologic cycle, purifying the atmosphere, and maintaining natural habitats [17,18,19,20,21]. In particular, UGS is expected to reduce surface runoff by increasing stormwater storage capacity and infiltration volumes, thereby potentially further reducing the discharge of CSO. Previous studies have clarified the value of UGS in terms of reducing surface runoff in urban areas [22,23,24,25]. For instance, the runoff reduction capacity of UGS in Beijing has been estimated as 2494 m3/ha, with up to 1.54 × 10⁸ m3 of rainwater stored in the UGS [22]. Maragno et al. [23] reported that the average runoff reduction efficiency of UGS was 6–23% in 9 parts of Venice, Italy. Furthermore, types of UGS such as rain gardens, green roofs, and porous pavements improve the water quality of the overflow because they filter out pollutants, thereby contributing to mitigation of the environmental issues involving CSO [26,27,28,29].
There have been some attempts at using empirical and process-based models to quantitatively assess the capacity of UGS in terms of CSO mitigation. For example, a model has been built based on the records of CSO in Quebec to describe the relationship between rainfall characteristics and CSO [3]. The Stormwater Management Model developed by the United States Environmental Protection Agency [30] was used to investigate a water collection system in Philadelphia, Pennsylvania, that incorporated UGS [31]. The results of that study revealed that UGS has better performance for low-intensity and short-duration events in terms of volume and peak flow reduction compared with high-intensity and long-duration events. Furthermore, in Tokyo, the introduction of UGS seems to have decreased CSO in one watershed, based on the observation of CSO from combined sewer systems [32]. However, the quantitative relationship between UGS and CSO has been demonstrated only in a limited number of sewersheds. Moreover, the reported estimation methods relied mainly on actual records of CSO in areas of less than 10 km2 [31,32,33]. Thus, there is no available method or model for assessing the potential contribution of UGS to mitigate CSO at the municipal or regional scale where past records of CSO are not available, which is commonly the case. Therefore, it is critically important to model the quantitative relation between UGS and CSO at the municipal scale, which will help us better understand the dynamics of the urban water cycle and design more effective UGS.
Against the backdrop described above, this study aims to propose a method for estimating CSO at the municipal scale and investigate the mitigation capacity of UGS for CSO discharged into the water environment, taking Tokyo as an example. First, we built a semi-process-based model to investigate the relationship between CSO and UGS and then created hydrographs of the influent to each terminal treatment plant based on the constructed sewer network as well as surface runoff analyses. Second, the constructed model was applied to investigate how effective the increase in UGS area is for mitigating CSO and maintaining the aquatic environment in Tokyo. In this manner, we estimated CSO in relation to rainfall intensity and the response of CSO to the change in UGS proportion. The presented method enables us to estimate CSO flux and its relation to UGS using only public data, making it applicable for the first time to metropolitan areas.
2. Materials and Methods
2.1. Study Area
The target area of this study was the Tokyo metropolitan area, which comprises 23 wards (622 km2, Figure 1). In this area, frequent heavy rainfall events generate CSO and, thus, affect the urban environment. Thus, we prioritized and chose the TMA as the study area. The sewerage system in this area (Figure 1a) consists of combined sewer systems (82%) and separated systems (18%) [34]. The area is divided into 10 sewersheds, each of which holds a different areal proportion of UGS and is equipped with a terminal treatment plant. The proportion of UGS in those sewersheds during 2018–2020 ranges from 4.2% (Ochiai) to 11.4% (Nakagawa) (Figure 1), according to a high-resolution land cover classification map with a resolution of 10 m [35] (Figure 1b). Tokyo has three types of surface soil: sand, a mixture of sand and gravel, and Kanto loam (Figure 1c) [36]. The overall topography in the Tokyo Metropolitan area is flat, and the variation of elevation is relatively small, as it locates in the lowland area with some hilly terrain. Overall, the western part of the district has relatively high elevation, and the eastern part has low elevation facing the Tokyo Bay. To be specific, the average elevation in the Tokyo Metropolitan area is about 30 m above sea level with the highest elevation of approximately 56.7 m above sea level in the Nerima ward, which is covered by the Shingashi sewershed.
2.2. Methods
2.2.1. Overview of Capacity Assessment of UGS
To set up rainfall scenarios, rainfall events in Tokyo were extracted from the hourly rainfall record collected by the weather station of Japan Meteorological Agency (Figure 1b) [37]. Assuming typical rainfall events, the spatial distribution of surface runoff was estimated using the Soil Conservation Service Curve Number (SCS-CN) method developed by the United States Department of Agriculture. The surface runoff causes inland flooding when the inflow to a combined sewer system exceeds its capacity (Figure 2). The combined sewer systems in Tokyo were constructed to handle a rainfall intensity of 50 mm/h [38], and the maximum rainfall intensity during the study period was less than 50 mm/h. Thus, the surface runoff was assumed to completely flow into the combined sewer systems in Tokyo. Next, the flow time (i.e., travel time) from all locations in a given sewershed to the terminal treatment plant in the combined sewer network was estimated using sewer network analysis, which allowed us to determine the temporal change in inflow to the terminal treatment plant. The difference between the hydrograph and the capacity of each sewer system was calculated as the estimated CSO flux. Finally, the whole procedure was applied to a response analysis in order to determine how the areal proportion of UGS in each sewershed influences the CSO flux. The spatial coverage of the target area (i.e., 622 km2) and the distributed characteristics of CSO do not allow us such common procedure of model application, at least with our current technical capacity. For instance, each sewershed is equipped with more than 100 outlets of CSO in Tokyo. Thus, the proposed method uses only the public data (Table S1) for estimating the parameters. The details are described in the following section.
2.2.2. Surface Runoff Model
In this study, we used Integrated Valuation of Ecosystem Services and Tradeoffs (InVEST https://naturalcapitalproject.stanford.edu/software/invest (accessed on 30 July 2021)) [39] modeling to simulate surface runoff and infiltration of rainwater based on the SCS-CN method with the Urban Flood Risk Mitigation model tool. This suite of models maps and evaluates goods and services from nature that sustain and fulfill human life. According to the SCS-CN method, the surface runoff (Q) is estimated as follows.
Here, is the surface runoff depth (mm); is the rainfall intensity depth (mm) at a given time (one hour in this study); is the potential maximum water storage in soil (mm); the curve number (CN) is a key empirical parameter ranging from 0 to 100 that is used in hydrology for predicting direct runoff or infiltration from rainfall excess and is determined by combining land use and surface soil type, which is also called hydrologic soil group (Table S2); is the initial abstraction of rainfall (i.e., the initial loss of rainfall by infiltration) and represents the process by which water is retained on the soil surface before surface runoff begins. Thus, it determines the amount of rainfall needed to generate runoff. In the SCS-CN method, the initial abstraction is defined as a fraction of the maximum potential retention, which depends on the land use and soil type. In our study, it was subtracted from the rainfall to determine the effective rainfall, which was then used to calculate the surface runoff. Lastly, λ is the initial abstraction coefficient, which is 0.2 [40].
To apply the SCS-CN method, three types of datasets were required: distribution of land use (Figure 1b), distribution of hydrologic soil groups (Figure 1c), and a specific rainfall event. Rainfall events in Tokyo from 2016 to 2020 are summarized in Table 1 [37]. Consistent with the criteria of the Japan Meteorological Agency, rainfall with an intensity of 10 mm/h or higher was considered heavy rainfall. As shown in Table 1, most rainfall intensities were below 10 mm/h; there were only 62 heavy rainfall events, which accounted for 8.5% of the total. CSO may occur when heavy rainfall occurs in a short period. Based on the record, this study investigated 50 rainfall events in total, which were five different rainfall intensities of 1.77 mm/h, 10 mm/h, 16.75 mm/h, 27.5 mm/h, and 40 mm/h in each of the 10 sewersheds. All rainfall intensities in our model analyses were assumed to be less than 50 mm/h, and thus inland flooding would not happen according to reference [38]. In the model analyses, the rainfall intensity was assumed to continue for one hour with a fixed intensity over time to describe the relation of UGS and CSO. Based on this assumption, the discharge in a sewer system was estimated to be a mixture of a given rainfall and sewage in each sewershed. Therefore, the discharge of CSO was estimated by the difference between the discharge in a sewer system and the capacity of the corresponding terminal treatment plan.
2.2.3. Sewer Network Analysis
The sewer pipes in Tokyo are installed beneath roads and streets, and the size of sewer pipes is proportional to the size of road. Thus, the analysis of the sewer network in Tokyo was based on the road network compiled by Geofabrik, which was extracted from Open Street Map data [41]. We utilized the road network to determine the sewer network by focusing on the types of roads: primary (main roads managed by the local government), secondary (roads supplemental to the primary roads managed by the local government), tertiary (two-lane roads), residential (roads that cars use to pass through in residential areas), living streets (roads on which pedestrians are given a higher priority than cars), and unclassified (roads not belonging to any of the other categories).
To draw a hydrograph of influent water to the terminal treatment plant for each rainfall intensity, it is necessary to know the distribution of surface runoff and flow time from each point to the terminal treatment plant. The discharge of surface runoff in each sewershed was estimated using the SCS-CN method described in the previous section. To determine the flow time from each point to the terminal treatment plant, we used the Generating Service Areas and OD Cost Matrix tools of Network Analyst [42,43], which extend the functions of ArcGIS; the Generating Service Areas tool was applied to create service areas based on the locations of the pumping station and the terminal treatment plant. The OD Cost Matrix tool was then used to calculate the shortest travel time between the service areas, allowing us to identify the critical route, which concentrates the most wastewater to flow through the sewer system. The flow velocity was determined using Manning’s formula. The most popular material for sewer pipes in Tokyo is reinforced concrete, and thus the Manning roughness coefficient of reinforced concrete was set at 0.014 for the calculation of flow velocity. The national regulation of Japan specifies 1/100 as the minimum slope of sewer pipes, and thus the slope of all the pipes in this analysis was assumed to be 1/100. The pipeline was assumed to be filled with sewer water because CSO occurs under heavy rainfall.
To generate the hydrograph for each specific rainfall pattern in a given sewershed, we utilized the zonal statistics tool available in ArcGIS. We assumed a constant rainfall intensity for a duration of one hour and used the tool to calculate the total amount of rainfall runoff from each sub-catchment area in the sewershed. This tool calculates the total area of each watershed that was covered by a specific rainfall intensity for one hour. The total rainfall depth was then divided by the total area of the watershed to obtain the average rainfall intensity. We used the resulting average rainfall intensity values to generate the hydrographs for each watershed by using the SCS-CN method to estimate the surface runoff. For this step, we assumed that the rainfall intensity is constant over time for one hour. The generated hydrographs were then used to calculate the inflow to the terminal treatment plant and the CSO flux.
2.2.4. Estimation of Treatment Capacity of Each Terminal Treatment Plant
The capacity of each terminal treatment plant for receiving rainfall was estimated based on information from the Japan Meteorological Agency [37] as well as the average amount of treatment sewerage published by the Tokyo Metropolitan Government [44]. The terminal treatment plants and sewer systems have the capacity to treat water (mixture of sewerage and rainwater) up to three times higher than the flux of sewage water during dry weather condition [44]. Therefore, when it rains, the terminal treatment plant can additionally accept the flux of rainwater up to double the sewage flux during normal weather condition, and the maximum amount of treated rainwater can be calculated as follows.
Here, is the average record of the amount of sewage influent; is the analysis period (here, five years from 2016 to 2020); is the rainwater flow in each sewershed (m3/h); and is the flow rate of sewerage (without rainwater). was calculated by multiplying the rainfall intensity by the area of the sewershed. If x is assumed to be constant over time, the maximum capacity for rainwater discharge in a sewer system is double that amount. Thus, the amount of CSO (was estimated as the difference between the hydrograph and the rainwater treatment capacity in each sewershed.
2.2.5. Response Analysis for the Relation between UGS and CSO
Referring to the classification of land use, each land use type was classified as either UGS or impervious surface [45]. UGS land uses are rice paddy, crops, grassland, deciduous broad-leaf forest, deciduous needle-leaf forest, evergreen needle-leaf forest, evergreen needle-leaf forest, and bamboo.
Regarding the reconstruction of UGS, the proportion of UGS was modified from the actual land use and the change of CSO was analyzed accordingly. The sequence of operations was determined by combining ArcGIS geoprocessing tools. A response analysis was performed to clarify the relationship between the mitigation of CSO and the existence of UGS. The proportion of CSO for the total amount of rainwater was calculated using the following equation.
Here, is the proportion of CSO for the total amount of rainwater; is the amount of CSO discharged into water bodies, calculated as described in the previous section; is the amount of rainwater treated at the terminal treatment plant; and is the amount of rainwater that has infiltrated the soil, which is calculated as the difference between rainfall intensity and surface runoff (Q). Finally, the UGS proportion was changed from 5% to 10%, 10% to 15%, and 15% to 20% for each sewershed in order to check the rate of CSO changes.
3. Results
3.1. Estimated CSO in Relation to Rainfall Intensity
The estimated hydrographs at the terminal treatment plants revealed that the discharge in the sewer system became higher as the rainfall intensity increased (Figure 3). The shape of each hydrograph was different among the sewersheds, reflecting the flow time of each sewer network even though the assumed rainfall intensity was the same for all sewersheds. The highest and smallest discharges of rainwater were observed in Shibaura (10,640 m3/min) and Nakagawa (1100 m3/min), respectively. The discharge peaks were confirmed before 60 min in the Kosuge, Ochiai, Odai, and Sunamachi sewersheds and at and after 60 min in Kasai, Mikawajima, Morigasaki, Nakagawa, Shibaura, and Shingashi. Most of the sewersheds showed quick recovery, and the rainwater discharge returned to normal levels within 120 min. Morigasaki and Shingashi were affected for a relatively long time, producing CSO until 165 min and 152 min, respectively.
As the result of the estimation of the overflow, CSO did not occur in all sewersheds in the cases with rainfall intensity of 1.77 mm/h or 10 mm/h (Figure 3 and Figure 4). A rainfall intensity of 16.75 mm/h did not cause CSO in the sewersheds of Kosuge, Morigasaki, Nakagawa, Ochiai, and Shingashi, while it did cause CSO in the sewersheds of Shibaura, Kasai, Mikawajima, Odai, and Sunamachi. When the rainfall intensity was higher than 16.75 mm/h, the results showed the occurrence of CSO in all the sewersheds. The Shibaura sewershed showed the highest flow rate of CSO among the sewersheds, and Mikawajima showed the highest CSO volume, whereas Nakagawa showed the lowest in both CSO flow rate and volume. When the rainfall intensity increased from 27.5 mm/h to 40 mm/h, the response of CSO flow rates to rainfall intensity in Morigasaki and Shingashi was found to be 1.95 times and 1.71 times higher than the average response in all the areas, respectively. The terminal treatment plants in Morigasaki, Shibaura, and Shingashi showed relatively high rainwater receiving capacities of 1321 m3/min, 722 m3/min, and 729 m3/min, respectively, while the rest showed intermediate capacities (Figure 3).
3.2. Response of CSO to the Change in UGS Proportion
The result shows that the higher the percentage of UGS is in all regions, the lower the percentage of CSO is (Figure 5). This is because the amount of rainwater that infiltrates the ground increases as the proportion of UGS and the rainwater infiltration capacity increase. For example, the proportion of CSO for the total amount of rainwater decreased when UGS increased from 5% to 20% in each sewershed, and the rainfall intensity decreased (Figure 5). Because CSO did not occur when the rainfall intensity was less than or equal to 10 mm/h (Figure 3), only rainfall intensities higher than 10 mm/h were analyzed. As a result of using ArcGIS geoprocessing tools, the proportion of UGS deviated slightly from 5%, 10%, 15%, and 20% due to the conversion of raster data (i.e., the actual land use data) to polygon data. The reduction of CSO in all sewersheds in response to UGS weakened from 55.4% to 18.0% as the rainfall intensity increased from 16.75 mm/h to 40 mm/h, indicating the higher efficiency of UGS to control CSO in the event of low-intensity rainfall. At a rainfall intensity of 16.75 mm/h, the proportions of CSO for the total amount of rainwater in Shibaura, Mikawajima, and Sunamachi were significantly higher than in the other six sewersheds (Figure 5a). The proportion of CSO for the total amount of rainwater was the lowest in Morigasaki at all rainfall intensities.
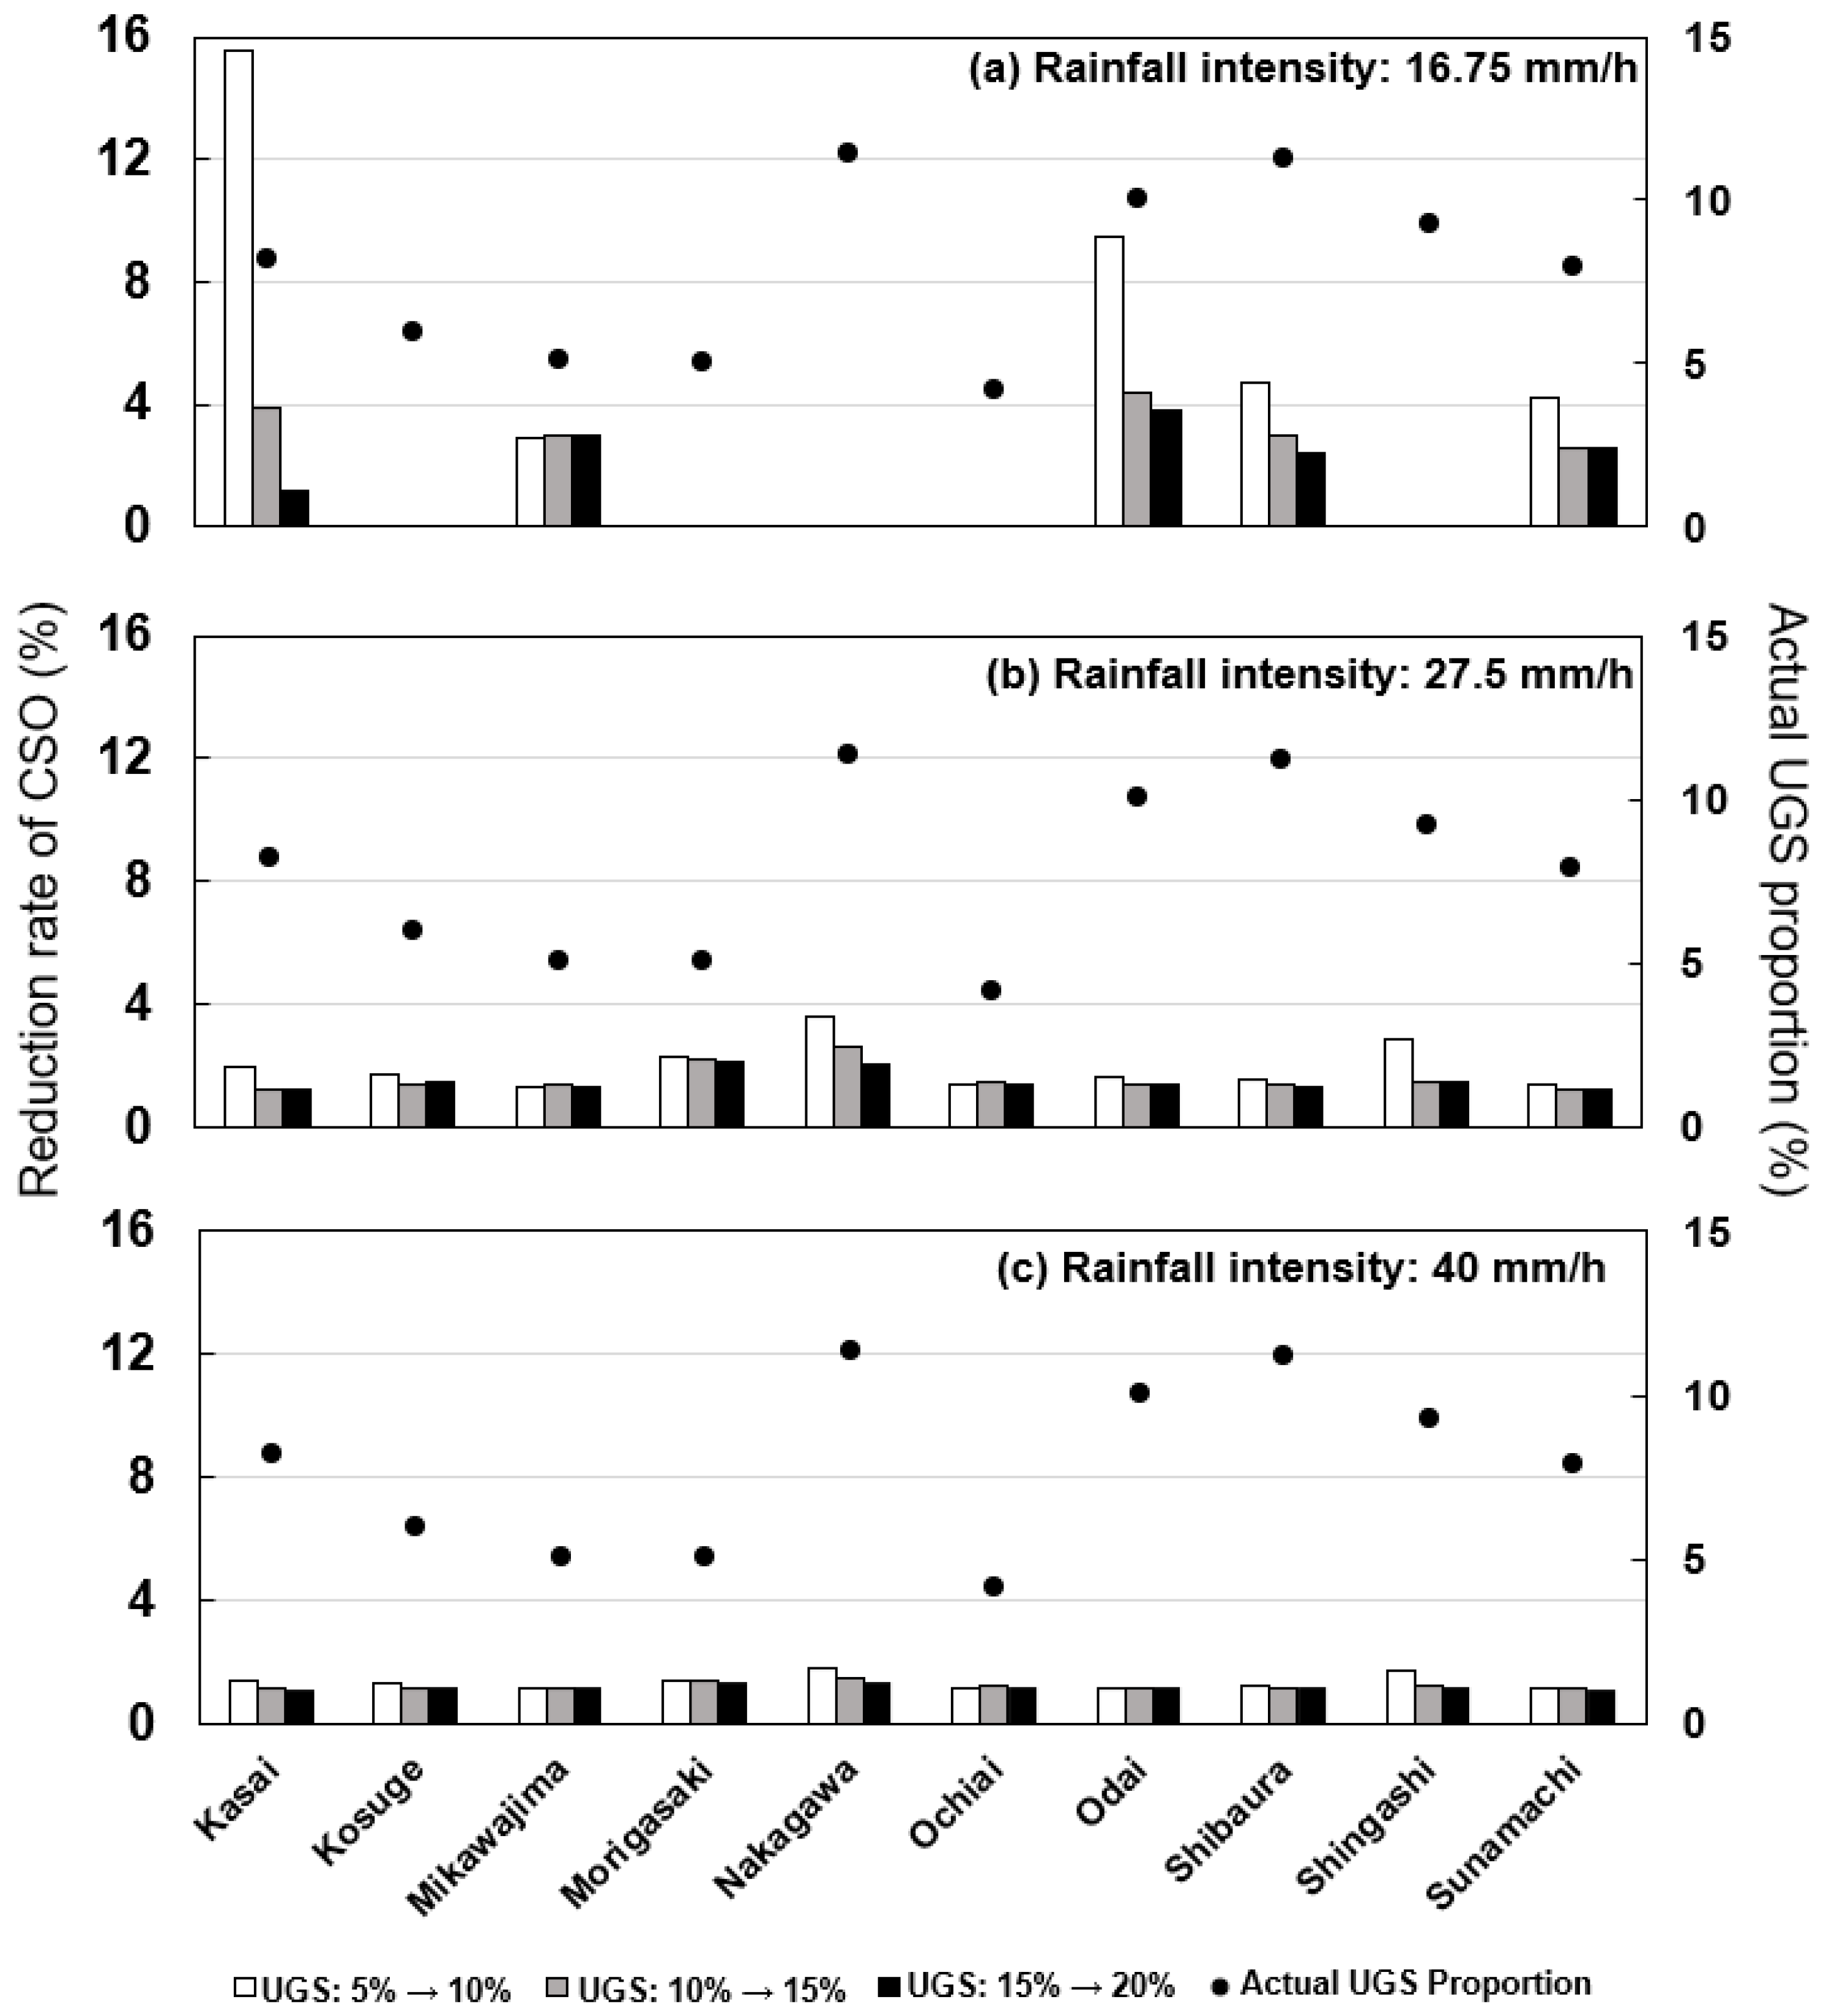
The reduction rates of CSO at different rainfall intensities and proportions of UGS for each sewerage are shown in Figure 6. At a rainfall intensity of 16.75 mm/h, the reduction rates of CSO when the proportion of UGS changed from 5% to 10% were higher than those resulting from the other proportional changes of UGS, particularly in Kasai, Odai, Shibaura, and Sunamachi sewersheds (Figure 6a). Meanwhile, the reduction rates of CSO in Kosuge, Morigasaki, Nakagawa, Ochiai, and Shingashi were close to zero (Figure 6a). At rainfall intensities of 27.5 mm/h and 40 mm/h, the reduction rates of CSO for all proportions of UGS that were changed in each sewershed were similar, except in the Kasai, Nakagawa, and Shignashi sewersheds (Figure 6b,c). As a result, the case of the shift of the areal proportion of UGS from 5% to 10% showed the higher rate of reduction of CSO than other cases of UGS increase at all rainfall intensities in most sewersheds.
4. Discussion
4.1. Proposed Method for Assessing CSO in Urban Areas
In this study, CSO flux was estimated using a relatively simple method. This method does not require the actual CSO records in the target area, unlike methods reported in previous studies [31,32], which are based on actual flow in sewer pipes and thus require data on local rainfall as well as CSO records and the calibration of the model parameters such as plot size and percent imperviousness. Instead, the method proposed in this study allows for the estimation of potential CSO flux at the sewershed scale under a given rainfall condition based on the semi-process-based model that quantitatively describes the relationship between UGS and CSO. We compared the final CSO production and production conditions with past studies in Quebec and Tokyo [3,46], and in agreement with previous findings, CSO was more likely to be produced under intense rainfall condition (i.e., >15 mm/h). The bottom line for the development of the presented method was the applicability to a whole urban area only with public data (Table S1). Thus, the proposed method is applicable to other urban areas. To be specific, this method requires (1) topographic data and land use/cover data (e.g., Figure 1b), (2) the distribution of hydrological soil groups (e.g., Figure 1c), (3) road network data, and (4) the rainfall characteristics. The model outputs indicate that inland flooding would not occur at any of the assumed rainfall intensities and the land use distribution in the Tokyo metropolitan area. In fact, the combined sewer systems in the Tokyo metropolitan area were designed with the target rainfall intensity set as 50 mm/h [38], which is consistent with the results of the present study.
In addition, the proposed method can be applied to investigate the potential contribution of increased UGS area for mitigating CSO and the consequent pollution of the aquatic environment. Previous studies have investigated the role of green infrastructure at a much smaller scale (<10 km2) than in this study and have also focused on expanding green infrastructure with the aim of reducing the incidence of CSO or designing green infrastructure with more efficient drainages [31,33,47]. Nevertheless, owing to the relatively simple structure of the present model, the demonstrated approach does not allow us to identify the locations where CSO would occur. This is because in the sewer network analysis, the occurrence of CSO was estimated by comparing the hydrograph with the capacity of a terminal treatment plant. The estimation of CSO distribution requires more detailed information about the sewer network, such as pipe diameter and slope, although the topography of the target area is gentle, and thus we assumed the uniform slope for sewer pipes in our analysis.
4.2. Estimated CSO in Current Land Use
The hydrographs of sewer flow resulted in different shapes among the sewersheds (Figure 3). The hydrographs for Morigasaki, Shibaura, and Shingashi were convex. The areas of these sewersheds are larger than those of the other sewersheds. In large sewersheds, surface runoff reaches the terminal treatment plant from various points across a large area, and thus the arrival time at the treatment plant ranges widely, resulting in a wide range of hydrographs. In such sewersheds, the flow rate increases rapidly in a short time in the area nearest the terminal treatment plant, suggesting that CSO likely occurs frequently in the vicinity of treatment plants.
The estimated CSO flux showed increases in CSO over rainfall intensity, and the response appeared similar to the exponential curve (Figure 4). Low rainfall intensities such as 1.77 mm/h and 10 mm/h did not cause CSO, whereas intensities higher than 27.5 mm/h did. This indicates that the threshold for the occurrence of CSO is within the range from 15 mm/h to 25 mm/h. Similar studies in Quebec and Tokyo have shown that rainfall events with an intensity above 15 mm/h and lasting longer than 60 min resulted in CSO, although such extreme rainfall events are rare [3,46]. Due to the fixed capacity of terminal treatment plants, CSO could theoretically increase without a limitation corresponding to the rainfall intensity when it exceeds the threshold. At a rainfall intensity of 40 mm/h, more than 20% of rainwater in the Mikawajima, Shibaura, and Sunamachi sewersheds was estimated to be CSO only. This high proportion is due to land use characteristics because those sewersheds are mainly commercial, business, and industrial areas. In contrast, the CSO proportions in other sewersheds are generally less than 20% because they are located on the edges of Tokyo, where there are higher areal proportions of residential land.
4.3. Capacity of UGS in Mitigating CSO
The results demonstrated that the percentage of CSO decreases as the percentage of regional UGS increases from 5% to 19% (Figure 5). As the rainfall intensity increased, the impact of the areal proportion of USG on CSO flux became less significant. In other words, the lower the rainfall intensity within the range of 16.75 mm/h to 40 mm/h was, the more effective the increase in UGS was in mitigating the CSO. At a low rainfall intensity, the rainwater treatment capacity of the terminal treatment plant is relatively large. Thus, under such rainfall conditions, the reduction in rainwater flow through infiltration effect of rainwater by UGS is directly reflected in the mitigation of CSO flux (Figure 5a). In contrast, at high rainfall intensities (i.e., >16.75 mm/h), the rainfall input was much higher than the rainwater treatment capacity of the terminal treatment plant (Figure 4). Thus, the mitigation effect of UGS for reducing CSO was not as clear as that under weaker rainfall intensity conditions.
Furthermore, the higher the rainfall intensity is, the smaller the difference in the proportion of CSO among the sewersheds is (Figure 5). At a rainfall intensity of 16.75 mm/h, the difference between the maximum and minimum values of the CSO proportion was 3 times larger than that at a rainfall intensity of 40 mm/h. Under low rainfall intensity conditions, UGS plays a significant role in determining the proportion of rainfall infiltration, and thus sewershed properties such as UGS, geography, and area contribute to disparities in the CSO proportion among sewersheds. The slopes of the graphs at each rainfall intensity (Figure 5) suggest that the response of the CSO proportion to the UGS proportion depends on both the rainfall intensity and sewershed characteristics.
In addition, a relatively weak rainfall intensity of 16.75 mm/h showed a larger CSO reduction rate for increasing the proportion of UGS compared with heavy rainfall intensities (i.e., 40 mm/h; Figure 6). This result is consistent with previous research [31]. Because of the limited capacity of potential maximum water storage (S) in the soil, the ability to increase rainwater infiltration by increasing UGS is relatively constant even when the amount of rainfall increases, and thus the calculated reduction rate is lower when converted to a percentage. In addition, one of the remarkable findings of this study is the change in the slope of the reduction rate along the intervals of UGS proportion. The reduction rate of the CSO proportion was relatively higher when the UGS proportion changed from 5% to 10%. However, it should be noted that the present results were not applied to any specific spatial planning in terms of UGS distribution. As a next step, it is important to link a specific spatial plan (i.e., the distribution of UGS) with the mitigation of CSO in the Tokyo metropolitan area [32], which should enable us to verify the results. The presented model analyses did not deal with stochasticity or probability distribution, although we do have some uncertainty in the model structure and parameters, which is possibly revealed by the actual record of CSO in the future. In addition, it would be possible to further integrate the stochasticity of rainfall patterns with the presented method.
In addition, the reduction rate of CSO by UGS was distinct among the sewersheds (Figure 6). The reduction rate was relatively low as the UGS proportion increased. This pattern can be roughly divided into two types: one is a reduction in the reduction rate, which was the trend described above, and the other is the reduction rate independent of the UGS proportion. Therefore, when introducing UGS as a mitigation measure for CSO, it is important to identify the potential response of CSO flux to the areal proportion of UGS as well as the current UGS proportion in order to determine which sewersheds should be prioritized in the actual implementation. For instance, the results indicate that the introduction of UGS to the Shingashi sewershed, where the UGS proportion is presently less than 10%, is the most efficient when the rainfall intensity is 40 mm/h.
The Tokyo Metropolitan Government has been working to prevent CSO by taking countermeasures such as installing rainwater storage equipment at pumping stations, which is referred to as gray infrastructure. Based on our results, it might also be necessary to enhance the capacity of sewerage systems with such facility measures. In contrast, the addition and extension of UGS will make possible several services at a lower cost compared with gray infrastructure. UGS offers not only water storage but also a variety of functions that generate substantial economic value, including ecological and social services, mitigation of air pollution, thermal regulation, and reduction of surface runoff [15,48,49,50]. The reduction of surface runoff alone may offset the cost of maintenance to some degree [22]. Gray infrastructure, however, requires significant capital and maintenance costs.
For instance, in the Tokyo metropolitan area, there is an ongoing gray infrastructure project aimed at improving the Nomigawa River mainline, which involves the construction of a 4 km-long underground space with a diameter of 3.25 m beneath the existing drainage to collect and store rainwater when rainwater exceeds 50 mm/h in the Morigasaki sewershed. This facility will have the capacity to store 33,000 m3 of rainwater and it will cost approximately 7.5 billion yen to construct. For comparison, if the proportion of UGS in the metropolitan area is raised by 5%, we can expect an approximate reduction in CSO of 310,000 m3 (at 40 mm/h intensity), which is about 9.4 times the storage capacity of this gray facility. However, in the domain of urban planning, efforts to increase the areal proportion of UGS in sewersheds generally require negotiation and coordination on a time scale longer than that for a gray infrastructure construction project. Therefore, determining the best combination of gray and green infrastructure may be the approach for mitigating CSO. In fact, combining grey and green infrastructure has been suggested to be effective for managing urban rainwater [51], and the same may be true for mitigating CSO in urban areas.
5. Conclusions
This study investigated the effectiveness of using UGS to mitigate CSO in the Tokyo metropolitan area based on our newly developed approach, which estimates the potential contribution of UGS for mitigating CSO at an urban area scale, based on the InVEST model, SCS-CN method, the road network, and the capacity of treatment plants. Thus, it does not require detailed data or sewerage records (e.g., the capacity of the actual sewer pipe network, the percent of imperviousness in roads, or historical CSO records). In addition, the conventional methods for estimating CSO flux are applicable only to small scales such as neighborhoods or districts, whereas the presented method can also be applied to municipal scales including several sewersheds, in order to quantify the potential relationship between UGS and CSO in sewersheds.
According to the results of the response analyses, the amount of CSO increases exponentially with the intensity of rainfall due to the limitation of stormwater treatment capacity. Of all the sewersheds in the Tokyo metropolitan area, the Mikawajima sewershed showed the highest response to an increase in rainfall intensity in terms of CSO amount, followed by the Shibaura and Sunamachi sewersheds, whereas the Odai and Shingashi sewersheds showed relatively low responses. In addition, the increase in the UGS proportion would be expected to mitigate CSO in all sewersheds, particularly when the UGS proportion increases from 5% to 10%. For instance, the Morigasaki sewershed was expected to show a higher CSO reduction rate compared with other sewersheds due to its lower actual UGS proportion of approximately 5%.
It is difficult to quickly increase the UGS proportion in urban areas. Therefore, although UGS has greater economic and social benefits compared with gray infrastructure, the results of this study suggest that a combination of gray and green infrastructure may be a more feasible approach for mitigating CSO. If we wish to introduce UGS as a CSO measure, the proposed approach would prove beneficial by prioritizing sewersheds, considering the ecosystem function of UGS. In this regard, our analyses identified three factors: (1) targeted rainfall intensity, (2) the current UGS proportion in the sewershed, and (3) reduction rate of CSO for a given increase in UGS.
Supplementary Materials
The following is available online at https://www.mdpi.com/article/10.3390/land12050993/s1, Table S1: The data used in this study and their sources; Table S2: Curve number for each land use type according to the USDA classification (2007) [52,53].
Author Contributions
Conceptualization, R.O. and C.Y.; methodology and investigation, R.O. and C.Y.; data curation, R.O., Y.Z. and C.Y.; writing—original draft preparation, R.O. and C.Y.; writing—review and editing, R.O., Y.Z., V.T., Z.G., M.W. and C.Y.; supervision, C.Y. All authors have read and agreed to the published version of the manuscript.
Funding
This research received no external funding.
Data Availability Statement
The data supporting this research are available upon reasonable request from the corresponding author.
Conflicts of Interest
The authors declare no conflict of interest.
References
- Tibbetts, J. Combined sewer systems: Down, dirty, and out of date. Environ. Health Perspect. 2005, 113, A464-7. [Google Scholar] [CrossRef] [PubMed]
- Ham, Y.S.; Kobori, H.; Takasago, M. Effects of combined sewer overflow and stormwater on indicator bacteria concentrations in the tama river due to the high population density of Tokyo metropolitan area. Environ. Monit. Assess. 2009, 152, 459–468. [Google Scholar] [CrossRef] [PubMed]
- Mailhot, A.; Talbot, G.; Lavallée, B. Relationships between rainfall and Combined Sewer Overflow (CSO) occurrences. J. Hydrol. 2015, 523, 602–609. [Google Scholar] [CrossRef]
- Pennino, M.J.; McDonald, R.I.; Jaffe, P.R. Watershed-scale impacts of stormwater green infrastructure on hydrology, nutrient fluxes, and combined sewer overflows in the mid-Atlantic region. Sci. Total Environ. 2016, 565, 1044–1053. [Google Scholar] [CrossRef]
- Rizzo, A.; Tondera, K.; Pálfy, T.G.; Dittmer, U.; Meyer, D.; Schreiber, C.; Zacharias, N.; Ruppelt, J.P.; Esser, D.; Molle, P.; et al. Constructed wetlands for combined sewer overflow treatment: A state-of-the-art review. Sci. Total Environ. 2020, 727, 138618. [Google Scholar] [CrossRef]
- Passerat, J.; Ouattara, N.K.; Mouchel, J.M.; Rocher, V.; Servais, P. Impact of an intense combined sewer overflow event on the microbiological water quality of the Seine River. Water Res. 2011, 45, 893–903. [Google Scholar] [CrossRef]
- Inoue, K.; Asami, T.; Shibata, T.; Furumai, H.; Katayama, H. Spatial and temporal profiles of enteric viruses in the coastal waters of Tokyo Bay during and after a series of rainfall events. Sci. Total Environ. 2020, 727, 138502. [Google Scholar] [CrossRef]
- Poopipattana, C.; Suzuki, M.; Furumai, H. Impact of long-duration CSO events under different tidal change conditions on distribution of microbial indicators and PPCPs in Sumida river estuary of Tokyo Bay, Japan. Environ. Sci. Pollut. Res. 2021, 28, 7212–7225. [Google Scholar] [CrossRef]
- Phillips, P.J.; Chalmers, A.T.; Gray, J.L.; Kolpin, D.W.; Foreman, W.T.; Wall, G.R. Combined sewer overflows: An environmental source of hormones and wastewater micropollutants. Environ. Sci. Technol. 2012, 46, 5336–5343. [Google Scholar] [CrossRef]
- Şenik, B.; Uzun, O. A process approach to the open green space system planning. Landsc. Ecol. Eng. 2022, 18, 203–219. [Google Scholar] [CrossRef]
- Song, P.; Kim, G.; Mayer, A.; He, R.; Tian, G. Assessing the ecosystem services of various types of urban green spaces based on i-Tree Eco. Sustainability 2020, 12, 1630. [Google Scholar] [CrossRef]
- European Commission. Communication from the Commission to the European Parliament, the Council, the European Economic and Social Committee and the Committee of the Regions Green Infrastructure (GI)—Enhancing Europe’s Natural Capital. 2013. Available online: https://eur-lex.europa.eu/legal-content/EN/TXT/?uri=CELEX:52013DC0249 (accessed on 10 December 2022).
- European Commission. Ecosystem Services and Green Infrastructure. Environment. 2020. Available online: https://ec.europa.eu/environment/nature/ecosystems/index_en.htm (accessed on 28 December 2022).
- US EPA. What Is Green Infrastructure. Green Infrastruct. 2020. Available online: https://www.epa.gov/green-infrastructure/what-green-infrastructur (accessed on 28 December 2022).
- Kabisch, N.; van den Bosch, M.; Lafortezza, R. The health benefits of nature-based solutions to urbanization challenges for children and the elderly—A systematic review. Environ. Res. 2017, 159, 362–373. [Google Scholar] [CrossRef]
- Benedict, M.A.; McMahon, E.T. Smart Conservation for the 21st Century. Green Infrastruct. 2002, 20, 12–17. [Google Scholar]
- Tzoulas, K.; Korpela, K.; Venn, S.; Yli-Pelkonen, V.; Kaźmierczak, A.; Niemela, J.; James, P. Promoting ecosystem and human health in urban areas using Green Infrastructure: A literature review. Landsc. Urban Plan. 2007, 81, 167–178. [Google Scholar] [CrossRef]
- Yang, B.; Lee, D. Urban green space arrangement for an optimal landscape planning strategy for runoff reduction. Land 2021, 10, 897. [Google Scholar] [CrossRef]
- Yang, B.; Lee, D.K. Planning strategy for the reduction of runoff using urban green space. Sustainability 2021, 13, 2238. [Google Scholar] [CrossRef]
- Yang, L.; Zhang, L.; Li, Y.; Wu, S. Water-related ecosystem services provided by urban green space: A case study in Yixing City (China). Landsc. Urban Plan. 2015, 136, 40–51. [Google Scholar] [CrossRef]
- ElZein, Z.A.K.A.A.; Abdou, A.; Abd ElGawad, I. Constructed wetlands as a sustainable wastewater treatment method in communities. Procedia Environ. Sci. 2016, 34, 605–617. [Google Scholar] [CrossRef]
- Zhang, B.; Xie, G.; Zhang, C.; Zhang, J. The economic benefits of rainwater-runoff reduction by urban green spaces: A case study in Beijing, China. J. Environ. Manag. 2012, 100, 65–71. [Google Scholar] [CrossRef]
- Maragno, D.; Gaglio, M.; Robbi, M.; Appiotti, F.; Fano, E.A.; Gissi, E. Fine-scale analysis of urban flooding reduction from green infrastructure: An ecosystem services approach for the management of water flows. Ecol. Modell. 2018, 386, 1–10. [Google Scholar] [CrossRef]
- Li, F.; Liu, Y.; Engel, B.A.; Chen, J.; Sun, H. Green infrastructure practices simulation of the impacts of land use on surface runoff: Case study in Ecorse River watershed, Michigan. J. Environ. Manag. 2019, 233, 603–611. [Google Scholar] [CrossRef] [PubMed]
- Stefanakis, A.I. The role of constructed wetlands as green infrastructure for sustainable urban water management. Sustainability 2019, 11, 6981. [Google Scholar] [CrossRef]
- Eco Justice. Green Cities, Great Lakes. Using Green Infrastructure to Reduce Combined Sewer Overflows. 2008. Available online: https://ecojustice.ca/wp-content/uploads/2014/11/Green-Cities-Great-Lakes-2008.pdf (accessed on 10 December 2022).
- Yang, B.; Li, S. Green infrastructure design for stormwater runoff and water quality: Empirical evidence from large watershed-scale community developments. Water 2013, 5, 2038–2057. [Google Scholar] [CrossRef]
- Sharma, R.; Malaviya, P. Management of Stormwater Pollution Using Green Infrastructure: The Role of Rain Gardens. Wiley Water 2021, 8, e1507. [Google Scholar] [CrossRef]
- Wise, S. Green infrastructure rising. Planning 2008, 74, 14–19. [Google Scholar]
- U.S. EPA. Storm Water Management Model (SWMM). United States Environmental Protection Agency. 2022. Available online: https://www.epa.gov/water-research/storm-water-management-model-swmm (accessed on 19 December 2022).
- Tao, J.; Li, Z.; Peng, X.; Ying, G. Quantitative analysis of impact of green stormwater infrastructures on combined sewer overflow control and urban flooding control. Front. Environ. Sci. Eng. 2017, 11, 11. [Google Scholar] [CrossRef]
- Ogahara, Y.; Taura, F.; Shimamura, Y. Flood and cso surpression effect by green infrastructure targeting upstream zempukuji-river basin. J. Jpn. Soc. Civ. Eng. Ser. B1 Hydraul. Eng. 2018, 74, 355–360. [Google Scholar] [CrossRef]
- Jean, M.-È.; Morin, C.; Duchesne, S.; Pelletier, G.; Pleau, M. Real-time model predictive and rule-based control with green infrastructures to reduce combined sewer overflows. Water Res. 2022, 221, 118753. [Google Scholar] [CrossRef]
- Maeda, M.; Mizushima, H.; Ito, K. Development of the real-time control (RTC) system for Tokyo sewage system. Water Sci. Technol. 2005, 51, 213–220. [Google Scholar] [CrossRef]
- Earth Observation Research Center (EORC)/Japan Aerospace Exploration Agency (JAXA). Advanced Land Observing Satellite. Available online: https://www.eorc.jaxa.jp/ALOS/jp/index_j.htm (accessed on 30 July 2021).
- Ministry of Land Infrastructure Transport and Tourism (MLIT). National Land Information Database. Available online: https://nlftp.mlit.go.jp/ksj/index.html (accessed on 30 July 2021).
- Japan Meteorological Agency. Meteorological Data in the Past. Available online: https://www.jma.go.jp/jma/index.html (accessed on 1 December 2022).
- Sekine, M.; Huruki, Y.; Sekine, T. Numerical simulation of inundation in urban area of tokyo and underground space. J. Jpn. Soc. Civ. Eng. B1 Hydraul. Eng. 2015, 71, 1435–1440. [Google Scholar]
- Sharp, R.; Chaplin-Kramer, R.; Wood, S.; Guerry, A.; Tallis, H.; Ricketts, T.; Nelson, E.; Ennaanay, D.; Wolny, S.; Olwero, N.; et al. InVEST User’s Guide; The Natural Capital Project: Stanford, CA, USA, 2018. [Google Scholar] [CrossRef]
- Mockus, V. Chapter 10 Estimation of Direct Runoff from Storm Rainfall. In National Engineering Handbook, Section 4, Hydrology; United States Department of Agriculture: Washington, DC, USA, 1964. Available online: https://directives.sc.egov.usda.gov/OpenNonWebContent.aspx?content=41607.wba (accessed on 20 December 2022).
- Open Street Map Foundation. Open Street Map Database. Available online: https://www.openstreetmap.org/#map=5/35.588/134.380 (accessed on 30 July 2021).
- ESRI. Network Analyst: ArcGIS 10; Environmental Systems Research Institute: Redlands, CA, USA, 2010. [Google Scholar]
- Church, R.L. Geographic Information Systems and Transportation Research. Transp. Res. Part C Emerg. Technol. 2002, 10, 79–92. [Google Scholar]
- Tokyo Metropolitan Government Bureau of Sewerage. SEWERAGE in TOKYO 2020. Tokyo Metropolitan Government Bureau of Sewerage. 2020. Available online: https://www.gesui.metro.tokyo.lg.jp/english/pdf/full_text_en.pdf (accessed on 19 December 2022).
- Kong, F.; Yin, H.; James, P. Using high-resolution satellite images to map the urban forest: A comparison of pixel-based and object-based classification approaches in a case study of megacities (Beijing/London/New York City). Urban For. Urban Green. 2016, 17, 212–226. [Google Scholar]
- Yu, Y.; Kojima, K.; An, K.; Furumai, H. Cluster analysis for characterization of rainfalls and CSO behaviours in an urban drainage area of Tokyo. Water Sci. Technol. 2013, 68, 544–551. [Google Scholar] [CrossRef]
- Inoue, S. [Current situation of measures against stormwater and green infrastructure in Japan] Nippon no usuitaisaku no genjyo to guri-n infura. J. Jpn. Soc. Reveg. Technol. 2017, 42, 409–411. [Google Scholar] [CrossRef]
- Grabowski, Z.J.; McPhearson, T.; Matsler, A.M.; Groffman, P.; Pickett, S.T. What is green infrastructure? A study of definitions in US city planning. Front. Ecol. Environ. 2022, 20, 152–160. [Google Scholar] [CrossRef]
- Bhandari, S.; Zhang, C. Urban Green Space Prioritization to Mitigate Air Pollution and the Urban Heat Island Effect in Kathmandu Metropolitan City, Nepal. Land 2022, 11, 2074. [Google Scholar] [CrossRef]
- Zhao, W.; Zhang, L.; Li, X.; Peng, L.; Wang, P.; Wang, Z.; Jiao, L.; Wang, H. Residents’ Preference for Urban Green Space Types and Their Ecological-Social Services in China. Land 2022, 11, 2239. [Google Scholar] [CrossRef]
- Alves, A.; Vojinovic, Z.; Kapelan, Z.; Sanchez, A.; Gersonius, B. Exploring trade-offs among the multiple benefits of green-blue-grey infrastructure for urban flood mitigation. Sci. Total Environ. 2020, 703, 134980. [Google Scholar] [CrossRef]
- USDA; Natural Resources Conservation Service. Chapter 7 Hydrologic Soil Groups. In National Engineering Handbook; United States Department of Agriculture: Washington, DC, USA, 2007. Available online: https://directives.sc.egov.usda.gov/OpenNonWebContent.aspx?content=17757.wba) (accessed on 19 December 2022).
- USDA-SCS. Urban Hydrology for Small Watersheds; Technical Release No. 55 (TR-55); USDASCS: Washington, DC, USA, 1986. Available online: https://directives.sc.egov.usda.gov/OpenNonWebContent.aspx?content=22162.wba (accessed on 19 December 2022).
Figure 1.
Distribution of (a) sewerage collection type with areal proportions of the sewersheds, (b) land use and the weather station, and (c) soil type (hydrologic soil group) in the Tokyo metropolitan area.
Figure 1.
Distribution of (a) sewerage collection type with areal proportions of the sewersheds, (b) land use and the weather station, and (c) soil type (hydrologic soil group) in the Tokyo metropolitan area.
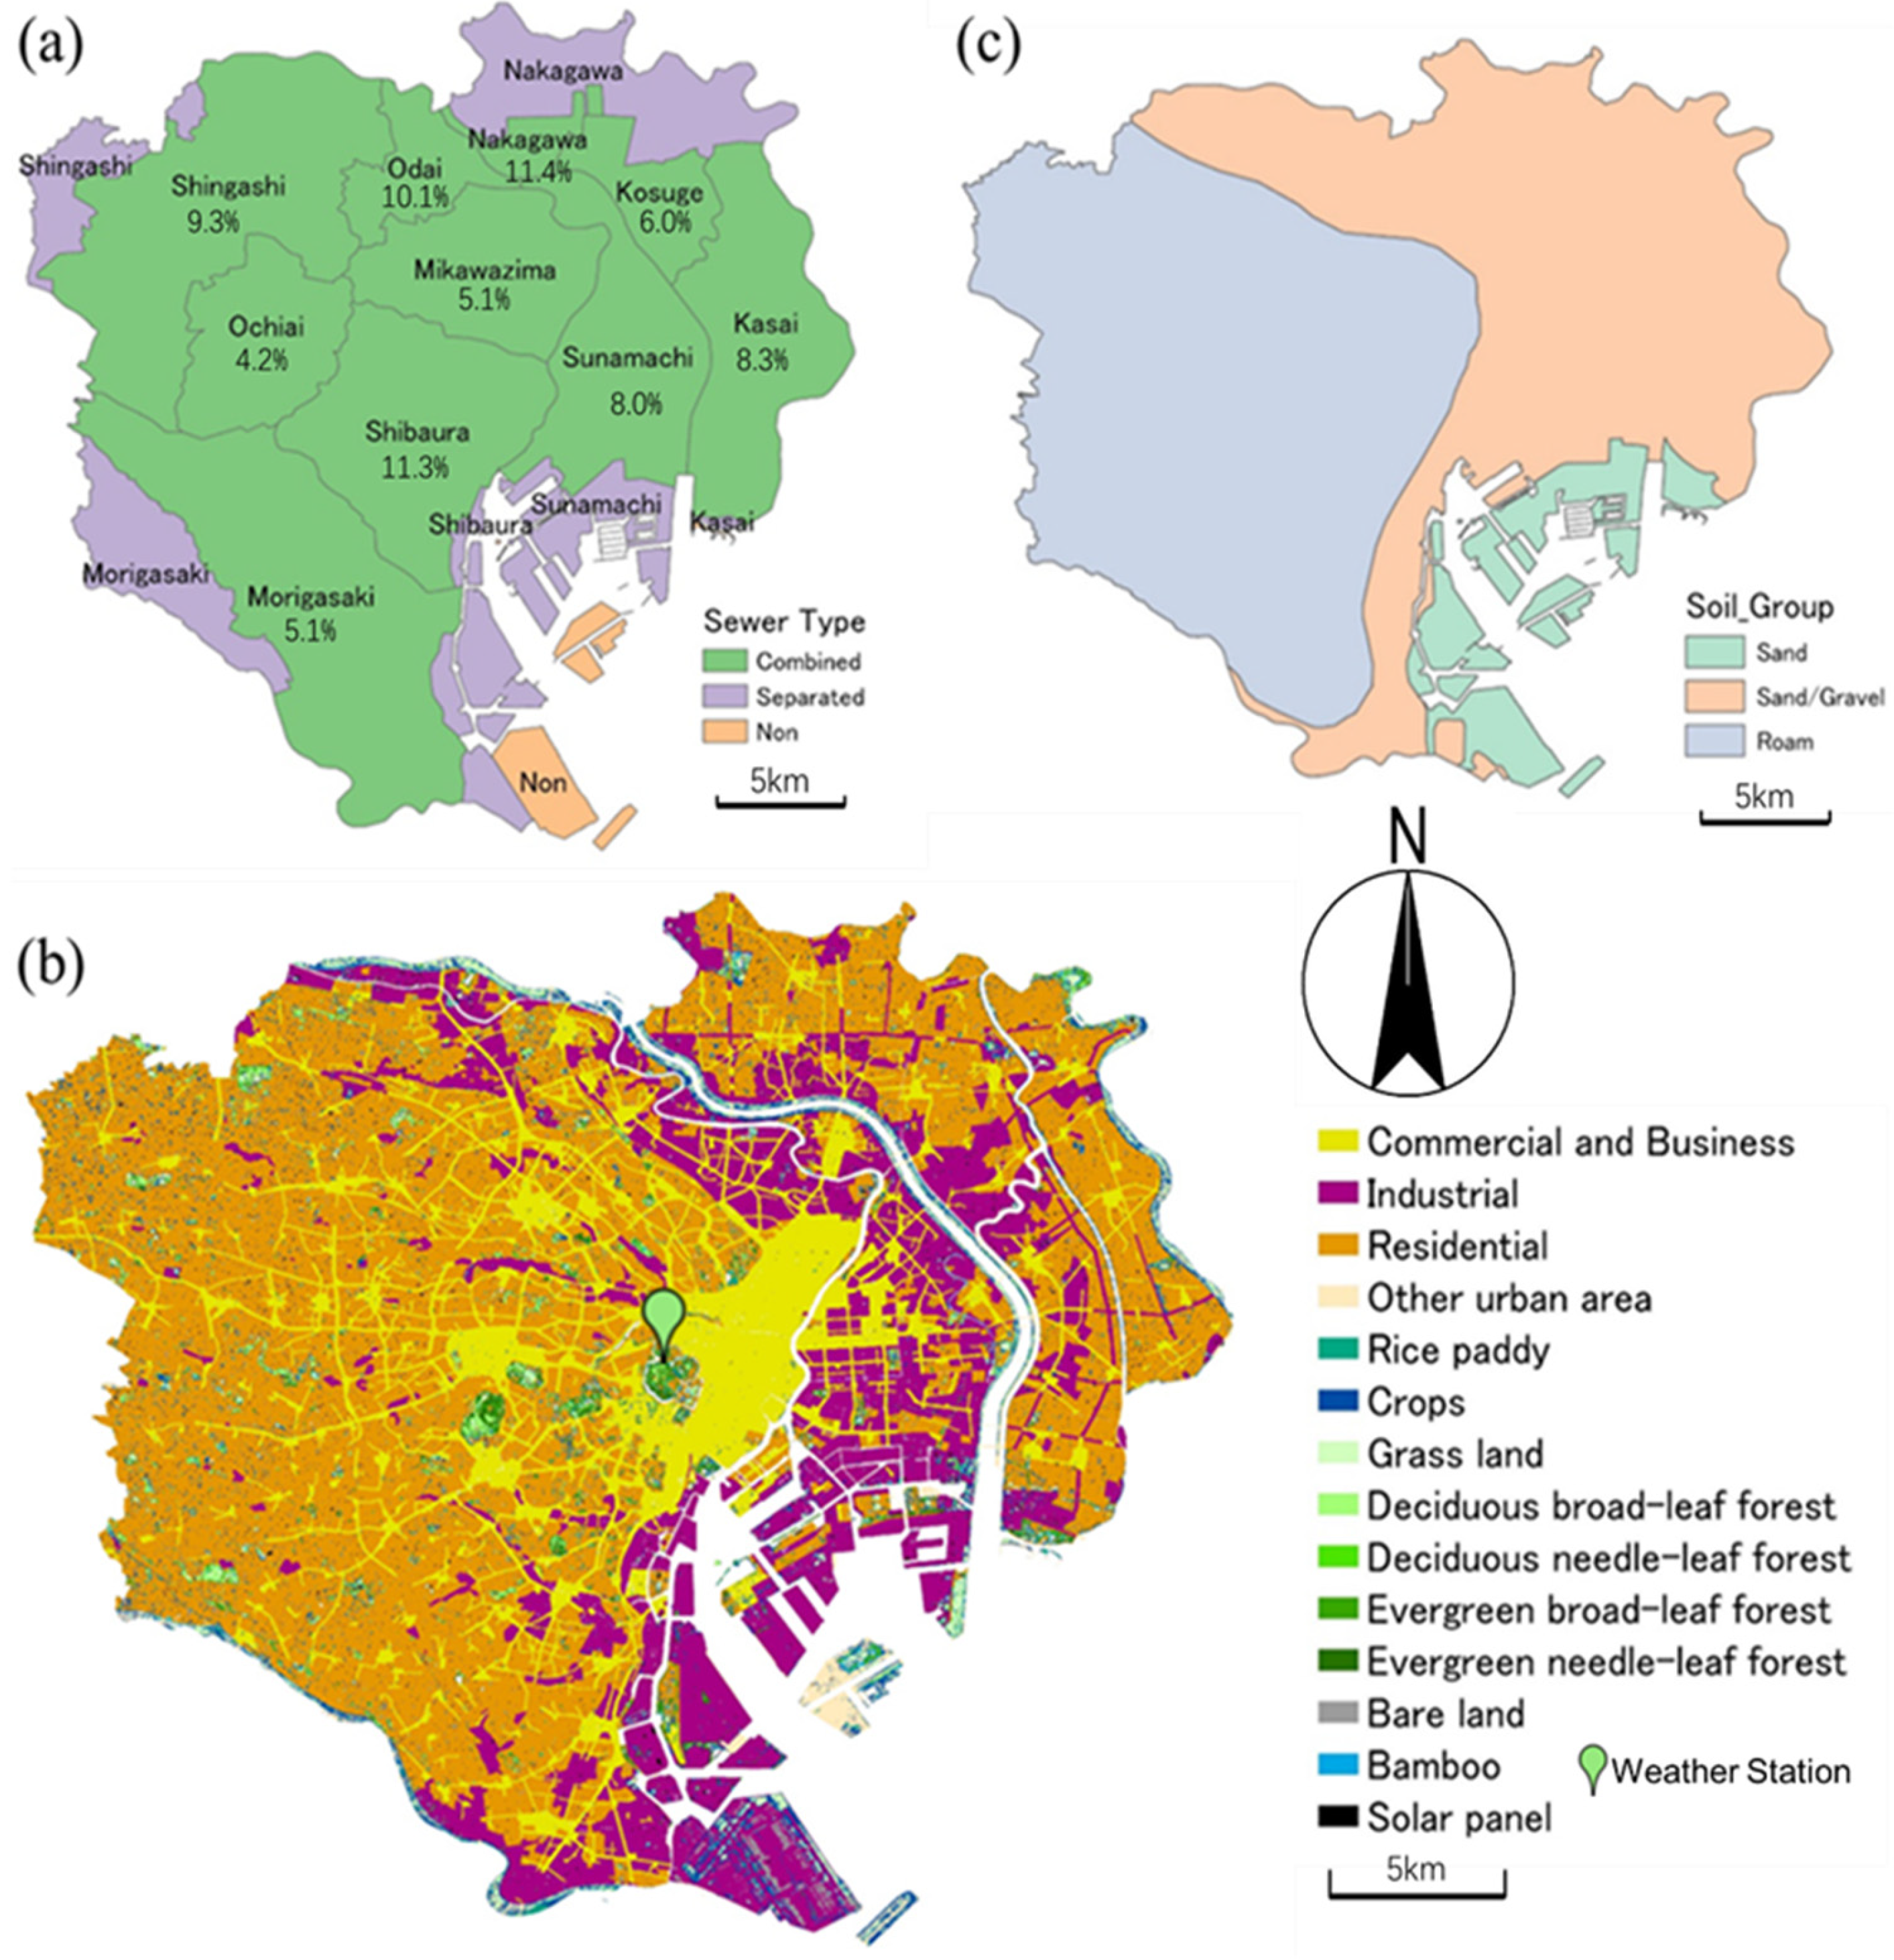
Figure 2.
Schematic diagram of the rainwater flow into the combined sewer systems. The analytical methods for the estimation of CSO discharge are underlined.
Figure 2.
Schematic diagram of the rainwater flow into the combined sewer systems. The analytical methods for the estimation of CSO discharge are underlined.
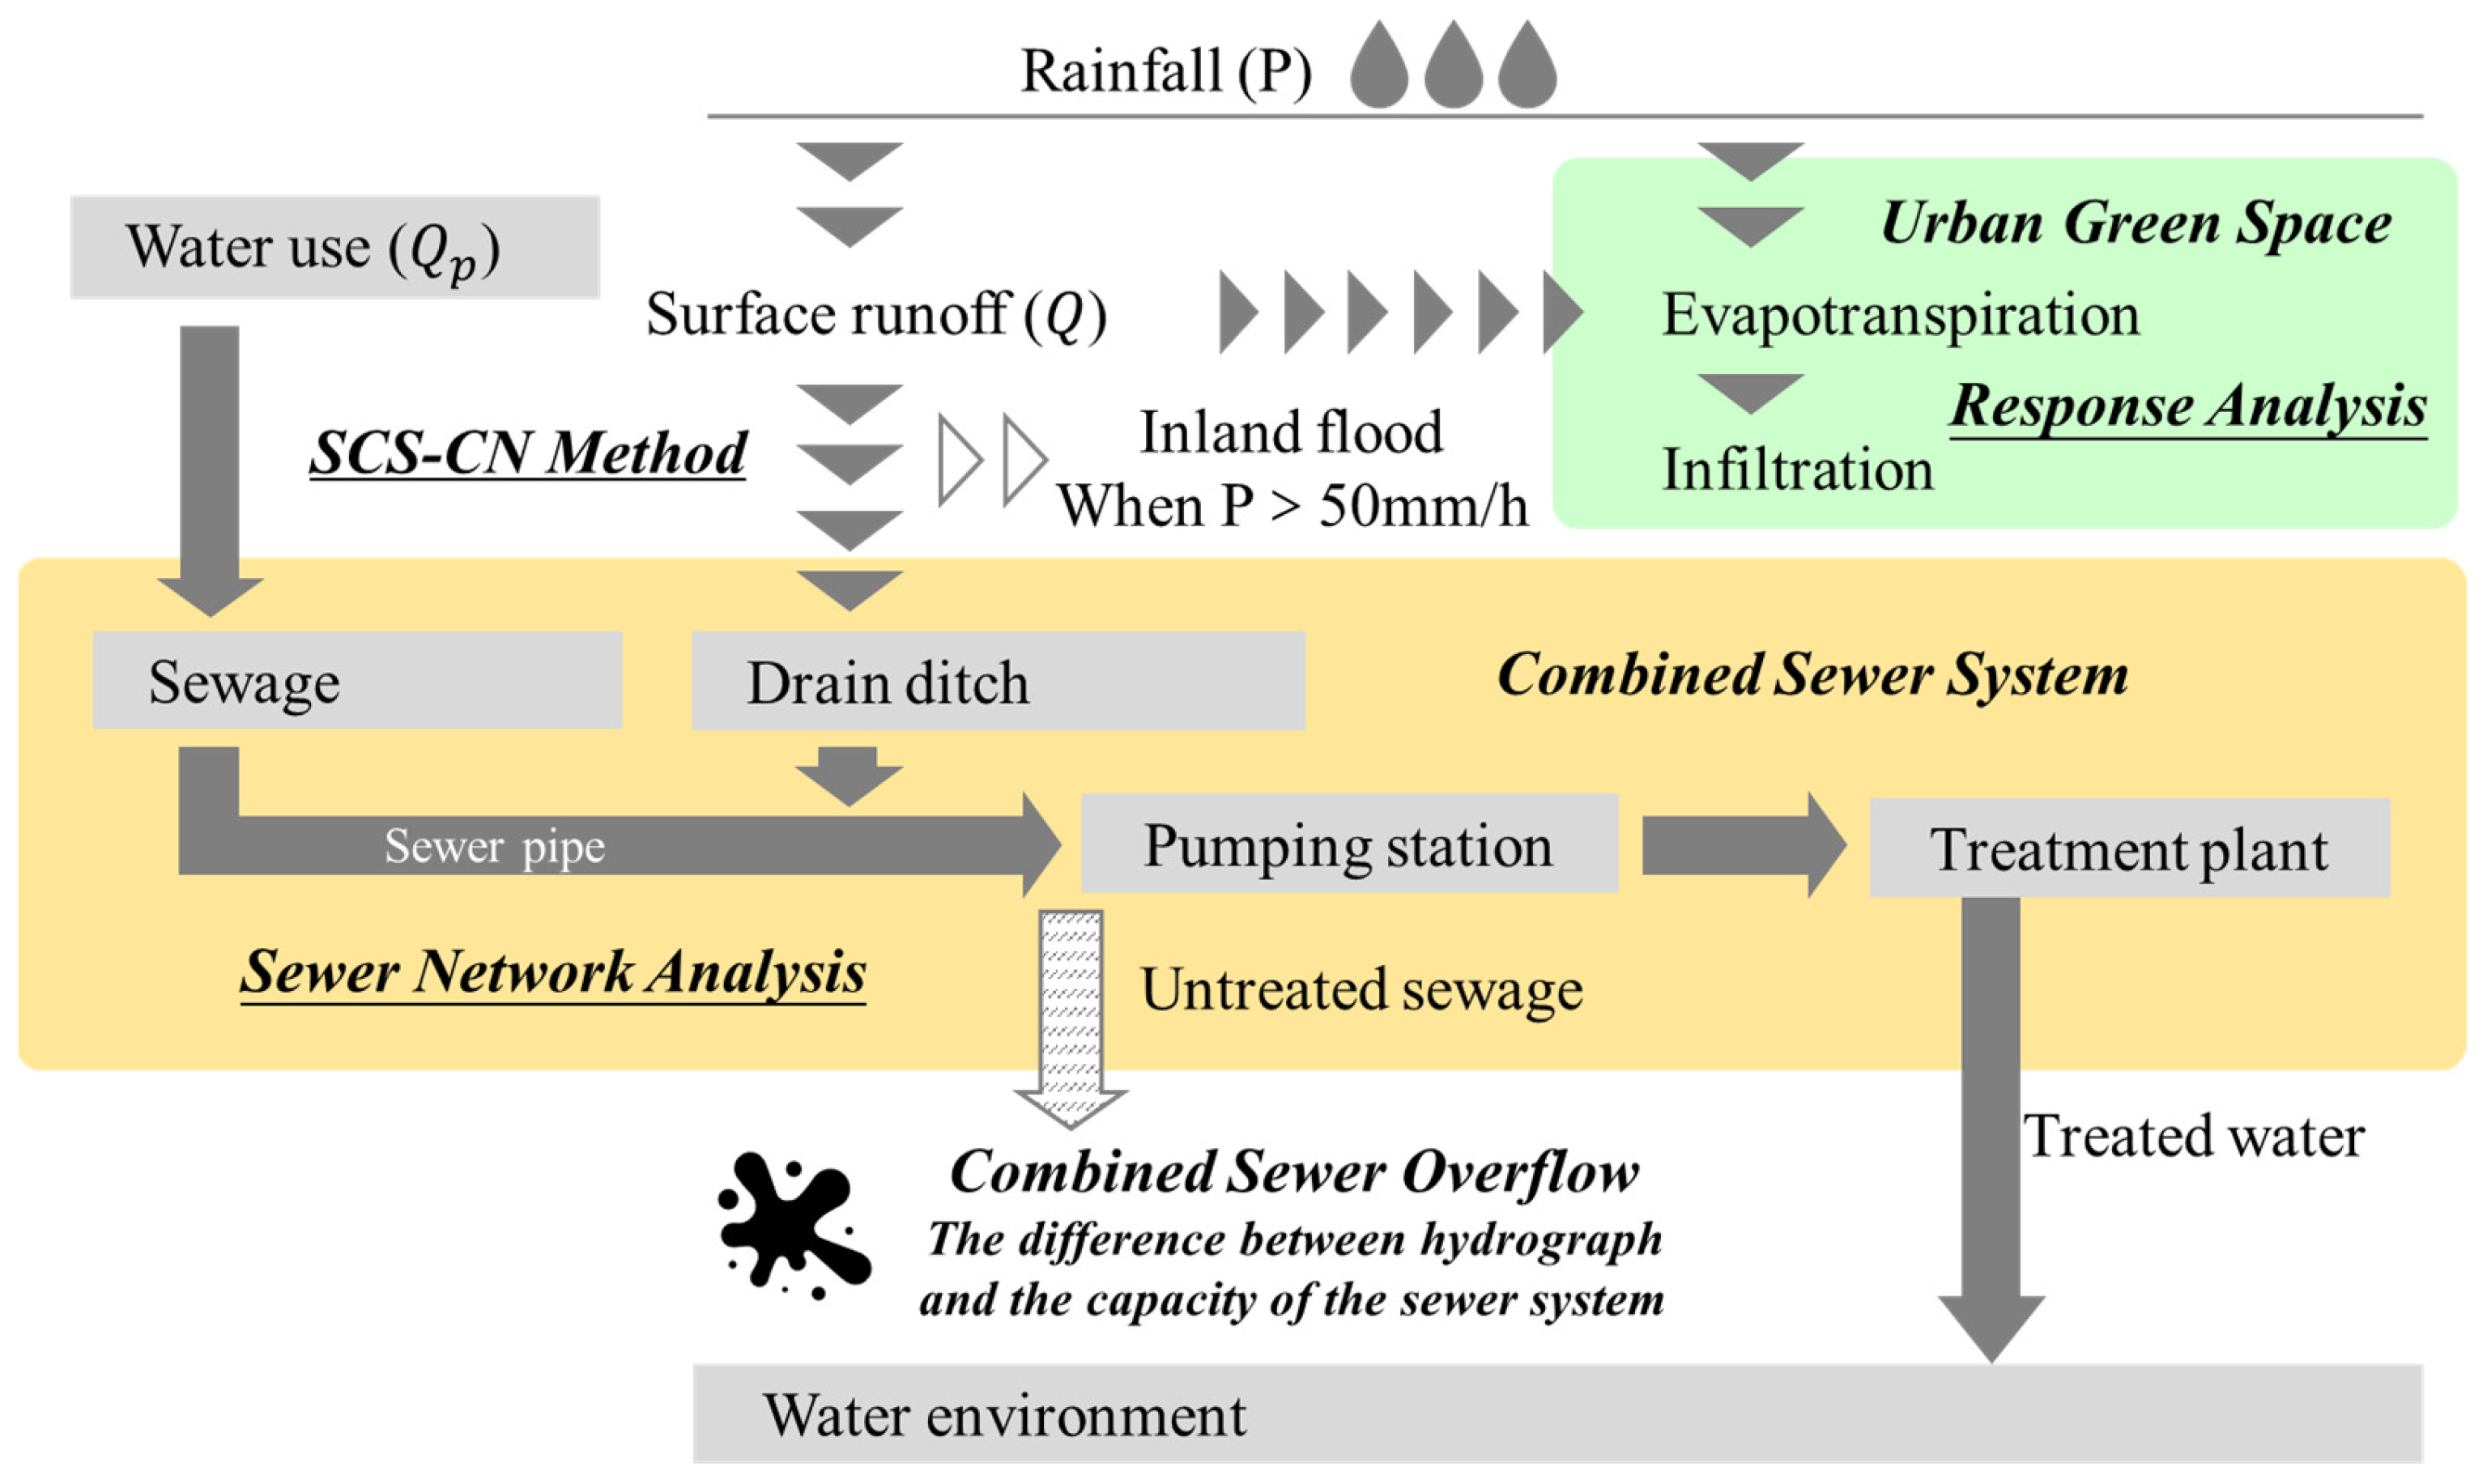
Figure 3.
Hydrograph at the terminal treatment plant in each sewer district under the different rainfall conditions. The horizontal arrows show the period of the simulated rainfall. The blue lines show the rainwater discharge reaching each terminal treatment plant under each rainfall intensity. The grey dotted lines and numbers indicate the capacity of each terminal treatment plant for receiving rainwater discharge. Thus, the difference between the rainwater discharge and the capacity for receiving rainwater indicates the estimated discharge of CSO in each sewershed.
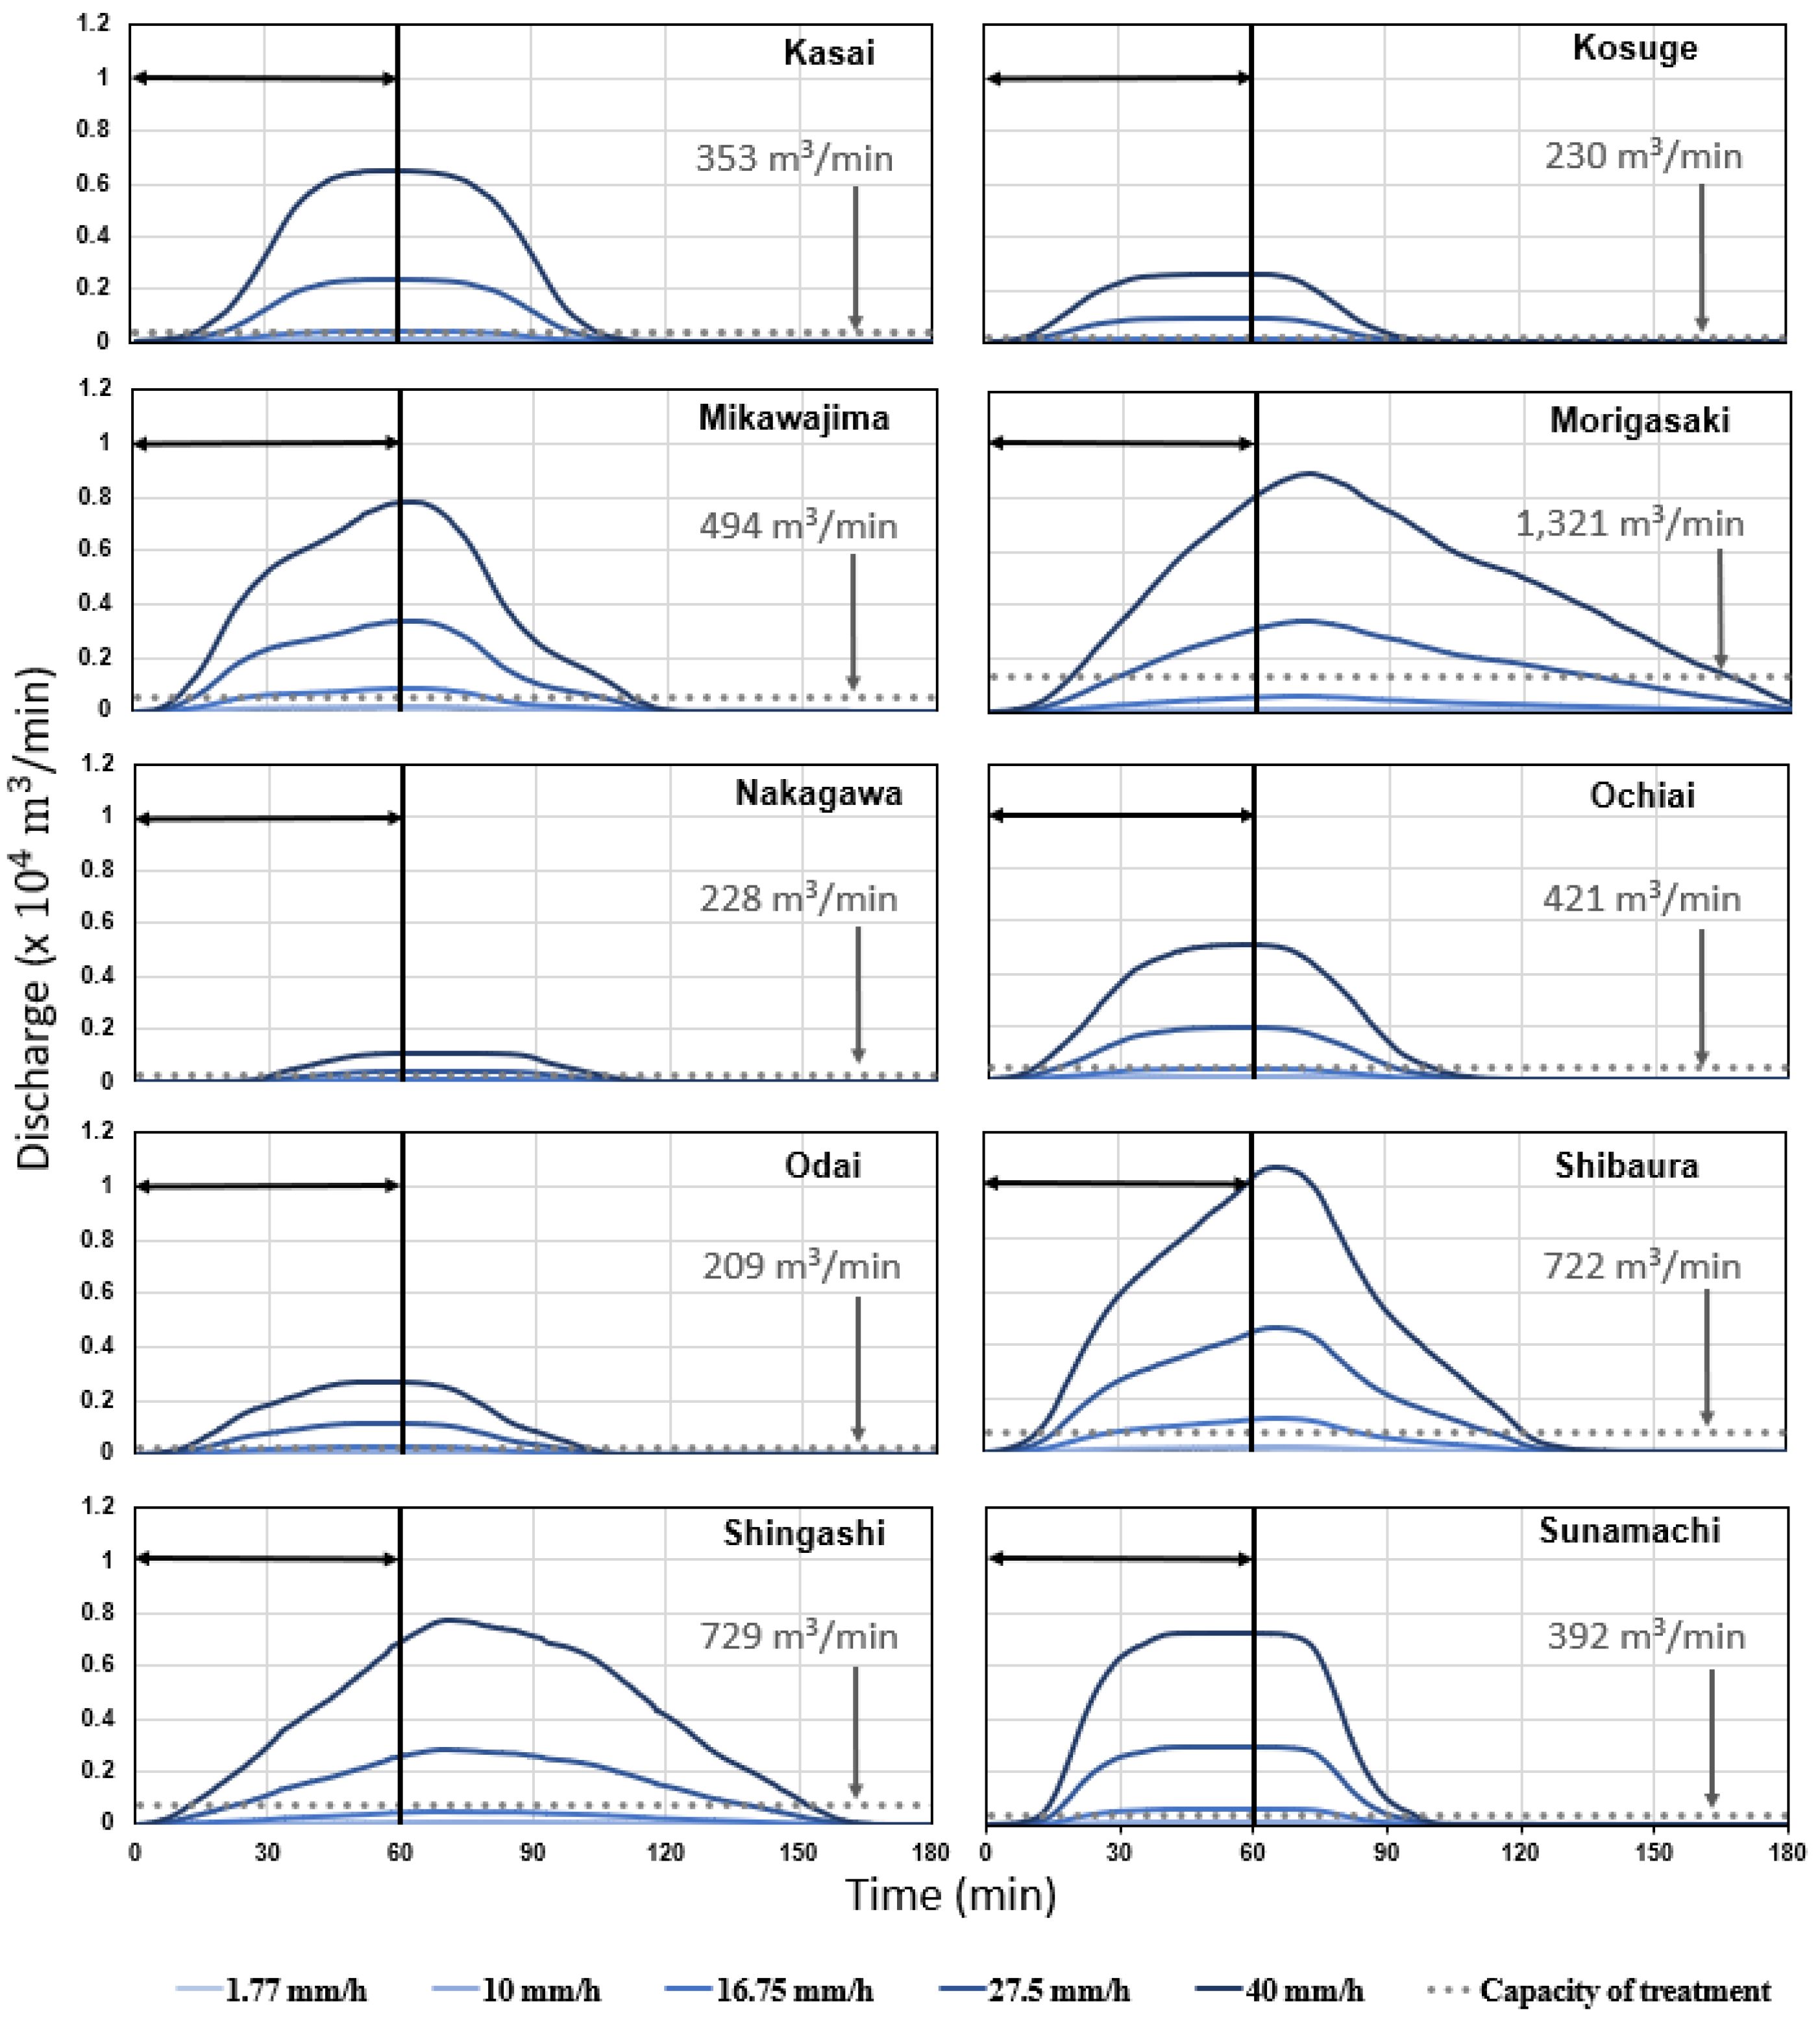
Figure 4.
Amount of CSO at various rainfall intensities in each sewershed. (a) Total volume of CSO including all areas. (b) Amount of CSO per area in each sewershed. The black dotted lines indicate the proportion of CSO for the total amount of rainwater at one rainfall event.
Figure 4.
Amount of CSO at various rainfall intensities in each sewershed. (a) Total volume of CSO including all areas. (b) Amount of CSO per area in each sewershed. The black dotted lines indicate the proportion of CSO for the total amount of rainwater at one rainfall event.
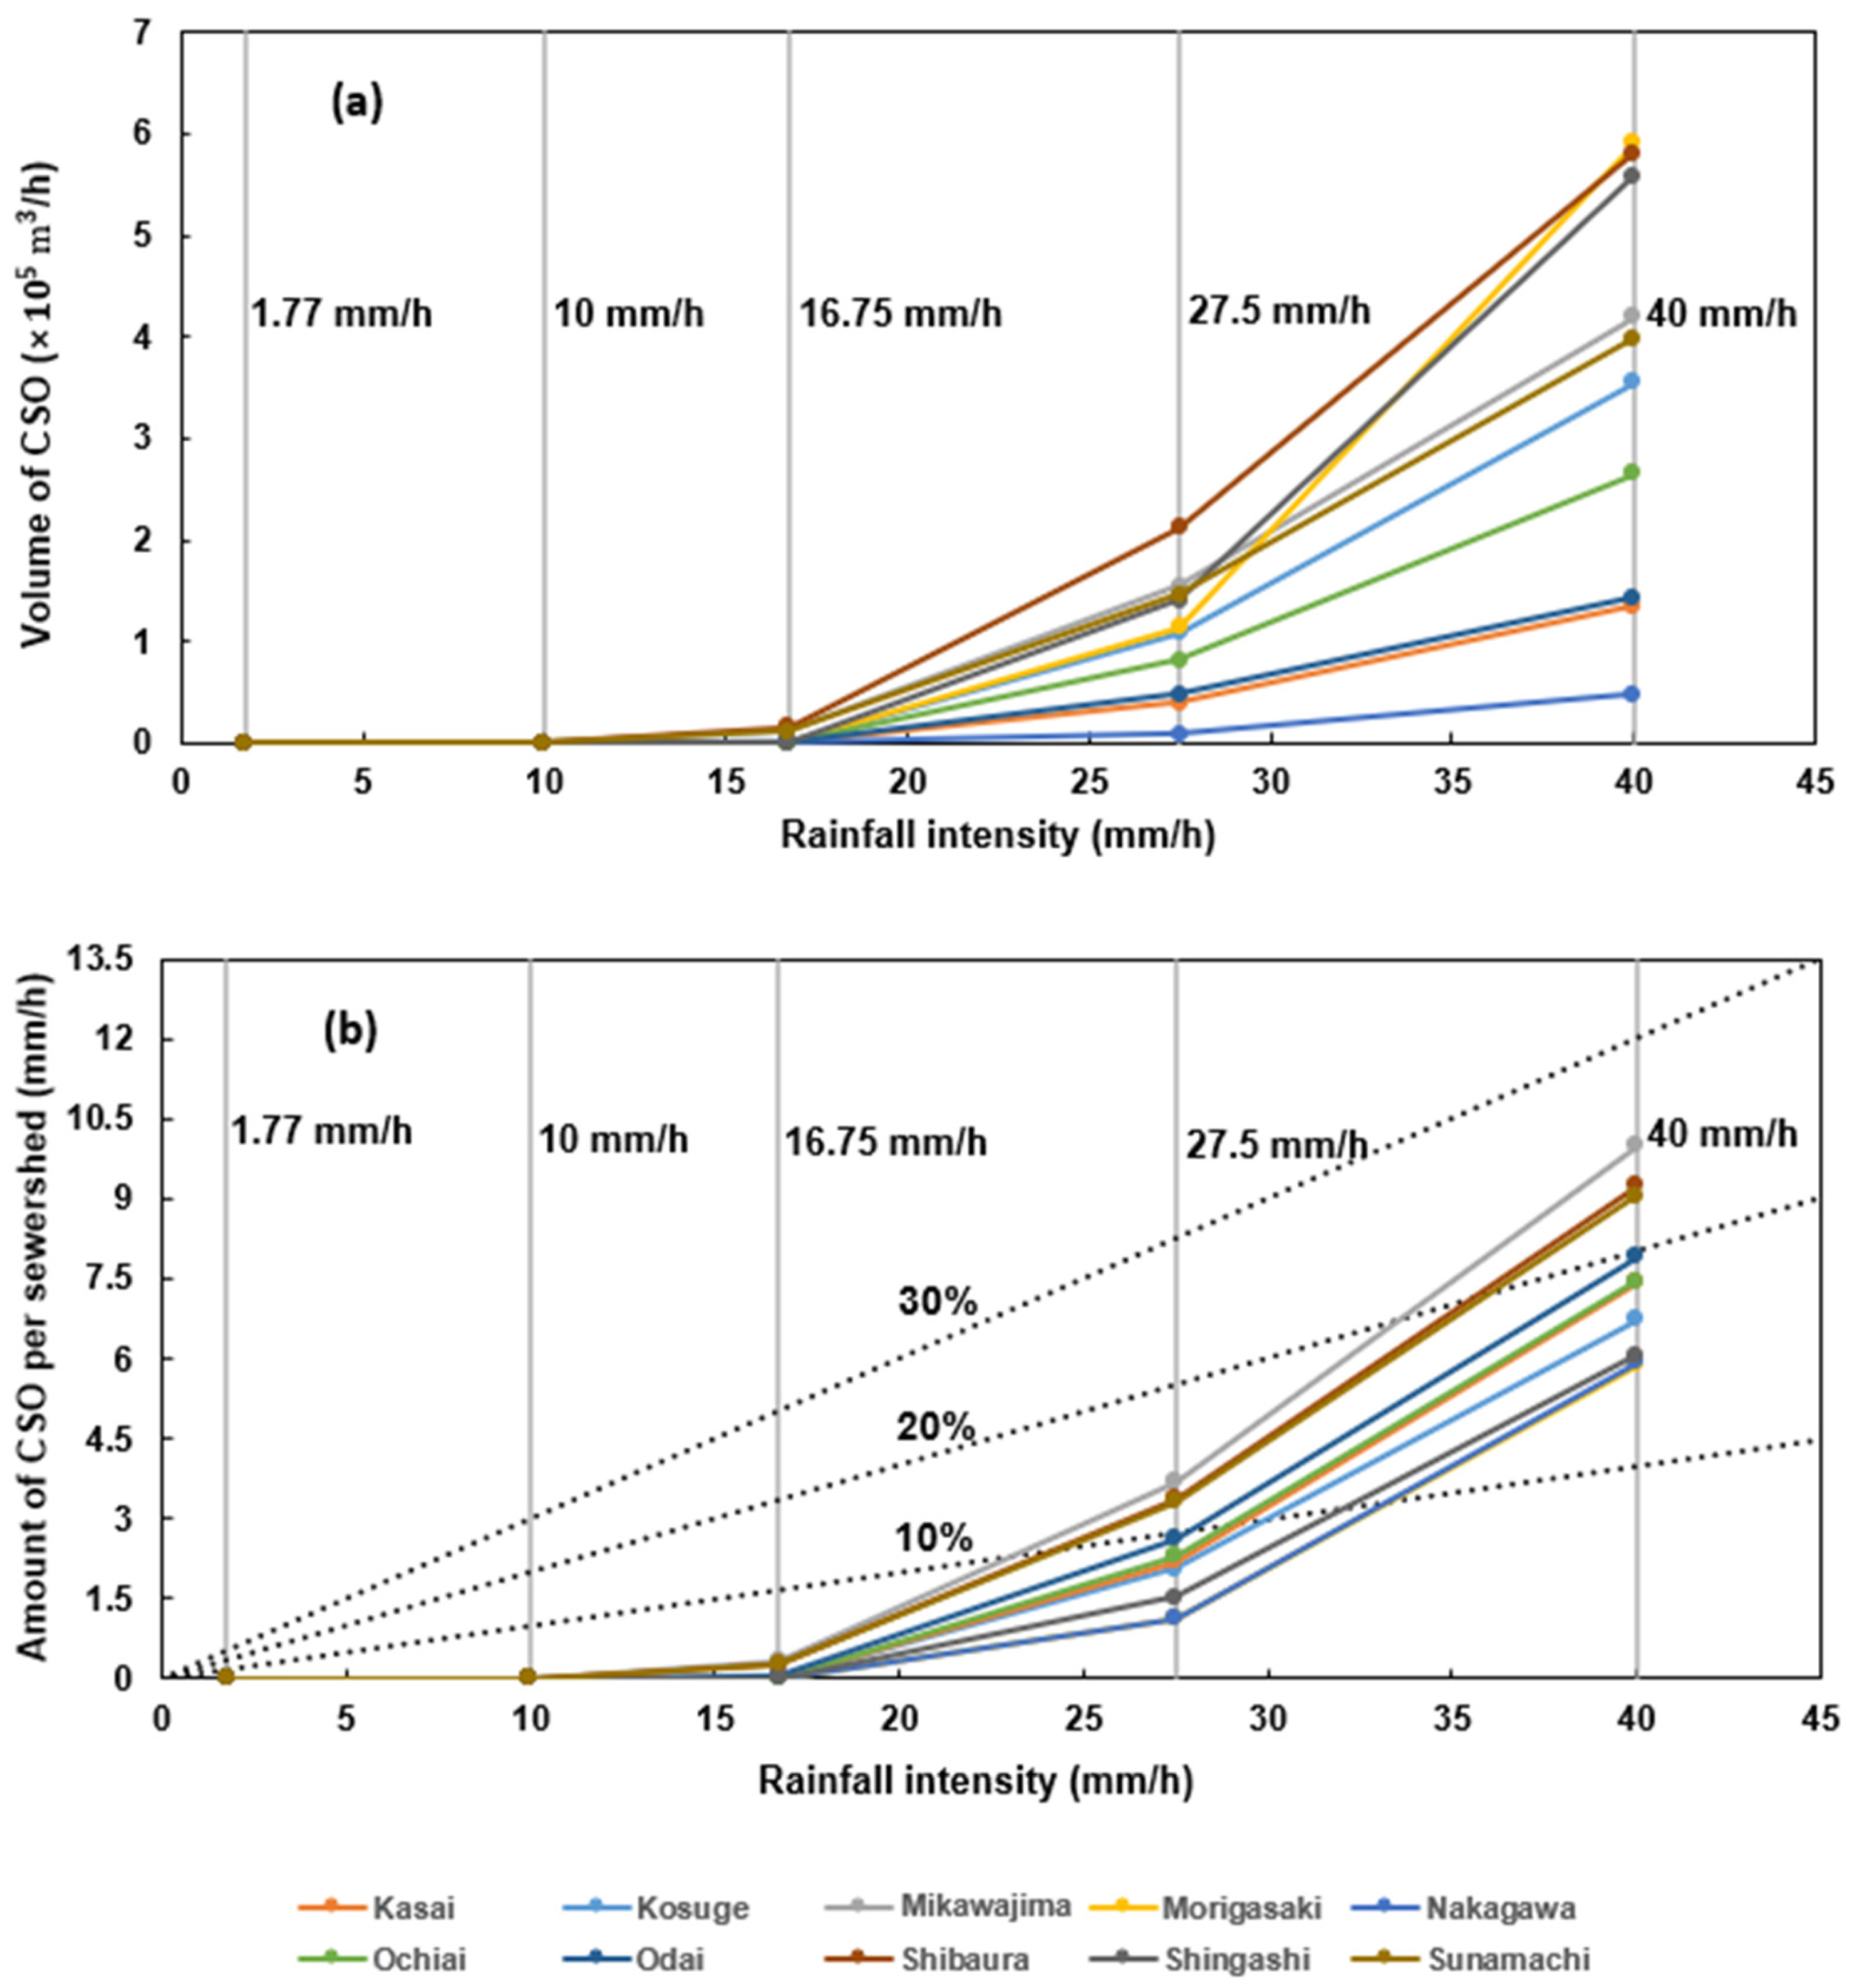
Figure 5.
Proportion of CSO in each rainwater event lasting 1 h with a rainfall intensity of (a) 16.75 mm/h, (b) 27.5 mm/h, and (c) 40 mm/h for each modified land use in terms of UGS proportion. The number in each graph shows the average change rate in CSO proportion based on 5% to 19% of each of the 10 sewersheds.

Figure 6.
Reduction rate of CSO per 1% change in UGS areal proportion when the UGS proportion is increased by 5% from 5%, 10%, and 15%, respectively. The results correspond to rainfall lasting 1 h with a rainfall intensity of (a) 16.75 mm/h, (b) 27.5 mm/h, and (c) 40 mm/h for each modification of UGS areal proportion. In addition, the y-axis on the right indicates the actual UGS proportion in each sewer district. Some of the sewersheds have no bar in (a) because no CSO was detected.

Table 1.
Characteristics of rainfall events in Tokyo during 2016–2020.
| Type of Rainfall Event | No. of Events | Average Rainfall Intensity (mm/h) | Maximum Rainfall Intensity (mm/h) |
|---|---|---|---|
| All events | 642 | 1.77 | 40.0 |
| More than 10 mm/h | 60 | 14.15 | 40.0 |
| More than 10 mm/h and lasting less than 3 h | 10 | 16.75 | 27.5 |
Disclaimer/Publisher’s Note: The statements, opinions and data contained in all publications are solely those of the individual author(s) and contributor(s) and not of MDPI and/or the editor(s). MDPI and/or the editor(s) disclaim responsibility for any injury to people or property resulting from any ideas, methods, instructions or products referred to in the content. |
© 2023 by the authors. Licensee MDPI, Basel, Switzerland. This article is an open access article distributed under the terms and conditions of the Creative Commons Attribution (CC BY) license (https://creativecommons.org/licenses/by/4.0/).
Share and Cite
MDPI and ACS Style
Ogawa, R.; Zhang, Y.; Theng, V.; Guo, Z.; Wang, M.; Yoshimura, C. Capacity Assessment of Urban Green Space for Mitigating Combined Sewer Overflows in the Tokyo Metropolitan Area. Land 2023, 12, 993. https://doi.org/10.3390/land12050993
AMA Style
Ogawa R, Zhang Y, Theng V, Guo Z, Wang M, Yoshimura C. Capacity Assessment of Urban Green Space for Mitigating Combined Sewer Overflows in the Tokyo Metropolitan Area. Land. 2023; 12(5):993. https://doi.org/10.3390/land12050993
Chicago/Turabian StyleOgawa, Ryohei, Ye Zhang, Vouchlay Theng, Zhongyu Guo, Manna Wang, and Chihiro Yoshimura. 2023. "Capacity Assessment of Urban Green Space for Mitigating Combined Sewer Overflows in the Tokyo Metropolitan Area" Land 12, no. 5: 993. https://doi.org/10.3390/land12050993
Note that from the first issue of 2016, this journal uses article numbers instead of page numbers. See further details here.