Article

Robust Satellite-Based Identification and Monitoring of Forests Having Undergone Climate-Change-Related Stress

1
Institute of Methodologies for Environmental Analysis, National Research Council, 85050 Potenza, Italy
2
School of Engineering, University of Basilicata, 85100 Potenza, Italy
3
School of Agricultural, Forest, Food, and Environmental Sciences, University of Basilicata, 85100 Potenza, Italy
*
Author to whom correspondence should be addressed.
Land 2022, 11(6), 825; https://doi.org/10.3390/land11060825
Submission received: 11 April 2022 / Revised: 28 May 2022 / Accepted: 28 May 2022 / Published: 31 May 2022
(This article belongs to the Special Issue New Insights in Remote Sensing of Land Use)

Abstract

:
Climate-induced drought events are responsible for forest decline and mortality in different areas of the world. Forest response to drought stress periods may be different, in time and space, depending on vegetation type and local factors. Stress analysis may be carried out by using field methods, but the use of remote sensing may be needed to highlight the effects of climate-change-induced phenomena at a larger spatial and temporal scale. In this context, satellite-based analyses are presented in this work to evaluate the drought effects during the 2000s and the possible climatological forcing over oak forests in Southern Italy. To this aim, two approaches based on the well-known Normalized Difference Vegetation Index (NDVI) were used: one based on NDVI values, averaged over selected decaying and non-decaying forests; another based on the Robust Satellite Techniques (RST). The analysis of the first approach mainly gave us overall information about 1984–2011 rising NDVI trends, despite a general decrease around the 2000s. The second, more refined approach was able to highlight a different drought stress impact over decaying and non-decaying forests. The combined use of the RST-based approach, Landsat satellite data, and Google Earth Engine (GEE) platform allowed us to identify in space domain and monitor over time significant oak forest changes and climate-driven effects (e.g., in 2001) from the local to the Basilicata region scale. By this way, the decaying status of the Gorgoglione forest was highlighted two years before the first visual field evidence (e.g., dryness of apical branches, bark detachment, root rot disease). The RST exportability to different satellite sensors and vegetation types, the availability of suitable satellite data, and the potential of GEE suggest the possibility of long-term monitoring of forest health, from the local to the global scale, to provide useful information to different end-user classes.

1. Introduction

Recent studies (e.g., [1,2,3]) report an increase in tree mortality due to climate change. Climate-induced tree mortality is affecting not only semi-arid regions but also mesic forests. It is a global phenomenon that impacts monsoonal savannas as well as conifer and broadleaves forests with a Mediterranean and tropical climate [4]. More frequent, long-lasting, severe events of drought and heat stress are among climate-driven causes of forest decline and die-off. Drought and/or heat-induced forest mortality is documented in several cases, in the last decades, all around the world [4].
Deadly effects on vegetation may be evident even after years from drought stress periods [4], but stress-induced tree mortality is usually preceded by functional and structural changes (see, for instance, growth changes [5]). Vegetation response to drought can be different on a local scale because several factors, such as soils, topographic position, tree density, and root systems, may play a different role [6,7]. Drought and heat stress may lead to a leaf area reduction and crown dieback up to a broad-scale forest die-off [8]. In the western Mediterranean region, recent studies [9] indicate drought as the main driver of the oak decline. Apart from site-specific conditions, some oak species are more drought-tolerant than others. Some authors [10] suggest, for example, the following increasing tolerance rank: Quercus robur (less tolerant), Quercus cerris, Quercus frainetto, Quercus pubescens, Quercus ilex, Quercus suber (more tolerant). A decline is documented in different Italian regions both in the north (Piedmont [11]) and in the south (in Sicily [12] and Basilicata [9,13]). In particular, in Southern Italy, several oak species have shown decline and mortality since the 2000s due to drought stress [10].
Stress analysis may be carried out by using more or less complex field methods such as the computation of simple visual assessment (based on leaf/crown transparency [14]) and multispectral indices, eddy covariance techniques, analyses of tree rings, and measurements of foliage/whole-tree photosynthesis rates, as well as sap-flow rates ([15], and references therein). Those methods may provide detailed information about analyzed dying/healthy trees and, in particular, relevant information on the causal and functional factors driving the mortality of trees in response to intense dry events. However, their application is manpower-, money-, and time-consuming. Moreover, they have clear space-time limitations as they may be applied on a local scale and limited periods.
In a complementary way to field methods, remote sensing techniques may be particularly useful to study climate change-induced phenomena, looking at their effects at a larger spatial and temporal scale. A recent review [16] reports many research works focused on the assessment and monitoring of forest health by using remote sensing techniques from UAV, airborne, and satellite platforms, with passive and active sensor types, multispectral and hyper-spectral technologies, etc. As compared with multispectral information from sensors on manned or unmanned platforms, satellite data allow us to monitor vegetation, computing multispectral vegetation indices which are related to the status of vegetation [17], on a larger spatial and temporal scale. In addition, the use of long time series of satellite data has proved to be suitable to follow space-time dynamics of vegetation and monitor forest decline/mortality in different environments (e.g., birch forest in China [18], oak populations in Iran [19], pine and oak trees in the Mediterranean area [20]).
In the specific context of drought-induced impact on forests, different satellite sensors have been used to monitor and evaluate drought effects on a large scale ([16,21], and references therein). Among them, instruments aboard the Landsat series are particularly useful for that purpose e.g., [22,23,24] thanks to the right trade-off between temporal revisit time and spatial resolution, as well as their multi-decennial lifetime. On the other hand, the use of suitable satellite data is not enough to extract useful information. Signal natural variability due to phenological phases and weather conditions can mask the effects of climate-change-related stress. Moreover, since site-specific conditions may affect forests on the local scale, analyses should be performed at different spatial levels. Nevertheless, analyses are mainly carried out on a local level or, however, uniquely on the local, regional, or continental scale ([16], and references therein).
In this work, in order to identify and monitor forests having undergone climate-change-related stress, a long-time series of Landsat data were exploited to analyze oak stands in Southern Italy both on the local scale (on selected decaying and non-decaying small forests) and on a larger scale (Basilicata region). Two approaches, based on the well-known Normalized Difference Vegetation Index (NDVI, [25]) were used: one based on NDVI values, averaged over the selected forests; another based on the Robust Satellite Techniques (RST, [26,27]). All procedures were implemented on Google Earth Engine (GEE, [28]) since this computing platform has shown to be extraordinarily useful for analyzing long time series of satellite data, particularly in the context of vegetation monitoring (e.g., [18,29,30]).

2. Material and Methods

In this section, we present data and methodologies we used to evaluate the effects of drought events, occurring around the year 2000, on oak forest areas in Southern Italy. We employed the commonly used Normalized Difference Vegetation Index (NDVI, [25]), based on a long time series of Landsat 5 images (1984–2011). To this aim, we first analyzed the trends of the NDVI values averaged over selected decaying and similar (e.g., in terms of soil and vegetation characteristics) close non-decaying forests mainly to show what an NDVI-based analysis can highlight. Then, a more refined methodology such as the Robust Satellite Techniques (RST, [26,27]) approach was mainly used to identify in the space-time domain those areas showing anomalous decreases in the NDVI values. Indeed, in different fields of application (e.g., [31,32,33,34,35,36,37]), this robust change detection methodology has proved to be able to identify actual anomalous signals thanks to a preliminary characterization of satellite signals under unperturbed conditions.

2.1. Study Area

The Basilicata region (Southern Italy) is characterized by hot dry summers and severe dry winters, where the continental element dominates, as well as humid weather in all seasons, in the west coastal part, due to the Mediterranean Sea influence [38]. Basilicata climate is strongly influenced by orography, with areas characterized by high water deficit up to zones with high precipitation (even higher than 2000 mm/year). On the basis of the Standardized Precipitation Index (SPI, [39]) and the De Martonne aridity index [40] over the period 1993–2004, three areas have been identified [38]: (i) from moderate to extremely humid (Tyrrhenian side), (ii) normal (mainly corresponding to the Basilicata central area), and (iii) dry (Ionian coast and Basilicata Eastern side). The Standardized Precipitation-Evapotranspiration Index (SPEI, [41,42]) over the Basilicata region (Figure 1) highlights several short dry periods (e.g., in spring 1989, autumn 1990), but it shows a severe and prolonged drought period in the early 2000s.
In Basilicata, oak forests represent about 52% of the whole forest area and are present with different structural and composition typologies, from 400–500 to 1200 m a.s.l. [43]. In such a region, field surveys in specific places (e.g., Gorgoglione and San Paolo Albanese, Figure 2, Figure 3 and Figure 4) have pointed out the decline of oak forests after drought events [9,10,13,20,44,45].
Oak decline in the municipality of Gorgoglione has been evident from visual assessments only since 2003, when about 20% of the forest trees showed dryness of apical branches, bark detachment, and root rot disease [13]. From 2002 to 2004, oak mortality in this area increased from 5% to 10% [10]. Field surveys have been recently carried out in such a mixed forest, which is mainly characterized by Quercus cerris, Quercus pubescens, and other broadleaf species [10]. Field and laboratory analyses of decaying and non-decaying couples of trees [10,13] showed a drought-induced decline since the early 2000s [10].
A similar survey has been carried out in the municipality of San Paolo Albanese in a monospecific forest characterized by Quercus frainetto. Like the Gorgoglione site, the San Paolo Albanese forest has shown shoot dieback, leaf loss and withering, growth decline, and high mortality since the early 2000s [44]. In particular, according to the same authors [44], the onset of dieback was in 2002.
In order to evaluate the stress effects due to the 2000s drought events and the possible climatological forcing, the satellite-based analysis presented in this work was carried out at two different spatial scales:
  • on a local scale, i.e., analyzing data concerning decaying (D) forests in the municipalities of Gorgoglione and San Paolo Albanese. By comparison, similar (e.g., in terms of soil and vegetation characteristics) not-so-far non-decaying (ND) forests were considered in the municipalities of Accettura-Pietrapertosa and San Paolo Albanese, respectively (Figure 3 and Figure 4).
  • on a larger scale, considering oak forests in the Basilicata region.

2.2. Data

2.2.1. Satellite Data

To evaluate oak forest changes induced by the series of drought events that occurred around the year 2000, we used data from Thematic Mapper (TM) aboard the Landsat-5 platform. Its spatial resolution (30 m), 16-day revisit period, very long life (active from March 1984 to November 2011), and timespan straggling the period of drought events under study made TM-Landsat 5 the most suitable choice. No data from sensors aboard other Landsat platforms were used in order to avoid the introduction of possible errors due to cross-calibration, which is required by the different spectral response profiles [47]. We considered, as a dataset τ, all available TM-Landsat-5 (Path: 188, Row: 032) images from 1 June to 30 September (i.e., the period including the maximum oak crown extent), from 1984 to 2011. No 2007 cloud-free image is available for the summer season.
In the GEE procedures (described in Section 2.3.2), all available Level 1—Terrain Corrected images, in terms of Top-Of-Atmosphere (TOA) reflectance, belonging to the dataset τ, were considered, for a total amount of 150 images.

2.2.2. Land Cover

The distribution of oak forests in the Basilicata region was obtained from land cover information available on the Italian Institute for Environmental Protection and Research (ISPRA—Istituto Superiore per la Protezione e la Ricerca Ambientale) portal [48]. We downloaded Level 4 of three CORINE Land Cover (CLC, [49]) maps, related to 2000, 2006, and 2012, to take into account all the updated versions within the long-term period investigated. For each CLC map, we selected the informative layers of interest, i.e., 3.1.1.1 (Mediterranean evergreen oak forests) and 3.1.1.2 (Deciduous oak forests). In particular, we pointed at identifying only the areas that maintained the same vegetation cover type in the analyzed period. To this aim, we performed a vector intersection between the three CLC maps to select only the informative layers of interest. In this way, we obtained a final informative layer of (permanent in the considered period) oak forest areas over the Basilicata region (Figure 5).

2.2.3. Global Forest Change Data

The Hansen [50] Global Forest Change (GFC) dataset was used for comparison with the results achieved by our analysis at the scale of the Basilicata region. It is available in GEE as Hansen Global Forest Change v1.9 product and represents forest change, at 30 m resolution, between 2000 and 2021. The product is based on data from the Enhanced Thematic Mapper Plus (ETM+) sensor aboard Landsat-7 and consists of different bands such as the aggregated forest loss, gain, and year of occurred loss. Information from year of occurred forest loss were used in this work.

2.3. Methodologies

2.3.1. NDVI Spatial Average and RST-Based Approach

The analyses carried out in this work are based on the Normalized Difference Vegetation Index (NDVI, [25]). NDVI is a widely used index since it is a powerful indicator of greenness, health, and growth of vegetation and a suitable tool to improve impact assessments of disturbances such as drought [51]. NDVI is computed on the basis of near-infrared (NIR) and visible (VIS) spectral radiances:
NDVI = NIR VIS NIR + VIS
In this paper, NIR is represented by the TOA reflectance measured in the band B4 (0.76–0.90 μm) of TM-Landsat 5 and VIS is the TOA reflectance measured in the band B3 (0.63–0.69 μm). Three preliminary steps were carried out:
(a)
the removal of satellite images with georeferencing errors from the dataset τ. The new dataset (τ′) was so made of 148 images;
(b)
the exclusion of the pixels affected by clouds or cloud shadows from further processing phases;
(c)
the computation of the NDVI(x,y,t) values, for each pixel centered at (x,y) and not excluded during step b), for each available satellite image acquired at the time t (with t ∈ τ′).
After the three above-mentioned steps, two approaches were used to evaluate the effects of drought events on the oak population.
The first approach we used in this work is based on the computation of the NDVI spatial average for each forest test site. In particular, we calculated mean values of NDVI (x,y,t) within the D areas of Gorgoglione (“GORG”) and San Paolo Albanese (“SPA”) as well as the ND forests of Accettura-Pietrapertosa (“AP”) and San Paolo Albanese (Figure 3 and Figure 4), in order to generate NDVIGORG_D(t), NDVISPA_D(t), NDVIAP_ND(t), and NDVISPA_ND(t), respectively, for each available satellite image acquired at the time t (t ∈ τ′).
The second approach we used is based on the Robust Satellite Techniques (RST, [26,27]). Such a methodology has been successfully applied both to polar and geostationary satellite sensor data in different fields of application such as volcanic (e.g., [52]), seismic (e.g., [53]), hydrological [54,55], and fire [37] risks, as well as in the context of cloudy-radiance detection [56], Saharan dust (e.g., [57]), gas flaring (e.g., [33]), and sea quality (e.g., [34,58]) monitoring. RST is a change detection methodology that identifies as “anomalous” the signal that deviates significantly from its behavior in the normal conditions of the specific place and time of observation. It relies on the Absolutely Local Index of Change of the Environment (ALICE), so defined:
V ( x , y , t ) = V ( x , y , t )     μ V ( x , y ) σ V ( x , y )
where V(x,y,t) is the value of the V signal, measured at the place with coordinates (x,y) and at the time t. μV(x,y) and σV(x,y) are the temporal mean and standard deviation, respectively, and represent the expected value and the normal variability of the signal V(x,y,t) itself. We will refer to them as “reference fields” henceforth. They are computed on the basis of a multi-year dataset of cloud-free satellite records, which are collected under the same observational conditions (e.g., same platform, time of day, month/season of the year) as the image to be processed. By construction, the index in Equation (2)
  • reduces the effects of known sources of natural (e.g., topography, land cover) and observational (e.g., solar illumination, satellite view angle) noise;
  • takes account of the effects of the residual noise due to the non-predictable signal variability in the space-time domain (e.g., changes in soil and atmospheric moisture);
  • is intrinsically robust against false alarm proliferation.
Moreover, it should be highlighted that the index (2) is a standardized variable, for its inherent design, that should show a Gaussian behavior (i.e., mean ~0 and standard deviation ~1). The higher the absolute value measured, the lower the probability of occurrence. In particular, the probability of occurrence of an anomalous signal decreases from about 4.5% for |⨂V| > 2 (level of statistical significance) to 0.3% for |⨂V| > 3 and even lower values for increased absolute values of ⨂V [59].
In the RST-based analysis we carried out, V(x,y,t) is not represented by the simple NDVI(x,y,t) value of each pixel centered at (x,y) on the TM-Landsat-5 image acquired at the time t (with t ∈ τ′). In order to better characterize the signal corresponding to the maximum crown extent as well as reduce cloud contamination (possibly missed in the cloud detection phase) and other effects due to different observational conditions (e.g., atmospheric transmittance, satellite view angle), the Maximum Value Composite (MVC, [60]) of NDVI was indeed considered as V(x,y,t). Therefore, this second approach may be summarized in the following phases:
  • the computation of NDVIMVC(x,y,t′) for each pixel (x,y) and each year t′ (t′ ∈ τ′), retaining the highest NDVI(x,y,t) value on a 4-month basis (June, July, August, and September);
  • the calculation of reference fields, μNDVI_MVC(x,y) and σNDVI_MVC(x,y), considering all NDVIMVC(x,y,t′) with t′ ∈ [1984–1997] (i.e., considered as an unperturbed or less perturbed period);
  • the computation of the ALICE index (⨂NDVI_MVC (x,y,t′)) for each pixel (x,y) and t’ ∈ [1984–2011], following Equation (3):
NDVI _ MVC ( x , y , t ) = NDVI MVC ( x , y , t )     μ N D V I M V C ( x , y ) σ NDVI _ MVC ( x , y )
NDVI_MVC (x,y,t′) gives the local excess of the NDVIMVC(x,y,t′) signal compared with its historical mean value, μNDVI_MVC(x,y), and weighted by its historical variability σNDVI_MVC(x,y), at the considered location (x,y) and time of observation t′. In the case of decaying forests, anomalous decreasing values of NDVIMVC(x,y,t′) and, consequently, negative ⨂NDVI_MVC(x,y,t′) are expected. In particular, the more anomalous NDVIMVC(x,y,t′), the more negative ⨂NDVI_MVC(x,y,t′).
In our analysis, we wanted to highlight phenomena with a low probability of occurrence and, for this reason, taking into consideration what is said before, we considered as “strongly anomalous” those pixels with ⨂NDVI_MVC(x,y,t′) ≤ −3.

2.3.2. Procedure Implementation on Google Earth Engine

Landsat-TM Data Pre-Processing, NDVI Trend Extraction, and RST-Based Processing

The two approaches before described were implemented on the GEE platform [28]. TOA reflectances of Landsat 5 TM Collection 1 Tier 2 were used in our investigation. As already mentioned, we analyzed the scenes collected over the Basilicata region (Path: 188, Row: 032), in June, July, August, and September, from 1984 to 2011. The initial 150 available scenes were reduced to 148 after applying the filter requiring a high geometric accuracy (i.e., “GEOMETRIC_RMSE_VERIFY” < 1).
To filter out the pixels contaminated by clouds, the TM-Landsat quality band was used to select only clear pixels (i.e., “BQA” = 672). Moreover, aimed at removing residual undetected reflecting clouds, the RST-based OCA approach (One-channel Cloud-detection Approach, [56]) was used by exploiting channel B1 (0.45–0.52 µm). Reference fields, μB1(x,y) and σB1(x,y), were computed on a monthly basis and a multi-year dataset [1984–2011], following RST rules. Then, we applied Equation (2) with V(x,y,t) ≡ B1(x,y,t):
B 1 ( x , y , t ) = B 1 ( x , y ,   t ) μ B 1 ( x , y ) σ B 1 ( x , y )
Pixels with ⨂B1 (x,y,t) ≥ 1 were considered contaminated by clouds. Finally, the locations affected by cloud shadows, which were undetected by the CFMask (C Function of Mask, [61]) algorithm, were identified by taking into account the information on Sun azimuth angle stored in the metadata (i.e., “SUN_AZIMUTH”) file for each TM image.
For each pixel that was not affected by clouds/shadows, the NDVI index (Equation (1)) was computed by using band B4 (0.76–0.90 µm) and band B3 (0.63–0.69 µm). After the ingestion of the vector layers of D and ND forests, we computed the NDVI spatial average for all test sites and then plotted them as a time series (see next section, Figure 6). Finally, as above-mentioned, we implemented the RST approach on the MVC of NDVI, rather than the simple NDVI. So, for each year t′ (t′∈ [1984–2011]) and clear pixel, the highest value of the NDVI recorded from June to September was used to generate a synthetic image that was representative of the annual MVC, i.e., NDVIMVC(x,y,t′). A total of 27 NDVIMVC images were generated, from 1984 to 2011, being 2007 not available. Using NDVIMVC images from 1984 to 1997, the RST reference fields, μNDVI_MVC(x,y) and σNDVI_MVC(x,y), were computed. In the end, for each pixel of the annual synthetic NDVIMVC images, the ALICE index ⨂NDVI_MVC (x,y,t′) was computed as described in Equation (3). After the ingestion of the vector layer of Basilicata oak forests as well, the following RST-based products were generated:
  • 1984–2011 time series of the number of strongly anomalous pixels (⨂NDVI_MVC(x,y,t′) ≤ −3), which were spatially added within each test site (D/ND and Basilicata oak forests; see next section, Figure 7 and Figure 9);
  • 27 maps of ⨂NDVI_MVC (x,y,t′), for each year t′ ∈ [1984–2011] (some examples are in Figures 8 and 10);
  • one map reporting pixel-by-pixel the number of strongly anomalous pixels, which are temporally (from 1984 to 2011) added (see next section, Figure 11).

Global Forest Change Data Processing and Annual Forest Loss Trend Computation

The Hansen GFC product was used to build the annual time series of forest loss from 2001 to 2011. 2007 was not considered since, in our analysis, data of this year were not available. For each year and within the Basilicata oak forest informative layer, we computed the annual forest trend, by counting the pixels with value 1 in the “lossyear” band.

3. Results and Discussion

A comparative analysis between D and ND forests was made considering the results of the first approach, based on the NDVI spatial average, in order to highlight possible different trends, particularly in correspondence with drought events in the 2000s. Figure 6a reports the values of NDVIGORG_D and NDVIAP_ND for each available TM-Landsat-5 summer image, from 1984 to 2011. It is clear that since the 1980s, the ND forest has had greater values than the D one. This indicates that the ND forest has always been more vigorous and/or with dense canopy.
Their variations seem to be synchronous, indicating a common forcing factor, and, in fact, trend lines run almost in parallel. The NDVI values of the two forests do not show any clear evidence of a convergent or divergent trend. Both of them record a decrease in the early 2000s, but the time series shows minimum values in other periods too (NDVIGORG_D is 0.466 on 9 September 1990; NDVIGORG_ND is 0.539 on 20 August 2006). On the whole, the NDVI values show a rising trend and, after their abrupt decrease around 2000, they try to reach again, in the following years, the values of the last 1990s. Although, as said before, vegetation response to dryness periods may be different in time and space, it is worth noting the likeness between such time series and SPEI-12 (Figure 1). In particular, some plot elements (e.g., the prolonged signal depression around the year 2000 and the subsequent increase, followed by a new signal decrease) are similar.
Figure 6b reports the trends for NDVISPA_D and NDVISPA_ND. Likewise, Accettura-Pietrapertosa/Gorgoglione test sites, the two time-series of NDVI related to San Paolo Albanese forests seem to be synchronous, but on the whole, the trend lines show a quite evident convergence. No particular variations are identifiable in the early 2000s; 0.465 is the minimum reached by NDVISPA_D on 20 August 2006, and 0.524 by NDVISPA_ND on 18 September 2005. NDVIs decrease around 2000 and then try to increase again.
Different drought-tolerance of species should be considered among the possible reasons of the trend differences observed between the analyzed oak forests. In fact, it may be supposed a different drought response of a mixed stand, such as the Accettura-Pietrapertosa/Gorgoglione forests, respect to a monospecific stand such as in San Paolo Albanese.
It should be highlighted that the above-described trends of the NDVI spatial average over D/ND forests in Gorgoglione/Accettura-Pietrapertosa and San Paolo Albanese are in agreement with findings obtained in a recent study [20] over the same areas using the maximum annual NDVI value of MODIS aggregated products, over the period 2001–2019.
This first analysis allowed us to highlight the raising trends of the forests on the whole as well as the temporary decrease around the year 2000.
Concerning the RST-based approach, to highlight vegetation areas with a worsening of health over the analyzed period, strongly anomalous NDVIMVC(x,y,t′) values (⨂NDVI_MVC (x,y,t′) ≤ −3) were considered. As described in the implementation section, such anomalous pixels were counted per year and over each investigated area (D and ND forests in Gorgoglione/Accettura-Pietrapertosa and San Paolo Albanese as well as oak forests in the Basilicata region). The results are shown in Figure 7a (Gorgoglione/Accettura-Pietrapertosa), Figure 7b (San Paolo Albanese), and Figure 9 (Basilicata). They are presented as percentages since areas have a different extension and, in order to make even small variations clear, the scale of each graphic is adapted to the data of each test area.
The RST-based analysis on the local scale (Figure 7) shows that:
  • the synchronous peak in 2001 in all graphics (both in the D and ND forests of Gorgoglione, Accettura-Pietrapertosa, and San Paolo Albanese) is probably the effect of a climatological forcing;
  • during the period 1984–1997, adverse local conditions could be responsible for some asynchronous peaks (in 1989 for D; in 1992 for ND) just in San Paolo Albanese forests (Figure 7b);
  • as above-mentioned (Figure 6), a different initial health status of forests seems to exist even before 2000s. This condition, together with local factors, could be responsible for the different responses in oak to drought in the early 2000s. In fact, the D forests show higher percentages of anomalous pixels than the ND ones. For example, in 2001 the D forest in Gorgoglione records a percentage three times greater than the ND Accettura-Pietrapertosa area (Figure 7a); in the same year, in San Paolo Albanese corresponding percentages are double the other (Figure 7b);
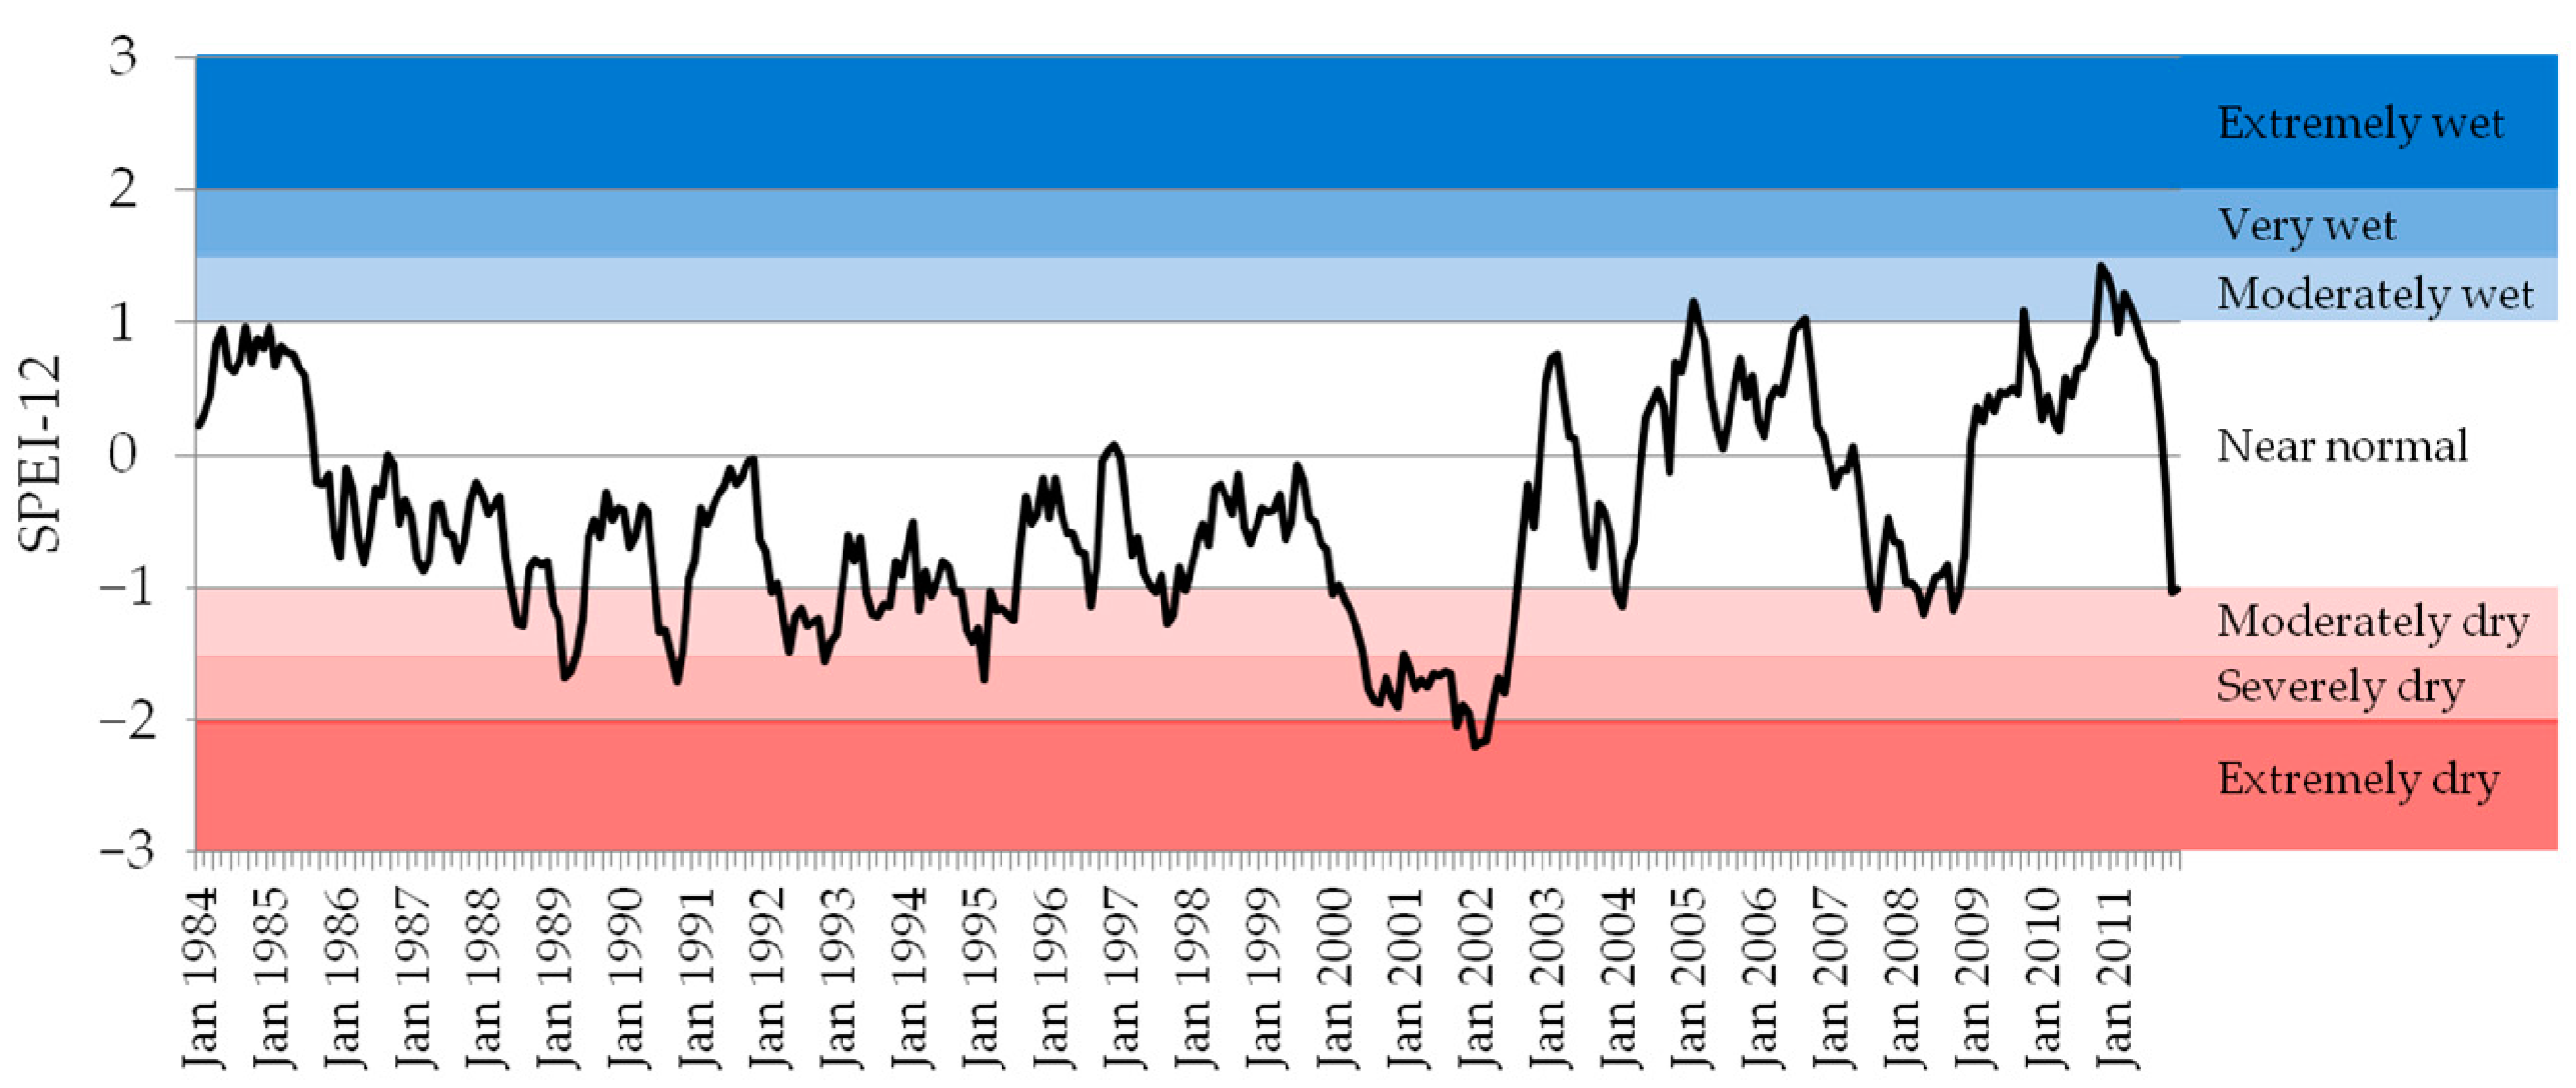
  • a second peak follows in 2003 in the D and ND forests of Gorgoglione and Accettura-Pietrapertosa (Figure 7a), and in 2005 in the D area of San Paolo Albanese (Figure 7b). It could be related to forest different responses to a climatological forcing. The Basilicata region seems indeed to be affected by a moderately dry period in 2002 and 2004 (Figure 1).
On the whole, we may suppose that the observed peaks in the early 2000s could be a first direct consequence of loss in tree vigor and mortality due to a compromised hydraulic functionality. Some authors [13] report lumen vessels filled with tyloses in 1999, 2000, and 2001 in some analyzed trees of the Gorgoglione forest, indicating a decreased xylem conductivity and an increased hydraulic vulnerability, i.e., a condition contributing to tree vigor reduction and death [62]. The same forest was specifically investigated by the same authors [13] in 2013 also from a phytopathological point of view. No biotic factors were identified as the triggering cause of the forest dieback. In fact, the parasitic attacks observed are mostly attributable to pathogens of weakness, which settle in plants that are generally already suffering [13]. This is also in agreement with more general observations, which usually recognize the pathogens associated with the oak decline in the Mediterranean area as secondary biotic factors [9].
Field sampling and laboratory analyses in San Paolo Albanese D forest highlighted growth decline of the stand in response to warm and dry spring conditions with the onset of dieback in 2002 [44]. Declining trees displayed a sharp growth drop after this onset with reductions of 49% [44].
The analysis of the ALICE ⨂NDVI_MVC (x,y,t′) maps, for each year t′ ∈ [1984–2011], allowed us to perform a spatial investigation. In particular, the worsening of oak forest health status is evident around the year 2000 on a local scale comparing 1999, 2000, and 2001 maps (Figure 8). The differences are in terms of both extension and anomaly intensity (i.e., lower ALICE values). The same analysis allowed us to highlight also that the Accettura-Pietrapertosa forest is “non-decaying” looking at it on the whole, but it has small decaying parts inside (Figure 8b).
At the scale of the Basilicata region, the RST-based analysis (Figure 9) highlights that:
  • the 2001 peak seems to confirm the hypothesis of a climatological forcing as the cause of the effects that are already evident on the local scale. It is also in agreement with SPEI values in the early 2000s which indicate from moderately to extremely dry conditions (Figure 1);
  • a second peak (in 2004) follows, likewise to what was observed on the local scale. SPEI values highlight a new moderately dry condition;
  • a large-scale effect in 2010 is evident, even if it does not appear in the oak forests of Gorgoglione and San Paolo Albanese. It is probably a low intensity phenomenon or local factors mask the global effect. Even if SPEI values in 2010 are positive, the series of moderately dry conditions that occurred during previous years (2004, 2007, 2008), following the 2000–2002 prolonged dry period, could have had some effects on oak forests.
For comparison, Figure 9 also shows the annual trend of the GFC loss product [50] from 2001 to 2011. It is worth noting that the GFC product and RST results partially differentiate since the Hansen product reports vegetation loss, while the RST-based analysis highlights statistically significant (“anomalous”) variations of vegetation. This dissimilarity is reflected in the different percentages reported by RST and GFC in the plot of Figure 9. However, both of them measure parameters affected by the same climatological forcing, which is responsible for drought and forest decaying, i.e., favorable factors for forest fire increase as well as selection of tree cutting. Such a common element is confirmed by the good correlation between the two trends (0.67 Pearson correlation coefficient) and by the two important peaks (recorded in 2001 and 2004) in both trends.
The worsening of oak forest health status is evident around the year 2000 also at the Basilicata level, through the analysis of the RST maps (Figure 10).
On the other hand, the map reporting pixel-by-pixel the count of anomalous NDVIMVC(x,y,t′) values (⨂NDVI_MVC(x,y,t′) ≤ −3), from 1984 to 2011, permitted us to highlight other decaying oak forests in Basilicata. Figure 11 shows an example of decaying areas in the municipality of Garaguso, near the Salandrella torrent and internal paths, in agreement with the forest report [63]. It is worth underlining that the patchy aspect of such maps reflects the possible interference of local biotic (e.g., forest structure and composition) and abiotic (e.g., topography and soil) factors in the drought effects on forest changes [22].

4. Conclusions

Two approaches were used to analyze possible climate change-related stress over oak forests in the Basilicata region. The analysis based on the NDVI spatial average on D and similar close ND forests gave us information about the initial different health status of the test areas as well as the common rising NDVI trend from 1994 to 2011 despite a clear multi-year decrease in values around the year 2000.
Differently from the first approach, the RST-based analysis takes account of signal natural variability by its inherent design and was able to better highlight differences of the forests both in space and time domains. The analysis performed over time at different spatial levels allowed us to observe stress effects on a local and regional scale. Site-specific peaks of the number of strongly anomalous (⨂NDVI_MVC(x,y,t′) ≤ −3) pixels could be the result of adverse local effects, while common peaks (e.g., in 2001) are expected in the case of a climatological forcing. In particular, the RST-based analysis permitted us to emphasize different stress impacts in the test case areas. With similar trees and under the same stressed conditions, the initial worse health status of the vegetation in the D forest probably caused a more marked effect that was pointed out by a greater percentage of strongly anomalous pixels. At the regional level, different oak species and local conditions may have contributed to a different response to drought. A quite important result is the evidence of strong anomalous values of NDVIMVC already in 2001 in the Gorgoglione forest. In fact, the combination of suitable satellite data and a sensitive methodology allowed us to clearly highlight a decaying status of vegetation two years before the first visual field evidence [13].
On the other hand, the spatial analysis was able to highlight variations in extension and anomaly intensity over time. Moreover, it identified decaying areas (even within an overall non-decaying forest) to be focused on. Such affected areas could be studied, for example, with field-based techniques. In fact, a multi-level approach, from lab/field experiments to long time series of satellite data analyses, should be preferred in order to highlight possible trends as well as the actual space-time scale of events, as suggested by [64,65]. In particular, some authors [20] suggest that the combination of analyses based on remote sensing and tree-ring data may be a useful tool to better understand drought-induced phenomena in forests. Indeed, this combined approach could be really useful in the case of time lag between the remote sensing signal and the climatic stresses due to, for example, the likely peculiar site-specific conditions such as low tree density or non-uniform canopy coverage.
Finally, it should be underlined the peculiarity of this work, which is based on the combination of three elements:
  • suitable satellite data, in terms of spatial resolution, temporal repetition, and lifetime span;
  • the RST-based analysis, which is fully exportable to different sensors (as already proved in different contexts) and independent on the specific forest type thanks to its pixel-based signal characterization (i.e., reference fields);
  • the potential of GEE, which allows us to analyze long time series of satellite data without computational efforts, from a local to a larger scale.
The combination of these three elements, here used in the case of the Basilicata region, may be exploited, in general, to monitor long-term forest health, from the local to global scale, as well as to timely detect climate change forcing. In particular, the identification of more drought-vulnerable areas over large areas could be useful to forest managers and policymakers [66], while monitoring of annual forest decline could help ecologists to evaluate climate change impact on vegetation [22]. Finally, it is worth noting that the RST exportability allows us to employ other satellite sensors. Although Landsat satellite is still the most employed mission in this kind of study [16], RST could be easily applied to Sentinel-2 imagery, which has greater repetition time (5 days) and higher spatial resolution (up to 10 m). This improvement could help, for example, in better integrating field and remote sensing methodologies since estimates of forest variables depend on how field data can be linked to satellite images [67].

Author Contributions

Methodology, V.T. and C.F.; software, M.A.C. and N.G.; formal analysis, M.A.C. and M.L.; writing—original draft preparation, C.F., E.C. and N.G.; writing—review and editing, V.T., F.R.; supervision, V.T.; funding acquisition, N.P. All authors have read and agreed to the published version of the manuscript.

Funding

This research was carried out in the framework of the project ‘OT4CLIMA’ which was funded by the Italian Ministry of Education, University and Research (D.D. 2261 del 6.9.2018, PON R&I 2014–2020 and FSC). Project cod. ARS01_00405.

Institutional Review Board Statement

Not applicable.

Informed Consent Statement

Not applicable.

Data Availability Statement

Satellite and Global Forest Change data used in this work are available through the GEE platform (https://earthengine.google.com/). Hansen Global Forest Change data are also available at: https://glad.earthengine.app/view/global-forest-change. They are licensed under the Creative Commons Attribution 4.0 International License. SPEI data are available at https://spei.csic.es/index.html.They are licensed under the Open Database License (https://opendatacommons.org/licenses/odbl/1-0/). Orthophoto Licence is Creative Commons Attribution-NonCommercial-NoDerivs 3.0 Italy (https://creativecommons.org/licenses/by-nc-nd/3.0/it/deed.en).

Acknowledgments

N.G. especially thanks MUR PON R&I 2014–2020 Program FSE-REACT EU.

Conflicts of Interest

The authors declare no conflict of interest.

References

  1. Luo, Y.; Chen, H.Y.H. Climate change-associated tree mortality increases without decreasing water availability. Ecol. Lett. 2015, 18, 1207–1215. [Google Scholar] [CrossRef]
  2. McDowell, N.G.; Allen, C.D.; Anderson-Teixeira, K.; Aukema, B.H.; Bond-Lamberty, B.; Chini, L.; Clark, J.S.; Dietze, M.; Grossiord, C.; Hanbury-Brown, A.; et al. Pervasive shifts in forest dynamics in a changing world. Science 2020, 368, eaaz9463. [Google Scholar] [CrossRef] [PubMed]
  3. Andrus, R.A.; Chai, R.K.; Harvey, B.J.; Rodman, K.C.; Veblen, T.T. Increasing rates of subalpine tree mortality linked to warmer and drier summers. J. Ecol. 2021, 109, 2203–2218. [Google Scholar] [CrossRef]
  4. Allen, C.D.; Macalady, A.K.; Chenchouni, H.; Bachelet, D.; McDowell, N.; Vennetier, M.; Kitzberger, T.; Rigling, A.; Breshears, D.D.; Hogg, E.H.; et al. A global overview of drought and heat-induced tree mortality reveals emerging climate change risks for forests. For. Ecol. Manag. 2010, 259, 660–684. [Google Scholar] [CrossRef] [Green Version]
  5. Cailleret, M.; Jansen, S.; Robert, E.M.R.; Desoto, L.; Aakala, T.; Antos, J.A.; Beikircher, B.; Bigler, C.; Bugmann, H.; Caccianiga, M.; et al. A synthesis of radial growth patterns preceding tree mortality. Glob. Chang. Biol. 2017, 23, 1675–1690. [Google Scholar] [CrossRef]
  6. Rita, A.; Camarero, J.J.; Nolè, A.; Borghetti, M.; Brunetti, M.; Pergola, N.; Serio, C.; Vicente-Serrano, S.M.; Tramutoli, V.; Ripullone, F. The impact of drought spells on forests depends on site conditions: The case of 2017 summer heat wave in southern Europe. Glob. Chang. Biol. 2020, 26, 851–863. [Google Scholar] [CrossRef] [PubMed]
  7. Ripullone, F.; Camarero, J.J.; Colangelo, M.; Voltas, J. Variation in the access to deep soil water pools explains tree-to-tree differences in drought-triggered dieback of Mediterranean oaks. Tree Physiol. 2020, 40, 591–604. [Google Scholar] [CrossRef] [PubMed]
  8. Allen, C.D.; Breshears, D.D.; McDowell, N.G. On underestimation of global vulnerability to tree mortality and forest die-off from hotter drought in the Anthropocene. Ecosphere 2015, 6, 129. [Google Scholar] [CrossRef]
  9. Gentilesca, T.; Camarero, J.J.; Colangelo, M.; Nolè, A.; Ripullone, F. Drought-induced oak decline in the western Mediterranean region: An overview on current evidences, mechanisms and management options to improve forest resilience. Iforest-Biogeosciences For. 2017, 10, 796–806. [Google Scholar] [CrossRef] [Green Version]
  10. Colangelo, M.; Camarero, J.J.; Borghetti, M.; Gentilesca, T.; Oliva, J.; Redondo, M.-A.; Ripullone, F. Drought and Phytophthora Are Associated with the Decline of Oak Species in Southern Italy. Front. Plant Sci. 2018, 9, 1595. [Google Scholar] [CrossRef]
  11. De Ferrari, F.; Licini, F.; Lione, G.; Gonthier, P.; Nicolotti, G.; Ebone, A.; Terzuolo, P. II deperimento dei querco-carpineti della pianura piemontese. Agricultural 2011, 64, 29–31. (In Italian) [Google Scholar]
  12. Sala, G.; Giardina, G.; La Mantia, T. I fattori di rischio per la biodiversità forestale in Sicilia: II caso studio del cerro di Gussone. L’Italia For. E Mont. 2011, 66, 71–80. [Google Scholar] [CrossRef] [Green Version]
  13. Gentilesca, T.; Camele, I.; Colangelo, M.; Lauteri, M.; Lapolla, A.; Ripullone, F. II declino dei soprassuoli di querce nel sud Italia: II caso di studio del bosco di Gorgoglione—Oak forest decline in Southern Italy: The study case of Gorgoglione forest. In Proceedings of the Second International Congress of Silviculture, Florence, Italy, 26–29 November 2014. [Google Scholar]
  14. Dobbertin, M. Tree growth as indicator of tree vitality and of tree reaction to environmental stress: A review. Eur. J. For. Res. 2005, 124, 319–333. [Google Scholar] [CrossRef]
  15. Niinemets, U. Responses of forest trees to single and multiple environmental stresses from seedlings to mature plants: Past stress history, stress interactions, tolerance and acclimation. For. Ecol. Manag. 2010, 260, 1623–1639. [Google Scholar] [CrossRef]
  16. Torres, P.; Rodes-Blanco, M.; Viana-Soto, A.; Nieto, H.; García, M. The Role of Remote Sensing for the Assessment and Monitoring of Forest Health: A Systematic Evidence Synthesis. Forests 2021, 12, 1134. [Google Scholar] [CrossRef]
  17. Xue, J.; Su, B. Significant Remote Sensing Vegetation Indices: A Review of Developments and Applications. J. Sens. 2017, 2017, 1353691. [Google Scholar] [CrossRef] [Green Version]
  18. Liu, F.; Liu, H.; Xu, C.; Zhu, X.; He, W.; Qi, Y. Remotely sensed birch forest resilience against climate change in the northern China forest-steppe ecotone. Ecol. Indic. 2021, 125, 107526. [Google Scholar] [CrossRef]
  19. Imanyfar, S.; Hasanlou, M.; Zadeh, V.M. Mapping oak decline through long-term analysis of time series of satellite images in the forests of Malekshahi, Iran. Int. J. Remote Sens. 2019, 40, 8705–8726. [Google Scholar] [CrossRef]
  20. Castellaneta, M.; Rita, A.; Camarero, J.J.; Colangelo, M.; Ripullone, F. Declines in canopy greenness and tree growth are caused by combined climate extremes during drought-induced dieback. Sci. Total Environ. 2022, 813, 152666. [Google Scholar] [CrossRef]
  21. Zhang, Y.; Peng, C.; Li, W.; Fang, X.; Zhang, T.; Zhu, Q.; Chen, H.; Zhao, P. Monitoring and estimating drought-induced impacts on forest structure, growth, function, and ecosystem services using remote-sensing data: Recent progress and future challenges. Environ. Rev. 2013, 21, 103–115. [Google Scholar] [CrossRef]
  22. Bell, D.M.; Cohen, W.B.; Reilly, M.; Yang, Z. Visual interpretation and time series modeling of Landsat imagery highlight drought’s role in forest canopy declines. Ecosphere 2018, 9, e02195. [Google Scholar] [CrossRef]
  23. Hais, M.; Hellebrandová, K.N.; Šrámek, V. Potential of Landsat spectral indices in regard to the detection of forest health changes due to drought effects. J. For. Sci. 2019, 65, 70–78. [Google Scholar] [CrossRef] [Green Version]
  24. König, S.; Schultz, J.; Dubovyk, O.; Thonfeld, F. Assessment of Drought Effects on Forests using Non-Parametric Methods and Satellite Imagery. In Wissenschaftlich-Technische Jahrestagung der DGPF in Stuttgart; Kersten, T.P., Ed.; Publikationen der DGPF: Hamburg, Germany, 2020; Volume 29, pp. 1–12. [Google Scholar]
  25. Rouse, J.W.; Haas, R.H.; Schell, J.A.; Deering, D.W. Monitoring vegetation systems in the Great Plains with ERTS. In Third Earth Resources Technology Satellite–1 Syposium Volume I: Technical Presentations; NASA SP-351, Freden, S.C., Mercanti, E.P., Becker, M., Eds.; NASA: Washington, DC, USA, 1974; pp. 309–317. [Google Scholar]
  26. Tramutoli, V. Robust AVHRR Techniques (RAT) for environmental monitoring: Theory and applications. In Proceedings of the SPIE 3496, Earth Surface Remote Sensing II, Barcelona, Spain, 11 December 1998; pp. 101–113. [Google Scholar]
  27. Tramutoli, V. Robust Satellite Techniques (RST) for natural and environmental hazards monitoring and mitigation: Theory and applications. In Proceedings of the 2007 International Workshop on the Analysis of Multi-Temporal Remote Sensing Images, Leuven, Belgium, 18–20 July 2007. [Google Scholar]
  28. Gorelick, N.; Hancher, M.; Dixon, M.; Ilyushchenko, S.; Thau, D.; Moore, R. Google Earth Engine: Planetary-scale geospatial analysis for everyone. Remote Sens. Environ. 2017, 202, 18–27. [Google Scholar] [CrossRef]
  29. Hird, J.N.; Kariyeva, J.; McDermid, G.J. Satellite Time Series and Google Earth Engine Democratize the Process of Forest-Recovery Monitoring over Large Areas. Remote Sens. 2021, 13, 4745. [Google Scholar] [CrossRef]
  30. Hua, J.; Chen, G.; Yu, L.; Ye, Q.; Jiao, H.; Luo, X. Improved Mapping of Long-Term Forest Disturbance and Recovery Dynamics in the Subtropical China Using All Available Landsat Time-Series Imagery on Google Earth Engine Platform. IEEE J. Sel. Top. Appl. Earth Obs. Remote Sens. 2021, 14, 2754–2768. [Google Scholar] [CrossRef]
  31. Casciello, D.; Lacava, T.; Pergola, N.; Tramutoli, V. Robust satellite techniques for oil spill detection and monitoring using AVHRR thermal infrared bands. Int. J. Remote Sens. 2011, 32, 4107–4129. [Google Scholar] [CrossRef]
  32. Marchese, F.; Ciampa, M.; Filizzola, C.; Lacava, T.; Mazzeo, G.; Pergola, N.; Tramutoli, V. On the Exportability of Robust Satellite Techniques (RST) for Active Volcano Monitoring. Remote Sens. 2010, 2, 1575–1588. [Google Scholar] [CrossRef] [Green Version]
  33. Faruolo, M.; Coviello, I.; Filizzola, C.; Lacava, T.; Pergola, N.; Tramutoli, V. A satellite-based analysis of the Val d’Agri Oil Center (southern Italy) gas flaring emissions. Nat. Hazards Earth Syst. Sci. 2014, 14, 2783–2793. [Google Scholar] [CrossRef] [Green Version]
  34. Di Polito, C.; Ciancia, E.; Coviello, I.; Doxaran, D.; Lacava, T.; Pergola, N.; Satriano, V.; Tramutoli, V. On the potential of robust satellite techniques approach for SPM monitoring in coastalwaters: Implementation and application over the Basilicata ionian coastal waters using MODIS-Aqua. Remote Sens. 2016, 8, 922. [Google Scholar] [CrossRef] [Green Version]
  35. Sannazzaro, F.; Filizzola, C.; Marchese, F.; Corrado, R.; Paciello, R.; Mazzeo, G.; Pergola, N.; Tramutoli, V. Identification of dust outbreaks on infrared MSG-SEVIRI data by using a Robust Satellite Technique (RST). Acta Astronaut. 2014, 93, 64–70. [Google Scholar] [CrossRef]
  36. Filizzola, C.; Corrado, A.; Genzano, N.; Lisi, M.; Pergola, N.; Colonna, R.; Tramutoli, V. RST Analysis of Anomalous TIR Sequences in Relation with Earthquakes Occurred in Turkey in the Period 2004–2015. Remote Sens. 2022, 14, 381. [Google Scholar] [CrossRef]
  37. Mazzeo, G.; De Santis, F.; Falconieri, A.; Filizzola, C.; Lacava, T.; Lanorte, A.; Marchese, F.; Nolè, G.; Pergola, N.; Pietrapertosa, C.; et al. Integrated Satellite System for Fire Detection and Prioritization. Remote Sens. 2022, 14, 335. [Google Scholar] [CrossRef]
  38. Brindisi, P.; Glisci, C.; Lanorte, V.; Marchetta, G.; Pacifico, G.; Votta Rossana. Climate in Basilicata region. Aridity inedx and Spi during 1993-2004. L’Acqua 2006, 2, 29–36. [Google Scholar]
  39. McKee, T.B.; Doesken, N.J.; Kleist, J. The Relationship of Drought Frequency and Duration to Time Scales. In Proceedings of the 8th Conference on Applied Climatology, Anaheim, CA, USA, 17–22 January 1993; pp. 179–184. [Google Scholar]
  40. De Martonne, E. Aerisme, et índices d’aridite. Comptes Rendus L’Academie Des. Sci. 1926, 182, 1395–1398. [Google Scholar]
  41. SPEI Global Drought Monitor. Available online: https://spei.csic.es/ (accessed on 11 May 2022).
  42. Vicente-Serrano, S.M.; Beguería, S.; López-Moreno, J.I. A multiscalar drought index sensitive to global warming: The standardized precipitation evapotranspiration index. J. Clim. 2010, 23, 1696–1718. [Google Scholar] [CrossRef] [Green Version]
  43. Regione Basilicata—Dipartimento Ambiente Territorio e Politiche della Sostenibilita’—Ufficio Foreste e Tutela del Territorio. Linee Programmatiche del Settore Forestale per il Decennio 2013–2022 & Piano Operativo Annuale 2013. Available online: https://www.regione.basilicata.it/giunta/files/docs/DOCUMENT_FILE_2972171.pdf (accessed on 10 January 2022). (In Italian).
  44. Colangelo, M.; Camarero, J.J.; Battipaglia, G.; Borghetti, M.; De Micco, V.; Gentilesca, T.; Ripullone, F. A multi-proxy assessment of dieback causes in a Mediterranean oak species. Tree Physiol. 2017, 37, 617–631. [Google Scholar] [CrossRef] [Green Version]
  45. Colangelo, M.; Camarero, J.J.; Borghetti, M.; Gazol, A.; Gentilesca, T.; Ripullone, F. Size matters a lot: Drought-affected Italian oaks are smaller and show lower growth prior to tree death. Front. Plant Sci. 2017, 8, 135. [Google Scholar] [CrossRef] [Green Version]
  46. Geoportale Nazionale, Ministero dell’Ambiente. Available online: http://www.pcn.minambiente.it/ (accessed on 3 March 2022).
  47. Teillet, P.M.; Barker, J.L.; Markham, B.L.; Irish, R.R.; Fedosejevs, G.; Storey, J.C. Radiometric cross-calibration of the Landsat-7 ETM+ and Landsat-5 TM sensors based on tandem data sets. Remote Sens. Environ. 2001, 78, 39–54. [Google Scholar] [CrossRef] [Green Version]
  48. Istituto Superiore per la Protezione e la Ricerca Ambientale (ISPRA)—Corine Land Cover. Available online: https://www.isprambiente.gov.it/it/attivita/suolo-e-territorio/copertura-del-suolo/corine-land-cover (accessed on 16 February 2022).
  49. Büttner, G. CORINE land cover and land cover change products. In Land Use and Land Cover Mapping in Europe; Manakos, I., Braun, M., Eds.; Springer: Dordrecht, Holland, 2014; Volume 18, pp. 55–74. [Google Scholar]
  50. Hansen, M.C.; Potapov, P.V.; Moore, R.; Hancher, M.; Turubanova, S.A.; Tyukavina, A.; Thau, D.; Stehman, S.V.; Goetz, S.J.; Loveland, T.R.; et al. High-Resolution Global Maps of 21st-Century Forest Cover Change. Science 2013, 342, 850–853. [Google Scholar] [CrossRef] [Green Version]
  51. Pettorelli, N.; Vik, J.O.; Mysterud, A.; Gaillard, J.M.; Tucker, C.J.; Stenseth, N.C. Using the satellite-derived NDVI to assess ecological responses to environmental change. Trends Ecol. Evol. 2005, 20, 503–510. [Google Scholar] [CrossRef]
  52. Marchese, F.; Filizzola, C.; Lacava, T.; Falconieri, A.; Faruolo, M.; Genzano, N.; Mazzeo, G.; Pietrapertosa, C.; Pergola, N.; Tramutoli, V.; et al. Mt. Etna Paroxysms of February–April 2021 Monitored and Quantified through a Multi-Platform Satellite Observing System. Remote Sens. 2021, 13, 3074. [Google Scholar] [CrossRef]
  53. Genzano, N.; Filizzola, C.; Hattori, K.; Pergola, N.; Tramutoli, V. Statistical Correlation Analysis Between Thermal Infrared Anomalies Observed from MTSATs and Large Earthquakes Occurred in Japan (2005–2015). J. Geophys. Res. Solid Earth 2021, 126, e2020JB020108. [Google Scholar] [CrossRef]
  54. Lacava, T.; Greco, M.; Di Leo, E.V.; Martino, G.; Pergola, N.; Romano, F.; Sannazzaro, F.; Tramutoli, V. Assessing the potential of SWVI (Soil Wetness Variation Index) for hydrological risk monitoring by means of satellite microwave observations. Adv. Geosci. 2005, 2, 221–227. [Google Scholar] [CrossRef] [Green Version]
  55. Lacava, T.; Filizzola, C.; Pergola, N.; Sannazzaro, F.; Tramutoli, V. Improving flood monitoring by the Robust AVHRR technique (RAT) approach: The case of the April 2000 Hungary flood. Int. J. Remote Sens. 2010, 31, 2043–2062. [Google Scholar] [CrossRef]
  56. Cuomo, V.; Filizzola, C.; Pergola, N.; Pietrapertosa, C.; Tramutoli, V. A self-sufficient approach for cloudy radiances detection. Atmos. Res. 2004, 72, 39–56. [Google Scholar] [CrossRef]
  57. Marchese, F.; Sannazzaro, F.; Falconieri, A.; Filizzola, C.; Pergola, N.; Tramutoli, V. An Enhanced Satellite-Based Algorithm for Detecting and Tracking Dust Outbreaks by Means of SEVIRI Data. Remote Sens. 2017, 9, 537. [Google Scholar] [CrossRef] [Green Version]
  58. Lacava, T.; Ciancia, E.; Coviello, I.; Di Polito, C.; Grimaldi, C.S.L.; Pergola, N.; Satriano, V.; Temimi, M.; Zhao, J.; Tramutoli, V. A MODIS-based robust satellite technique (RST) for timely detection of oil spilled areas. Remote Sens. 2017, 9, 128. [Google Scholar] [CrossRef] [Green Version]
  59. Lacava, T.; Ciancia, E.; Faruolo, M.; Pergola, N.; Satriano, V.; Tramutoli, V. On the Potential of RST-FLOOD on Visible Infrared Imaging Radiometer Suite Data for Flooded Areas Detection. Remote Sens. 2019, 11, 598. [Google Scholar] [CrossRef] [Green Version]
  60. Holben, B.N. Characteristics of Maximum-Value Composite Images from Temporal AVHRR Data. Int. J. Remote Sens. 1986, 7, 1417–1434. [Google Scholar] [CrossRef]
  61. Foga, S.; Scaramuzza, P.L.; Guo, S.; Zhu, Z.; Dilley, R.D.; Beckmann, T.; Schmidt, G.L.; Dwyer, J.L.; Hughes, M.J.; Laue, B. Cloud detection algorithm comparison and validation for operational Landsat data products. Remote Sens. Environ. 2017, 194, 379–390. [Google Scholar] [CrossRef] [Green Version]
  62. Tulik, M. The anatomical traits of trunk wood and their relevance to oak (Quercus robur L.) vitality. Eur. J. For. Res. 2014, 133, 845–855. [Google Scholar] [CrossRef] [Green Version]
  63. Piano di assestamento della proprieta’ silvo-pastorale del comune di Garaguso—Decennio 2015-2024. Available online: https://www.regione.basilicata.it/giuntacma/files/docs/DOCUMENT_FILE_3038149.pdf (accessed on 8 March 2022). (In Italian).
  64. Bussotti, F.; Pollastrini, M. Revisiting the concept of stress in forest trees at the time of global change and issues for stress monitoring. Plant Stress 2021, 2, 100013. [Google Scholar] [CrossRef]
  65. Martınez-Vilalta, J.; Lloret, F.; Breshears, D.D. Drought-induced forest decline: Causes, scope and implications. Biol. Lett. 2012, 8, 689–691. [Google Scholar] [CrossRef] [PubMed]
  66. Young, D.J.N.; Stevens, J.T.; Mason Earles, J.; Moore, J.; Ellis, A.; Jirka, A.L.; Latimer, A.M. Long-term climate and competition explain forest mortality patterns under extreme drought. Ecol. Lett. 2017, 20, 78–86. [Google Scholar] [CrossRef] [PubMed]
  67. Nilsson, M.; Folving, S.; Kennedy, P.; Puumalainen, J.; Chirici, G.; Corona, P.; Marchetti, M.; Olsson, H.; Ricotta, C.; Ringvall, A.; et al. Combining Remote Sensing and Field Data for Deriving Unbiased Estimates of Forest Parameters over Large Regions. In Advances in Forest Inventory for Sustainable Forest Management and Biodiversity Monitoring; Corona, P., Köhl, M., Marchetti, M., Eds.; Springer: Dordrecht, The Netherlands, 2003. [Google Scholar] [CrossRef]
Figure 1. Time series (January 1984–December 2011) of the SPEI (at a time scale of 12 months) index, averaged over the Basilicata region (upper left: 41.25, 16.75; down right: 39.75, 15.25), from Global Drought Monitor [41]. SPEI categories from [20].
Land 11 00825 g001
Figure 2. Basilicata region. The geographical position of the decaying (D) and non-decaying (ND) forests analyzed in this paper, in the municipality of Gorgoglione, Accettura-Pietrapertosa, and San Paolo Albanese. Details of such forests are in Figure 3 and Figure 4.
Land 11 00825 g002
Figure 3. (a) D forest (~54 ha) in Gorgoglione; (b) ND forest (~547 ha) in Accettura-Pietrapertosa. Background: Orthophoto, June 2006 [46].
Land 11 00825 g003
Figure 4. D (red-colored, ~54 ha) and ND (green-colored, ~57 ha) forests in San Paolo Albanese. Background: Orthophoto, July 2006 [46].
Land 11 00825 g004
Figure 5. CLC—Level 4: 3.1.1.1 (Mediterranean evergreen oak forests, brown) and 3.1.1.2 (Deciduous oak forests, green) classes over the Basilicata region.
Land 11 00825 g005
Figure 6. Time series of NDVI spatial average from TM-Landsat-5 images over (a) Gorgoglione D (red line) and Accettura-Pietrapertosa ND (green line) forests. (b) D (red line) and ND (green line) forests in San Paolo Albanese. Dashed lines are the corresponding trend lines.
Land 11 00825 g006
Figure 7. Percentage of pixels with strongly negative ALICE values (⨂NDVI_MVC(x,y,t′) ≤ −3) from 1984 to 2011 (a) in the Gorgoglione D (red line) and Accettura-Pietrapertosa ND (green line) forests; (b) in the D (red line) and ND (green line) forests of San Paolo Albanese.
Land 11 00825 g007
Figure 8. Spatial distribution of anomalous pixels, from less intense (−3.9 ≤ ⨂NDVI_MVC (x,y,t′) ≤ −3) to stronger (⨂NDVI_MVC (x,y,t′) ≤ −6) anomalies, in the D forest of Gorgoglione (a) and the ND forest of Accettura-Pietrapertosa (b), showing the increase in extension and anomaly intensity from 1999 to 2001.
Land 11 00825 g008
Figure 9. Percentage of pixels with strongly negative ALICE values (⨂NDVI_MVC (x,y,t′) ≤ −3) in the oak forests of the Basilicata region (green line) and corresponding percentage of forest loss per year according to the Hansen Global Forest Change product [50] (blue line).
Land 11 00825 g009
Figure 10. (a) Spatial distribution of the strongly anomalous pixels (⨂NDVI_MVC (x,y,t′) ≤ −3) through oak forests in Basilicata, showing the greater extension in 2001 as compared with 1999; (b) 1999 and 2011 histograms of the ALICE index distribution, highlighting the mode shift towards negative values.
Land 11 00825 g010
Figure 11. (a) Spatial distribution of anomalous (i.e., ⨂NDVI_MVC(x,y,t′) ≤ −3) value occurrences, from 1984 to 2011, in the oak forests in Garaguso and (b) orthophoto of May 2011 for comparison [46].
Land 11 00825 g011
Publisher’s Note: MDPI stays neutral with regard to jurisdictional claims in published maps and institutional affiliations.

