
Differences in Visual Attraction between Historical Garden and Urban Park Walking Scenes

School of Architecture and Urban Planning, Suzhou University of Science and Technology, Suzhou 215000, China
*
Author to whom correspondence should be addressed.
Land 2022, 11(10), 1766; https://doi.org/10.3390/land11101766
Submission received: 2 September 2022
/
Revised: 8 October 2022
/
Accepted: 10 October 2022
/
Published: 12 October 2022
(This article belongs to the Special Issue Selected Papers from Visual Resource Stewardship Conferences 2019 and 2021)
Abstract
:Previous studies on visual perception and landscape element preference have mainly focused on urban green spaces such as parks and forests; the visual attraction potential of historical gardens has been less explored. Based on the analysis framework of the visual landscape experience, this study employed normalized eye-tracking data and preference questionnaires to compare the difference in visual attraction of typical walking scenes between historical gardens and urban parks. The results showed that in terms of landscape elements, the variation fluctuation of the fixation time on various landscape elements by participants viewing historical garden walking scenes (HGWSs) was less than for urban park walking scenes (UPWSs). Additionally, the visual perception scores of the former (i.e., fascinating, coherent, complex, and mysterious) were higher than the latter. In terms of the visual attention area, the visual exploration of HGWSs around the scene (i.e., top, bottom, left, and right) was longer than for UPWSs, while the latter’s central fixation time was longer than that of the former. The visual attraction of HGWSs was related to the foreground and middle ground, while that of UPWSs was related to the middle ground and background. Additionally, for policy makers and managers of urban green spaces, the recommendation of the present study was to consider and evaluate the differences between HGWSs and UPWSs in terms of visual attraction before policy establishment.
1. Introduction
The historical garden is rich evidence of the interconnection between local culture and natural features; it is an important cultural and ecological heritage for the city [1]. Previous studies have revealed the use of historical gardens to record social lifestyles [2,3], tourists’ experiences [4,5], and various techniques for investigating and maintaining historical gardens [6,7]. However, few scholars realized that historical gardens are urban green spaces where recreational opportunities for residents can be provided. Initially, most gardens were created to decorate private houses instead of attracting tourists or residents [4]. However, with social evolution, most of them turned from private gardens to public gardens. In recent decades, fast urbanization has resulted in crowded cities, and accordingly, the demands for green spaces have increased. This made historical gardens more valuable than ever [2]. To increase urban green spaces and encourage more citizens to visit historical gardens, it is necessary to understand the environmental characteristics of historical gardens that attract people, and especially their advantages and disadvantages relative to other urban green spaces.
The visual quality of the urban green space is one of the most important factors that attracts visitors [8]. From the application of live photographs, as well as photomontages and model landscape simulations [9], to the attempts of virtual reality environments, landscape visualization has always been an indispensable part of the visual quality and visual impact assessment of urban green spaces [10]. Furthermore, it has been employed for assessing specific scenes as seen in urban forests, parks, cemeteries, green roofs, and open waters [11,12,13,14], for evaluating the organization and composition of landscape elements [15,16,17,18,19], and for assessing the visual intervention of landscape design and management [20,21,22]. In these studies, classic paradigms in environmental psychology, such as bio-evolutionary theory [23], the preference matrix [24], the scenic beauty estimation method [25], psycho-evolutionary theory [26], and the attention restoration theory [27], have helped make a clear connection between landscape characteristics and visual preferences in the urban green space.
In recent years, eye-tracking technology has provided a new approach to measuring the observer’s eye response to urban green spaces. In landscape research, it detects and records the eye movements (e.g., fixation time, saccade amplitude, scan-path length, blink rates) while watching an image, and analyzes the image components that may lead to higher visual attention [28]. Inspired by De Lucio (1996), who researched the correlation between image landscape attributes and visual exploration modes in the late 1990s [29], many scholars have explored the effects of landscape elements (e.g., tree, bush, grass, flower, water, hardscape, and visually dominant elements), landscape features (e.g., openness, heterogeneity, and fractal dimension), seasonal features (e.g., spring, summer, fall, and winter), photograph types (e.g., openness and heterogeneity), observer backgrounds (e.g., expert or non-expert, familiar or unfamiliar) and visual strategy styles (e.g., on-site and off-site) on the visual perception of urban green spaces [8,30,31,32,33]. They found that the observer’s eye movement indicators (e.g., fixation time, fixation counts) were significantly correlated with urban green space landscape preferences [8,34]. Specifically, people displayed a longer mean fixation time and a lower number of fixations when viewing natural scenes, and a higher fixation time when viewing artificial landscapes and other heterogeneous elements [8,30,35,36]. Notably, less attention was paid to the importance of cultural landscapes (e.g., historical buildings) in urban green spaces, especially how cultural landscape elements affect visual perception. In terms of landscape spatial characteristics and human eye movement patterns, scholars have revealed a significant correlation between the proportion of landscape elements, the complexity or fascination of scenes, and the eye movement patterns [8,35,36]. Many studies have discovered the importance of the spatial distribution of visual attention [29]. For instance, viewing the scene center was useful for quickly extracting important visual information [37,38], but the differences in the spatial distribution of different urban green space scenes that attract human visual attention have rarely been analyzed.
Based on these studies, most scholars have focused on the visual perception and landscape element preferences of urban green spaces such as urban forests and parks. However, comparative studies on eye movement for different types of urban green spaces to attract visitors’ visual attention are still in the initial stages [31,32]. Moreover, although many historical gardens provided beautiful visual resources to attract visitors before the emergence of urban parks, few studies have discussed their environmental preferences and eye movement characteristics because of the excessive concern for their heritage value.
In fact, historical gardens and urban parks have different spatial structures and element characteristics. In the Jiangnan area of China, the historical garden systematically organizes regional characteristic landscape elements such as rocks, plants, historical buildings, and stone bridges with cultural connotations, and creates a series of rich visual experiences in small spaces according to the composition principles of Chinese painting [39,40]. The previous studies point out that, although urban parks are diverse in type and structure, they usually involve natural and artificial landscape elements. The natural elements include trees, shrubs, powers, gradients, and variable kinds of water, while the artificial elements include paved surfaces such as plazas, pathways, platforms, and modern architecture [8,11,17].
Historic gardens and modern urban parks are representatives of the past and present recreation places of residents; it is a valuable research topic, but studies have rarely evaluated and confirmed the difference between them from the perspective of visual experience. This study aims to provide new insights into the visual attraction of urban green space walking scenes, as well as for exploring a comprehensive triangle method of landscape elements, eye movement data, and visual perception, to compare visual attraction differences between historical gardens and urban parks. The purposes of this study are (1) to investigate whether there are differences in visual attention and visual perception between historical garden walking scenes (HGWSs) and urban park walking scenes (UPWSs), and (2) to compare the correlations between HGWSs and UPWSs on landscape elements, visual attention, and visual perception.
2. Method
2.1. Study Sites
Suzhou, a city located in Southeast China, has a history of 2500 years, and 12.7483 million residents. It is famous for its historical gardens. From the 10th to the 19th century, many scholars, retired senior officials, and rich merchants built their private gardens in Suzhou. Given that most gardens were built in the city center, they were usually small in size (0.86 ± 1.06 ha) [41]. In this limited space, the humanmade environment was deliberately shaped with small buildings, corridors, and pavilions to fit the natural elements (e.g., trees, water, rocks), as well as to create visually rich scenery layers [40]. At present, there are 108 historical gardens in Suzhou, nine of which were listed as “World Cultural Heritage Sites” by the United Nations Educational, Scientific and Cultural Organization. However, most gardens are no longer private and are now open to the public; they were visited by 486.04 million and 600.99 million people in 2020 and 2021 [40]. Additionally, since the 20th century, Suzhou has also built 120 parks (13.25 ± 15.09 ha), such as comprehensive parks, strip parks, specialized parks, as well as community parks [42], under the influence of modern lifestyles.
2.2. Stimulus Materials
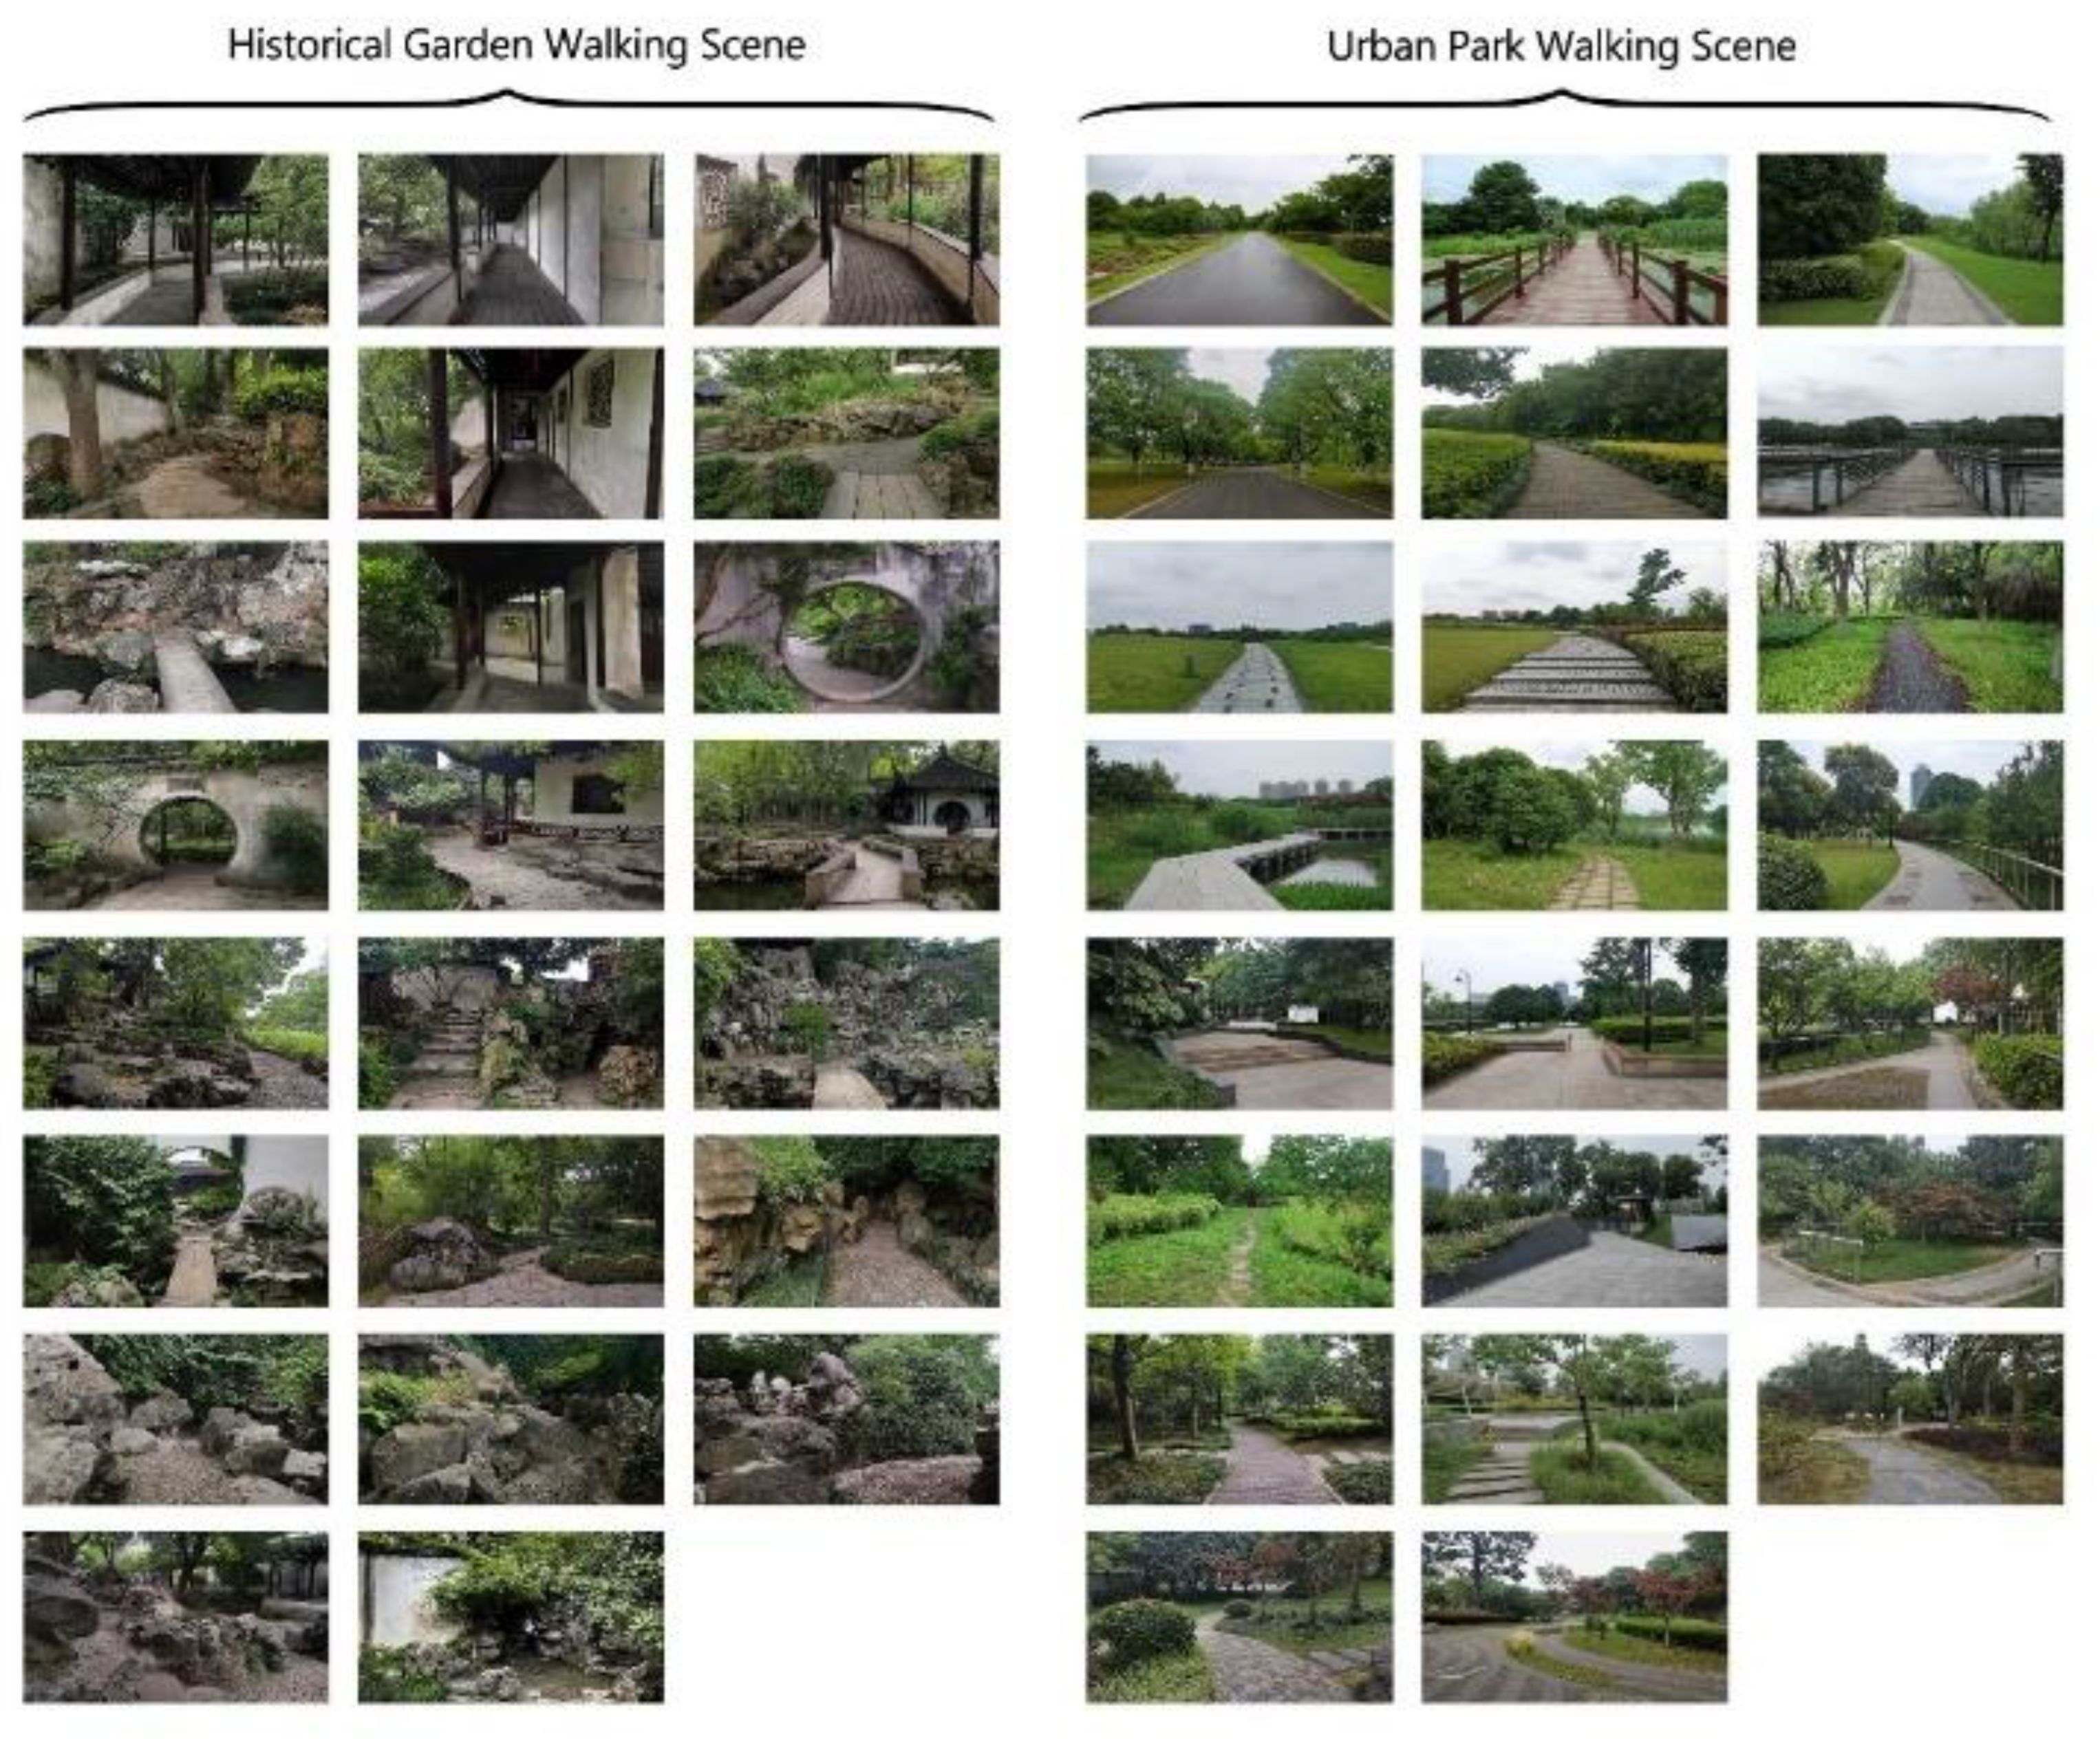
Since walking is the participants’ main mode of transport to the urban green spaces, most studies on visual attraction started from this premise [30,31]. Based on this, the researchers in this study took 423 photographs from 17 historical gardens and 12 urban parks to include as many walking scene characteristics as possible. To reduce the influence of weather, season, and equipment, all photographs were taken in spring (from April to May 2021), on overcast days without direct sunlight, and using the same camera (Cannon EOS-M3). The viewpoint height was 1.60 m at eye level when taking photographs, and the focal length was set the same. Five landscape experts selected 46 experimental stimulus photographs based on the representative content characteristics of historical gardens and urban parks, with 23 historical gardens and urban parks, respectively. First of all, the experts excluded 35 photos of incomplete walking scenes, such as images that mixed the pedestrian and motorway; secondly, the other 75 photos were excluded because they did not possess the properties of HGWSs and UPWSs, for example, the images of modern sculpture in HGWS or high-rise residential buildings that blocked the sky of HGWSs and UPWSs; additionally, 46 images were excluded because some elements in them such as cars, trash cans, and people might interfere with eye movement experiments. Finally, according to the universality of the photographed scenes, the experts selected 23 HGWS and UPWS photographs from the remaining 267, and each selected photograph needed at least four experts’ agreement. The final selected photographs, representing a series of walking scenes, were from 4 historical gardens and 6 urban parks, mainly from the older city and the new city (Gusu district) (Figure 1 and Figure A1, Table 1 and Table A1). All photographs were automatically adjusted for brightness level and contrast balance using Adobe Photoshop CS6.
To distinguish landscape types in diverse environments, many previous studies set up an area of interest (AOI) for the quantification of landscape elements in the experimental stimulus pictures [8,30]. To compare the visual attention of the participants in each AOI, different-colored markers in Adobe Photoshop CS6 were used in this study to calculate the percentage of the AOI of each landscape element relative to the total area of the image (Figure 2). Figure 2c,d describe the pixel labeling of the vertical direction and horizontal direction in HGWSs; Figure 2e,f describe the pixel labeling of the horizontal direction and vertical direction in UPWSs; Figure 2g,h show the difference in the percentage distribution of different landscape elements between HGWSs and UPWSs. Figure 2e,f show the difference in the percentage distribution of different landscape elements between HGWSs and UPWSs. In general, a higher percentage of visible hard landscapes (rock, buildings, and visually dominant elements) and the road was present in the HGWSs compared to the UPWSs, while the percentage of visible soft landscapes (sky, tree, and bushes) was lower.
2.3. Participants
The study recruited 68 healthy college students to participate through social platforms (Tencent Mobile QQ and WeChat) using the snowball method. After excluding participants with visual impairments (N = 5) and technical failures (N = 2), a total of 61 participants’ eye-tracking data were collected, including 21 males and 40 females, 48 undergraduates and 13 postgraduates, aged from 18 to 25 years (M = 20.86, SD = 2.15). The participants included majors in civil engineering (N = 32), art (N = 22), and urban planning (N = 7). We did not consider the sex balance because according to previous studies, sex did not play an important role in eye movement characteristics [32].
2.4. Apparatus
The study used a reflective eye tracker (aSee pro, 7 Invensun Technology Ltd., Beijing, China) to measure eye movement with a sampling rate of 256 Hz. The display (DELL OPTIPLEX 760) employed for showing experimental images had a screen resolution of 1920 × 1080 pixels, and the screen diagonal was 58.42 cm. The eye tracker was arranged under the PC monitor, and the presentation and data processing of the stimulation device were controlled by aSee pro 3.2 software.
2.4.1. Visual Attraction Measurement
Fixation time was used to compare the participants’ visual attention and exploration differences when they watched the walking scenes of historical gardens and urban parks. The sum of all fixation times in AOI, in milliseconds (ms), has been used in previous studies to check the participant’s visual attention [8,30]. In this study, the AOI of fixation time was presented in two different ways. The first presentation was associated with landscape elements and was used to count the fixation time when the participants watched different landscape elements (e.g., sky, rock); In the second presentation, it was associated with the distribution of fixation time in the scene. Researchers divided the image into 3 horizontal rows and 3 vertical columns (Figure 2e,f), which were used to measure the fixation time of the participant’s horizontal (i.e., top, middle, and bottom) and vertical (i.e., left, middle and right) viewing. Previous studies showed that the horizontal layering of landscape photographs was usually related to the field depth of the background, middle ground, and foreground, while the vertical layering was usually related to the sight’s breadth [43,44].
2.4.2. Visual Perception Measurement
AOI analysis of fixation time could distinguish the participants’ visual attention distribution when viewing images, but it could not explain why they were attracted to certain landscape elements or areas [45]. Previous studies on urban parks or forest scenes confirmed that participants’ visual perception was related to environmental preferences [12,14]. Five predictor variables were selected, namely, fascination, coherence, complexity, legibility, and mystery, to evaluate their visual perception of each photograph. Each predictor variable was assessed by a seven-point Likert scale, ranging from “−3 = strongly disagree” to “3 = strongly agree”.
2.5. Procedure
After the participants arrived at the laboratory, the researchers briefly introduced the experimental process and provided the consent form. After agreeing to participate in the experiment and providing their demographic information, the participants sat 65 cm away from the display screen for eye-tracking calibration and to perform viewing exercises on two photographs. Before showing each photograph, the participant had to fixate on the cross at the screen’s center for 2 s to ensure the same starting point for exploring each photograph, and then each photograph was displayed for 10 s. Participants were asked to browse through 46 photographs of HGWSs and UPWSs in a non-task state, which were randomly displayed, one for each participant. After the eye movement experiment was completed, the participants turned to score the visual perception of each photograph using the online questionnaire. After the eye movement experiment, the participants spent about 30 min filling in the online questionnaire about visual perception of the photographs, which included five predictor variables of visual performance measurement, namely, fascination, coherence, complexity, legibility, and mystery. The entire experiment process took approximately 50 min. All study procedures were approved by the University Ethics Committee (IRB210520).
2.6. Data Analysis
The aSee pro 3.2 analysis software was used to process the raw eye-tracking data, and SPSS 24.0 to analyze fixation time data and visual perception scores. Specifically, since the fixation time data were not normally distributed, the Mann–Whitney U test was employed to distinguish between the visual attention differences between HGWSs and UPWSs; the coefficient of variation helped to estimate relative variability with a fixation time of landscape elements between HGWSs and UPWSs. Furthermore, visual perception scores were analyzed with Cronbach’s alpha and the difference in visual preference scores between HGWSs and UPWSs was tested by one-way ANOVA. Finally, the Pearson correlation coefficient measurement and correlation comparison tool [46] were employed to assess the correlation difference in the percentage of landscape elements, fixation time, and visual perception between HGWSs and UPWSs.
3. Results
3.1. Differences in Visual Attention between HGWSs and UPWSs
3.1.1. Landscape Elements of Visual Attention
The Mann–Whitney U test revealed that there was an overall significant difference (p < 0.001) between HGWSs and UPWSs in terms of fixation time. HGWSs had less overall fixation time than UPWSs, and there were significant differences in the six categories (Figure 3). Statistically, compared with UPWSs, in HGWSs more fixation time was spent on the sky, bush, and road, while less fixation time was spent on the tree, building, and visually dominant elements (all p < 0.001). For the fixation time of various landscape elements, the observed coefficient of variation was 21.29% for HGWSs and 90.20% for UPWSs, indicating that the fixation time of landscape elements in HGWSs was more stable, and in UPWSs it was more fluctuant.
3.1.2. Horizontal and Vertical Visual Attention Area
The results showed that the same type of landscape element received different visual attractions when appreciating HGWSs and UPWSs. Thus, it was necessary to obtain a more sophisticated understanding of whether the visual attention area was different while viewing. A series of Mann–Whitney U tests was used to compare the fixation time differences between HGWSs and UPWSs, both in horizontal and vertical areas. As shown in Figure 4, there was a significant difference between the fixation time in each scene (all p < 0.001) in the horizontal and vertical areas. On the horizontal visual attention area, the statistics showed that the top and bottom areas of the HGWS attracted more fixation time than the UPWS, while the opposite was true for the middle of the HGWS. On the vertical visual attention area, the tests revealed that the left and right areas of the HGWS attracted more fixation time than the UPWS, while the opposite was true for the middle of the HGWS.
3.2. Differences in Visual Perception between HGWS and UPWS
The results of the visual perception scores showed good reliability among participants (Cronbach’s alpha = 0.88). Figure 5 shows the significant difference in visual perception scores between HGWSs and UPWSs (all p < 0.001). Specifically, compared to the UPWS, participants preferred the HGWS more, as they perceived more fascination, coherence, complexity, and mystery with the HGWS. Additionally, compared to the HGWS, participants perceived more legibility in the UPWS.
3.3. Correlation Comparison of Visual Attraction between HGWS and UPWS
3.3.1. Correlation Comparison of Visual Attention Elements
Table 2 shows the correlations between the total fixation time and the percentage of landscape elements. In the HGWS, the total fixation time had a significant positive correlation to the percentage of the sky, building, and visually dominant elements (all p < 0.01); meanwhile, it had a significant negative correlation to the percentage of the tree, waterscape, and rock (all p < 0.01). In the UPWS, the total fixation time was significantly positively correlated with the percentage of waterscape, rock, building, and visually dominant elements (all p < 0.01), and significantly negatively correlated with the percentage of tree and bush (all p < 0.05). A correlation comparison showed that the total fixation time and the percentage of landscape elements (i.e., bush, waterscape, and rock) were significantly different (all p < 0.01) between the HGWS and UPWS (Table 2). For example, although the total fixation time and percentage of rock in the HGWS and UPWS were significantly correlated, in the HGWS it was negatively correlated, and in the UPWS it was positively correlated.
3.3.2. Correlation Comparison of Visual Attention Area
Table 3 shows the correlations between fixation time and visual perception in HGWS, which indicated that the more attention that was paid to these visual attention areas in the HGWS, the higher the visual perception evaluation. Specifically, in terms of horizontal area, the fixation time for the middle was significantly positively correlated with fascination, coherence, complexity, and mystery (all p < 0.05), and that of the bottom area was significantly positively correlated with fascination, coherence, and mystery (all p < 0.01). In terms of vertical area, the fixation time for the middle was significantly positively correlated with fascination and legibility (all p < 0.01), and that of the right was significantly positively correlated with fascination, coherence, complexity, and mystery (all p < 0.01).
Table 4 shows the correlations between fixation time and visual perception in the UPWS. Specifically, in terms of horizontal area, the fixation time of the top was significantly correlated (all p < 0.05) with all visual perception indexes, the fixation time of the middle was significantly positively correlated (all p < 0.01) with legibility and mystery, and the fixation time of the bottom was significantly positively correlated (all p < 0.05) with fascination, complexity and legibility. In terms of vertical area, the fixation time of the left was significantly positively or negatively correlated with all visual perception indexes (all p < 0.05) except fascination; the fixation time of the middle was significantly correlated with fascination, legibility, and mystery (all p < 0.05); and that of right was significantly correlated with fascination and coherence (all p < 0.05).
A correlation comparison showed that the fixation time of the horizontal or vertical areas and visual perception were significantly different in HGWSs and UPWSs in many areas (Table 5). For example, the fixation time at the top of the horizontal and the left of the vertical was completely irrelevant to visual perception indexes in the HGWS (Table 2), but the two were significantly related in the UPWS (Table 3). This means that the fixation time at the top of the horizontal and the left of the vertical could hardly predict visual perception in the HGWS. Similarly, in another area, there was little consensus on the correlation between the fixation time of horizontal or vertical viewing and visual perception of the HGWS and UPWS.
4. Discussion
4.1. Confirming the Differences of Visual Attention between HGWS and UPWS
Kaplan and Kaplan (1989) found two dimensions that could affect the visual experience of a landscape: spatial configuration and content. According to this theoretical framework, we found significant differences in visual attention when participants watched HGWSs and UPWSs. Concerning landscape elements attracting visual elements, we found that the total fixation time and the variation fluctuation of the fixation time were lesser while viewing HGWS photographs than while viewing UPWS photographs (see Figure 3), and the visual perception scores of fascination, coherence, complexity, and mystery in HGWS photographs were also higher than in UPWS photographs (see Figure 5). These results implied that the landscape elements of the garden played an important role in reducing the fixation time and enhancing landscape preferences, and it also indicated that certain landscape elements and spatial configurations in HGWSs might contribute to visual perception. This was assumed to be the case because the historical garden designers followed the gardening theory of “harmony with nature” [39] and attempted to reduce the contrast between artificial objects and the natural environment in terms of edges and colors. Therefore, although the area of artificial objects in HGWS was larger than in UPWS, it was still a “softer fascination” than in UPWS. Kaplan and Kaplan’s (1989) attention restoration theory argued that a certain complexity and coherence of the natural environment could easily trigger the soft fascination that could effortlessly attract attention. On the other hand, building and visually dominant elements (e.g., light poles) in UPWSs, which were strongly contrasting with the natural environment, could increase passive visual attention but could not increase visual preference. Previous studies showed that images associated with longer fixation might mean more difficulty in processing and coding information for the observer [9], or that the images were not as meaningful as images with shorter fixation [47]. This study’s results confirmed and deepened previous findings, such as the attraction to artificial objects in visual attention [47], the difference in fixation time between historical and modern scenes [48], and the preference matrix [24].
This study also demonstrated the differences in spatial configuration between HGWSs and UPWSs from the perspective of the visual attention area. Both the HGWS and UPWS visual preferences showed a central effect (see Figure 4) and confirmed previous studies [37,38], and our findings were more in-depth than before. The significant difference in fixation time between the HGWS and UPWS in the horizontal and vertical viewings signifies the notable differences in the spatial configuration of landscape elements. According to this preference matrix [24], since the HGWS was more complicated and mysterious in spatial composition, it was necessary to extract information through more rounds of fixation times on photographs (i.e., top, bottom, left, and right). The visually open UPWS photographs were higher in legibility, and fixation on the middle of the photographs helped to extract information quickly. These findings were consistent with previous studies that insisted that it was difficult to stimulate people to engage in a more visual exploration of open landscapes [28,49].
4.2. Comparison of Related Factors Predicting Visual Attraction between HGWS and UPWS
The comparison found that the differences in the correlation of total fixation time and some percentage of landscape elements (i.e., bush, waterscape, and rock) were significant between HGWS and UPWS. These results could be explained by the figure–ground principle of the Gestalt theory, namely, the visual focus element is the figure, and the remaining is the background [50]. For example, a small number of rocks scattered on smooth grass in a UPWS is the figure, while a large number of rocks that shaped the topography in an HGWS is the background. Previous studies also believed that too much rock would cause visual attenuation [31].
Another noteworthy comparison was concentrated on the correlation of the fixation time on horizontal/vertical visual attention areas and visual perception between HGWSs and UPWSs. The study found that in the horizontal direction related to the depth of field, the visual attention area of the HGWS was mainly concentrated in the middle and bottom, while in the UPWS it was mainly concentrated in the top and middle. This is because the garden designer used trees and buildings to shelter most of the sky and to attract the participants by using the carefully designed winding paths and courtyard landscape in the garden. Although people usually observed view-obstructing objects from the top to the bottom [28], this study found that these observation behaviors were sometimes not related to visual preferences.
Similarly, the participant’s gaze on the road at the bottom of the UPWS also made it difficult to stimulate the participant’s visual preference. This study confirmed and complemented previous explorations, such as the impact of sky visibility on walkability [51], the influence of landscape openness on eye-tracking behavior [28], and the correlation between road material and visual preference [31].
Interestingly, the study found that in the vertical direction related to the vision field, the fixation time on the left visual attention area of the HGWS had no significant correlation with visual perception preferences. But on the right visual attention area of the HGWS, the fixation time was significantly correlated to the visual perception preferences. This finding revealed the visual asymmetry characteristic of the landscape in both sides of the road in Chinese historical gardens. We also discovered the visual exploration tendency (i.e., complexity and mystery) of the landscape on the right area, and it was consistent with the theory of environmental preference, which posits that complexity and mystery provide opportunities for exploration. This phenomenon might be caused by the navigation design of wayfinding under the rightward tour tradition of the Chinese garden. However, the specific mechanism needs to be further explored.
4.3. Limitations
This study selected private gardens in southeast China to represent historical gardens, but there are many other types and styles of historical gardens in the world. Therefore, the influence of other historical gardens landscape elements (e.g., Japanese gardens, Persian gardens, and French gardens) and spatial configuration on visual attractiveness should also be considered in future studies. The experimental stimuli photographs selected for the study were taken from the walking scenes in historical gardens and urban parks and mainly emphasized the visual attraction on both sides of the paths when the participants passed by. Some visual perceptions of other scenes (e.g., facing the water, the grass, or the forest) were omitted, which to some extent might have influenced the integrity of the conclusion of this study. Future studies can consider incorporating a series of potential scene samples into the experiment to comprehensively compare the visual appeal and visual attraction of historical gardens and urban parks. As for the participants of the present study, the influence of their age, gender, educational background, and major was not discussed. Future studies should consider other age groups if possible.
It was well known that the visual stimulus of the walking scene was a continuous scene that changed with movement, and the natural viewing of participants would face complex interference factors [31,34]. For plant-based parks and forest scenes, scholars conducted surveys through non-photo-stimulation eye tracking (e.g., watching videos, virtual reality viewing, and on-site viewing) or environmental preference questionnaires [31,33], but no surveys were conducted for historical gardens. Future studies could explore the application of dynamic stimuli and dynamic equipment, such as recording panoramic videos of real scenes, augmented reality scenes, and eye-tracking mobile devices with virtual reality, to enhance the immersion of the visual experience and avoid disturbing stimuli in the real environment.
5. Conclusions
The historical garden is a special type of urban green space that integrates the local culture and natural environment, but its visual attraction differences from other urban green spaces have rarely been considered. This study found significant differences in the ratio of landscape elements, visual attention, and visual environment preference between historical gardens and urban parks. In general, people prefer HGWSs to UGWSs because their mysterious and complex spatial composition is more attractive. It is a supplement to the limited evidence of existing urban park and forest studies, such as the influence of artificial elements on the fixation time [30], the correlation between the natural landscapes and visual aesthetics [8], and the pattern of spatial configuration that affects environment preference [31]. In addition, it also confirms the central focus feature of the visual attention area in the urban park and the significant relationship between visual preference and the middle ground and background of a scene.
The other findings in this study are the unique characteristics of historical gardens in visual attraction, such as the balance of visual attention on various landscape elements, the properties of horizontal and vertical visual attention areas, and the focus of visual attraction on the middle ground and foreground. This study provides an opportunity to evaluate the visual value of historical gardens serving the public through eye tracking. The findings also provide a deeper insight into the visual attraction design of different urban green spaces and pave the way for further exploration of the visual attraction attributes for the protection and development of historical gardens.
Author Contributions
Conceptualization, C.L.; Methodology, C.L.; Formal analysis, C.L.; Data curation, C.L.; Writing—original draft preparation, C.L.; Project administration, C.L.; Funding acquisition, C.L.; Administration, C.L.; Experiment operation; X.H.; Visualization, X.H.; Writing—review and editing, C.L. and X.H. All authors have read and agreed to the published version of the manuscript.
Funding
This research was funded by the National Natural Science Foundation of China (grant number 51778388), the Postgraduate Research & Practice Innovation Program of Jiangsu Province (grant number SJCX21_1430), the Landscape Architecture Discipline Construction Project of Suzhou University of Science and Technology, and Qing Lan Project of Jiangsu Province.
Institutional Review Board Statement
The study was conducted in accordance with the Declaration of Helsinki and approved by the Ethics Committee of Suzhou University of Science and technology (No. 201106).
Data Availability Statement
Not applicable.
Acknowledgments
We would like to thank all participants in our trials on our study.
Conflicts of Interest
The authors declare no conflict of interest.
Appendix A

Table A1.
Descriptive statistics of landscape elements (%) in HGWS and UPWS.
| Mean | Standard Deviation | 95% CI Lower Limit | 95% CI Upper Limit | Min | Max | ||
|---|---|---|---|---|---|---|---|
| Sky | HGWS | 0.57 | 0.87 | 0.20 | 0.95 | 0.00 | 3.27 |
| UPWS | 13.53 | 13.77 | 7.57 | 19.48 | 0.00 | 50.21 | |
| Rock | HGWS | 29.29 | 22.85 | 19.41 | 39.17 | 0.00 | 67.99 |
| UPWS | 0.12 | 0.59 | −0.13 | 0.38 | 0.00 | 2.82 | |
| Waterscape | HGWS | 1.41 | 4.33 | −0.46 | 3.28 | 0.00 | 18.35 |
| UPWS | 1.96 | 4.73 | −0.09 | 4.00 | 0.00 | 14.57 | |
| Tree | HGWS | 25.43 | 9.76 | 21.21 | 29.65 | 8.55 | 49.69 |
| UPWS | 34.58 | 16.23 | 27.56 | 41.60 | 0.00 | 60.00 | |
| Bush | HGWS | 7.56 | 5.71 | 5.09 | 10.03 | 0.00 | 18.90 |
| UPWS | 26.69 | 13.09 | 21.03 | 32.34 | 2.03 | 54.42 | |
| Building | HGWS | 18.00 | 18.35 | 10.07 | 25.94 | 0.00 | 53.29 |
| UPWS | 0.65 | 0.83 | 0.29 | 1.01 | 0.00 | 2.78 | |
| Visually dominant elements | HGWS | 5.34 | 11.33 | 0.44 | 10.24 | 0.00 | 44.20 |
| UPWS | 3.84 | 5.53 | 1.45 | 6.24 | 0.00 | 19.77 | |
| Road | HGWS | 12.47 | 4.24 | 10.64 | 14.31 | 5.38 | 20.79 |
| UPWS | 18.77 | 7.36 | 15.59 | 21.96 | 3.61 | 33.57 | |
Figure A1.
The stimuli photos.
References
- Andrade, I.E.-J. Construction and deconstruction of the historic garden concept. J. Arch. Urban 2008, 8, 138–144. [Google Scholar]
- de Oliveira Paiva, P.D.; de Brito Sousa, R.; da Silva Cavalcante, S.F.N. Patchwork quilt: A methodology proposed for the study of historic gardens. Urban For. Urban Green. 2021, 62, 127169. [Google Scholar] [CrossRef]
- Meyer-Fong, T. Civil war, revolutionary heritage, and the Chinese Garden. Cross Curr. East Asian Hist. Cult. Rev. 2015, 4, 309–332. [Google Scholar] [CrossRef]
- Connell, J. Managing gardens for visitors in Great Britain: A story of continuity and change. Tour. Manag. 2005, 26, 185–201. [Google Scholar] [CrossRef]
- Pérez-Martínez, G.; Torija, A.J.; Ruiz, D.P. Soundscape assessment of a monumental place: A methodology based on the perception of dominant sounds. Landsc. Urban Plan. 2018, 169, 12–21. [Google Scholar] [CrossRef] [Green Version]
- Liang, H.; Li, W.; Lai, S.; Jiang, W.; Zhu, L.; Zhang, Q. How to survey, model, and measure rockeries in a Chinese classical garden: A case study for Huanxiu Shanzhuang, Suzhou, China. Landsc. Res. 2020, 45, 377–391. [Google Scholar] [CrossRef]
- Liang, H.; Li, W.; Lai, S.; Zhu, L.; Jiang, W.; Zhang, Q. The integration of terrestrial laser scanning and terrestrial and unmanned aerial vehicle digital photogrammetry for the documentation of Chinese classical gardens—A case study of Huanxiu Shanzhuang, Suzhou, China. J. Cult. Herit. 2018, 33, 222–230. [Google Scholar] [CrossRef]
- Li, J.; Zhang, Z.; Jing, F.; Gao, J.; Ma, J.; Shao, G.; Noel, S. An evaluation of urban green space in Shanghai, China, using eye tracking. Urban For. Urban Green. 2020, 56, 126903. [Google Scholar] [CrossRef]
- Dupont, L.; Antrop, M.; Van Eetvelde, V. Does landscape related expertise influence the visual perception of landscape photographs? Implications for participatory landscape planning and management. Landsc. Urban Plan. 2015, 141, 68–77. [Google Scholar] [CrossRef] [Green Version]
- Gobster, P.H.; Ribe, R.G.; Palmer, J.F. Themes and trends in visual assessment research: Introduction to the Landscape and Urban Planning special collection on the visual assessment of landscapes. Landsc. Urban Plan. 2019, 191, 103635. [Google Scholar] [CrossRef]
- Eriksson, L.; Nordlund, A. How is setting preference related to intention to engage in forest recreation activities? Urban For. Urban Green. 2013, 12, 481–489. [Google Scholar] [CrossRef]
- Chiang, Y.-C.; Nasar, J.L.; Ko, C.-C. Influence of visibility and situational threats on forest trail evaluations. Landsc. Urban Plan. 2014, 125, 166–173. [Google Scholar] [CrossRef]
- Al-Akl, N.M.; Karaan, E.N.; Al-Zein, M.S.; Assaad, S. The landscape of urban cemeteries in Beirut: Perceptions and preferences. Urban For. Urban Green. 2018, 33, 66–74. [Google Scholar] [CrossRef]
- Herzog, T.R.; Kropscott, L.S. Legibility, Mystery, and Visual Access as Predictors of Preference and Perceived Danger in Forest Settings without Pathways. Environ. Behav. 2004, 36, 659–677. [Google Scholar] [CrossRef] [Green Version]
- Kuper, R. Restorative potential, fascination, and extent for designed digital landscape models. Urban For. Urban Green. 2017, 28, 118–130. [Google Scholar] [CrossRef]
- Kuper, R. Preference and restorative potential for landscape models that depict diverse arrangements of defoliated, foliated, and evergreen plants. Urban For. Urban Green. 2020, 48, 126570. [Google Scholar] [CrossRef]
- Wang, R.; Zhao, J.; Meitner, M.J.; Hu, Y.; Xu, X. Characteristics of urban green spaces in relation to aesthetic preference and stress recovery. Urban For. Urban Green. 2019, 41, 6–13. [Google Scholar] [CrossRef]
- Wang, Z.; Li, M.; Zhang, X.; Song, L. Modeling the scenic beauty of autumnal tree color at the landscape scale: A case study of Purple Mountain, Nanjing, China. Urban For. Urban Green. 2020, 47, 126526. [Google Scholar] [CrossRef]
- Gundersen, V.S.; Frivold, L.H. Public preferences for forest structures: A review of quantitative surveys from Finland, Norway and Sweden. Urban For. Urban Green. 2008, 7, 241–258. [Google Scholar] [CrossRef]
- Arnberger, A.; Schneider, I.E.; Ebenberger, M.; Eder, R.; Venette, R.C.; Snyder, S.A.; Gobster, P.H.; Choi, A.; Cottrell, S. Emerald ash borer impacts on visual preferences for urban forest recreation settings. Urban For. Urban Green. 2017, 27, 235–245. [Google Scholar] [CrossRef]
- Ribe, R.G. Is Scenic Beauty a Proxy for Acceptable Management? The Influence of Environmental Attitudes on Landscape Perceptions. Environ. Behav. 2002, 34, 757–780. [Google Scholar] [CrossRef]
- Gobster, P.H.; Westphal, L.M. The human dimensions of urban greenways: Planning for recreation and related experiences. Landsc. Urban Plan. 2004, 68, 147–165. [Google Scholar] [CrossRef]
- Appleton, J. The Experience of Landscape; John Wiley and Sons: New York, NY, USA, 1975. [Google Scholar]
- Kaplan, S.; Kaplan, R. Humanscape: Environments for People; Duxbury Press: North Scituate, RI, USA, 1982. [Google Scholar]
- Daniel, T.C.; Boster, R.S. Measuring Landscape Esthetics: The Scenic Beauty Estimation Method; USDA Forest Service: Rocky Mountain Forest and Range Experiment Station: Fort Collins, CO, USA, 1976.
- Ulrich, R.S.; Simons, R.F.; Losito, B.D.; Fiorito, E.; Miles, M.A.; Zelson, M. Stress recovery during exposure to natural and urban environments. J. Environ. Psychol. 1991, 11, 201–230. [Google Scholar] [CrossRef]
- Kaplan, S. The restorative benefits of nature: Toward an integrative framework. J. Environ. Psychol. 1995, 15, 169–182. [Google Scholar] [CrossRef]
- Dupont, L.; Antrop, M.; Van Eetvelde, V. Eye tracking Analysis in Landscape Perception Research: Influence of Photograph Properties and Landscape Characteristics. Landsc. Res. 2014, 39, 417–432. [Google Scholar] [CrossRef]
- De Lucio, J.V.; Mohamadian, M.; Ruiz, J.P.; Banayas, J.; Bernaldez, F.G. Visual landscape exploration as revealed by eye movement tracking. Landsc. Urban Plan. 1996, 34, 135–142. [Google Scholar] [CrossRef]
- Nordh, H.; Hagerhall, C.M.; Holmqvist, K. Tracking Restorative Components: Patterns in Eye Movements as a Consequence of a Restorative Rating Task. Landsc. Res. 2013, 38, 101–116. [Google Scholar] [CrossRef]
- Amati, M.; Parmehr, E.G.; McCarthy, C.; Sita, J. How eye-catching are natural features when walking through a park? Eye tracking responses to videos of walks. Urban For. Urban Green. 2018, 31, 67–78. [Google Scholar] [CrossRef]
- Elsadek, M.; Sun, M.; Sugiyama, R.; Fujii, E. Cross-cultural comparison of physiological and psychological responses to different garden styles. Urban For. Urban Green. 2019, 38, 74–83. [Google Scholar] [CrossRef]
- Xiang, Y.; Liang, H.; Fang, X.; Chen, Y.; Xu, N.; Hu, M.; Chen, Q.; Mu, S.; Hedblom, M.; Qiu, L.; et al. The comparisons of on-site and off-site applications in surveys on perception of and preference for urban green spaces: Which approach is more reliable? Urban For. Urban Green. 2021, 58, 126961. [Google Scholar] [CrossRef]
- Cottet, M.; Vaudor, L.; Tronchère, H.; Roux-Michollet, D.; Augendre, M.; Brault, V. Using gaze behavior to gain insights into the impacts of naturalness on city dwellers’ perceptions and valuation of a landscape. J. Environ. Psychol. 2018, 60, 9–20. [Google Scholar] [CrossRef]
- Berto, R.; Massaccesi, S.; Pasini, M. Do eye movements measured across high and low fascination photographs differ? Addressing Kaplan’s fascination hypothesis. J. Environ. Psychol. 2008, 28, 185–191. [Google Scholar] [CrossRef]
- Franěk, M.; Petružálek, J.; Šefara, D. Eye movements in viewing urban images and natural images in diverse vegetation periods. Urban For. Urban Green. 2019, 46, 126477. [Google Scholar] [CrossRef]
- Tatler, B.W. The central fixation bias in scene viewing: Selecting an optimal viewing position independently of motor biases and image feature distributions. J. Vis. 2007, 7, 4. [Google Scholar] [CrossRef] [PubMed] [Green Version]
- Tseng, P.H.; Carmi, R.; Cameron, I.G.; Munoz, D.P.; Itti, L. Quantifying center bias of observers in free viewing of dynamic natural scenes. J. Vis. 2009, 9, 4. [Google Scholar] [CrossRef] [Green Version]
- Cheng, J. The Craft of Gardens; Yale University Press: London, UK, 1988. [Google Scholar]
- Li, X.; Xia, B.; Lusk, A.; Liu, X.; Lu, N. The Humanmade Paradise: Exploring the Perceived Dimensions and Their Associations with Aesthetic Pleasure for Liu Yuan, a Chinese Classical Garden. Sustainability 2019, 11, 1350. [Google Scholar] [CrossRef] [Green Version]
- Fung, S. The interdisciplinary prospects of reading Yuan ye. Stud. Hist. Gard. Des. Landsc. 1998, 18, 211–231. [Google Scholar] [CrossRef]
- Bureau, S.L. Basic Profile. 2021. Available online: http://ylj.suzhou.gov.cn/szsylj/jbgk2/nav_wztt.shtml (accessed on 28 July 2021).
- Liu, M.; Nijhuis, S. Mapping landscape spaces: Methods for understanding spatial-visual characteristics in landscape design. Environ. Impact Assess. Rev. 2020, 82, 106376. [Google Scholar] [CrossRef]
- Nielsen, A.B.; Heyman, E.; Richnau, G. Liked, disliked and unseen forest attributes: Relation to modes of viewing and cognitive constructs. J. Environ. Manag. 2012, 113, 456–466. [Google Scholar] [CrossRef]
- Lappi, O. Eye Tracking in the Wild: The Good, the Bad and the Ugly. J. Eye Mov. Res. 2015, 8, 1. [Google Scholar] [CrossRef]
- Diedenhofen, B.; Musch, J. Correction: Cocor: A Comprehensive Solution for the Statistical Comparison of Correlations. PLoS ONE 2015, 10, e0131499. [Google Scholar] [CrossRef] [PubMed]
- Goldberg, J.H.; Kotval, X.P. Computer interface evaluation using eye movements: Methods and constructs. Int. J. Ind. Ergon. 1999, 24, 631–645. [Google Scholar] [CrossRef]
- Franěk, M.; Šefara, D.; Petružálek, J.; Cabal, J.; Myška, K. Differences in eye movements while viewing images with various levels of restorativeness. J. Environ. Psychol. 2018, 57, 10–16. [Google Scholar] [CrossRef]
- Mackworth, N.H.; Morandi, A.J. The gaze selects informative details within pictures. Percept. Psychophys. 1967, 2, 547–552. [Google Scholar] [CrossRef] [Green Version]
- Koffka, K. Principles of Gestalt Psychology; Lund Humphries: London, UK, 1935. [Google Scholar]
- Yin, L.; Wang, Z. Measuring visual enclosure for street walkability: Using machine learning algorithms and Google Street View imagery. Appl. Geogr. 2016, 76, 147–153. [Google Scholar] [CrossRef]
Figure 1.
Schemes follow the same formatting. Black triangle means other urban parks.
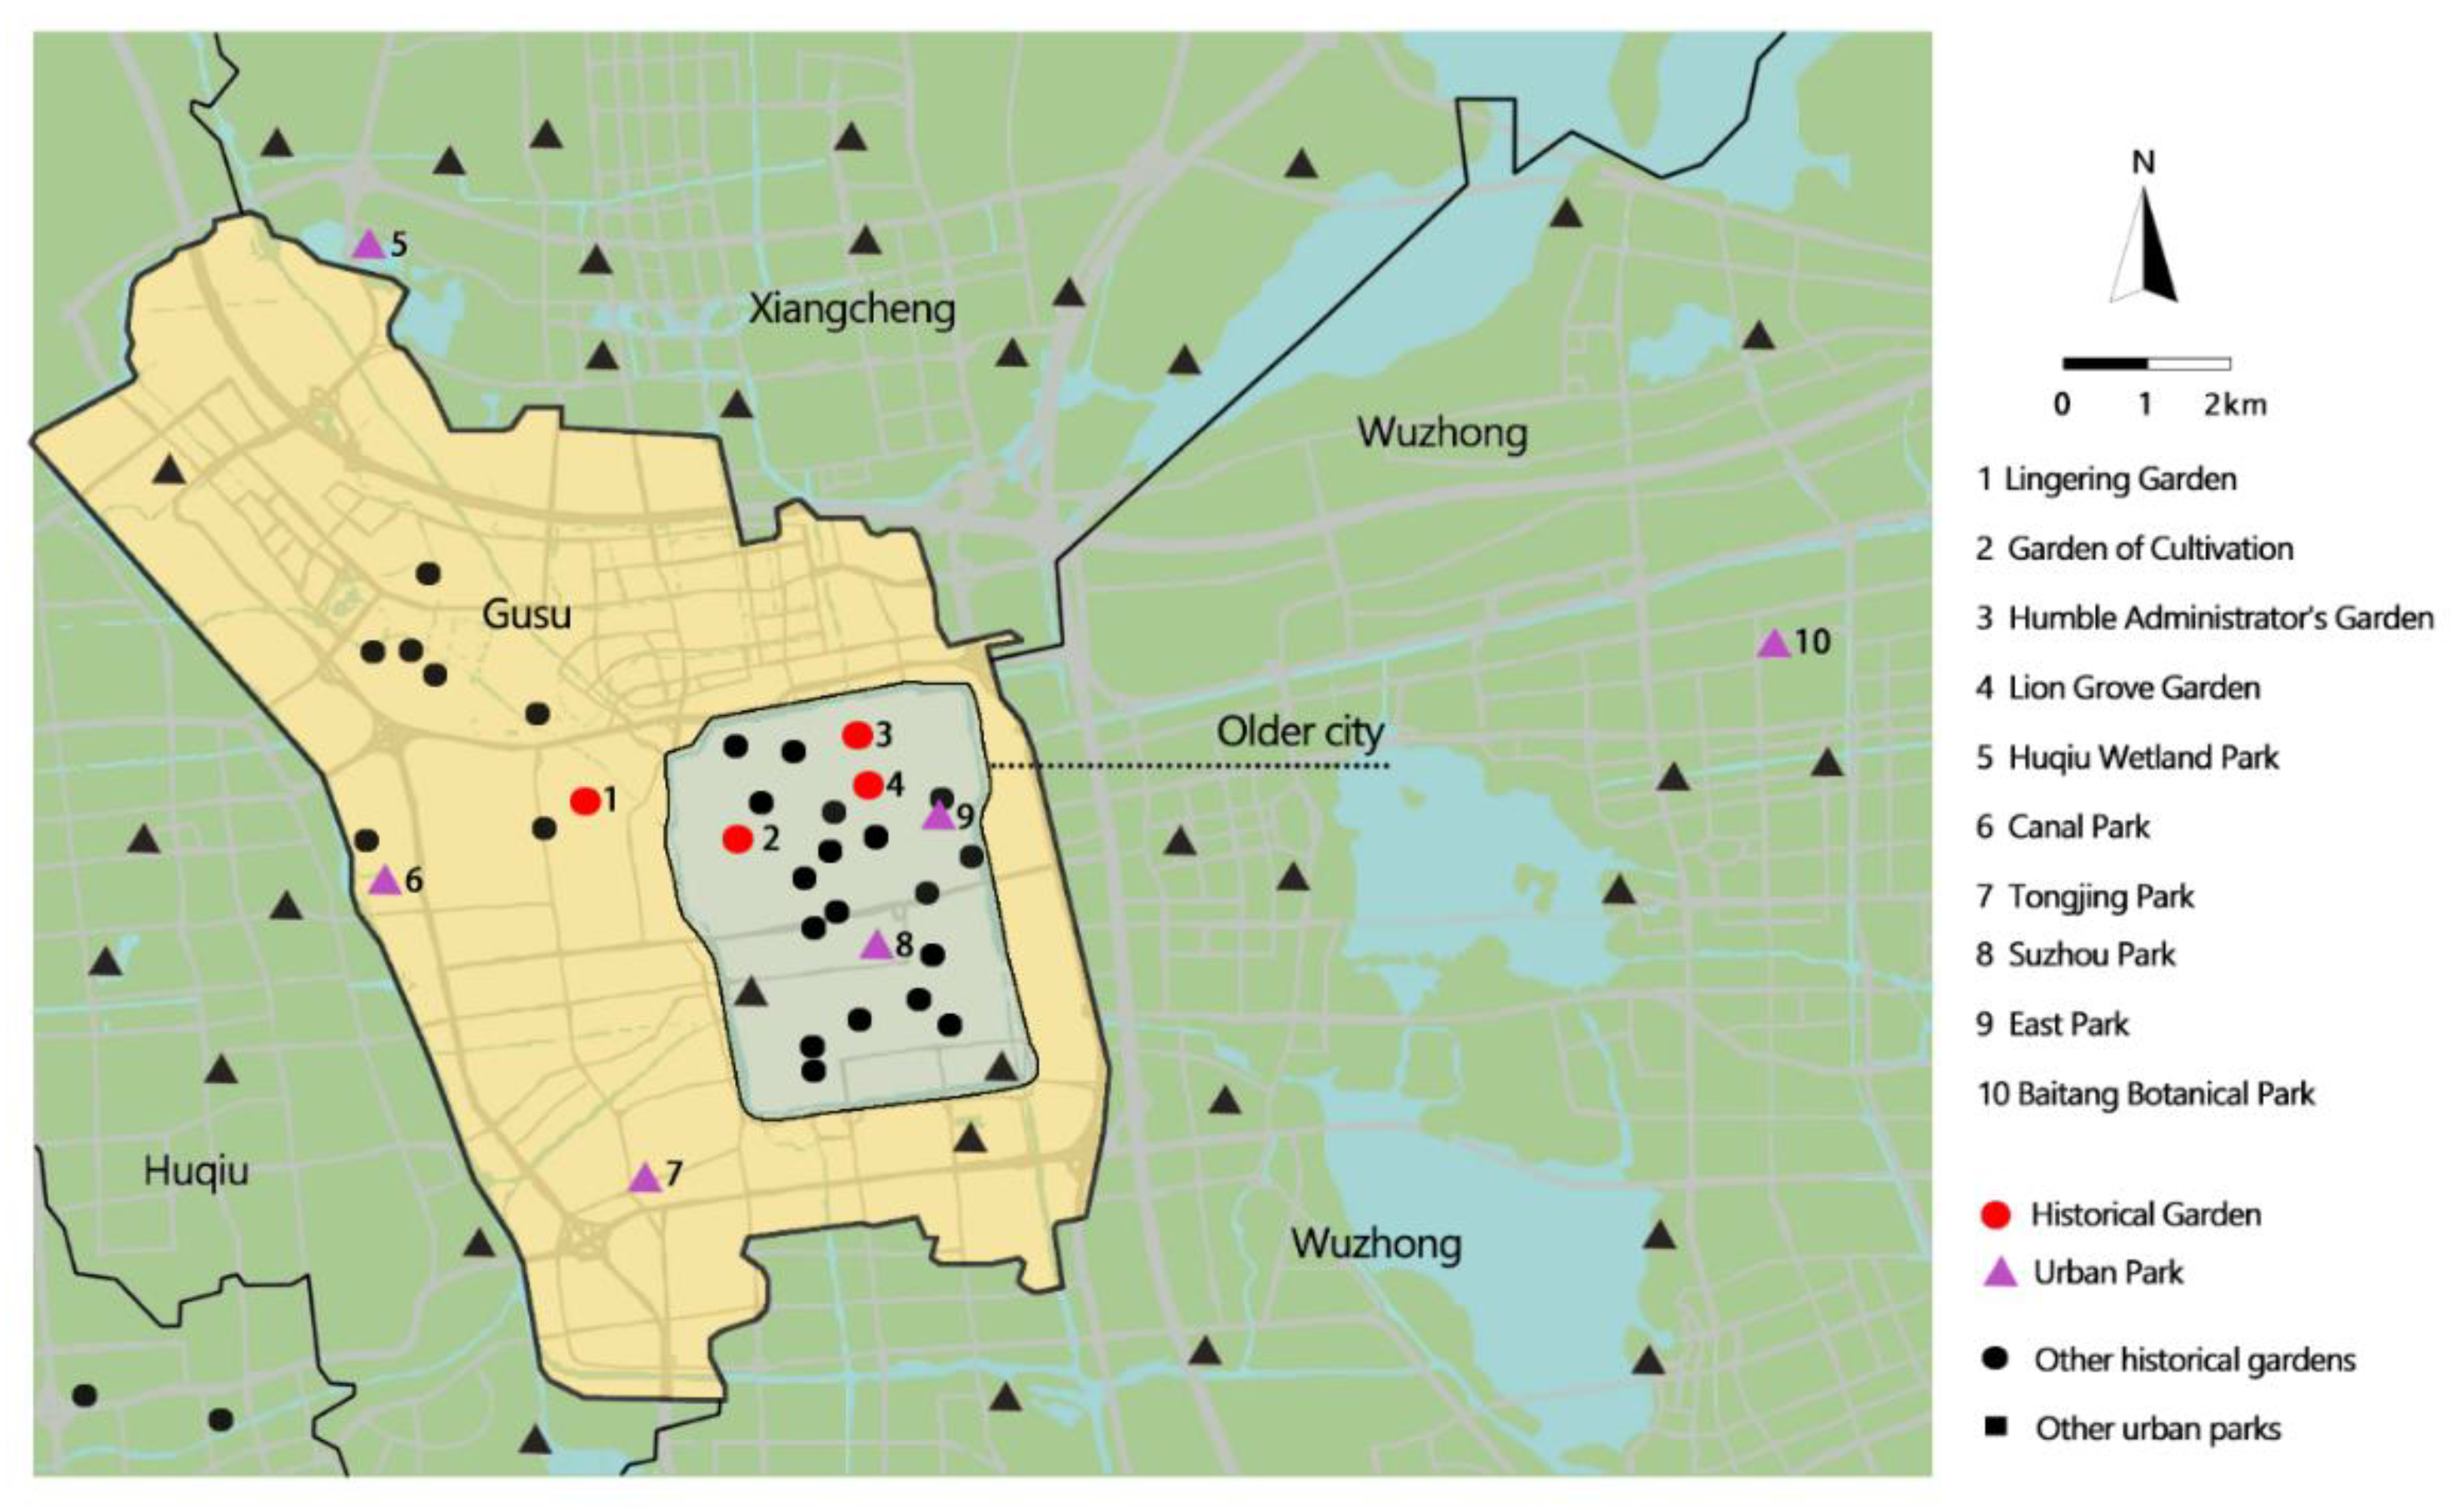
Figure 2.
Schematic diagram of the pixels of the pictures used as stimuli: (a) An original photograph of HGWS; (b) An original photograph of UPWS; (c) A pixel labeling of vertical direction in HGWS; (d) A pixel labeling of horizontal direction in HGWS; (e) A pixel labeling of horizontal direction in UPWS; (f) A pixel labeling of vertical direction in UPWS; (g) The percentage of landscape elements in HGWS; (h) The percentage of landscape elements in UPWS.
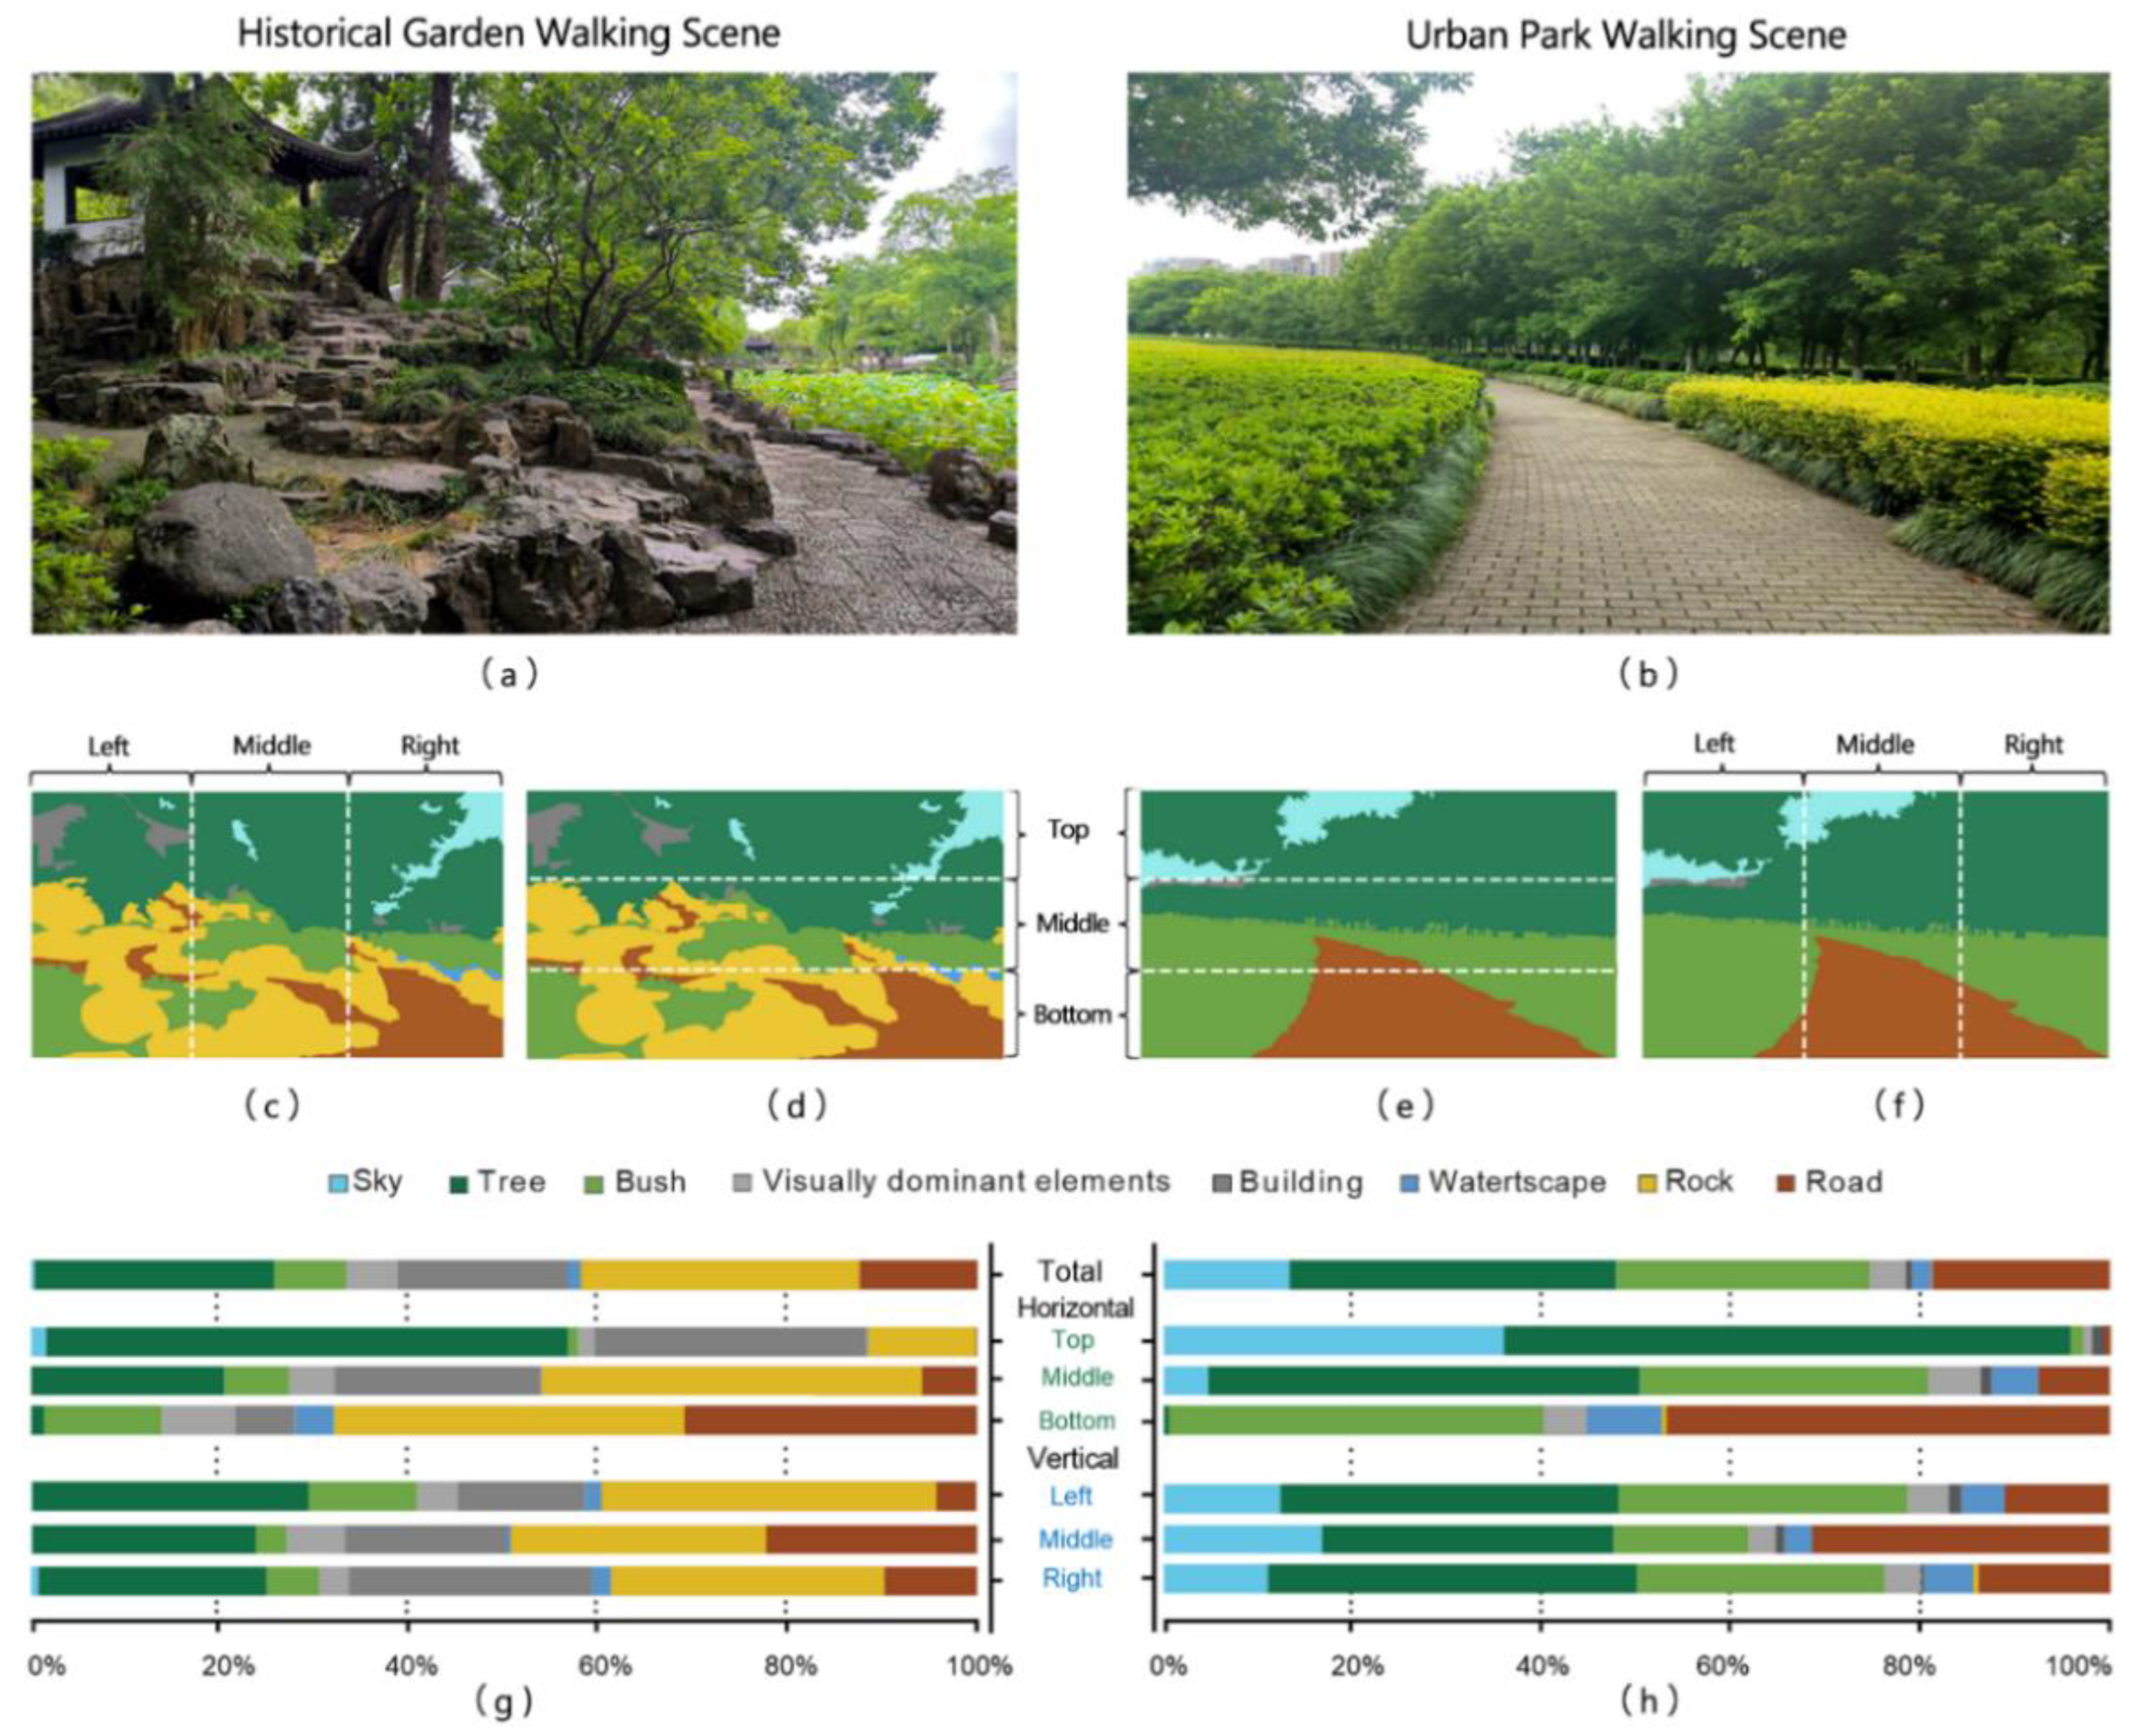
Figure 3.
Boxplot of fixation time between HGWSs and UPWSs (p < 0.01: **. The black spots are outliers).
Figure 3.
Boxplot of fixation time between HGWSs and UPWSs (p < 0.01: **. The black spots are outliers).
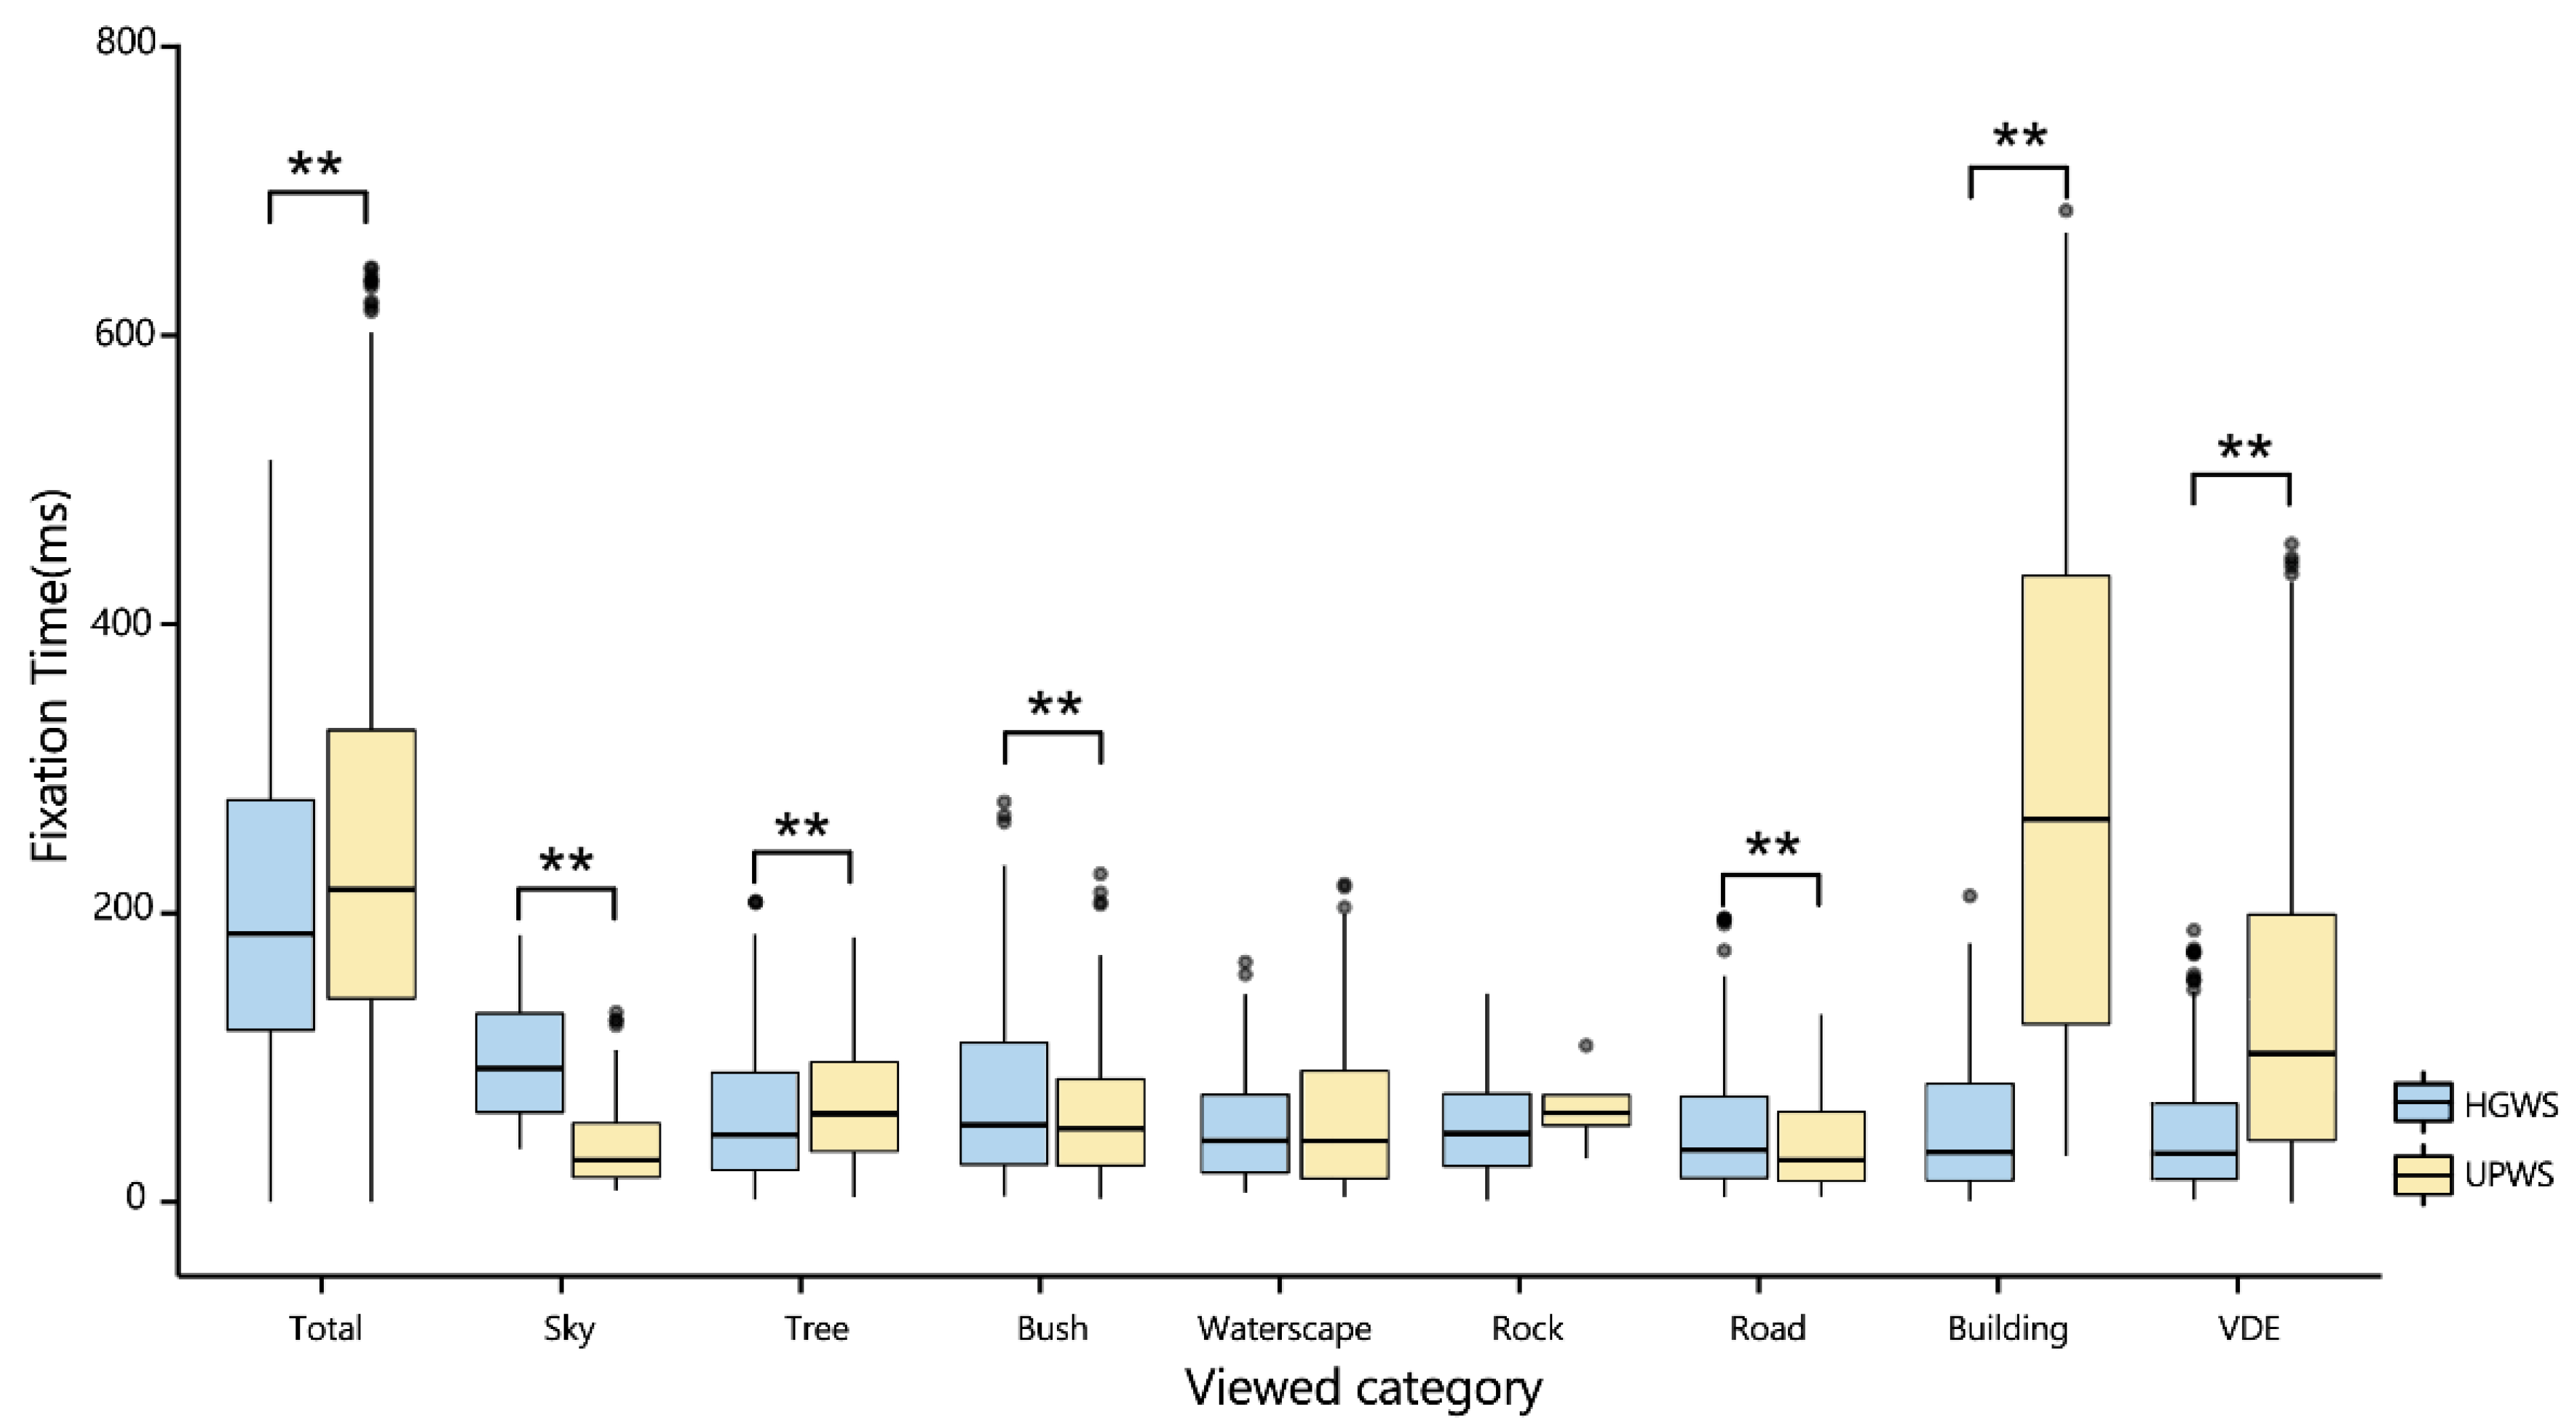
Figure 4.
Violin plot of the fixation time difference in visual attention area between HGWS and UPWS (p < 0.01: **. The box is interquartile, and thick horizontal line is median).
Figure 4.
Violin plot of the fixation time difference in visual attention area between HGWS and UPWS (p < 0.01: **. The box is interquartile, and thick horizontal line is median).
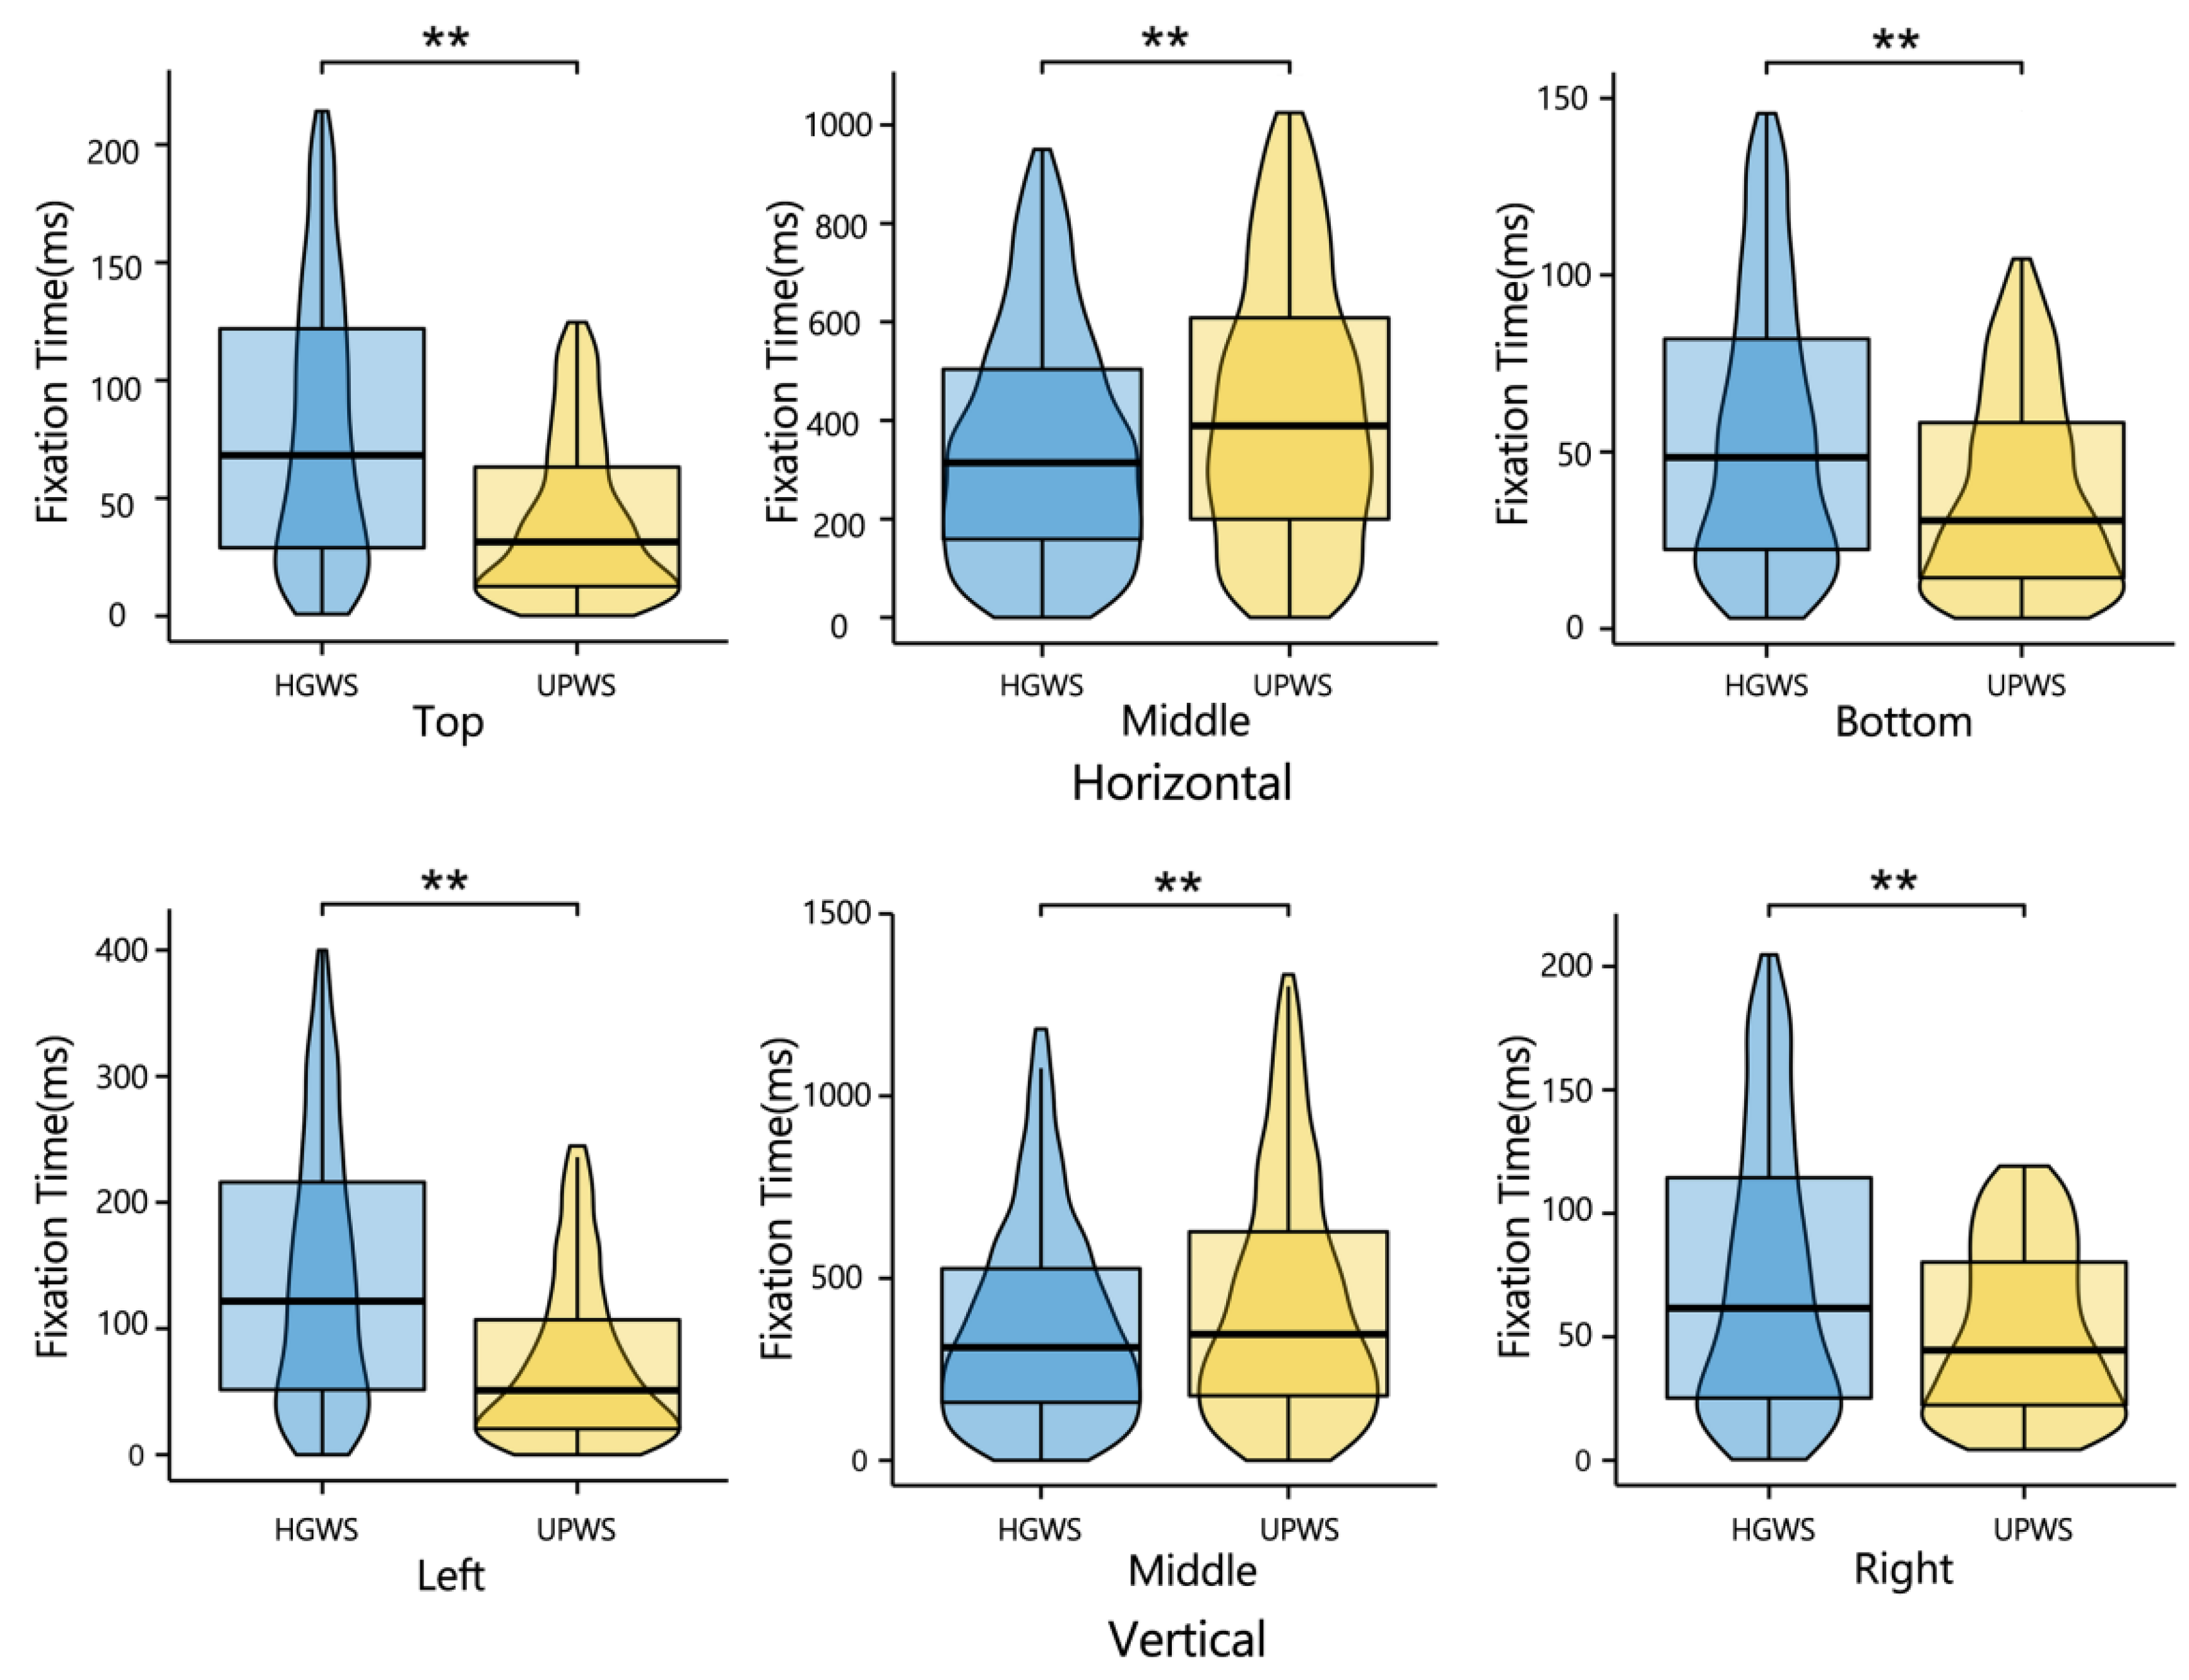
Figure 5.
Comparison of visual perception scores between HGWS and UPWS (p < 0.01: **); data are shown as means (SD).
Figure 5.
Comparison of visual perception scores between HGWS and UPWS (p < 0.01: **); data are shown as means (SD).
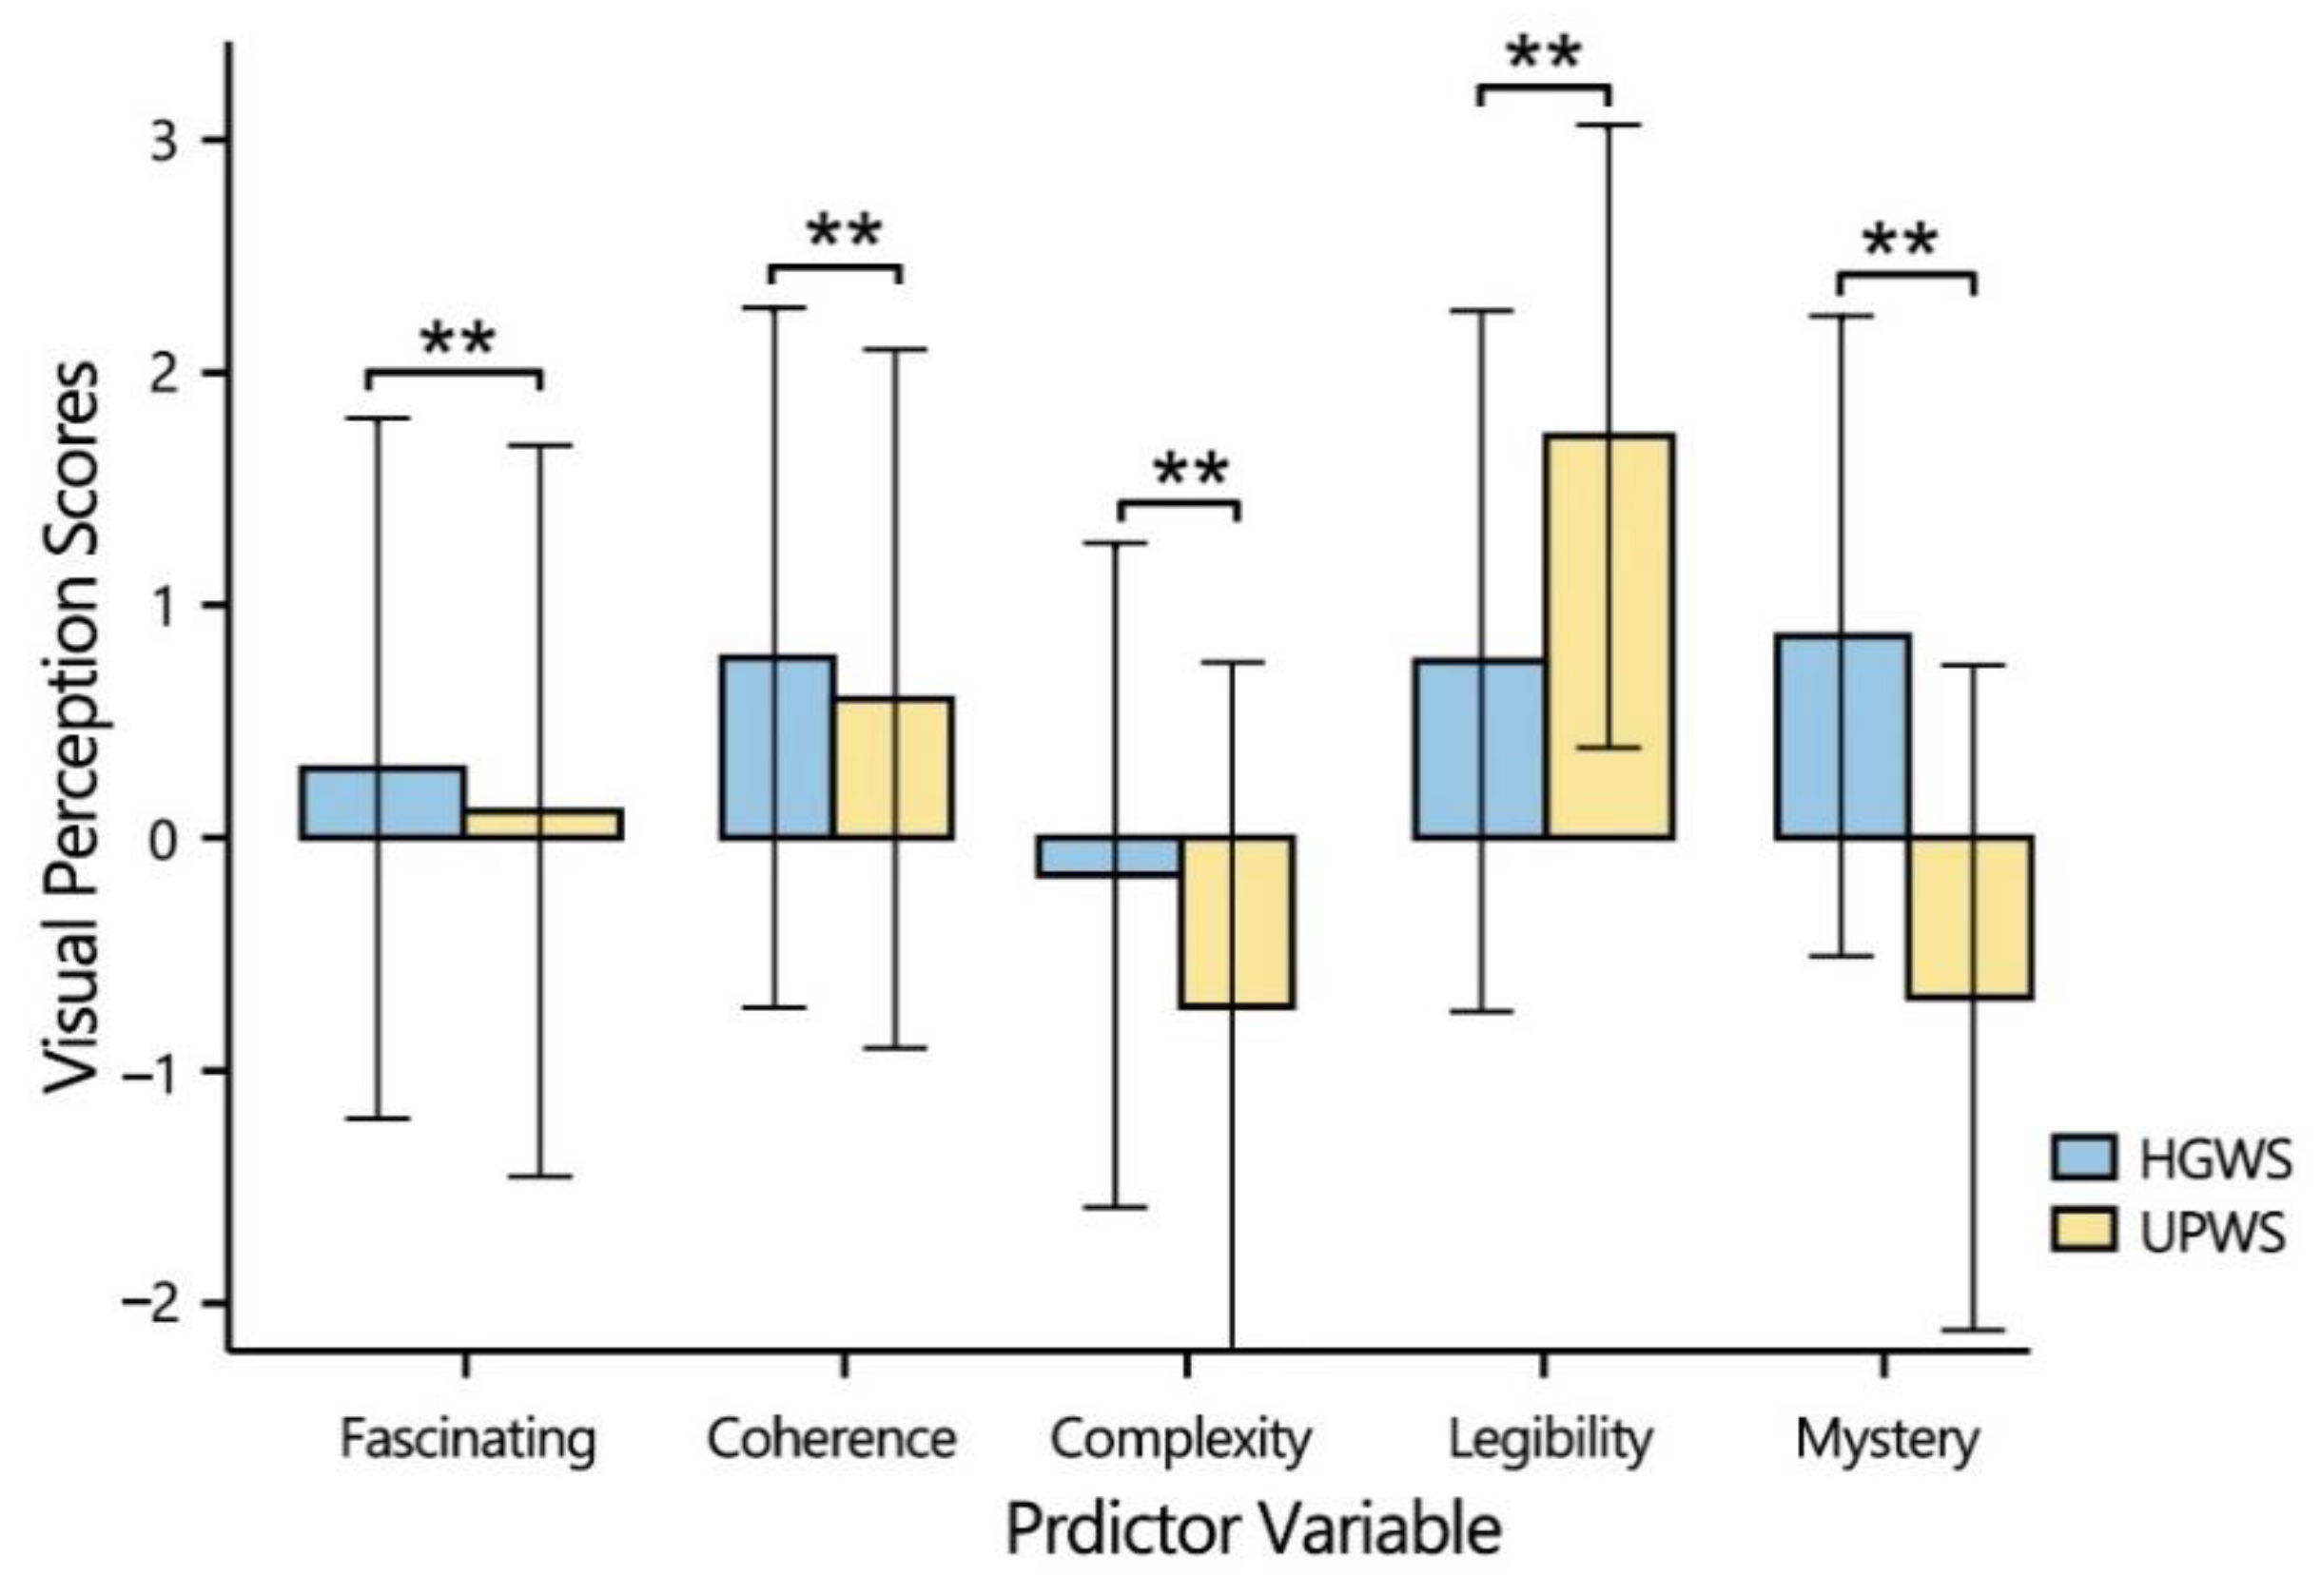
Table 1.
Feature description of typical walking scene in historical gardens and urban parks.
| Category | HGWS Example | UPWS Example |
|---|---|---|
| Sky | Slightly visible, overcast sky | Massively visible, overcast sky |
| Plant | Scattered trees, shrubs without trimming | Neat street trees and woods, neatly trimmed shrubs and lawn |
| Road | Decorative pave with pebble, tile and stone, steps, winding and narrow road | Asphalt, cement and pave stone, wide path |
| Rock | Decorative rockery stacked by Taihu stone | Natural rock |
| Waterscape | Natural pond | Artificial waterscape |
| Building | Exquisite historical building, such as corridors and pavilions | Simple modern architecture |
| VDE | Wooden railing, decorative lantern, stone fence | Light poles, signage, metal railing |
Notes: VDE: Visually dominant elements.
Table 2.
Correlation comparison of total fixation time and percentage of landscape elements between HGWS and UPWS.
Table 2.
Correlation comparison of total fixation time and percentage of landscape elements between HGWS and UPWS.
| Sky | Tree | Bush | Waterscape | Rock | Road | Building | VDE | ||
|---|---|---|---|---|---|---|---|---|---|
| HGWS | r | 0.143 ** | −0.118 ** | −0.014 | −0.108 * | −0.285 ** | 0.051 | 0.196 ** | 0.148 ** |
| UPWS | r | 0.137 ** | −0.102 * | −0.290 ** | 0.368 ** | 0.535 ** | 0.058 | 0.133 ** | 0.120 ** |
| z | 0.129 | 1.145 | 7.160 | −5.251 | −9.268 | −0.185 | −0.938 | 0.490 | |
| p | 0.897 | 0.252 | 0.000 ** | 0.000 ** | 0.000 ** | 0.852 | 0.0348 | 0.624 |
Notes: N = 1403. p < 0.05: *; p < 0.01: **. VDE: Visually dominant elements.
Table 3.
Correlation between fixation time and visual perception in HGWS.
| Horizontal | Vertical | |||||
|---|---|---|---|---|---|---|
| Top | Middle | Bottom | Left | Middle | Right | |
| Fascination | 0.061 | 0.116 ** | 0.196 ** | 0.079 | 0.160 ** | 0.198 ** |
| Coherence | 0.013 | 0.106 * | 0.146 ** | 0.041 | 0.091 | 0.134 ** |
| Complexity | 0.014 | 0.154 ** | 0.089 | −0.042 | 0.015 | 0.132 ** |
| Legibility | 0.001 | 0.036 | 0.068 | 0.046 | 0.194 ** | 0.029 |
| Mystery | −0.005 | 0.126 ** | 0.140 ** | 0.050 | 0.081 | 0.144 ** |
Notes: N = 1403. p < 0.05: *; p < 0.01: **.
Table 4.
Correlations between fixation time and visual perception in UPWS.
| Horizontal | Vertical | |||||
|---|---|---|---|---|---|---|
| Top | Middle | Bottom | Left | Middle | Right | |
| Fascination | −0.108 * | 0.064 | 0.090 | −0.072 | 0.106 * | 0.166 ** |
| Coherence | −0.168 ** | 0.094 | 0.079 | −0.136 * | 0.038 | 0.130 * |
| Complexity | 0.278 ** | 0.054 | −0.005 | 0.226 ** | 0.068 | −0.048 |
| Legibility | −0.316 ** | 0.176 ** | −0.023 | −0.304 ** | 0.228 ** | 0.048 |
| Mystery | 0.244 ** | −0.184 ** | 0.012 | 0.242 ** | −0.172 ** | 0.044 |
Notes: N = 1403. p < 0.05: *; p < 0.01: **.
Table 5.
Correlation comparison of fixation time and visual perception between HGWS and UPWS.
| Horizontal | Vertical | |||||
|---|---|---|---|---|---|---|
| Top | Middle | Bottom | Left | Middle | Right | |
| Fascination | 4.485 ** | 1.387 | 2.866 ** | 4.003 ** | 1.455 | 0.875 |
| Coherence | −4.831 ** | −0.321 | −1.796 | −4.706 ** | −1.408 | −0.108 |
| Complexity | −7.183 ** | 2.677 ** | 2.493 * | −7.196 ** | −2.198 * | 4.783 ** |
| Legibility | 8.683 ** | −3.752 ** | 2.410 * | 9.523 ** | −0.941 | −2.038 * |
| Mystery | −6.721 ** | 8.275 ** | 0.752 | −5.208 ** | 6.744 ** | 2.671 ** |
Publisher’s Note: MDPI stays neutral with regard to jurisdictional claims in published maps and institutional affiliations. |
© 2022 by the authors. Licensee MDPI, Basel, Switzerland. This article is an open access article distributed under the terms and conditions of the Creative Commons Attribution (CC BY) license (https://creativecommons.org/licenses/by/4.0/).
Share and Cite
MDPI and ACS Style
Li, C.; Huang, X. Differences in Visual Attraction between Historical Garden and Urban Park Walking Scenes. Land 2022, 11, 1766. https://doi.org/10.3390/land11101766
AMA Style
Li C, Huang X. Differences in Visual Attraction between Historical Garden and Urban Park Walking Scenes. Land. 2022; 11(10):1766. https://doi.org/10.3390/land11101766
Chicago/Turabian StyleLi, Chang, and Xiaohui Huang. 2022. "Differences in Visual Attraction between Historical Garden and Urban Park Walking Scenes" Land 11, no. 10: 1766. https://doi.org/10.3390/land11101766
Note that from the first issue of 2016, this journal uses article numbers instead of page numbers. See further details here.