Article

Evaluating Capability of Green Stormwater Infrastructure on Large Properties toward Adaptive Flood Mitigation: The HLCA+C Methodology

1
School of Landscape Architecture, Lincoln University, Lincoln 7647, New Zealand
2
Faculty of Geological Sciences, University of Canterbury, Christchurch 8140, New Zealand
*
Authors to whom correspondence should be addressed.
Land 2022, 11(10), 1765; https://doi.org/10.3390/land11101765
Submission received: 18 September 2022 / Revised: 7 October 2022 / Accepted: 9 October 2022 / Published: 12 October 2022

Abstract

:
Current flood protection capacities will become inadequate to protect many low-lying coastal cities from climate change-induced flooding in the future. Under climate change uncertainty, an adaptive strategy is required to provide supplemental flood mitigation. Green Stormwater Infrastructure (GSI) in developed areas has the potential to provide substantial catchment runoff reduction. However, individual properties vary in their Flood Mitigation Capability (FMC) depending on their land characteristics. An effective methodology is needed to evaluate the FMC of properties to help urban planners determine which to target for GSI and when to implement GSI in light of increased climate change impacts. We advance the Hydrology-based Land Capability Assessment and Classification (HLCA+C) methodology for evaluating the FMC of large properties over the long term (80 to 100-year). It builds on the strengths of existing methodologies and uses a land unit analysis approach for assessing FMC, considering interdependent hydrological and geographical variables. The FMC classification system groups properties with similar flood mitigation characteristics, helping urban planners to understand their potentials and limitations for flood mitigation toward the development of adaptive strategies through time. Step-by-step instructions demonstrate how to apply the methodology to any low-lying coastal city.

1. Introduction

Many low-lying coastal cities will confront significant challenges in flood management in the context of climate change [1,2,3]. Increases in surface runoff into rivers have resulted from expanding urbanisation [4], and increased intensity and frequency of storm events with climate change [5]. With rising sea levels, both the amount of seawater entering rivers and groundwater levels will increase [6], which will reduce the in-ground storage capacity for holding stormwater [7,8]. Moreover, some coastal cities are confronting high land subsidence rates that further increase their flood risk [9].
Conventional flood mitigation strategies, such as using front-line defensive structures on public land, may not provide adequate capacity for flood protection with climate change [10]. Substantial reinforcement may be needed to handle the increased flood water [11]. However, climate change projections are highly uncertain, especially in the long term. This means a large and pre-emptive investment in reinforcements risks under or over-investment [12]. Under these conditions, an adaptative planning approach is preferred as flood mitigation can be implemented when needed. It is less risky and is considered more cost-effective than one-time and expensive flood mitigation investments [13,14].
We define a Green Stormwater Infrastructure (GSI) as a vegetated stormwater management facility that retains and/or slows surface runoff before it enters a receiving water body [15]. Many studies have demonstrated the potential of decentralised GSI facilities for providing cities with additional flood mitigation capability beyond that provided by the primary stormwater management system [16,17,18,19,20]. The goal is to ensure the primary system can continue to provide the needed flood protection in light of progressively increasing run-off with climate change, without expensive reinforcements to current flood defence structures. Privately owned large properties (often industrial, commercial, and institutional land uses), should be considered as opportunities for strategic flood mitigation, as many cities do not have large areas of public land having these characteristics [21,22]. However, substantial variations in biophysical and built-environmental characteristics can substantially alter the Flood Mitigation Capability (FMC) of large properties within catchments [7,20,23,24]. FMC is the ability of land to collect runoff on-site which leads to reduced total catchment runoff volume.
An effective methodology is needed to evaluate the FMC of these properties through time under climate change. This will allow planners to prioritise properties for GSI networks and develop adaptive GSI implementation approaches through time. However, there is no existing methodology that meets three key methodological requirements: (1) to identify the FMC of a property to mitigate catchment runoff volume [25,26], (2) to assess this capability under future climate conditions [26,27,28]; and (3) to compare the capabilities of properties toward the development of adaptive flood mitigation through time [25,26,27,28].
Our novel methodology integrates the strengths of existing methodologies related to land evaluation for implementing GSI to mitigate flooding. A core aspect of it is a new FMC classification system that groups together properties with similar capabilities and limitations to mitigate flooding. This system will help planners to understand the different FMC of properties, determine how best to maximise their capabilities through effective implementation approaches, and to form adaptive GSI networks through time. In addition, it provides a common language by which planners can communicate with hydrologists, and other disciplines, toward effective interdisciplinary flood mitigation decision-making. The methodology is described step by step, and we critically evaluate how this new methodology compares with those existing for modelling FMC.

Existing Methodologies for Modelling Flood Mitigation Capability

There are three types of existing methodologies for modelling FMC: hydrology-based, multiple criteria analysis-based, and geographical information system-based. None meets all three key methodological criteria. Hydrology-based methodologies meet the first and second, but not the third. They effectively evaluate the performance of different GSI for catchment flood mitigation under different rainfall intensities [17,18,19,29]. While they model GSI under different future climate conditions, they are rarely used to consider the impact of rising sea levels on capability with rising groundwater levels [7,29]. In addition, they evaluate the effectiveness of GSI policies implemented across a catchment, not the capabilities of alternative locations within a catchment with variations in land characteristics.
Multiple Criteria Analysis-based (MCA-based) methodologies partially meet objectives one and three but not objective two. They are designed to evaluate individual properties for combinations of GSI facilities that are capable and suitable for providing flood mitigation. Methodologies include System for Urban Stormwater Treatment and Analysis Integration (SUSTAIN) [30], Multi-Criteria Decision Analysis (MCDA) [31], Adaptation Support Tool (AST) [32], and Urban Biophysical Environments and Technologies Simulator (UrbanBEATS) [33]. Using these methodologies, potential GSI areas are differentiated based on their biophysical and built-environmental characteristics (e.g., existing land covers, soil textures, groundwater depths, slopes, and areas of potential GSI). Appropriate GSI facilities are then proposed to suit the characteristics of each potential GSI area. The amount of runoff reduction is simulated using hydrological modelling, and a cost–benefit analysis is performed to select the most cost-effective GSI facility combinations. However, the runoff reduction at the drainage outlet of a property is modelled for a particular storm under the current situation, not under future climate conditions.
Geographical Information System-based (GIS-based) methodologies meet only objective three but not one and two. They are designed to classify potential areas within a catchment for GSI implementation but are not meant to assess the effects of GSI on different areas for reducing catchment-scale runoff volume or in the context of climate change. They are commonly used to identify strategic locations to implement GSI for mitigating the impacts of flooding [34,35,36]. However, GIS-based methodologies can consider factors beyond land capability to determine which areas should be prioritised for GSI implementation, including the level of flood hazard (e.g., the percentage of impervious surface and the amount of precipitation in different areas) and flood vulnerability (e.g., demographic factors, and density of urban development) [e.g., [36]]. They also identify where GSI has the highest likelihood of implementation due to land ownership, water demand, or where GSI might provide other valued ecosystem services [e.g., [34]].

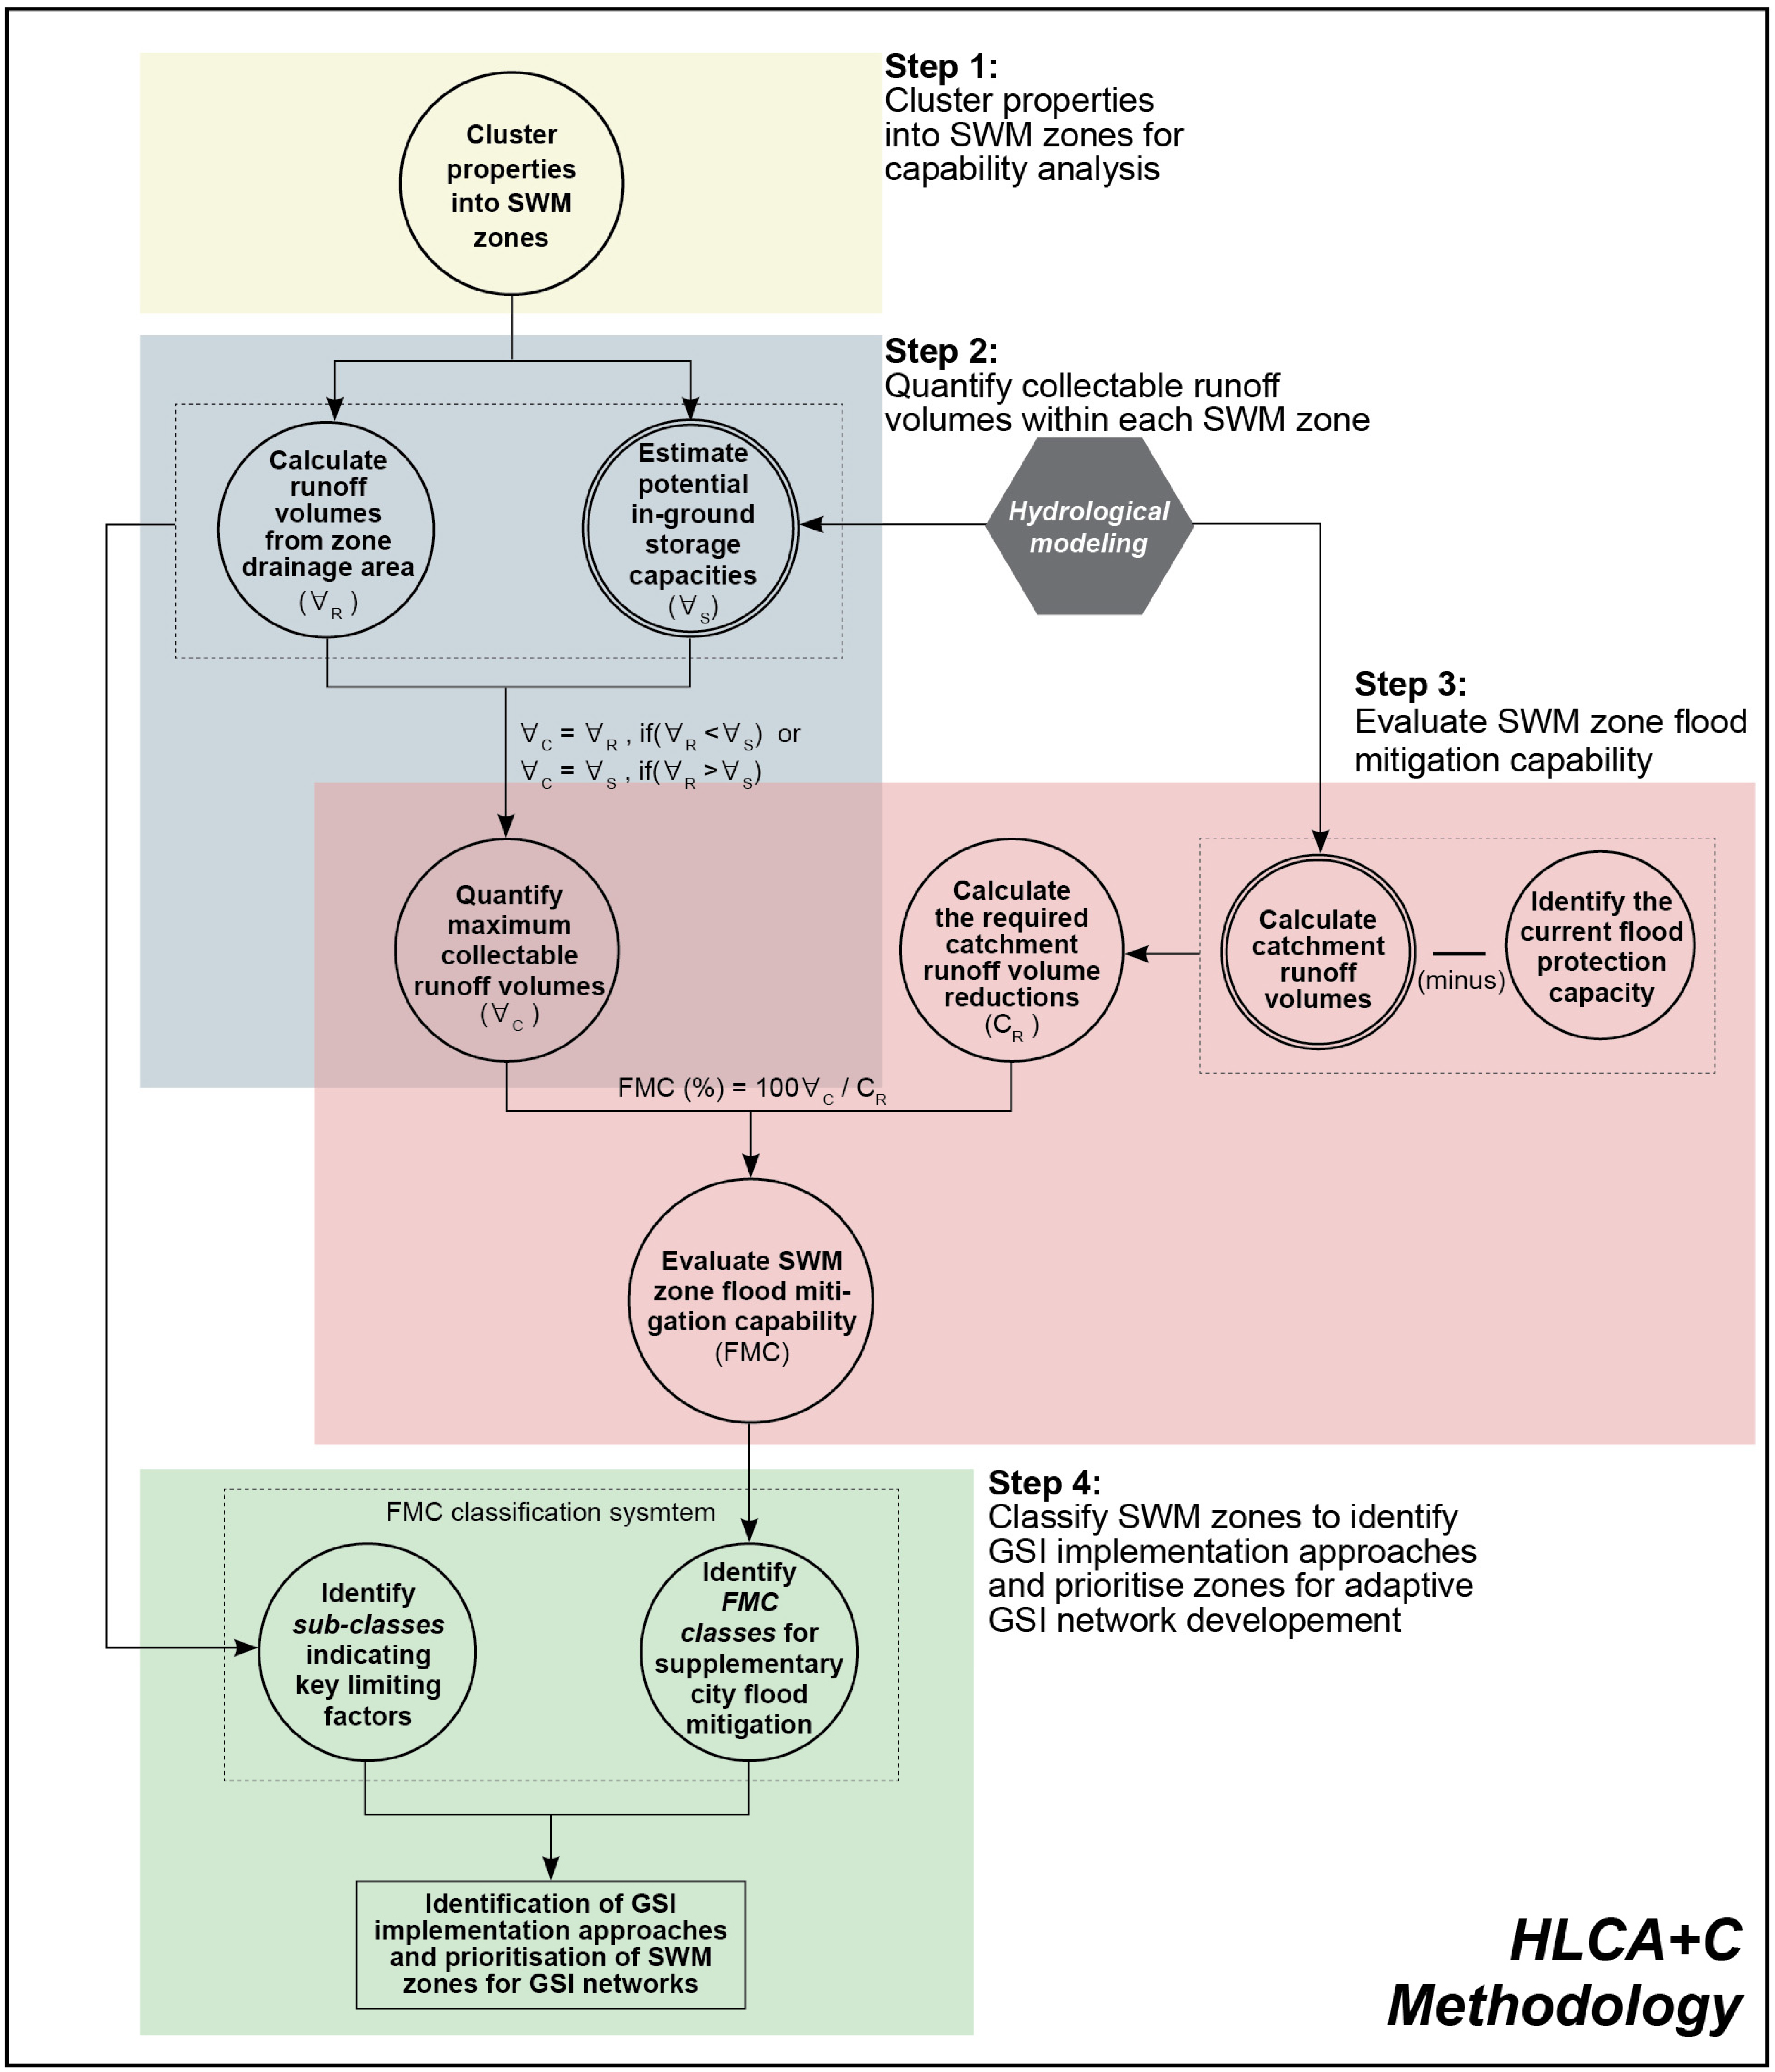
2. Hydrology-based Land Capability Assessment and Classification (HLCA+C) Methodology

The HLCA+C methodology consists of four main steps that result in outputs that inform adaptation plans for catchment flood mitigation over time (Figure 1). The first step clusters properties into units of analysis (referred to as Storm Water Management (SWM) zones in this methodology). The second step quantifies the collectable runoff volumes of each SWM zone in the context of the minor, moderate and major climate change scenarios corresponding to the Intergovernmental Panel on Climate Change (IPCC) reports for the mid-term and long-term periods. The third step evaluates the Flood Mitigation Capability (FMC) of each SWM zone under these scenarios and for these periods. The output of these three steps is the calculation of the proportion of collectable runoff volume needed to mitigate climate change-induced flooding to a current flood protection capacity or to maintain flood protection objectives under climate change impacts. Finally, step four classifies each SWM zone into a class based on its FMC and sub-class according to the key factor that limits its FMC. Based on the results of the classification, the best approaches for implementing GSI in the zones through time (i.e., through a site retrofit, redesign, or relocation) are identified. Flood mitigation adaptation plans could then be developed, which involve zones being prioritised for implementation over time.

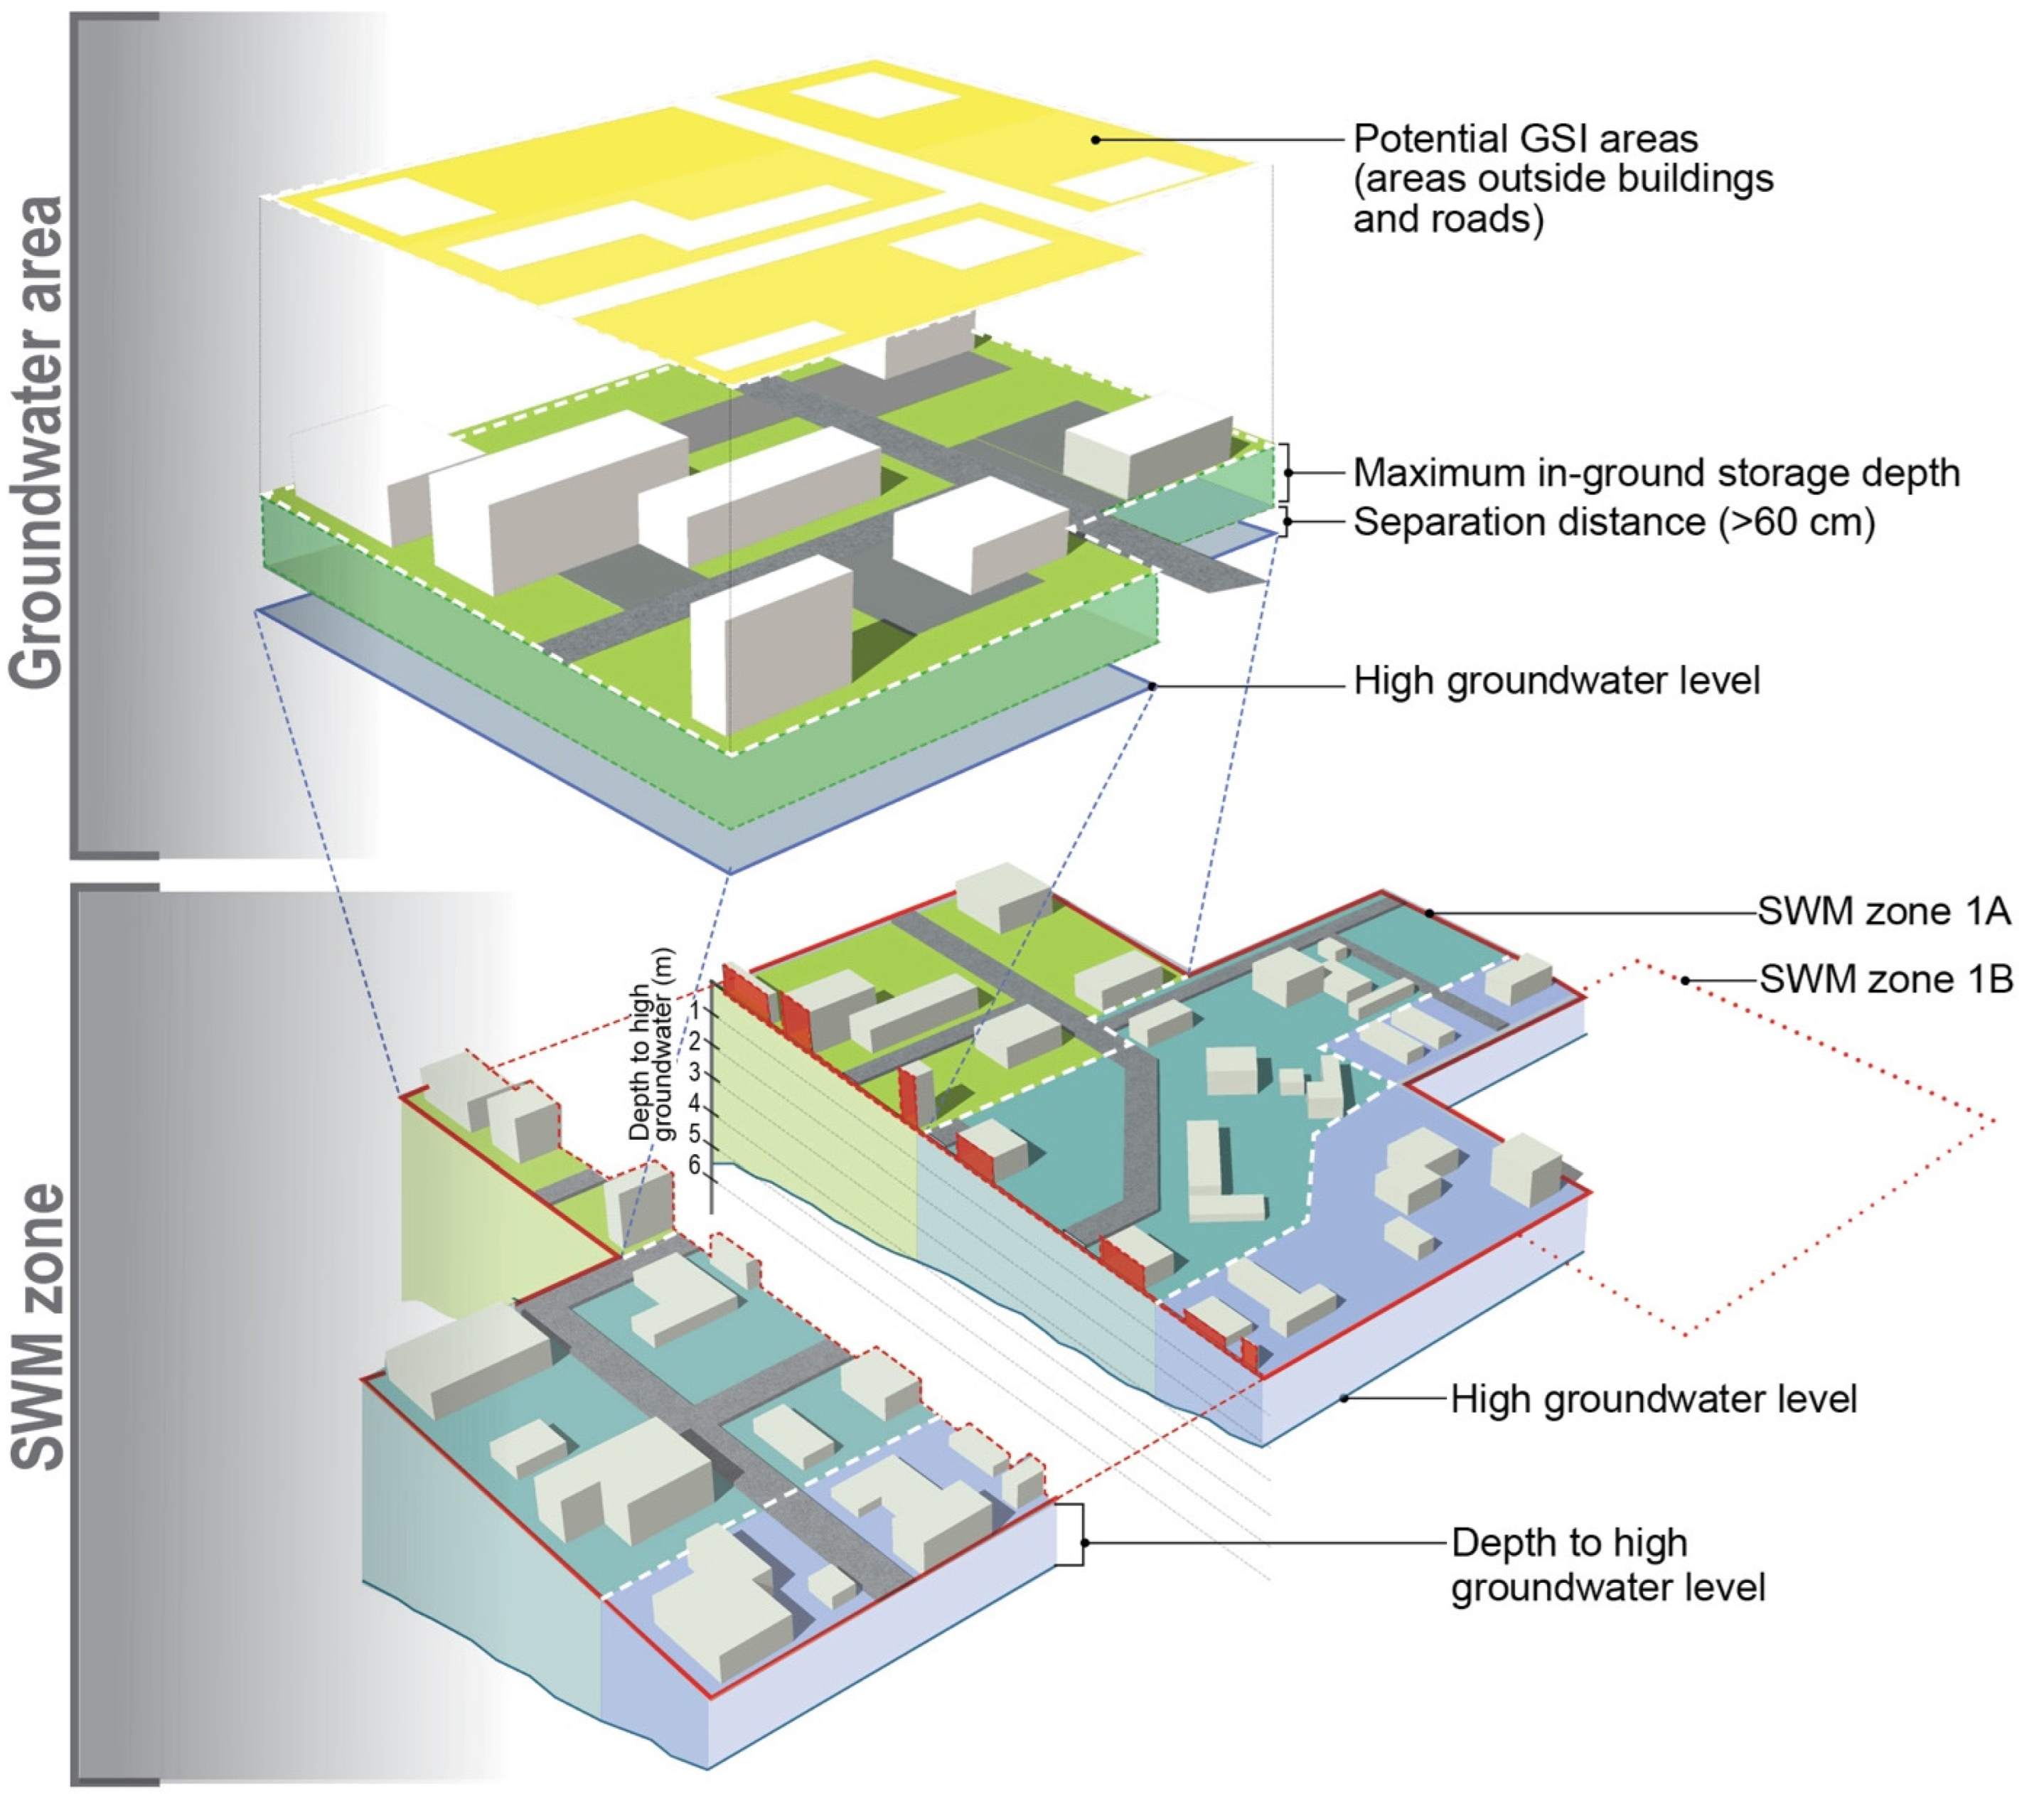
2.1. Step 1: Cluster Properties into SWM Zone for Capability Analysis

This methodology adopts a landscape unit approach [37] to assess and classify the capability of properties for providing catchment flood mitigation. Accordingly, properties sharing similar potential in support of land use (in this case, FMC) are grouped together as units of analysis [37]. Grouping properties together also helps to define spatial boundaries in which stormwater can be managed to optimise their FMC. We refer to these units of analysis as Storm Water Management (SWM) zones which we define as properties having the potential to provide substantial flood mitigation that are spatially connected and discharge their runoff through a common outlet. Figure 2 demonstrates how properties are combined into different SWM zones. Some of the zones, such as Zone 1A and 2C, have the potential to collect runoff from upstream contributing areas.

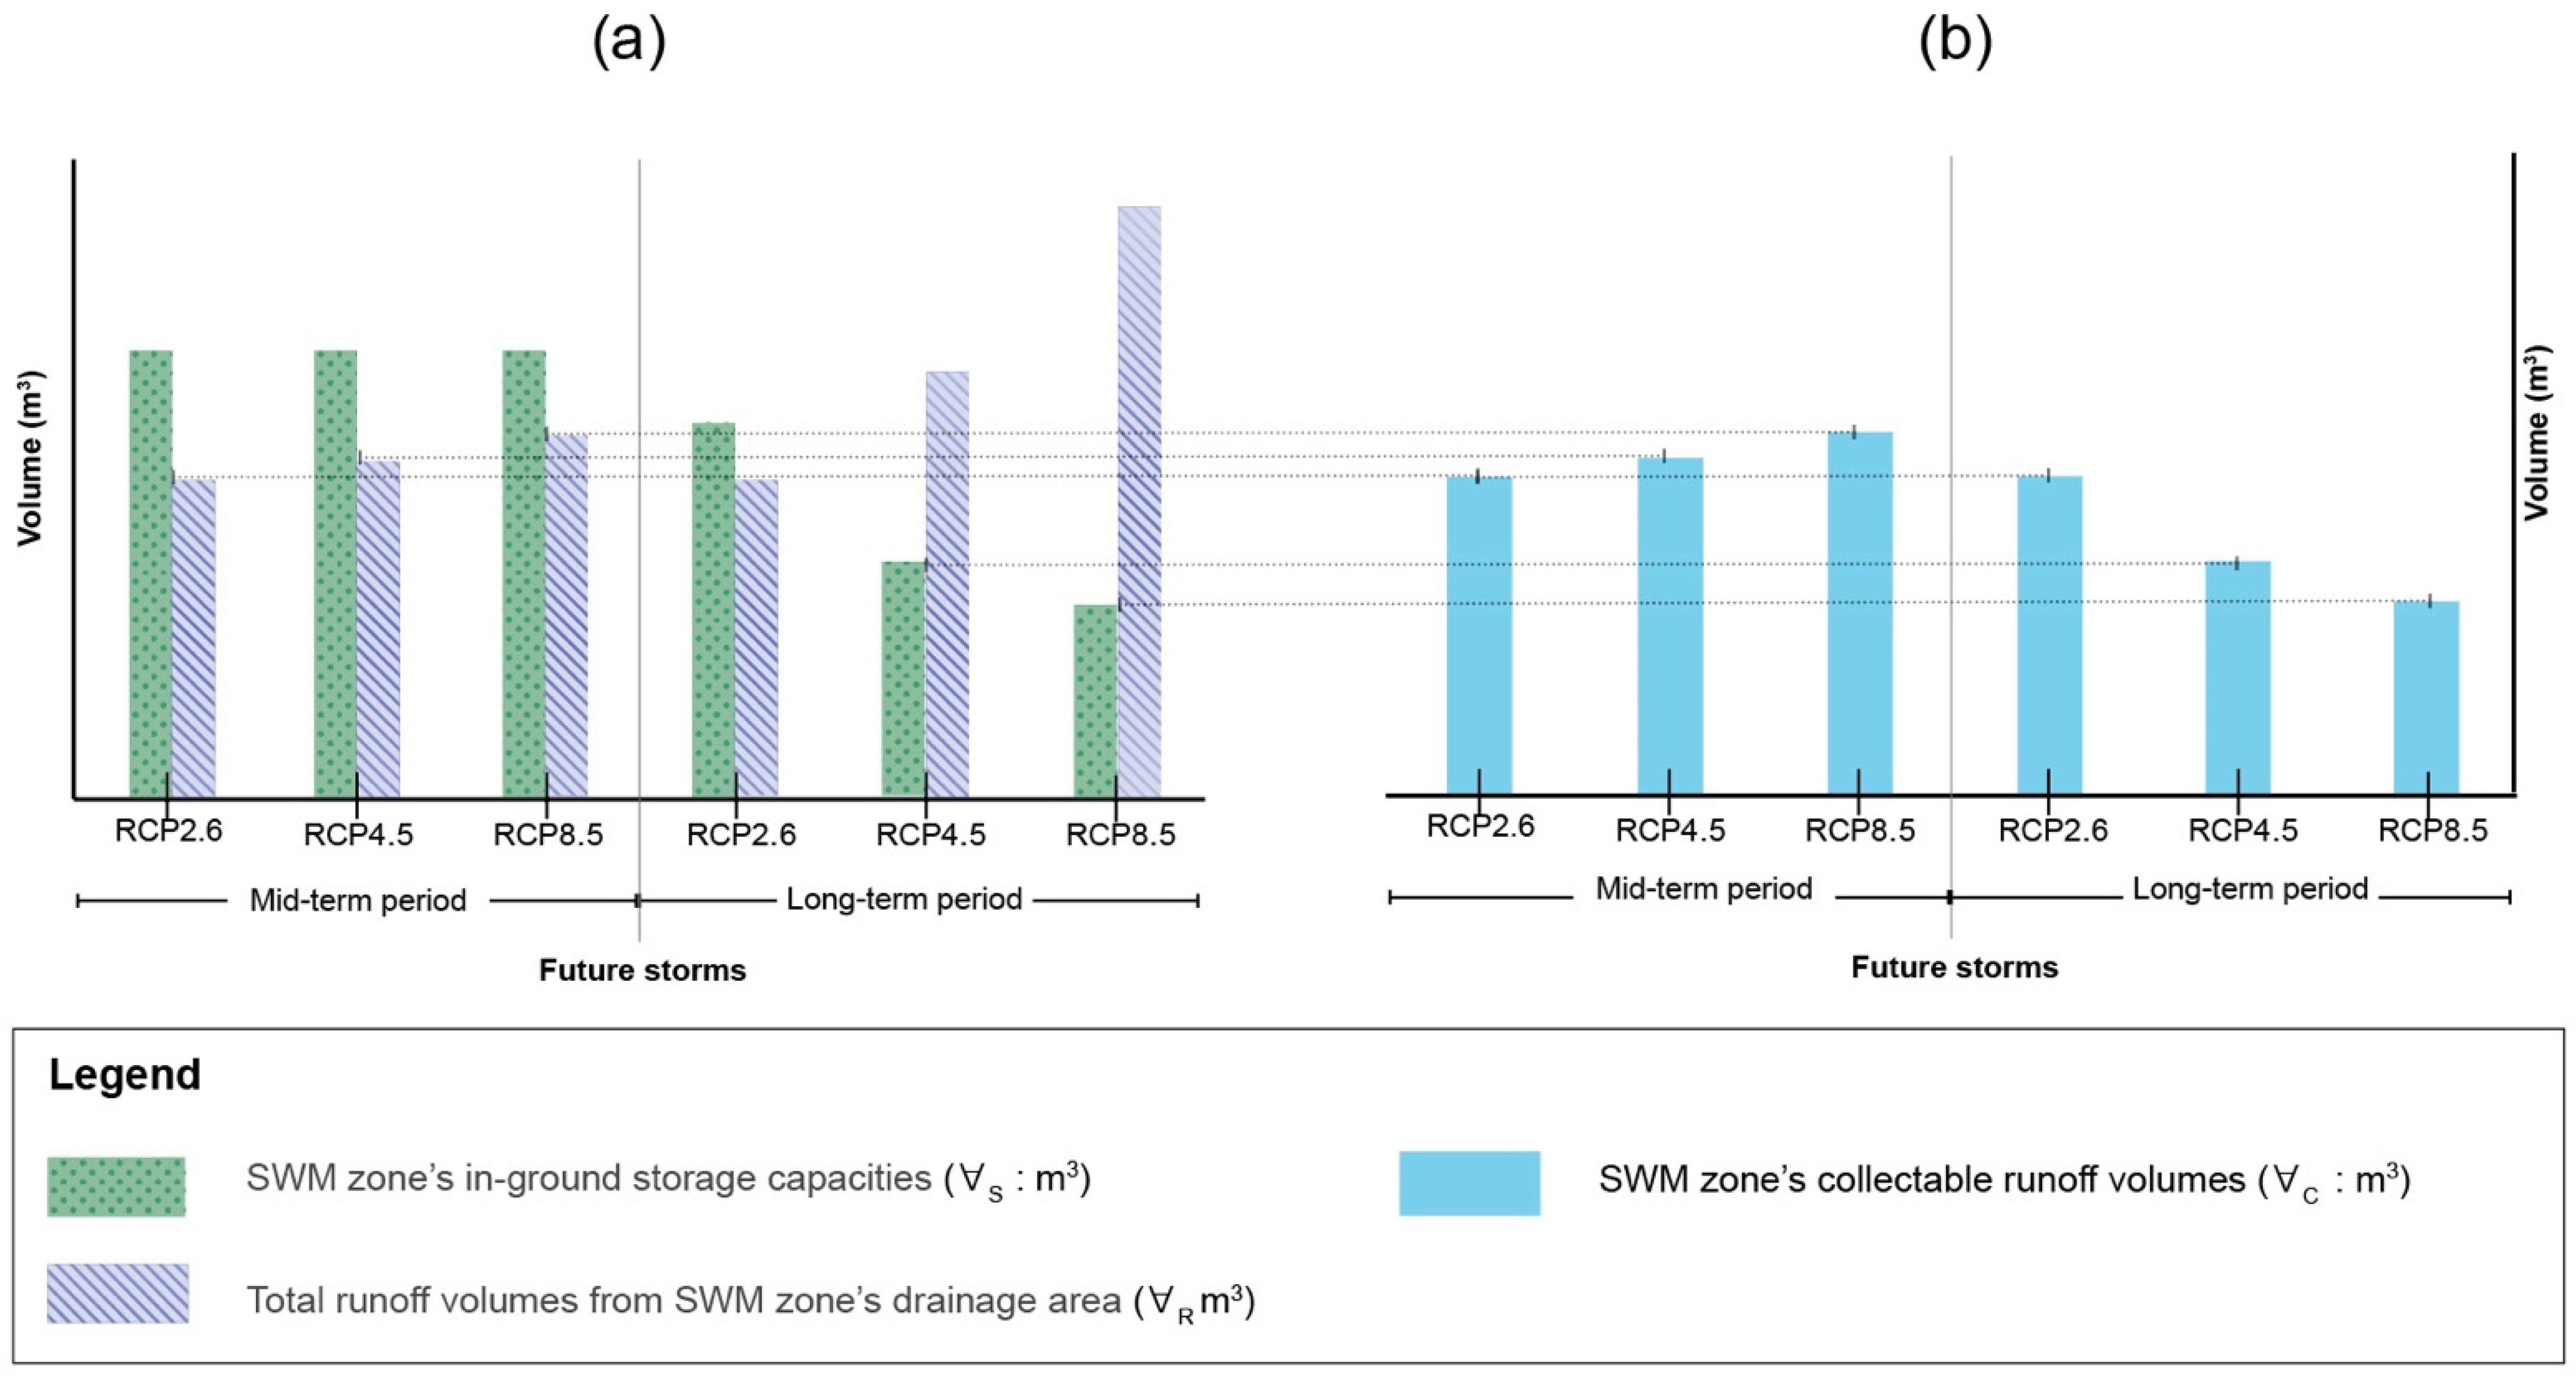
2.2. Step 2: Quantify Collectable Runoff Volumes within Each SWM Zone

This step assesses collectable runoff volumes for each SWM zone under different climate change scenarios. The assessment is divided into the mid-term (the next 30–50 years) and long-term (the next 80–100 years). According to the IPCC WGII report, e.g., [38], we assume the mid-term as 2041–2060 and the long-term as 2081–2100.
The longer the timeframe, the greater the uncertainty with respect to climate change. Given this, alternative climate change scenarios need to be assessed to evaluate the FMC of zones to develop adaptation flood mitigation plans [27]. Three climate change scenarios (referred to as Representative Concentration Pathways (RCP) by the IPCC) are considered. The RCP2.6 assumes a minor climate change scenario, with global temperature unlikely to increase more than 1.5 °C. RCP8.5 is a major climate change scenario, assuming temperatures will increase up to 4 °C by the end of the 21st century. Between these two extremes is the RCP4.5, the moderate climate change scenario, with temperatures assumed to increase between 1.5 °C and 2 °C by this time [39]. The RCP4.5 is selected as the moderate scenario as it represents a cost-minimising scenario involving effective climate policy implementation [40].
Three sub-steps determine each SWM zone’s collectable runoff volumes under different scenarios in the mid-term and long-term. Sub-step 2.1 calculates runoff volumes from the entire zone’s drainage area flowing through its common outlet during a design storm. Sub-step 2.2 estimates potential in-ground storage capacities in each zone, and sub-step 2.3 quantifies collectable runoff volumes for each zone.

2.2.1. Sub-Step 2.1: Calculation of Runoff Volumes

This sub-step requires hydrological modelling to calculate the maximum runoff volumes of a design storm from the SWM zone’s drainage area. The design storm is determined by the storm return period at a specific duration for which a city’s primary flood protection system is designed (e.g., a 100-year, 24-h design storm). To maintain flood protection objectives under the increased impacts of climate change, SWM zones should be able to retain climate change-induced increased runoff volumes at least equivalent to the critical duration of the design storm-unless local regulations require other durations. In terms of projecting increased rainfall intensities for this design storm in the future, rainfall scaling based on the Clausius–Clapeyron relationship of a ∼7% increase in rainfall per 1 °C of warming can be used for convenience [41]. However, we recommend users retrieve this information from responsible local authorities, as different storm frequencies, time horizons, and storm durations can yield different rates of increases in rainfall intensity [5].
Users should choose a method for calculating runoff that best meets their circumstances, as many are available. The more accurate, the greater the confidence in decision-making [26]. However, users should be aware that more accurate methods often require more sophisticated software/hardware, higher user skill levels, more data inputs, and longer periods for calculating runoff [42].

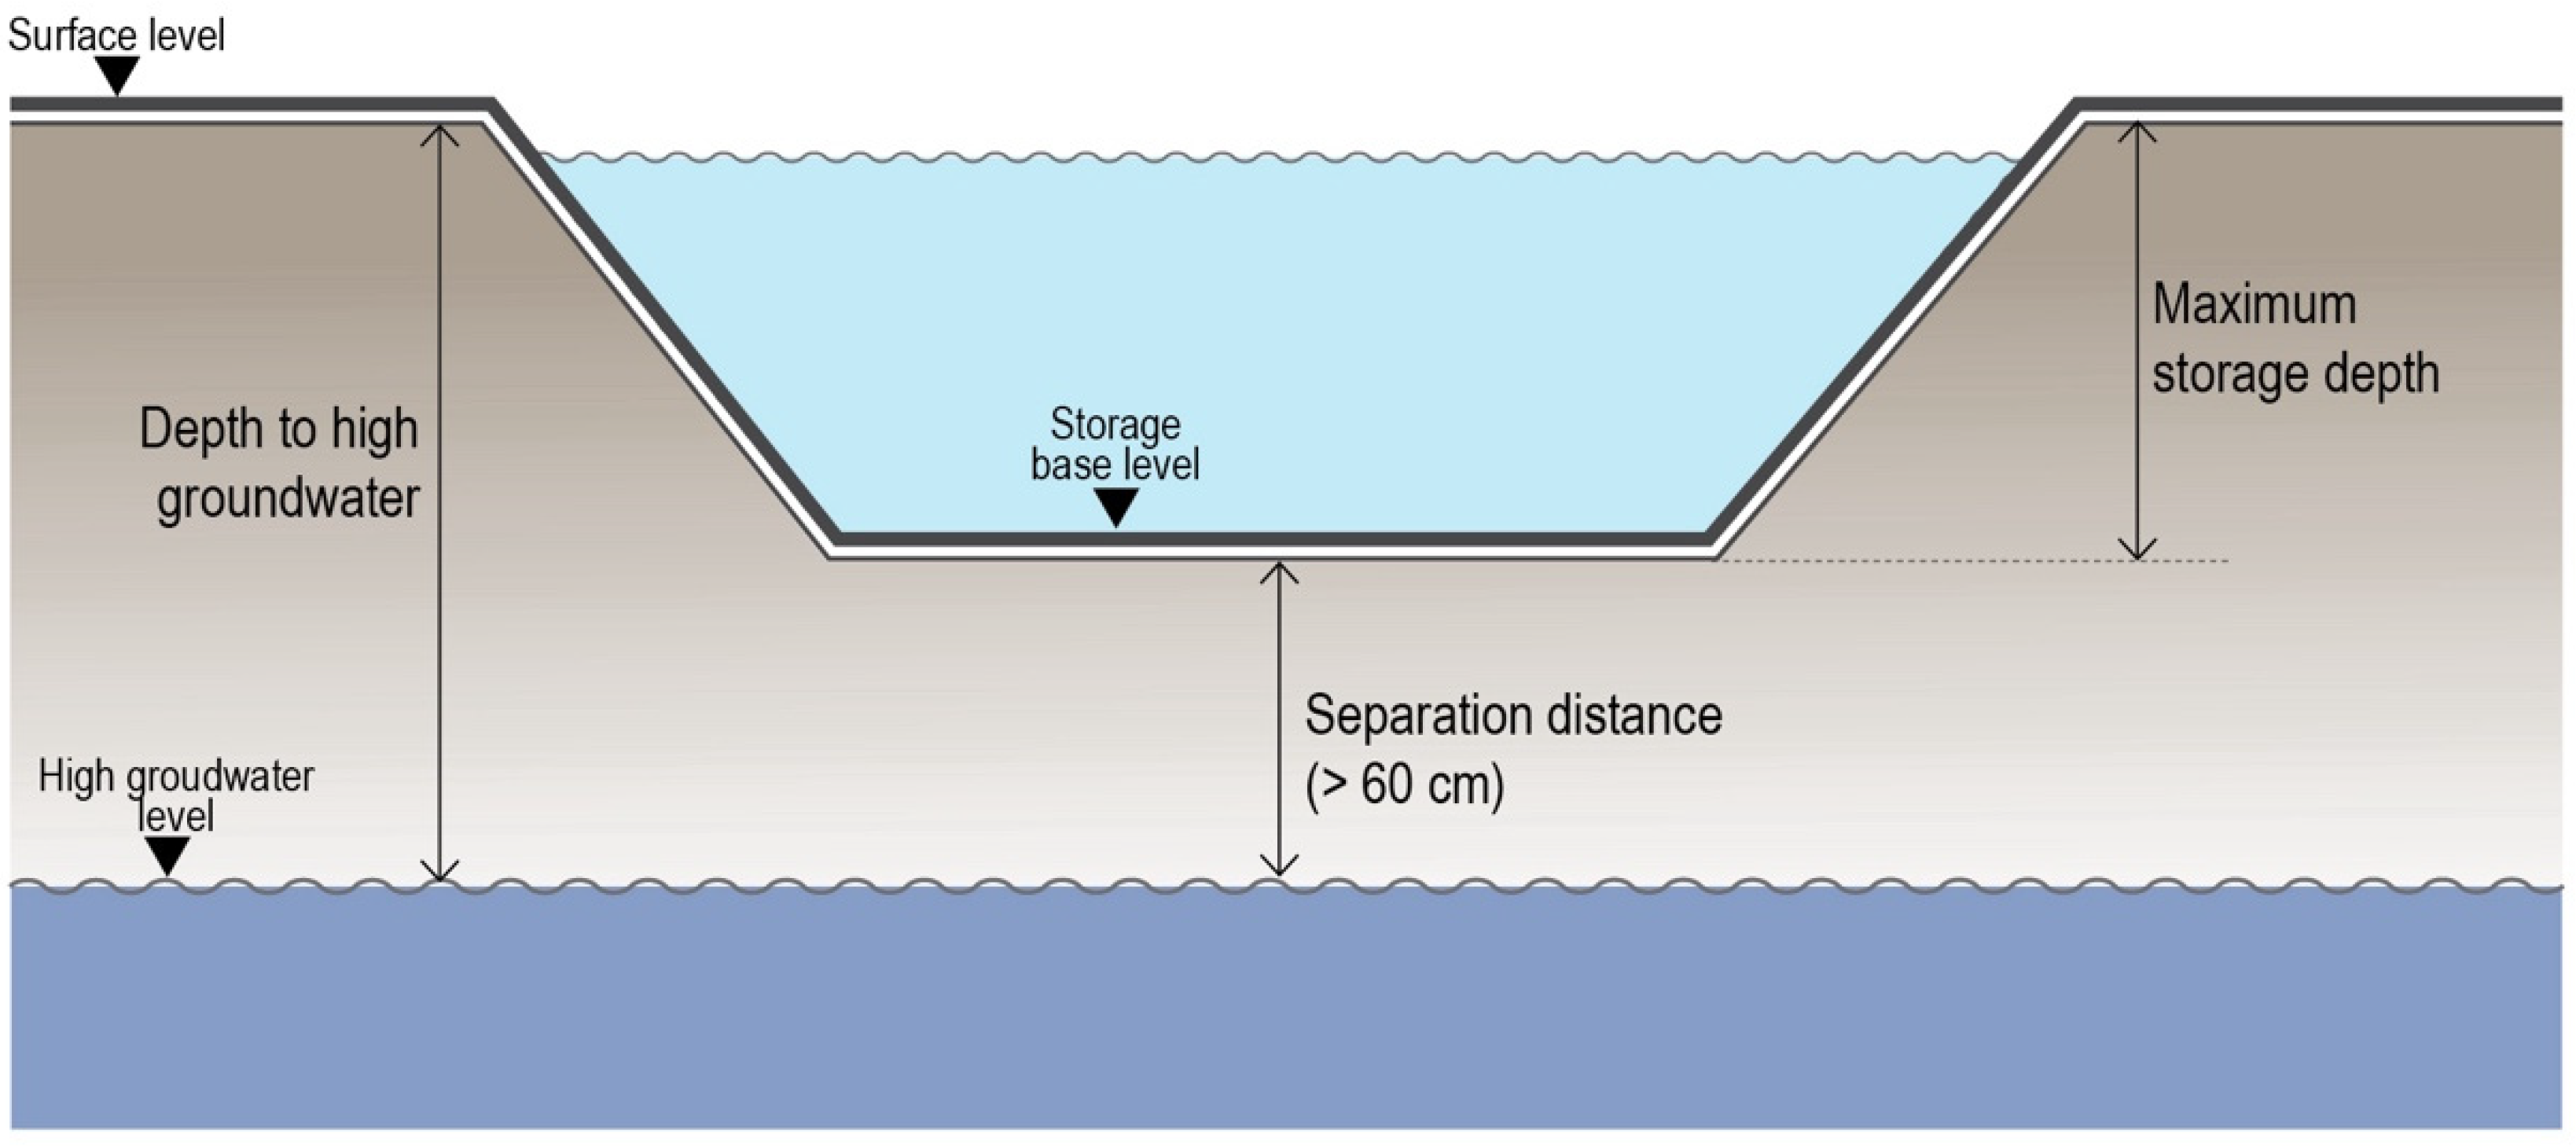
2.2.2. Sub-Step 2.2: Estimation of Potential in-Ground Storage Capacities

Maximum in-ground storage capacities for SWM zones are estimated from measurements of potential GSI areas and maximum in-ground storage depths associated with the high groundwater level. Potential GSI areas are defined as areas within a SWM zone that have the potential to accommodate GSI. Our definition is based on Omitaomu, Kotikot and Parish [36]. They include all land areas on the property except those containing water bodies, buildings, and core grey infrastructure (e.g., roads, railways, and gas pipelines), shallow impermeable bedrock, and steep slopes. Areas of impermeable soil are considered areas of potential GSI as they have the capability of storing water (although not infiltrating it). Similarly, areas with shallow water tables are potential GSI areas, although they may have less capability of storing water than areas with deeper water tables. The maximum storage depth is determined by the high groundwater level plus a separation distance between the base of the facility and the high groundwater level (Figure 3). If the historic records of groundwater levels are not available, users might need to simulate the high groundwater level using simulation modelling such as MIKE SHE or MODFLOW [43,44]. According to empirical evidence, the metals and/or hydrocarbons are likely to be accumulated within 10–30 cm deep below the base of GSI facilities [45,46]. However, many GSI design guidelines [e.g., [47]], generally recommend having a minimum separation distance of 60 cm to minimise the risk that contaminants will recharge into groundwater. The separation distance could be greater than 60 cm, where the water quality of shallow groundwater is a primary concern in local communities. While in-ground storage could be as deep as the high groundwater level minus the separation distance, it is typically limited to four metres, according to Blick et al. [48], as storing water over a long time at deeper depths could cause water quality degradation [49].
The high groundwater levels will increase with rising sea levels due to climate change [8]. Many authors assume groundwater levels will rise relative to sea levels for ease of modelling [50,51]; however, users should be aware that adopting such an assumption may lead to inaccuracies. When further precision is needed, it is recommended that users use MODFLOW modelling to anticipate increases in the groundwater table under different climate change scenarios [8]. Rising groundwater levels will reduce the maximum storage depth [50,51]. The maximum storage depths, therefore, need to be adjusted based on projections of sea-level rise under different climate change scenarios in both the mid-term and long-term periods. Predictions of global mean sea-level rise can be used for convenience. However, rising sea levels can vary from place to place [52]. To improve accuracy, levels should be justified based on the historic rate of rising local sea levels compared to the global rate [53]. To reduce the level of uncertainty in predictions, the upper values should be assumed in estimations.
For any SWM zone having a wide range of depths to groundwater, the zone should be divided into different groundwater areas (GW areas) to quantify their potential in-ground storage capacity. GW areas can be categorised into five ranges of high groundwater levels: 0–1 m, >1–2 m, >2–3 m, >3–4 m, and greater than 4 m. Figure 4 shows how a SWM zone (in this case, zone 1A shown in Figure 2) is divided into three different GW areas, ranging from 2 m to 6 m below the surface.
In-ground storage capacities are calculated by multiplying the potential GSI area within each GW area (AGW) by the average maximum storage depth (DGW) for both periods under each climate change scenario. Their storage capacities are then added together to arrive at the storage capacity for the SWM zone, using this equation:
S = G W = 1 k ( A G W D G W   M a x ) + ( A G W D G W   M i n ) 2
where S is the zone’s in-ground storage capacity for any climate change scenario in each period (m3), A G W is the potential GSI area within each GW area (m2), D G W is the maximum storage depth for each GW area under a particular scenario and period (m), and k is the number of GW areas in the SWM zone.

2.2.3. Sub-Step 2.3: Quantification of Maximum Collectable Runoff Volume

The collectable runoff volume of a SWM zone ( C   ) is quantified based on the assumption there is no water stored in in-ground storage prior to storm events; therefore, a total estimated storage capacity is available for collecting runoff. The collectable runoff volume is equal to the total amount of runoff from a zone drainage area ( R ) if its potential in-ground storage capacity ( S ) is not reached. However, if the total runoff volume from a drainage area exceeds the storage capacity, the surplus ( R S ) is assumed to discharge into the primary drainage system. Thus, the collectable runoff volume is equal to:
C = R ,   i f R < S o r   C = S   ,   i f R > S
where C is the zone’s collectable runoff volume during the critical duration under any climate change scenario of each period (m3), S is the zone’s potential in-ground storage capacity (m3), and R is the runoff volume of a design storm generated in any drainage area of a particular outlet during the critical storm duration (m3).
Figure 5a shows total runoff volumes from the drainage area and the potential in-ground storage capacities of Zone 1A from Figure 4 under different climate change scenarios for the mid-term and long-term. Its in-ground storage capacity is adequate to store total runoff volumes from the drainage area during the mid-term period under any climate change scenario (Figure 5a). Therefore, collectable runoff volume is equal to the total runoff volume (Figure 5b). However, the storage capacity will decrease in the long-term period depending on the climate change scenario. Although the total runoff volume can be held in the zone under a minor climate change scenario (RCP2.6), it will exceed the zone’s storage capacity under the moderate and major climate change scenarios (Figure 5a). The zone’s storage capacity will determine collectable runoff volumes under these scenarios (Figure 5b).

2.3. Step 3: Evaluate SWM Zone Flood Mitigation Capability (FMC)

After calculating the SWM zones’ collectable runoff volumes, the maximum FMC of each zone is evaluated under different climate change scenarios and periods. This is done by comparing the zone’s collectable runoff volumes ( C ; see   Step   2 ) with the amounts of catchment runoff reduction required to maintain flood protection objectives under climate change. The required catchment runoff volume reductions ( C R ) are calculated by subtracting the amount of current flood protection capacity from the future catchment runoff volumes corresponding to each scenario and future period without GSI implementation (Figure 6a). The current flood protection capacity is defined as the current catchment runoff volume of the design storm during the critical storm duration without GSI implementation. Thus, it can be assumed that no flooding occurs at the point of interest if increased catchment runoff volumes in the future are reduced to below the maximum catchment runoff volume for which the current flood protection is designed. The future catchment runoff volume should be calculated by the same hydrological modelling used for calculating runoff volume from each SWM zone’s drainage area. The results of the evaluation can indicate the proportion of collectable runoff volume needed to mitigate flooding under different climate change scenarios and how much GSI should be implemented in the catchment to offset those impacts and maintain flood protection objectives. Therefore, the FMC value is given as a percentage which can be assessed using this equation:
F M C = 100 C   C R  
where C R is the required catchment runoff volume reduction needed to offset climate change-induced flooding corresponding to different climate change scenarios and periods (m3), and F M C is flood mitigation capability indicating the proportion of the collectable runoff volume required to maintain a flood protection objective (%).
Figure 6b shows the FMC of SWM zone 1A from Figure 4 for mitigating climate change-induced flooding under all selected climate change scenarios in the mid-term and long-term. The graph shows the zone’s FMC in the mid-term is about 200% under all climate change scenarios, meaning only half of its maximum collectable runoff volume is needed to meet the flood protection objective. However, under RCP4.5 and RCP8.5, it does not have sufficient capability to mitigate long-term flooding by itself. Its capability is only 90% under RCP4.5 and 35% under RCP8.5. This indicates that planners need to find other zones, if possible, to store the additional 10% and 65% runoff, respectively, to offset the impacts under these scenarios.

2.4. Step 4: Classify SWM Zones to Identify GSI Implementation Approaches and Priority Zones for Adaptive GSI Network Development

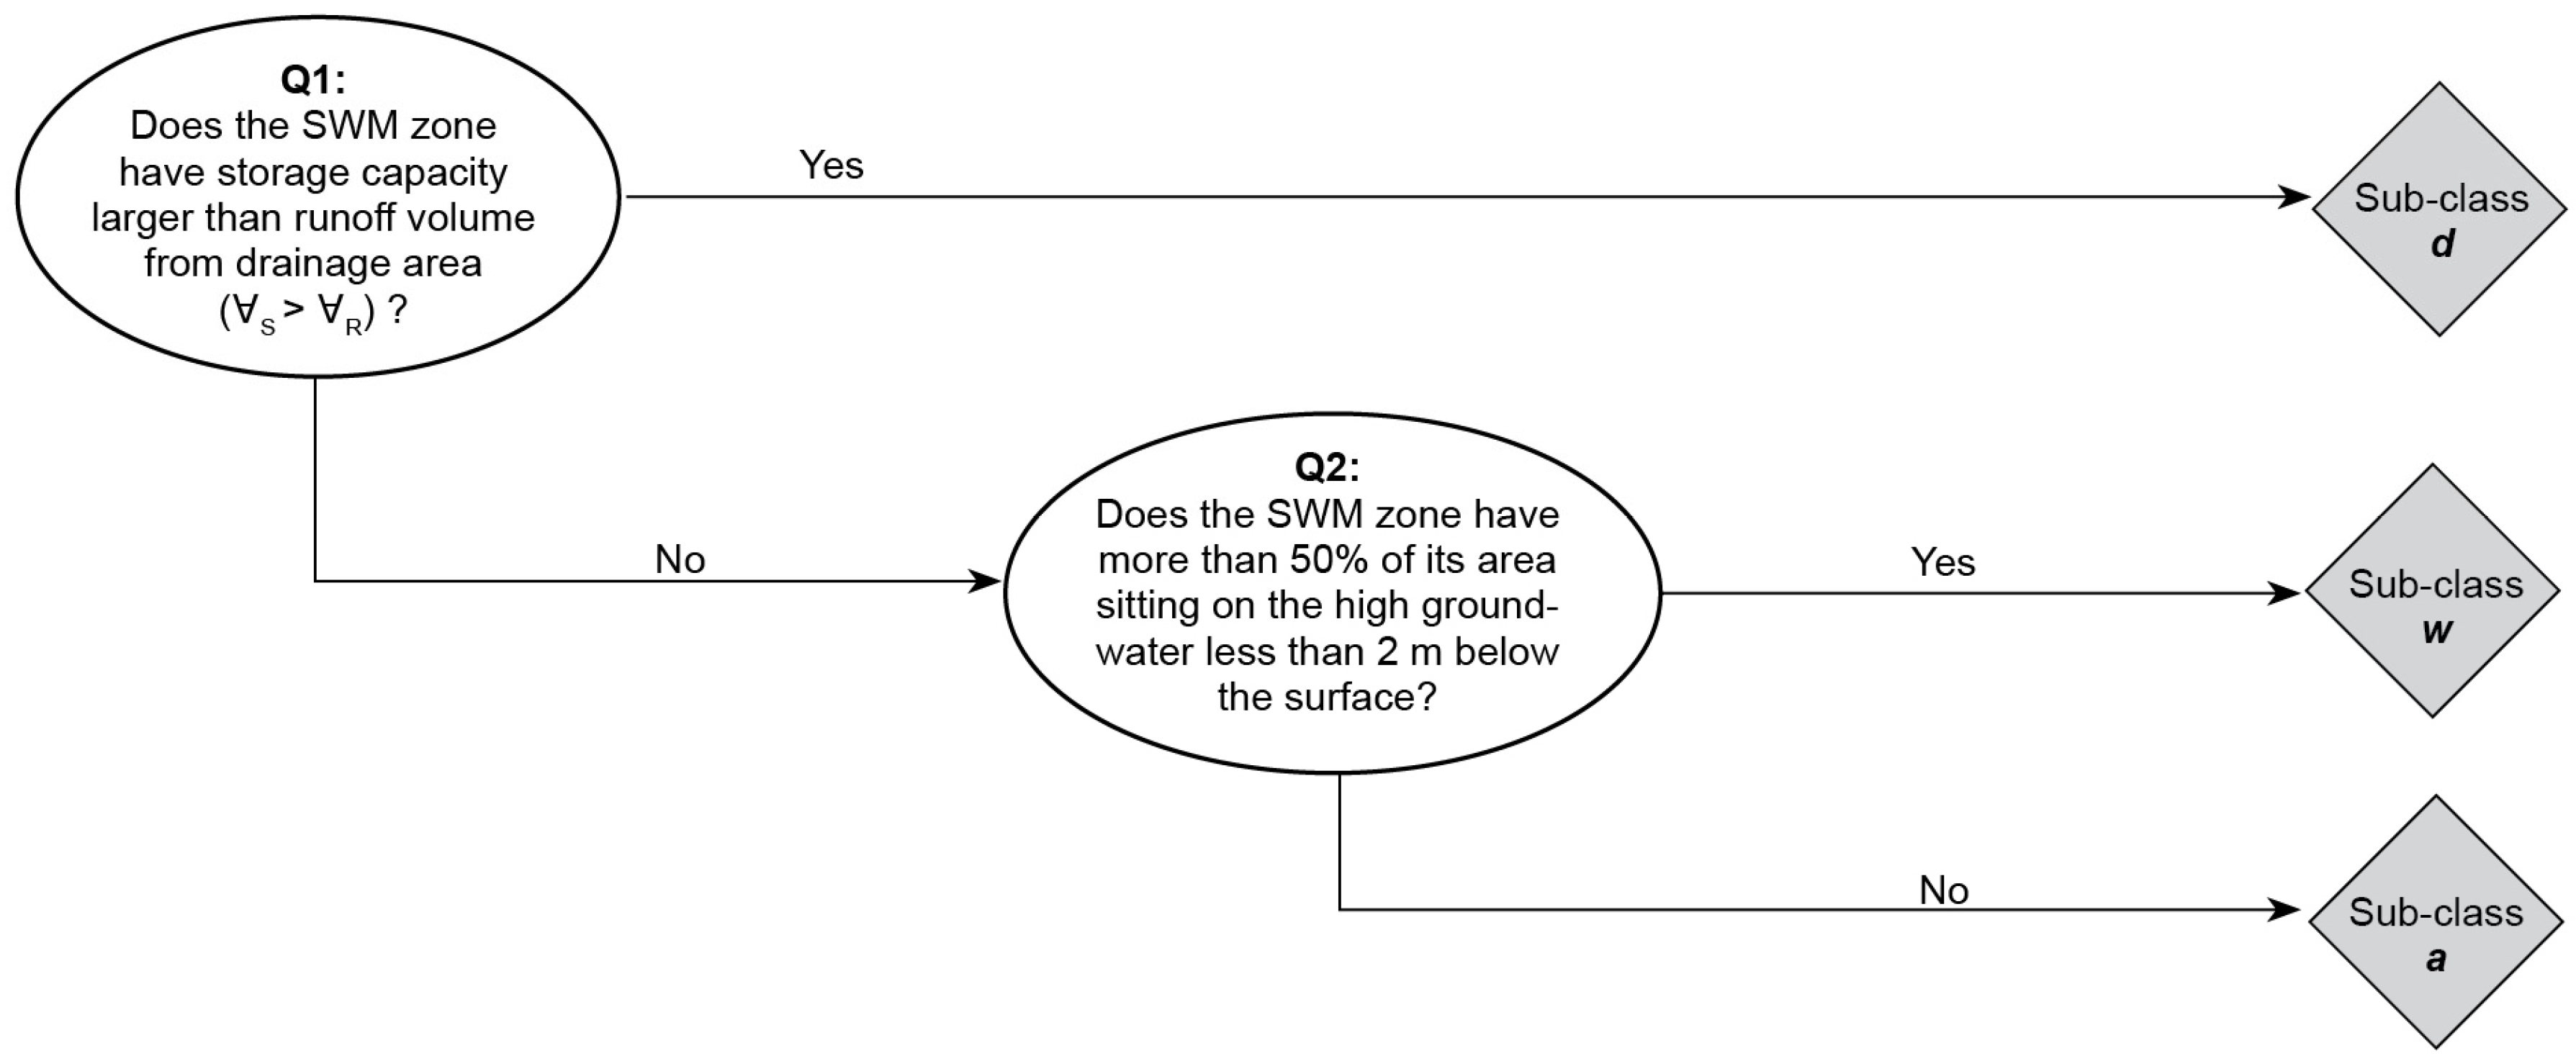
2.4.1. Sub-Step 4.1: Classification of Zones by Their FMCs and Key Limiting Factors

In this step, SWM zones are grouped into classes and sub-classes according to a novel Flood Mitigation Capability (FMC) classification system. The information provided by this classification system helps planners to develop the adaptive implementation of GSI on SWM zones through time. The FMC classification system is like others designed to assist in land use planning. For example, the Land Capability Classification system categorises soils in the landscape based on their capability and limitations for growing crops and pasture [54].
Our system categorises SWM zones into classes according to their level of FMC in the context of climate change. Six FMC classes are defined according to the capability of the zone to mitigate runoff in response to different climate change scenarios. The classes are designed to cover the full range of climate change possibilities in both the mid-term and long-term. Class-I indicates the highest capability level. Zones in this class can mitigate climate change-induced flooding in the long term, assuming a major change in the climate (RCP8.5). From here, the higher class numbers indicate decreasing capabilities with respect to mitigating runoff volume under the different climate change scenarios and time periods. Class-V and Class-VI are not capable of mitigating any climate change-induced flooding to the current flood protection capacity. However, a few zones in Class-V may be able to work together to achieve the same degree of flood mitigation as Class IV.
FMC sub-classes categorise SWM zones within each class by the key factor that limits their FMC. Sub-classes include the size of the drainage area (d), the high groundwater level (w), and the amount of potential GSI area (a). SWM zones are classified into sub-classes according to a decision tree (Figure 7). Total runoff volume from the zone’s drainage area ( R ; the result from Step 2.1) is first compared with the zone’s potential in-ground storage capacity ( S ; the results from Step 2.2) to determine whether the size of the drainage area is the key limiting factor. The comparison is conducted under the major climate change scenario (RCP8.5) in the long-term period. If S is greater than R , it means the size of the drainage area (d) is the key limiting factor. If it is not, the high groundwater level (w) is the key limiting factor when the zone has high groundwater levels shallower than 2 m below the surface. Its capacity will substantially decrease with rising sea levels in the long term and cannot be substantially increased by increasing the potential GSI area. Zones which are not classified into any of the previous sub-classes are limited by the amount of potential GSI area (a).

2.4.2. Sub-Step 4.2: Identification of GSI Implementation Approach and Prioritisation of SWM Zones for GSI Networks

GSI can be implemented on already developed land through three approaches: retrofit, redesign, and relocation. The potential for implementing these approaches within SWM zones depends on their flood mitigation characteristics according to the classification (Figure 8).
A retrofit approach involves implementing GSI without substantially changing the existing land use. GSI is implemented on only the most suitable areas of the potential GSI area (e.g., installing it on a lawn designed for aesthetics or on pavement that is not in use) [32]. It is the cheapest and easiest to implement relative to other approaches as it is the least disruptive to current land uses. It is an appropriate approach when near-term to mid-term flood mitigation is required [55] and where, in the long-term, the maximum zone’s FMC or catchment flood protection objectives can be achieved on portions of the potential GSI zone. For example, GSI on zones classified as class-I can be implemented through retrofits to meet flood protection objectives under any climate change scenario in both mid-term and long-term periods. Similarly, zones in Class-II and III can be retrofitted with GSI to achieve a mid-term flood protection objective under any climate change scenario. In addition, any zone in a class lower than Class-III, that is limited by the size of its drainage area (i.e., those in sub-class d), can also achieve its maximum FMC through this approach. Because these zones have excess in-ground storage capacity, their FMCs could be further enhanced beyond the estimated capability if they are designed to store stormwater transferred from an adjacent zone. This is referred to as a retrofit and transfer approach to implementation.
Implementing GSI through a redesign approach involves a substantial change to the existing land use to optimise GSI performance [56]. To achieve the maximum FMC or flood protection objectives, the entire potential GSI area may be required for GSI implementation. This may include potential GSI areas considered less suitable by landowners. Redesigning the site plan of a SWM zone, such as reducing building footprints, and integrating common spaces into central infrastructures, is needed to optimise the amount of highly suitable area for GSI. Implementing this approach may become practical in the mid-term to long term [57] when further flood mitigation is needed, beyond that provided by minor retrofits, or where urban renewal is planned [58,59]. For example, this approach would be attractive in zones categorised as Sub-class a (except those of Class-I), where the entire potential GSI area would be needed to provide flood mitigation in the long term.
Finally, a relocation approach involves removing the existing buildings and all infrastructure and moving the land use elsewhere. This may be needed in the longer term on properties having characteristics that make them vulnerable to flooding [56,60,61], e.g., high water tables, low elevations, or adjacent to a river or the sea [62]. It might be particularly attractive for zones classified as Sub-class w, except those of Class-I, that have shallow water tables and are prone to flooding, especially under a major climate change scenario.
The relative attractiveness of these implementation approaches for different classes through time suggests that in the near-term to mid-term, planners should prioritise the most capable zones or Sub-class d zones for adaptive GSI networks using a retrofit approach. However, if there are no SWM zones with flood mitigation characteristics supporting a retrofit approach, retrofitting Sub-class a or w zones would be needed to provide sufficient FMC during this period. Additionally, in the mid-term to long-term, adaptive networks should maximise the FMC of zones where this can be done through a redesign or relocation approach to provide additional flood mitigation. These two latter approaches may be particularly attractive in areas where the redesign or relocation of the property would allow for urban renewal [59], or solve other problems, like land contamination [58], or where flooding cannot be mitigated [62].

3. Discussion and Conclusions

The purpose of this study was to develop an improved spatially explicit methodology for land use planners to use for developing GSI on large already developed properties in flood-prone urban environments. The methodology evaluates and classifies the FMC of large properties in a catchment under different climate change scenarios for long-term adaptation planning of coastal city flood mitigation. While there are other types of methodologies for assessing FMC in catchments, including those that are hydrology-based, MCA-based, and GIS-based, none meets all three methodological criteria needed for effective flood mitigation planning: to identify the FMC of a property to reduce catchment runoff volumes [25,26], to determine changes in FMC on properties with climate change [26,27,28], and to compare their FMC based on their specific biophysical characteristics [25,26,27,28]. The HLCA+C methodology is designed to meet all three.
FMC assessment within the methodology uses the proportion of a zone’s collectable runoff volume compared with the amount of catchment runoff volume reduction required for flood mitigation as a unit of measurement. This unit is useful for measuring the effect of GSI on a particular zone at the catchment scale. It determines the area within the zone and the number of zones needed to maintain a current flood protection objective under each climate change scenario through time. This critical information allows planners to develop adaptation networks and pathways for utilising GSI on large properties for supplemental coastal city flood mitigation. Although hydrology-based methodologies use the percentage reduction in catchment runoff volume to measure the effectiveness of GSI implementation [19], they do not allow a comparison of the amount needed to mitigate degrees of climate change impacts with the current level. The output from the hydrology-based methodologies is, therefore, not sufficiently informative for adaptive flood mitigation planning.
The HLCA+C methodology allows FMC assessment over the long term, while several hydrology-based methodologies [17,18,19,28,29] are limited to the mid-term (from 2030 to 2070). This latter timeframe is only sufficient for evaluating the effectiveness of GSI if it is implemented in the immediate term [28]. The outputs of the HLCA+C methodology assist planners not only in determining what supplemental flood mitigation measures will be needed in the immediate future, but also the more distant future, under different climate conditions. A long-term assessment assists planners in understanding the future FMC and the key limitation of each SWM zone which may not be apparent in near and mid-term periods. This point of view helps planners to avoid having to make flood mitigation decisions that risk impeding future flood mitigation measures that may be required under changing climate conditions [63]. The longer the planning timeframe, the greater level of uncertainty around predictions of increased rainfall intensities and rising sea levels, and the more an adaptive approach is needed [2]. A wide range of climate change scenarios, therefore, need to be considered in the land evaluation for supplemental flood mitigation [27,64]. To minimise the level of uncertainty involving future climate predictions, users should consider selecting the upper values associated with major climate change projections as data inputs for assessment to minimise the risk of overestimating a zone’s FMC [65].
Using a land unit approach, the interdependent variables of hydrological modelling of runoff and geographic information indicating the ability of the land to collect the runoff can be assessed to determine the FMC of each SWM zone [66]. GIS-based methodologies that use an interactive approach or overlay mapping technique, such as those of Kuller, Bach, Roberts, Browne and Deletic [34] and Omitaomu, Kotikot and Parish [36], are only compatible with independent variables [66]. These methodologies are designed to handle only variables associated with geographical factors to determine the capability of the land for holding water and do not consider how much water can be intercepted by the land. Furthermore, the hydrology-based methodologies, such as those of Dudula and Randhir [17] and Zahmatkesh, Burian, Karamouz, Tavakol-Davani and Goharian [19], evaluate GSI effectiveness by determining the extent to which runoff over particular areas can be disconnected from the primary drainage system. Biophysical and built-environmental factors are not considered to ensure total runoff volumes can be intercepted.
The proposed FMC classification system is applicable to other low-lying coastal cities without reliance on personal judgement to define what level of catchment runoff reduction has significance for flood management planning. This system translates the technical results of hydrological modelling into narrative descriptions of FMC, which clearly communicate their implications for flood management planning. The identification of key limiting factors helps planners identify options for GSI implementation through time. Furthermore, the system provides a common language by which environmental planners can communicate to hydrologists, and other disciplines, about flood mitigation alternatives with climate change, in a brief and concise manner.
Finally, the outputs of our methodology can be used by planners to develop an adaptive GSI network which can be implemented on SWM zones incrementally with increasing severity of climate change over time. The methodology is compatible with an adaptation pathways approach to planning [14], which is recognised internationally as essential when there is a high level of uncertainty, like under climate change [13,56]. This methodology was successfully applied, in an adaptation pathways approach, to develop an effective adaptive flood mitigation strategy through time for a flood-prone catchment in Christchurch, New Zealand [67].

Limitations of the HLCA+C Methodology

The HLCA+C methodology is designed to evaluate large properties that are identified as having the potential to provide substantial flood mitigation. It cannot be used to evaluate all properties in a catchment. This is because a drainage area cannot be delineated without defining a zone boundary and outlet. Therefore, the HLCA+C methodology can only be used after promising large properties are identified. An initial scoping study is needed to identify such properties prior to conducting this methodology.
The methodology only focuses on the evaluation of the maximum flood mitigation potential of each SWM zone. As such, it evaluates GSI potential from the point of a flood management planner. It does not evaluate GSI from the landowner or community’s point of view. For example, it does not evaluate the costs, benefits, or attitudes and behaviours of landowners regarding GSI, or those of the surrounding community. Further research is needed to determine a methodology for evaluating these important concerns, and the enablers and barriers to GSI implementation. This will be essential for developing effective policies and programmes for encouraging GSI on large private and public properties. The HLCA+C methodology conducts the FMC assessment at the catchment scale and only considers the potential of area to store runoff. However, the cost of construction and reduction in storage capacities related to preventing the adverse impacts of GSI need to be assessed at the site scale. Site-specific designs are needed, in particular, to design GSI for sensitive places, like areas vulnerable to surface water contamination or damage to existing structures [47]. If a retrofit approach is chosen to implement GSI, the MCA-based methodologies would be needed following the use of the HLCA+C methodology to identify suitable areas for GSI within a SWM zone and appropriate GSI facilities.
This methodology assesses the potential of GSI to supplement the primary flood mitigation system according to an agreed flood protection objective. Therefore, a single storm probability and duration are used for the FMC assessment in this methodology. Users are responsible for determining the critical storm event for the evaluation. The outputs from this methodology cannot be used to determine the actual effectiveness of GSI in flood mitigation. A hydrology-based methodology is needed to evaluate GSI performance under different rainfall patterns.
This methodology estimates GSI storage capacities based on the assumption that the in-ground storage is above high groundwater levels. However, if the GSI is excavated below the groundwater level to enhance the storage capacity, a site survey will be needed to determine the lowest groundwater level. This will ensure the presence of stored water throughout the year to avoid the risk of groundwater contamination.

Author Contributions

Conceptualisation, S.M. and W.M.; methodology, S.M. and T.D.; formal analysis, S.M.; investigation, S.M.; writing—original draft preparation, S.M.; writing—review and editing, W.M., G.L. and T.D.; visualisation, S.M. All authors have read and agreed to the published version of the manuscript.

Funding

This research was partially funded by the Waterways Centre for Freshwater Management.

Acknowledgments

The authors are grateful to Steve C Urlich for his helpful suggestions for improving this manuscript.

Conflicts of Interest

The authors declare no conflict of interest.

References

  1. Dedekorkut-Howes, A.; Torabi, E.; Howes, M. When the tide gets high: A review of adaptive responses to sea level rise and coastal flooding. J. Environ. Plan. Manag. 2020, 63, 2102–2143. [Google Scholar] [CrossRef]
  2. Yousefpour, R.; Hanewinkel, M. Climate change and decision-making under uncertainty. Curr. For. Rep. 2016, 2, 143–149. [Google Scholar] [CrossRef] [Green Version]
  3. Terry, J.P.; Winspear, N.; Goff, J. Is Bangkok at risk of marine flooding? Evidence relating to the historical floods of AD 1785 and 1983. Nat. Hazards 2021, 105, 1013–1030. [Google Scholar] [CrossRef]
  4. Adnan, M.S.G.; Abdullah, A.Y.M.; Dewan, A.; Hall, J.W. The effects of changing land use and flood hazard on poverty in coastal Bangladesh. Land Use Policy 2020, 99, 104868. [Google Scholar] [CrossRef]
  5. Martel, J.-L.; Brissette, F.P.; Lucas-Picher, P.; Troin, M.; Arsenault, R. Climate Change and Rainfall Intensity-Duration-Frequency Curves: Overview of Science and Guidelines for Adaptation. J. Hydrol. Eng. 2021, 26, 03121001. [Google Scholar] [CrossRef]
  6. Vitousek, S.; Barnard, P.L.; Fletcher, C.H.; Frazer, N.; Erikson, L.; Storlazzi, C.D. Doubling of coastal flooding frequency within decades due to sea-level rise. Sci. Rep. 2017, 7, 1399. [Google Scholar] [CrossRef] [Green Version]
  7. Davtalab, R.; Mirchi, A.; Harris, R.J.; Troilo, M.X.; Madani, K. Sea level rise effect on groundwater rise and stormwater retention pond reliability. Water 2020, 12, 1129. [Google Scholar] [CrossRef] [Green Version]
  8. Befus, K.M.; Barnard, P.L.; Hoover, D.J.; Finzi Hart, J.A.; Voss, C.I. Increasing threat of coastal groundwater hazards from sea-level rise in California. Nat. Clim. Chang. 2020, 10, 946–952. [Google Scholar] [CrossRef]
  9. Bagheri-Gavkosh, M.; Hosseini, S.M.; Ataie-Ashtiani, B.; Sohani, Y.; Ebrahimian, H.; Morovat, F.; Ashrafi, S. Land subsidence: A global challenge. Sci. Total Environ. 2021, 778, 146193. [Google Scholar] [CrossRef]
  10. Chan, F.K.S.; Chuah, C.J.; Ziegler, A.D.; Dąbrowski, M.; Varis, O. Towards resilient flood risk management for Asian coastal cities: Lessons learned from Hong Kong and Singapore. J. Clean. Prod. 2018, 187, 576–589. [Google Scholar] [CrossRef]
  11. Brown, S.; Jenkins, K.; Goodwin, P.; Lincke, D.; Vafeidis, A.T.; Tol, R.S.J.; Jenkins, R.; Warren, R.; Nicholls, R.J.; Jevrejeva, S.; et al. Global costs of protecting against sea-level rise at 1.5 to 4.0 °C. Clim. Chang. 2021, 167, 4. [Google Scholar] [CrossRef]
  12. Radhakrishnan, M.; Pathirana, A.; Ashley, R.M.; Gersonius, B.; Zevenbergen, C. Flexible adaptation planning for water sensitive cities. Cities 2018, 78, 87–95. [Google Scholar] [CrossRef]
  13. Lawrence, J.; Stephens, S.; Blackett, P.; Bell, R.G.; Priestley, R. Climate Services Transformed: Decision-Making Practice for the Coast in a Changing Climate. Front. Mar. Sci. 2021, 8, 703902. [Google Scholar] [CrossRef]
  14. Haasnoot, M.; Kwakkel, J.H.; Walker, W.E.; ter Maat, J. Dynamic adaptive policy pathways: A method for crafting robust decisions for a deeply uncertain world. Glob. Environ. Chang. 2013, 23, 485–498. [Google Scholar] [CrossRef] [Green Version]
  15. McPhillips, L.E.; Matsler, A.M. Temporal Evolution of Green Stormwater Infrastructure Strategies in Three US Cities. Front. Built Environ. 2018, 4, 26. [Google Scholar] [CrossRef] [Green Version]
  16. Zahmatkesh, Z.; Karamouz, M. An uncertainty-based framework to quantifying climate change impacts on coastal flood vulnerability: Case study of New York City. Environ. Monit. Assess. 2017, 189, 567. [Google Scholar] [CrossRef]
  17. Dudula, J.; Randhir, T.O. Modeling the influence of climate change on watershed systems: Adaptation through targeted practices. J. Hydrol. 2016, 541, 703–713. [Google Scholar] [CrossRef] [Green Version]
  18. Kim, H.; Jung, M.; Mallari, K.J.B.; Pak, G.; Kim, S.; Kim, S.; Kim, L.; Yoon, J. Assessment of porous pavement effectiveness on runoff reduction under climate change scenarios. Desalination Water Treat. 2015, 53, 3142–3147. [Google Scholar] [CrossRef]
  19. Zahmatkesh, Z.; Burian, S.J.; Karamouz, M.; Tavakol-Davani, H.; Goharian, E. Low-Impact Development Practices to Mitigate Climate Change Effects on Urban Stormwater Runoff: Case Study of New York City. J. Irrig. Drain. Eng. 2015, 141, 04014043. [Google Scholar] [CrossRef]
  20. Muangsri, S.; McWilliam, W.; Davies, T.; Urlich, S.C. Supplemental Coastal City Flood Mitigation: The Untapped Potential of Retrofitting Industrial Land with Green Stormwater Infrastructure; Lincoln University: Lincoln, New Zealand, 2022; manuscript to be submitted. [Google Scholar]
  21. O’Donnell, E.C.; Lamond, J.E.; Thorne, C.R. Recognising barriers to implementation of Blue-Green Infrastructure: A Newcastle case study. Urban Water J. 2017, 14, 964–971. [Google Scholar] [CrossRef]
  22. Fluhrer, T.; Chapa, F.; Hack, J. A Methodology for Assessing the Implementation Potential for Retrofitted and Multifunctional Urban Green Infrastructure in Public Areas of the Global South. Sustainability 2021, 13, 384. [Google Scholar] [CrossRef]
  23. Aparicio Uribe, C.H.; Bonilla Brenes, R.; Hack, J. Potential of retrofitted urban green infrastructure to reduce runoff—A model implementation with site-specific constraints at neighborhood scale. Urban For. Urban Green. 2022, 69, 127499. [Google Scholar] [CrossRef]
  24. Smith, B.K.; Smith, J.A.; Baeck, M.L.; Miller, A.J. Exploring storage and runoff generation processes for urban flooding through a physically based watershed model. Water Resour. Res. 2015, 51, 1552–1569. [Google Scholar] [CrossRef]
  25. Boon, E.; Goosen, H.; Van Veldhoven, F.; Swart, R. Does transformational adaptation require a transformation of climate services? Front. Clim. 2021, 3, 2. [Google Scholar] [CrossRef]
  26. Golden, H.E.; Hoghooghi, N. Green infrastructure and its catchment-scale effects: An emerging science. WIREs Water 2018, 5, e1254. [Google Scholar] [CrossRef] [Green Version]
  27. Gopalakrishnan, C.; Okada, N. Reflections on Implementation Science. J. Nat. Resour. Policy Res. 2012, 4, 79–88. [Google Scholar] [CrossRef]
  28. Kirshen, P.; Caputo, L.; Vogel, R.M.; Mathisen, P.; Rosner, A.; Renaud, T. Adapting Urban Infrastructure to Climate Change: A Drainage Case Study. J. Water Resour. Plan. Manag. 2015, 141, 04014064. [Google Scholar] [CrossRef] [Green Version]
  29. Joyce, J.; Chang, N.-B.; Harji, R.; Ruppert, T.; Imen, S. Developing a multi-scale modeling system for resilience assessment of green-grey drainage infrastructures under climate change and sea level rise impact. Environ. Model. Softw. 2017, 90, 1–26. [Google Scholar] [CrossRef]
  30. Gao, J.; Wang, R.; Huang, J.; Liu, M. Application of BMP to urban runoff control using SUSTAIN model: Case study in an industrial area. Ecol. Model. 2015, 318, 177–183. [Google Scholar] [CrossRef]
  31. Jayasooriya, V.M.; Muthukumaran, S.; Ng, A.W.M.; Perera, B.J.C. Multi Criteria Decision Making in Selecting Stormwater Management Green Infrastructure for Industrial areas Part 2: A Case Study with TOPSIS. Water Resour. Manag. 2018, 32, 4297–4312. [Google Scholar] [CrossRef]
  32. Voskamp, I.M.; Van de Ven, F.H.M. Planning support system for climate adaptation: Composing effective sets of blue-green measures to reduce urban vulnerability to extreme weather events. Build. Environ. 2015, 83, 159–167. [Google Scholar] [CrossRef]
  33. Bach, P.M.; Kuller, M.; McCarthy, D.T.; Deletic, A. A spatial planning-support system for generating decentralised urban stormwater management schemes. Sci. Total Environ. 2020, 726, 138282. [Google Scholar] [CrossRef] [PubMed]
  34. Kuller, M.; Bach, P.M.; Roberts, S.; Browne, D.; Deletic, A. A planning-support tool for spatial suitability assessment of green urban stormwater infrastructure. Sci. Total Environ. 2019, 686, 856–868. [Google Scholar] [CrossRef] [PubMed]
  35. Li, L.; Uyttenhove, P.; Van Eetvelde, V. Planning green infrastructure to mitigate urban surface water flooding risk—A methodology to identify priority areas applied in the city of Ghent. Landsc. Urban Plan. 2020, 194, 103703. [Google Scholar] [CrossRef]
  36. Omitaomu, O.A.; Kotikot, S.M.; Parish, E.S. Planning green infrastructure placement based on projected precipitation data. J. Environ. Manag. 2021, 279, 111718. [Google Scholar] [CrossRef]
  37. Lyle, J.T. Design for Human Ecosystems: Landscape, Land Use, and Natural Resources; Island Press: Washington, DC, USA, 1999. [Google Scholar]
  38. IPCC. Summary for Policymakers. In Climate Change 2022: Impacts, Adaptation, and Vulnerability. Contribution of Working Group II to the Sixth Assessment Report of the Intergovernmental Panel on Climate Change; Pörtner, H.-O., Roberts, D.C., Poloczanska, E.S., Mintenbeck, K., Tignor, M., Alegría, A., Craig, M., Langsdorf, S., Löschke, S., Möller, V., et al., Eds.; Cambridge University Press: Cambridge, UK, 2022. [Google Scholar]
  39. IPCC. Summary for Policymakers. In Climate Change 2013—The Physical Science Basis: Working Group I Contribution to the Fifth Assessment Report of the Intergovernmental Panel on Climate Change; Intergovernmental Panel on Climate Change, Ed.; Cambridge University Press: Cambridge, UK, 2014; pp. 1–30. [Google Scholar]
  40. Thomson, A.M.; Calvin, K.V.; Smith, S.J.; Kyle, G.P.; Volke, A.; Patel, P.; Delgado-Arias, S.; Bond-Lamberty, B.; Wise, M.A.; Clarke, L.E.; et al. RCP4.5: A pathway for stabilization of radiative forcing by 2100. Clim. Chang. 2011, 109, 77. [Google Scholar] [CrossRef] [Green Version]
  41. Westra, S.; Alexander, L.V.; Zwiers, F.W. Global Increasing Trends in Annual Maximum Daily Precipitation. J. Clim. 2013, 26, 3904–3918. [Google Scholar] [CrossRef] [Green Version]
  42. Paul, P.K.; Zhang, Y.; Ma, N.; Mishra, A.; Panigrahy, N.; Singh, R. Selecting hydrological models for developing countries: Perspective of global, continental, and country scale models over catchment scale models. J. Hydrol. 2021, 600, 126561. [Google Scholar] [CrossRef]
  43. Shu, Y.; Li, H.; Lei, Y. Modelling Groundwater Flow with MIKE SHE Using Conventional Climate Data and Satellite Data as Model Forcing in Haihe Plain, China. Water 2018, 10, 1295. [Google Scholar] [CrossRef] [Green Version]
  44. Behera, A.K.; Pradhan, R.M.; Kumar, S.; Chakrapani, G.J.; Kumar, P. Assessment of Groundwater Flow Dynamics Using MODFLOW in Shallow Aquifer System of Mahanadi Delta (East Coast), India. Water 2022, 14, 611. [Google Scholar] [CrossRef]
  45. Chu, Y.; Yang, L.; Wang, X.; Wang, X.; Zhou, Y. Research on Distribution Characteristics, Influencing Factors, and Maintenance Effects of Heavy Metal Accumulation in Bioretention Systems: Critical Review. J. Sustain. Water Built Environ. 2021, 7, 03120001. [Google Scholar] [CrossRef]
  46. Tedoldi, D.; Chebbo, G.; Pierlot, D.; Kovacs, Y.; Gromaire, M.-C. Impact of runoff infiltration on contaminant accumulation and transport in the soil/filter media of Sustainable Urban Drainage Systems: A literature review. Sci. Total Environ. 2016, 569–570, 904–926. [Google Scholar] [CrossRef] [PubMed]
  47. Slaney, S. Stormwater Management for Sustainable Urban Environments; Images Publishing Group Pty Limited: Mulgrave, Australia, 2017. [Google Scholar]
  48. Blick, S.A.; Kelly, F.; Skupien, J.J.; Friedman, B.; Jacobus, S.; McColligan, G.; Birckhead, H.; Morris, J.; Obropta, C.; Schiariti, P.; et al. New Jersey Stormwater Best Management Practices Manual; New Jersey Department of Environmental Protection: Trenton, NJ, USA, 2004. [Google Scholar]
  49. Northern Virginia Planning District Commission; Engineers Surveyors Institute. Northern Virginia BMP Handbook: A Guide to Planning and Designing Best Management Practices in Northern Virginia; Northern Virginia Planning District Commission: Annandale, VA, USA, 1992. [Google Scholar]
  50. Hoover, D.J.; Odigie, K.O.; Swarzenski, P.W.; Barnard, P. Sea-level rise and coastal groundwater inundation and shoaling at select sites in California, USA. J. Hydrol. Reg. Stud. 2017, 11, 234–249. [Google Scholar] [CrossRef] [Green Version]
  51. Plane, E.; Hill, K.; May, C. A Rapid Assessment Method to Identify Potential Groundwater Flooding Hotspots as Sea Levels Rise in Coastal Cities. Water 2019, 11, 2228. [Google Scholar] [CrossRef] [Green Version]
  52. Kopp, R.E.; Horton, R.M.; Little, C.M.; Mitrovica, J.X.; Oppenheimer, M.; Rasmussen, D.J.; Strauss, B.H.; Tebaldi, C. Probabilistic 21st and 22nd century sea-level projections at a global network of tide-gauge sites. Earth’s Future 2014, 2, 383–406. [Google Scholar] [CrossRef]
  53. Perrette, M.; Landerer, F.; Riva, R.; Frieler, K.; Meinshausen, M. A scaling approach to project regional sea level rise and its uncertainties. Earth Syst. Dynam. 2013, 4, 11–29. [Google Scholar] [CrossRef] [Green Version]
  54. Klingebiel, A.A.; Montgomery, P.H. Land-Capability Classification; Soil Conservation Service, US Department of Agriculture: Washington, DC, USA, 1961. [Google Scholar]
  55. Shafique, M.; Kim, R. Retrofitting the Low Impact Development Practices into Developed Urban areas Including Barriers and Potential Solution. Open Geosci. 2017, 9, 240–254. [Google Scholar] [CrossRef]
  56. Rogers, B.C.; Bertram, N.; Gersonius, B.; Gunn, A.; Löwe, R.; Murphy, C.; Pasman, R.; Radhakrishnan, M.; Urich, C.; Wong, T.H.F.; et al. An interdisciplinary and catchment approach to enhancing urban flood resilience: A Melbourne case. Philos. Trans. R. Soc. A Math. Phys. Eng. Sci. 2020, 378, 20190201. [Google Scholar] [CrossRef]
  57. Rosly, D.; Rashid, A.A. Revitalizing urban development in Malaysia through the implementation of urban regeneration programme. In Proceedings of the 43rd Annual Conference of the Urban Affairs Association, San Francisco, CA, USA, 3–6 April 2013; pp. 1–20. [Google Scholar]
  58. MacGregor, C. Urban regeneration as a public health intervention. J. Soc. Interv. Theory Pract. 2010, 19, 38–51. [Google Scholar] [CrossRef] [Green Version]
  59. Jaroszewska, E. Urban shrinkage and regeneration of an old industrial city: The case of Wałbrzych in Poland. Quaest. Geogr. 2019, 38, 75–90. [Google Scholar] [CrossRef]
  60. Rey-Valette, H.; Robert, S.; Rulleau, B. Resistance to relocation in flood-vulnerable coastal areas: A proposed composite index. Clim. Policy 2019, 19, 206–218. [Google Scholar] [CrossRef]
  61. May, C. Rising groundwater and sea-level rise. Nat. Clim. Chang. 2020, 10, 889–890. [Google Scholar] [CrossRef]
  62. Doberstein, B.; Fitzgibbons, J.; Mitchell, C. Protect, Accommodate, Retreat or Avoid (PARA): Canadian Community Options for Flood Disaster Risk Reduction and Flood Resilience. Nat. Hazards 2018, 98, 31–50. [Google Scholar] [CrossRef]
  63. Sivapalan, M.; Blöschl, G. Time scale interactions and the coevolution of humans and water. Water Resour. Res. 2015, 51, 6988–7022. [Google Scholar] [CrossRef] [Green Version]
  64. Kirshen, P.; Knee, K.; Ruth, M. Climate change and coastal flooding in Metro Boston: Impacts and adaptation strategies. Clim. Chang. 2008, 90, 453–473. [Google Scholar] [CrossRef]
  65. Acevedo, M.A.; Sefair, J.A.; Smith, J.C.; Reichert, B.; Fletcher, R.J., Jr. Conservation under uncertainty: Optimal network protection strategies for worst-case disturbance events. J. Appl. Ecol. 2015, 52, 1588–1597. [Google Scholar] [CrossRef]
  66. Hopkins, L.D. Methods for Generating Land Suitability Maps: A Comparative Evaluation. J. Am. Inst. Plan. 1977, 43, 386–400. [Google Scholar] [CrossRef]
  67. Muangsri, S.; McWilliam, W.; Davies, T.; Lawson, G. How Effective are Strategically Located Green Stormwater Infra-Structure Networks for Adaptive Flood Mitigation in a Context of Climate Change? Land, 2022; submitted. [Google Scholar]
Figure 1. Four steps for evaluating and classifying Flood Mitigation Capabilities (FMC) of different Storm Water Management (SWM) zones in the context of climate change. Steps lead to the identification of implementation approaches and prioritisation of zones for GSI network implementation, which support the development of adaptation plans through time.
Land 11 01765 g001
Figure 2. Here, eight SWM zones are identified according to their drainage areas associated with common outlets (shaded in purple). Properties within zones are spatially connected, with some having upstream contributing areas (e.g., zones 1A and 2C). Blue dotted lines represent drainage areas associated with different outlets, and upstream contributing areas are shaded in blue.
Land 11 01765 g002
Figure 3. Maximum storage depth is defined as the depth to a high groundwater level minus a separation distance between high groundwater and the storage base level. A minimum separation distance of greater than 60 cm is commonly recommended.
Land 11 01765 g003
Figure 4. Three different GW areas within Zone 1A (divided by dotted white lines) are differentiated by different ranges of depths to high groundwater. Maximum in-ground storage depth and potential GSI areas (yellow shade) of each GW area are quantified to estimate storage capacity.
Land 11 01765 g004
Figure 5. The zone’s in-ground storage capacity (green bar) is compared with the total runoff volumes from the drainage area (blue bar) by climate change scenarios and periods (a) to determine the collectable runoff volumes of Zone 1A (b).
Land 11 01765 g005
Figure 6. Zone 1A’s collectable runoff volumes under different climate scenarios are illustrated in blue in (b) compared with the required amounts of runoff reductions to avoid flooding (solid red line). The amount needed to mitigate flooding to below the current flood protection capacity is calculated by determining the difference in volume between the dotted blue line indicating the current flood protection capacity and the solid black line presenting the increased catchment runoff volumes with climate change (a).
Land 11 01765 g006
Figure 7. Decision tree for categorising SWM zones in each FMC class into sub-classes according to their key limiting factor: d = the size of drainage area, w = the high groundwater level, and a = the amount of potential GSI area.
Land 11 01765 g007
Figure 8. The FMC classification system groups SWM zones into six classes according to the extent to which they can reduce climate change-induced flooding to the current flood protection capacity by climate change scenario and period. Then, zones are categorised into different sub-classes according to their key limiting factor: d = drainage area, w = high groundwater, and a = potential GSI area. The outputs of the classification system have implications for implementation approaches through time (illustrated by hatch patterns on the right side of the classification table). Bar charts shown in pastel colours indicate the required catchment runoff volume reductions to meet a flood protection objective under different climate change scenarios and periods indicated in the lower dark grey box.
Land 11 01765 g008
Publisher’s Note: MDPI stays neutral with regard to jurisdictional claims in published maps and institutional affiliations.

