Article

Morpho-Physio-Biochemical Attributes of Roadside Trees as Potential Tools for Biomonitoring of Air Quality and Environmental Health in Urban Areas

1
Department of Plant Sciences, University of California, Davis, CA 95616, USA
2
Department of Environmental Horticulture, University of Seoul, Seoul 02504, Korea
3
Urban Forests Research Center, Forest Conservation Department, National Institute of Forest Science, Seoul 02455, Korea
4
Department of Geoinformatics, University of Seoul, Seoul 02504, Korea
*
Author to whom correspondence should be addressed.
Land 2021, 10(3), 236; https://doi.org/10.3390/land10030236
Submission received: 19 January 2021 / Revised: 6 February 2021 / Accepted: 19 February 2021 / Published: 25 February 2021
(This article belongs to the Special Issue Air Pollution in Urban Areas Impacts on Vegetation and Ecosystems)

Abstract

:
Environmental pollution is an important issue in metropolitan areas, and roadside trees are directly affected by various sources of pollution to which they exhibit numerous responses. The aim of the present study was to identify morpho-physio-biochemical attributes of maidenhair tree (Ginkgo biloba L.) and American sycamore (Platanus occidentalis L.) growing under two different air quality conditions (roadside with high air pollution, RH and roadside with low air pollution, RL) and to assess the possibility of using their physiological and biochemical parameters as biomonitoring tools in urban areas. The results showed that the photosynthetic rate, photosynthetic nitrogen-use efficiencies, and photochromic contents were generally low in RH in both G. biloba and P. occidentalis. However, water-use efficiency and leaf temperature showed high values in RH trees. Among biochemical parameters, in G. biloba, the lipid peroxide content was higher in RH than in RL trees, but in P. occidentalis, this content was lower in RH than in RL trees. In both species, physiological activities were low in trees planted in areas with high levels of air pollution, whereas their biochemical and morphological variables showed different responses to air pollution. Thus, we concluded that it is possible to determine species-specific physiological variables affected by regional differences of air pollution in urban areas, and these findings may be helpful for monitoring air quality and environmental health using trees.

1. Introduction

Environmental pollution, especially the rapid decline in air quality generated by anthropogenic activities, has become an important problem in urban areas. Until World War II, the most hazardous chemicals were sulfur dioxide (SO2) and soot [1]. However, emissions of pollutants such as carbon monoxide (CO), nitrogen dioxide (NO2), ozone (O3), and especially the emission of particulate matter (PM2.5 and PM10) are threatening environmental sustainability and functionality and pose potential threats in urban areas [2,3]. Major sources of these pollutants are incomplete combustion of fossil fuels and road transport. Air pollution affects both plant and human health, inducing physiological and biochemical responses. The World Health Organization (WHO) reported that air pollution can contribute to about four million deaths annually worldwide [4]. Therefore, the prediction of air conditions and reduction in pollutants in urban areas are urgently needed. As urban forests can improve environmental conditions, including air quality [5], tree health is one of the most important factors in urban ecosystems. Nowak et al. [6] reported that urban trees can absorb PM2.5 and PM10 from the atmosphere, and Yu et al. [7] reported that forests play an important role in carbon storage and sequestration. However, under field conditions, long-term exposure to air pollution triggers a decline in urban trees and forests. First, air pollution inhibits photosynthesis, resulting in a decrease in plant growth [8,9]. According to White et al. (1974) [10], diverse pollutant mixtures have synergistic effects on tree photosynthesis. Chlorophyll, an important pigment for light-harvesting, can be degraded under the oxidative stress condition and H2O2 interferes in the Calvin cycle by oxidizing one of the enzyme-catalyzing carbon fixation processes [11]. Moreover, the potential induction of chlorophyll or D1 protein breakdown can act as functionally second messenger signaling molecules in almost every aspect of plant growth and development processes [11]. Numerous studies have shown that air pollutants, such as SO2, NO2, and O3, are major causes of chlorophyll degradation [12,13,14,15,16]. Chlorophyll content is related both to photosynthesis and leaf nitrogen content, as nitrogen is one of the key components of chlorophyll [17]. Furthermore, air pollutants such as SO2, NOx, and O3 can lead to oxidative stress in plants [18]. Oxidative stress in plants can damage their cell membranes, resulting in ion leakage as a consequence of changes in cell permeability [19]. Leaf morphological traits such as wax, cuticle, and stomata are also affected by air pollution because plant leaves take in atmospheric pollutants directly. Particulate pollutants are a major factor affecting plant foliar surface structure transformations [20]. Compared to humans and other animals, plants are more sensitive to environmental stress and have stronger physiological, biological, and morphological responses. Therefore, understanding the physiological link between tree parameters and environmental stress can be important for gaining insights into urban forest health and functioning [21]. To date, many studies on the effects of air pollutants and oxidative stress on plants have been conducted in the artificial conditions at high-level pollution [8,9,10,15,18]. However, information about the effects of multiple contaminators on trees in the field is still lacking. Therefore, in the present study, we carried out a field experiment with the aim to (1) understand the effects of urban air pollution of two roadside tree species, maidenhair tree (Ginkgo biloba L.) and American sycamore (Platanus occidentalis L.), at two sites with different air pollution levels and (2) assess the potential of using certain leaf physiological and morphological characteristics as biomonitoring tools of urban air quality in Seoul metropolitan area.

2. Materials and Methods

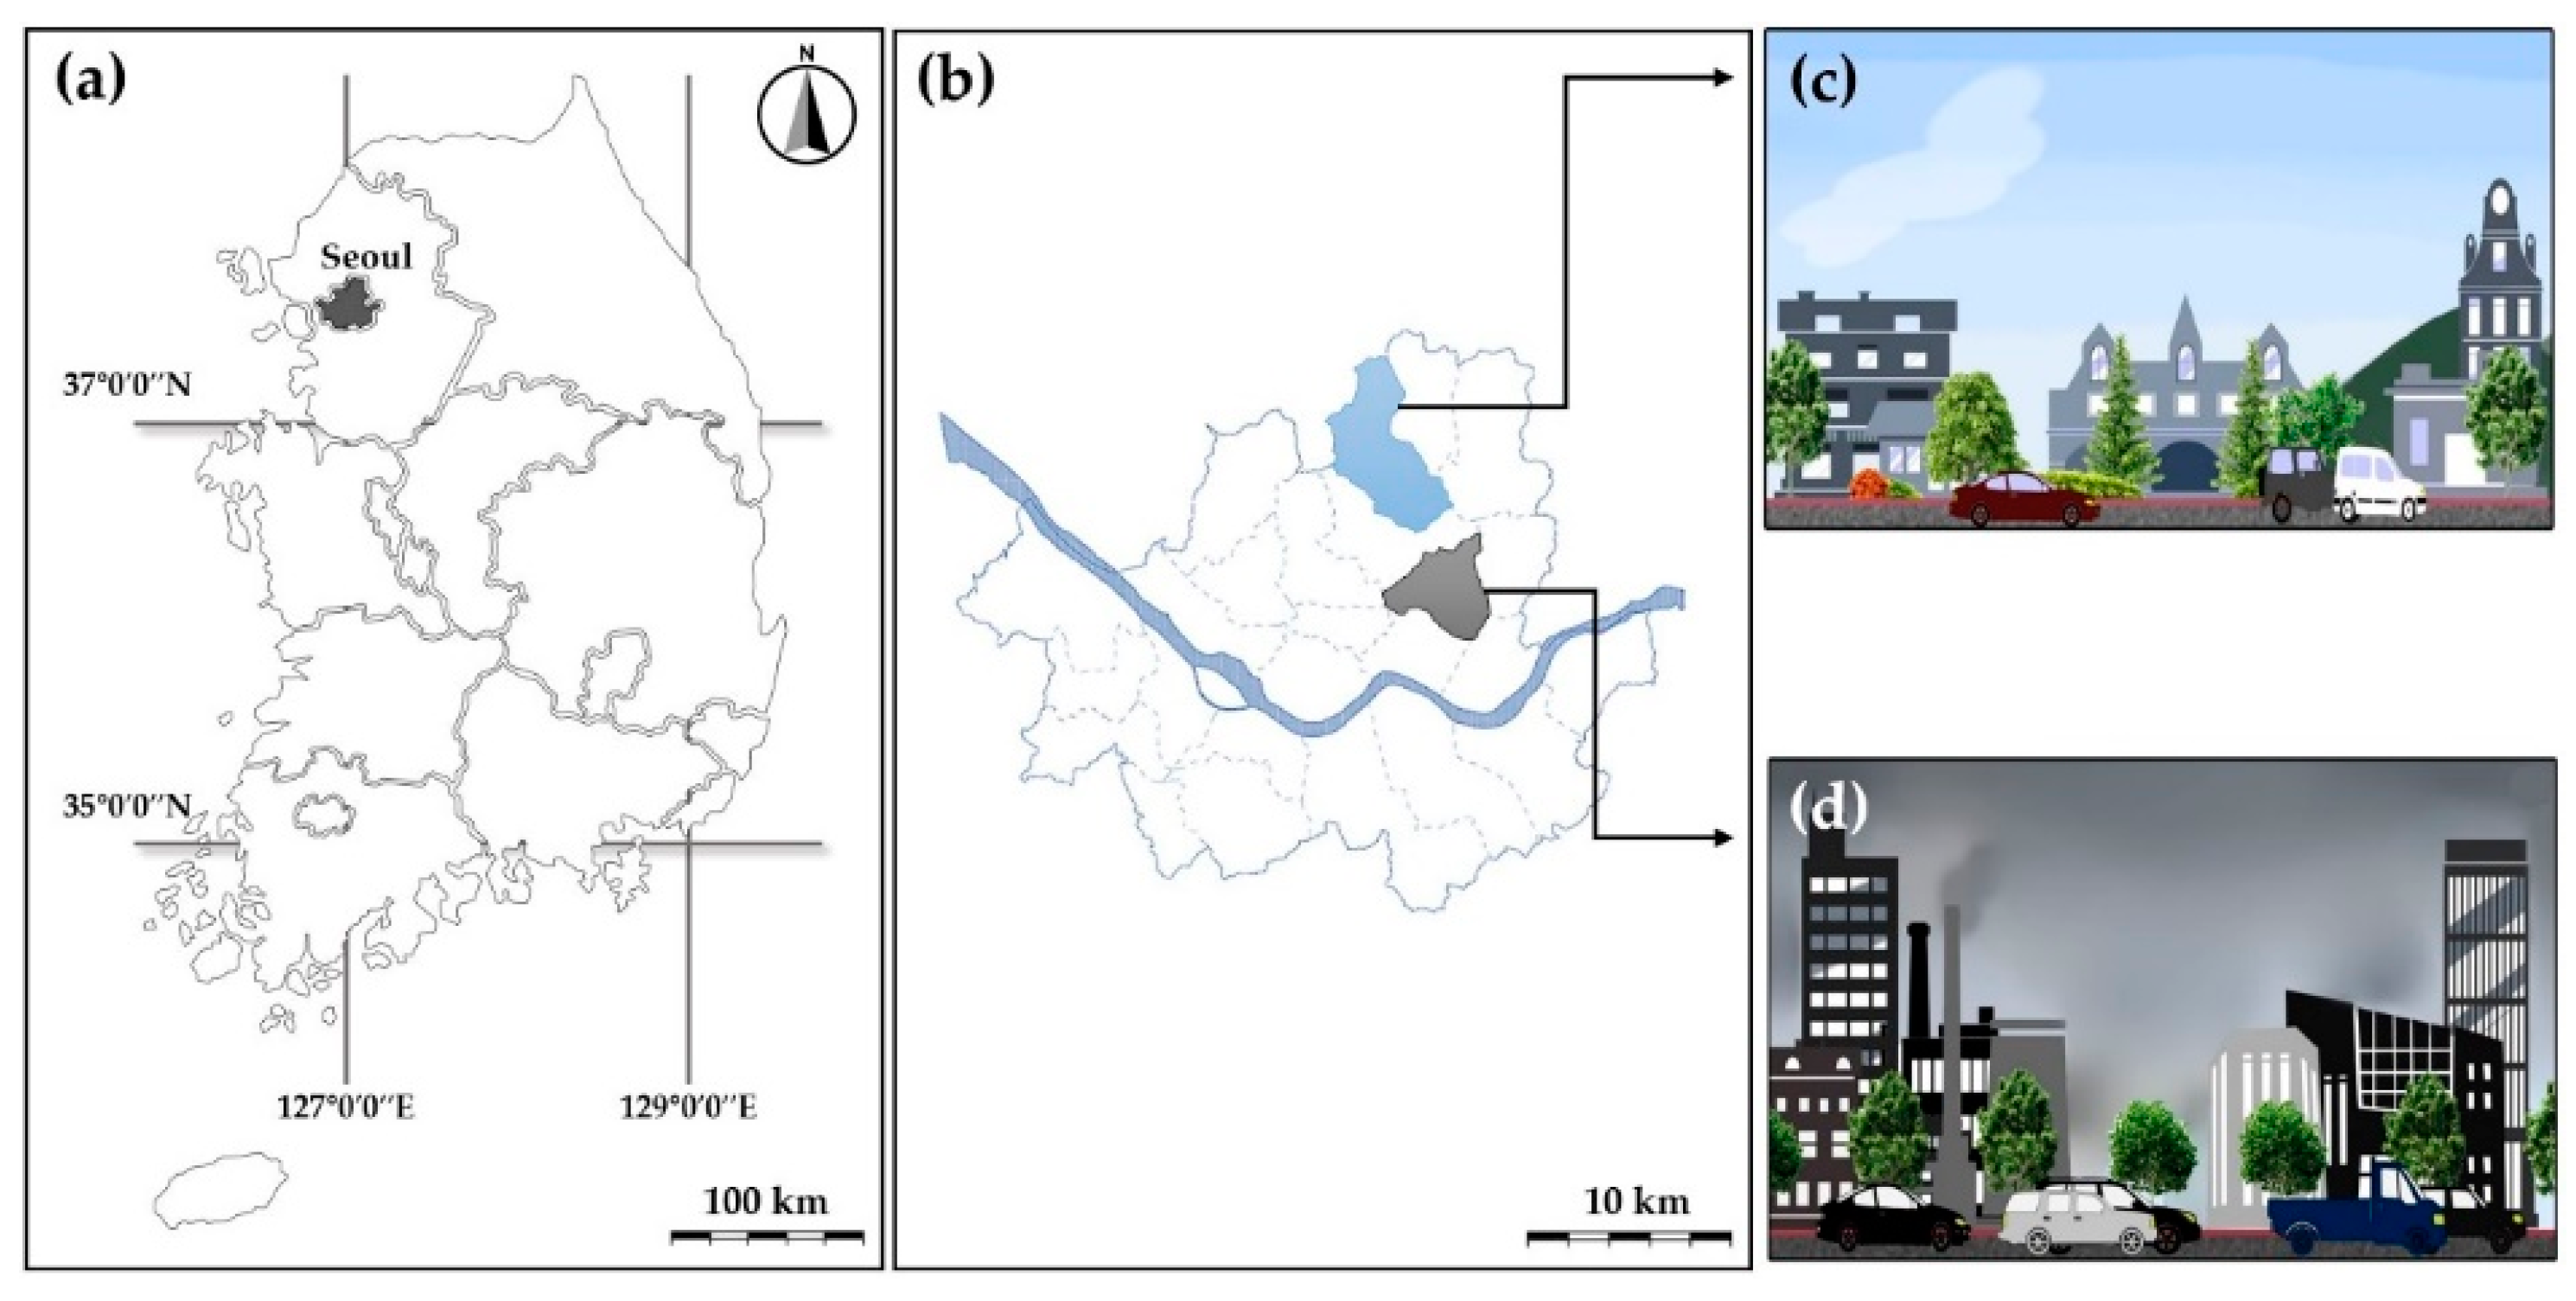
2.1. Experimental Site and Plant Materials

The experiments were conducted in Seoul, the capital city of Korea. Two different urban sites were selected based on the frequency with which the air pollution standard was exceeded [22]: (1) roadsides with low air pollution (RL; 37°63′ N latitude, 127°02′ E longitude), and (2) roadsides with high air pollution (RH; 37°58′ N latitude, 127°05′ E longitude) (Figure 1).
The roadside tree species selected for the experiment were maidenhair tree (Ginkgo biloba L.) and American sycamore (Platanus occidentalis L.), as these two species are the most commonly planting roadside tree species in Seoul, accounting for about 42.2% and 32.8% of roadside trees in Seoul, respectively. These two tree species were commonly selected for morpho-physio-biochemical analyses based on their diameter at breast height. There was no difference in the diameter at breast height of these tree species grown between different sites (Table 1).

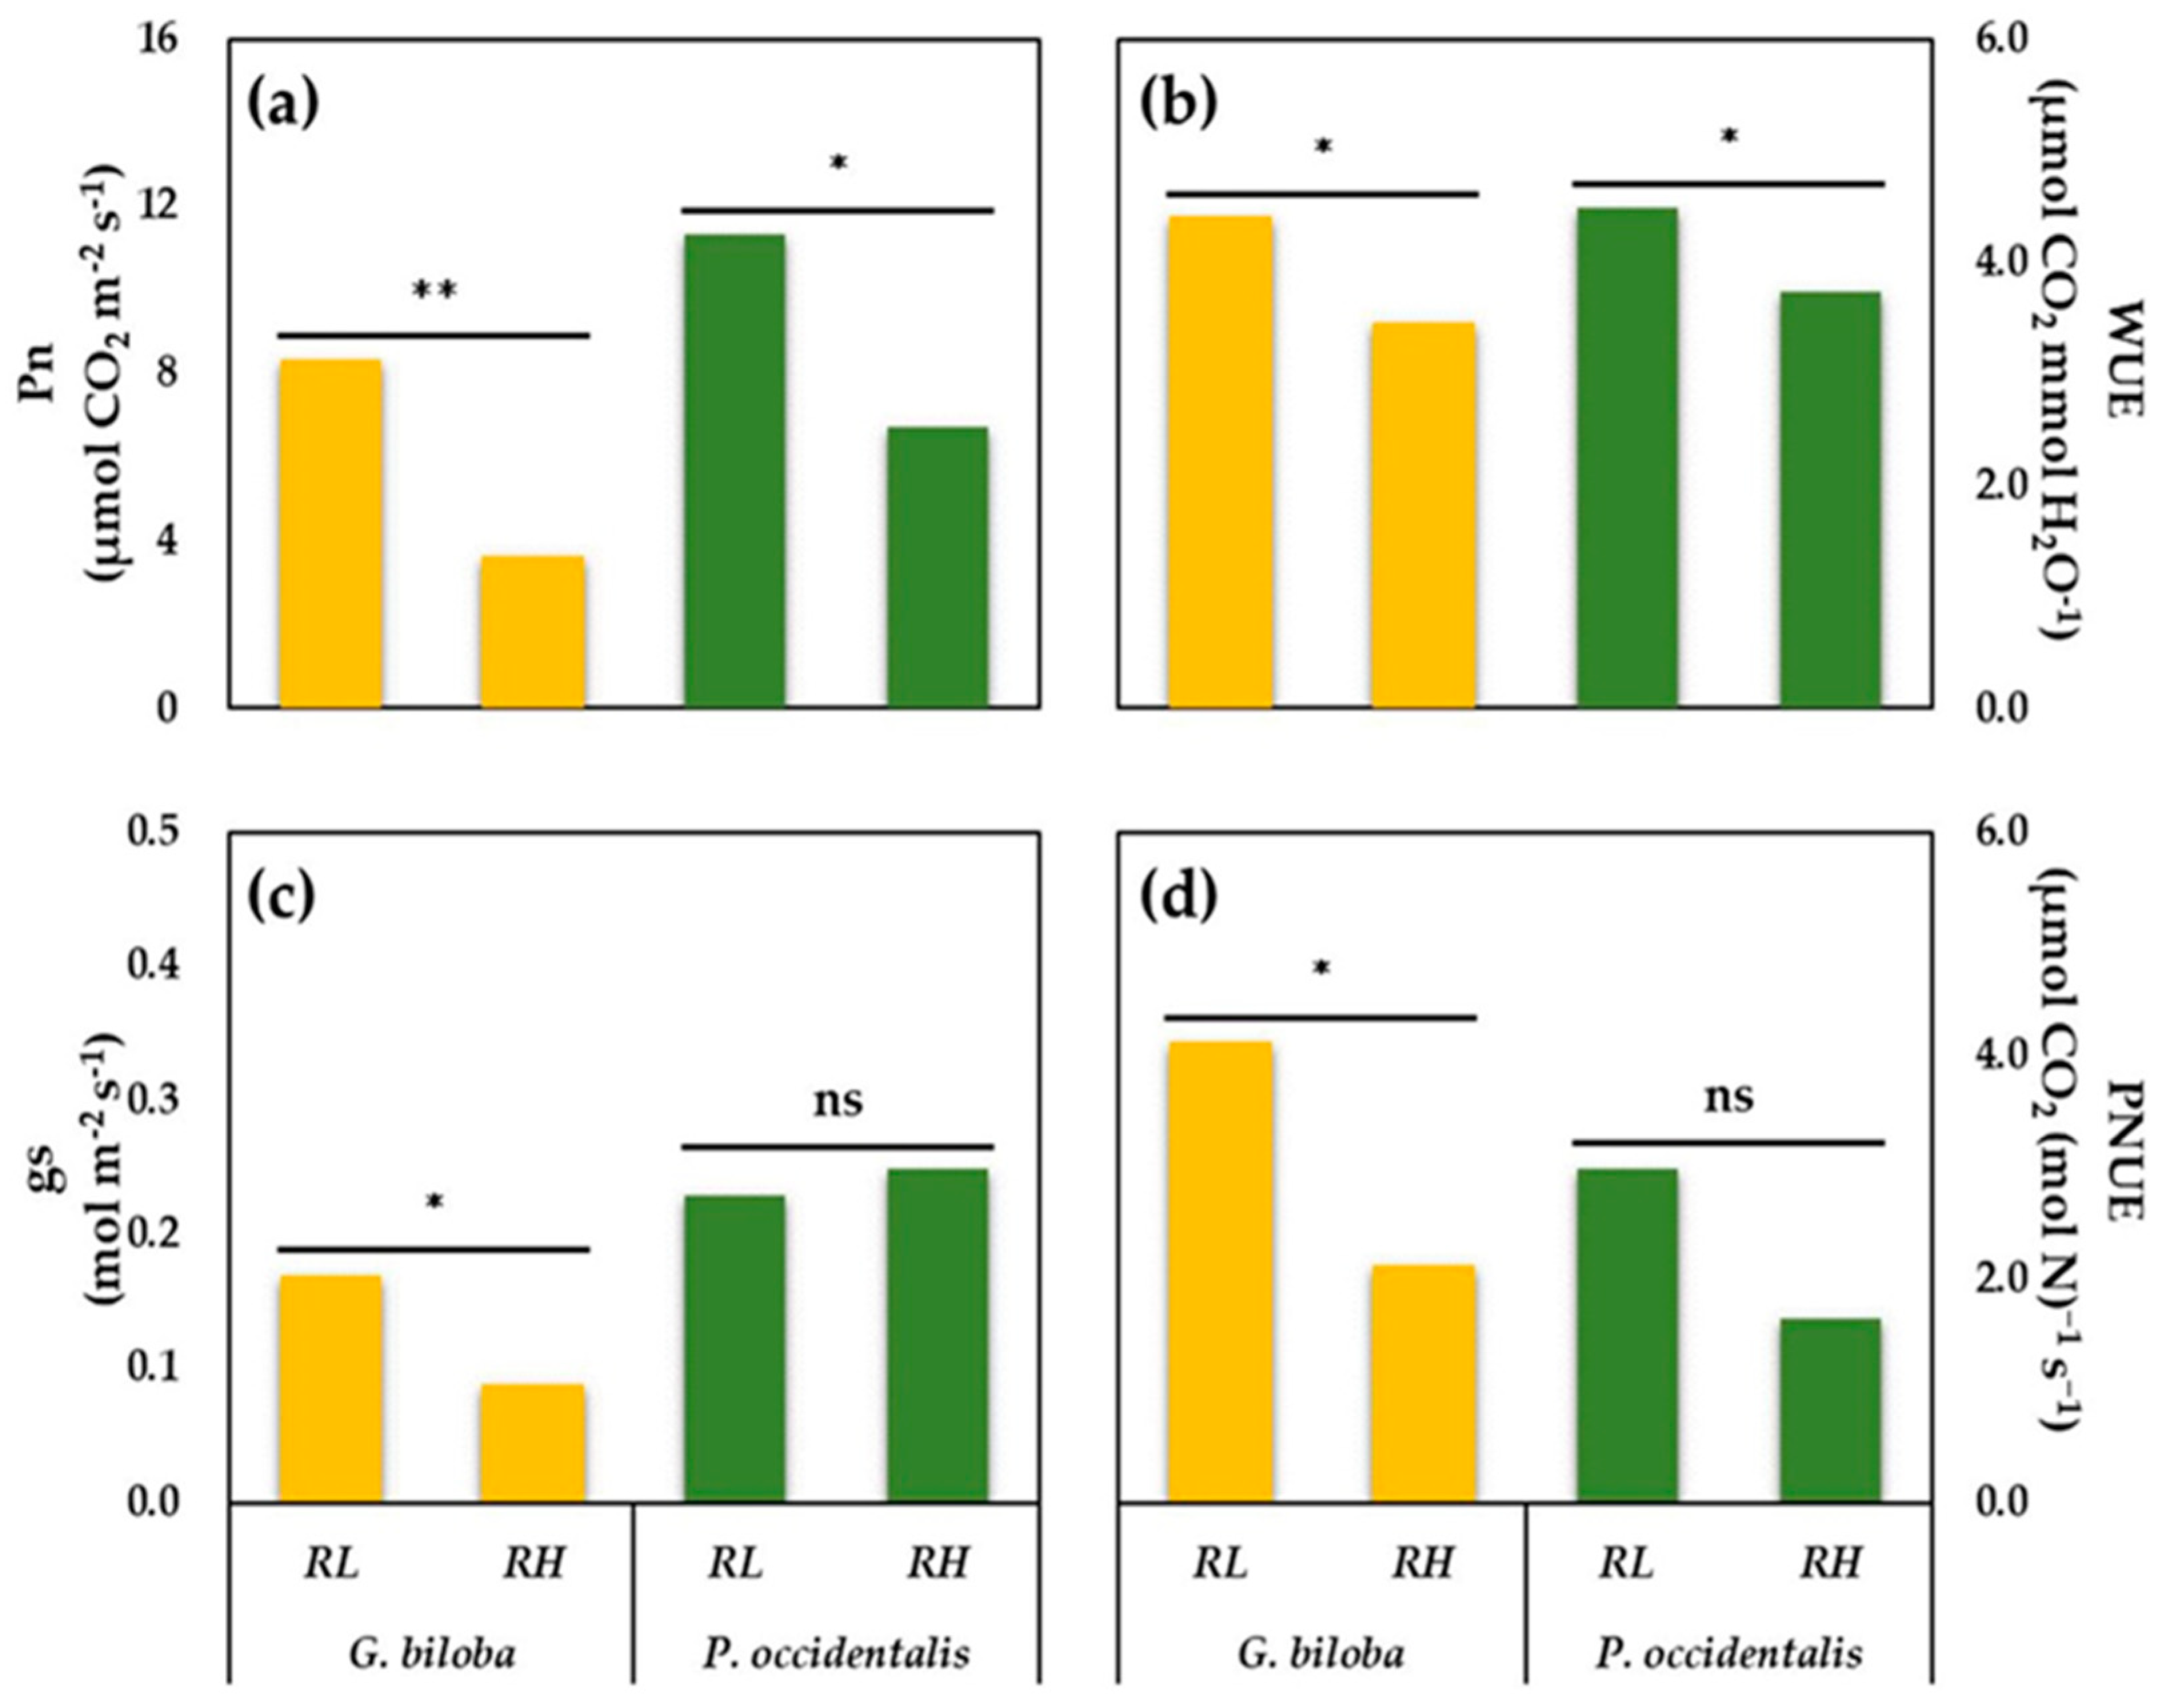
2.2. Photosynthetic Gas Exchange

The rate of photosynthetic carbon assimilation was measured with a LI-6400 portable photosynthesis system (LICOR-6400, Li-Cor Inc., USA). Spot measurements were conducted to compare the differences between treatments. CO2 was set at 400 μmol·mol−1, and the flow rate was fixed at 500 μmol·s−1. Block temperature and relative humidity of the cuvette were fixed at 25 °C and 50–60%, respectively. Photosynthetic photon flux density (PPFD) was set at 1500 μmol·m−2·s−1 saturation intensity. All measurements were performed between 10 a.m. and 2 p.m. under sunny weather conditions. Tracking of gas exchange in the same tree was carried out in the vegetative growing seasons (June and August). Leaf-level instantaneous water-use efficiency (WUE, µmol CO2 mmol H2O−1) was determined by calculating the ratio of leaf net CO2 assimilation rate (Pn) to transpiration rate (Tr), and these parameters were measured with an LI-6400 portable photosynthesis system (LICOR-6400, Li-Cor Inc., USA) under saturating light conditions. WUE was calculated using the following an equation [23]:
WUE = Pn/Tr,
where Pn is the leaf net CO2 assimilation rate (µmol·m−2·s−1) and Tr is the transpiration rate (mmol H2O m−2·s−1).

2.3. Photosynthetic Nitrogen Use Efficiency

To calculate the photosynthetic nitrogen-use efficiency (PNUE, µmol CO2 mmol N−1), the total nitrogen content was determined from the leaves used for gas exchange measurements. The leaves were dried at room temperature for two weeks and crushed to obtain 1.5 mg samples. Bulk leaf samples were combusted using an elemental analyzer (Flash EA 1112, Thermo Electron Corporation, USA). After N2 was generated by the reaction between N and pure oxygen, the gas was purified and separated through a column. The amount of fixed gas was determined using a heat conduction detector. PNUE [24,25] was estimated by dividing leaf net CO2 assimilation rate (Pn) by leaf total nitrogen content (N).
PNUE = Pn/N,
where Pn is the leaf net CO2 assimilation rate (µmol·m−2·s−1), and N is the total leaf nitrogen content (mmol·mg−1).

2.4. Chlorophyll and Carotenoids Contents

Chlorophyll (Chl) and carotenoids (Car) were extracted from samples of 0.1 g of leaf fresh weight. The leaf samples were saturated in 10 mL amber glass vials filled with 80% acetone and stored in the dark at 4 °C for seven days to ensure the complete extraction of pigments. Thereafter, chlorophyll a (Chla), chlorophyll b (Chlb), total chlorophyll (ChlT), and total carotenoid contents (CarT), as well as the ratio of Chla to Chlb (Chla/b ratio), and the ratio of CarT to ChlT (Car/Chl ratio) were determined according to the method described in Arnon [26]. The absorbance values were recorded at wavelengths of 663, 645, and 470 nm using a spectrophotometer (Epoch Microplate, Bio-Tek, Winooski, VT, USA).
Chla (mg·g−1 FW) = {(12.7 × (A) − 2.69 × (B))/(D × 1000 × W)} × V
ChlT (mg·g−1 FW) = {(20.29 × (B) + 8.02 × (A))/(D × 1000 × W)} × V
Chlb (mg·g−1 FW) = {(22.9 × (B) − 4.68 × (A))/(D × 1000 × W)} × V
CarT (mg·g −1 FW) = [{(1000 × (C) − 1.82 (Chla) − 85.02 (Chlb))/198}/(D × 1000 × W)] × V
where FW is fresh weight, A is the absorbance value at 663 nm, B is the absorbance value at 645 nm, C is the absorbance value at 470 nm, D is the distance traveled by the light path (1 cm), W is the fresh weight of leaf samples (0.1 g), and V is the extract volume (10 mL).

2.5. Leaf Temperature

Leaf temperature was analyzed using a thermal imaging infrared camera (T440, FLIR Systems Company, USA). Fresh leaves were cut from plants, and thermographic images were recorded under shade to prevent exposure to direct sunlight. In the image, four temperature points per leaf were selected and averaged using FLIR Research IR Professional analyzing software version 3.2. We estimated leaf temperature and leaf-to-air temperature differences (ΔTleaf-air) that could be displayed in accounting for higher leaf temperatures by lower transpirational cooling.

2.6. Malondialdehyde (MDA) and Electrolyte Leakage (EL) for Membrane Damage Estimation

Leaf oxidative damage was estimated by analyzing the concentration of malondialdehyde (MDA), which is a product of lipid peroxidation. MDA content was determined using a thiobarbituric acid (TBA) reaction following the protocols described in Health and Packer [27]. Fresh material (0.1 g) was homogenized in 0.5 mL of 0.2% trichloroacetic acid (TCA). After centrifugation at 1500× g for 10 min at 4 °C, the supernatant was mixed with the 1.5 mL reaction mixture obtained by diluting 0.5% TBA with 20% TCA. The mixture was incubated at 95 °C for 20 min and promptly moved into an ice bath. Then, supernatant absorbance was measured at 532 and 600 nm using a Micro plate reader (Epoch Microplate, Bio-Tek, USA). The amount of MDA was calculated using an extinction coefficient ε = 155 mM−1·cm−1. To confirm cell membrane damage, membrane permeability was measured using relative electrolyte leakage (EL). For determining relative ion leakage, 0.1 g of fresh leaves bored by a sterile cork borer (6.5 mm diameter) were soaked in 15 mL of deionized water for 24 h to determine initial electrical conductivity (EC1), which was measured using an electrical conductivity meter (MC226, Mettler Toledo, Columbus, OH, USA). Then, the deionized water including the leaf samples was heated to 90 °C for 2 h, and whole electrical conductivity (EC2) was determined. The relative electrolyte leakage was calculated as EC1/EC2 × 100 [28].

2.7. Ascorbate (AsA), Dehydroascorbate (DHA), and AsA Redox State

Ascorbic acid (AsA, also referred to as ascorbate and vitamin C) is one of the most important antioxidants that can prevent oxidative damage in plants, thereby contributing significantly to the scavenging of reactive oxygen species (ROS) [29]. To measure AsA content, a frozen leaf sample of 0.1 g was homogenized with 1 mL of 5% metaphosphoric acid and centrifuged at 15,000× g for 15 min at 4 °C. The supernatant was mixed with 10 mM dithiothreitol (DTT) and 0.2 M sodium phosphate buffer (pH7.4) and incubated at 42 °C for 15 min. After incubation, 0.5% N-ethylmaleimide (NEM) was added to the mixture, followed by the addition of 10% TCA, 42% H3PO4, 4% 2,2′-dipyridyl, and 3% FeCl3. Then, the sample was incubated at 42 °C for 40 min, and each absorbance was read at 525 nm [29] with a spectrophotometer (Epoch Microplate, Bio-Tek, Winooski, VT, USA). The content of dehydroascorbate (DHA) was calculated by subtracting AsA values from total ascorbate. For the analysis of reduced forms of ascorbate, 10 mM DTT and 0.5% NEM were excluded from the reaction mixture. The assay of AsA redox state was calculated on the basis of the oxidation of ASA into DHA in leaves (AsA/AsA  +  DHA). To further confirm the differences in leaf antioxidant capacity between RL and RH, we examined the total ascorbate content in leaves collected in June and August in the growing season.

2.8. Stomata Characteristics

Leaf microstructures on adaxial and abaxial epidermal surfaces (surface roughness and stomata) were determined by focused ion beam-field emission scanning electron microscopy (FIB-FESEM) (Auriga; Carl Zeiss, Oberkochen, Germany) according to the methods described in Kwak et al. [30]. FIB-FESEM images were used to investigate stomatal characteristics. Dried leaf samples were sliced into small strips, which were mounted on metal stubs for gold–palladium coating using a sputter-coater under vacuum conditions (JFC-1100E, JEOL, Japan). The coated leaf samples were observed by FIB-FESEM. The stomatal density (No. mm−2) was estimated by counting the number of stomata per unit leaf area on SEM images. The stomatal guard cell length (μm) was computed using ImageJ software.

2.9. Statistical Analysis

Statistical analysis of the data was performed using Statistical Package for Social Science, SPSS 21.0 (SPSS, Chicago, IL, USA). Data normality was tested using Kolmogorov–Smirnov tests. Significant differences between the RL and the RH within each tree species were determined by independent samples t-tests (p < 0.05).

3. Results

3.1. Air Conditions at Different Experimental Sites

The concentration of air pollutants (NO2 and PM10) was higher at RH (roadside with high air pollution) than at RL (roadside with low air pollution), except for O3 (data not shown). The emissions of air pollutants such as NO2, PM10, and especially the emission of O3 exceeded the national baseline more frequently in RH than in RL (Table 2). Based on the results of this analysis, two different urban sites were classified into two general atmosphere pollution classes, namely: RL for roadside with low air pollution and RH for roadside with high air pollution. The frequency of air pollutant warning alarms, such as NO2, PM10, and O3, was higher at RH than at RL (Table 2).

3.2. Photosynthetic Rates

The photosynthetic rates (Pn) of Ginkgo biloba and Platanus occidentalis growing in RH were significantly lower by 56% and 41%, respectively, than those of plants growing in RL (Figure 2a). The stomatal conductance (gs) of G. biloba was significantly lower by 48% in trees growing in RH than in those growing in RL. However, there were no statistically significant differences in gs of P. occidentalis between RL and RH (Figure 2c). In G. biloba, there was a significant decline of 21% and 49% in WUE and PNUE values, respectively, in RH compared to those in RL (Figure 2b,d). In P. occidentalis, the WUE showed similar outcome measures with those of G. biloba (Figure 2b), but there was no statistically significant difference on PNUE (Figure 2d).

3.3. Chlorophyll and Carotenoid Contents

Plant growth was associated with a considerable decrease in chlorophyll and carotenoid contents as well as the Chl a/b ratio of fully expanded leaves of G. biloba leaves in RH compared to those in RL (Table 3). The chlorophyll and carotenoid contents of G. biloba in RH were significantly lower (70% and 39%, respectively) than those in RL. In particular, the Chla/b ratio showed a reduction of 22% in RH compared to that in RL. RH had a stronger effect on chlorophyll content than on carotenoid content, which is why the Car/Chl ratio was 2.1-fold higher in RH than in RH (Table 3). In contrast, the photosynthetic pigments (chlorophyll and carotenoids) of P. occidentalis were not significantly different between plants grown in RL and those grown in RH.

3.4. Leaf Temperature

The leaf temperatures and leaf-to-air temperature differences (ΔTleaf-air) had no significant difference between RH and RL in June regardless of the species (Supplementary Figure S1a,c). In August, G. biloba showed a smaller ΔTleaf-air variation than P. occidentalis between RL and RH (Supplementary Figure S1b). There was a statistically significant difference in leaf temperatures between RL and Rh, accounting for about 1 °C and 2 °C rises in leaf temperatures of G. biloba and P. occidentalis, respectively, in RH than in RL (Supplementary Figure S1d).

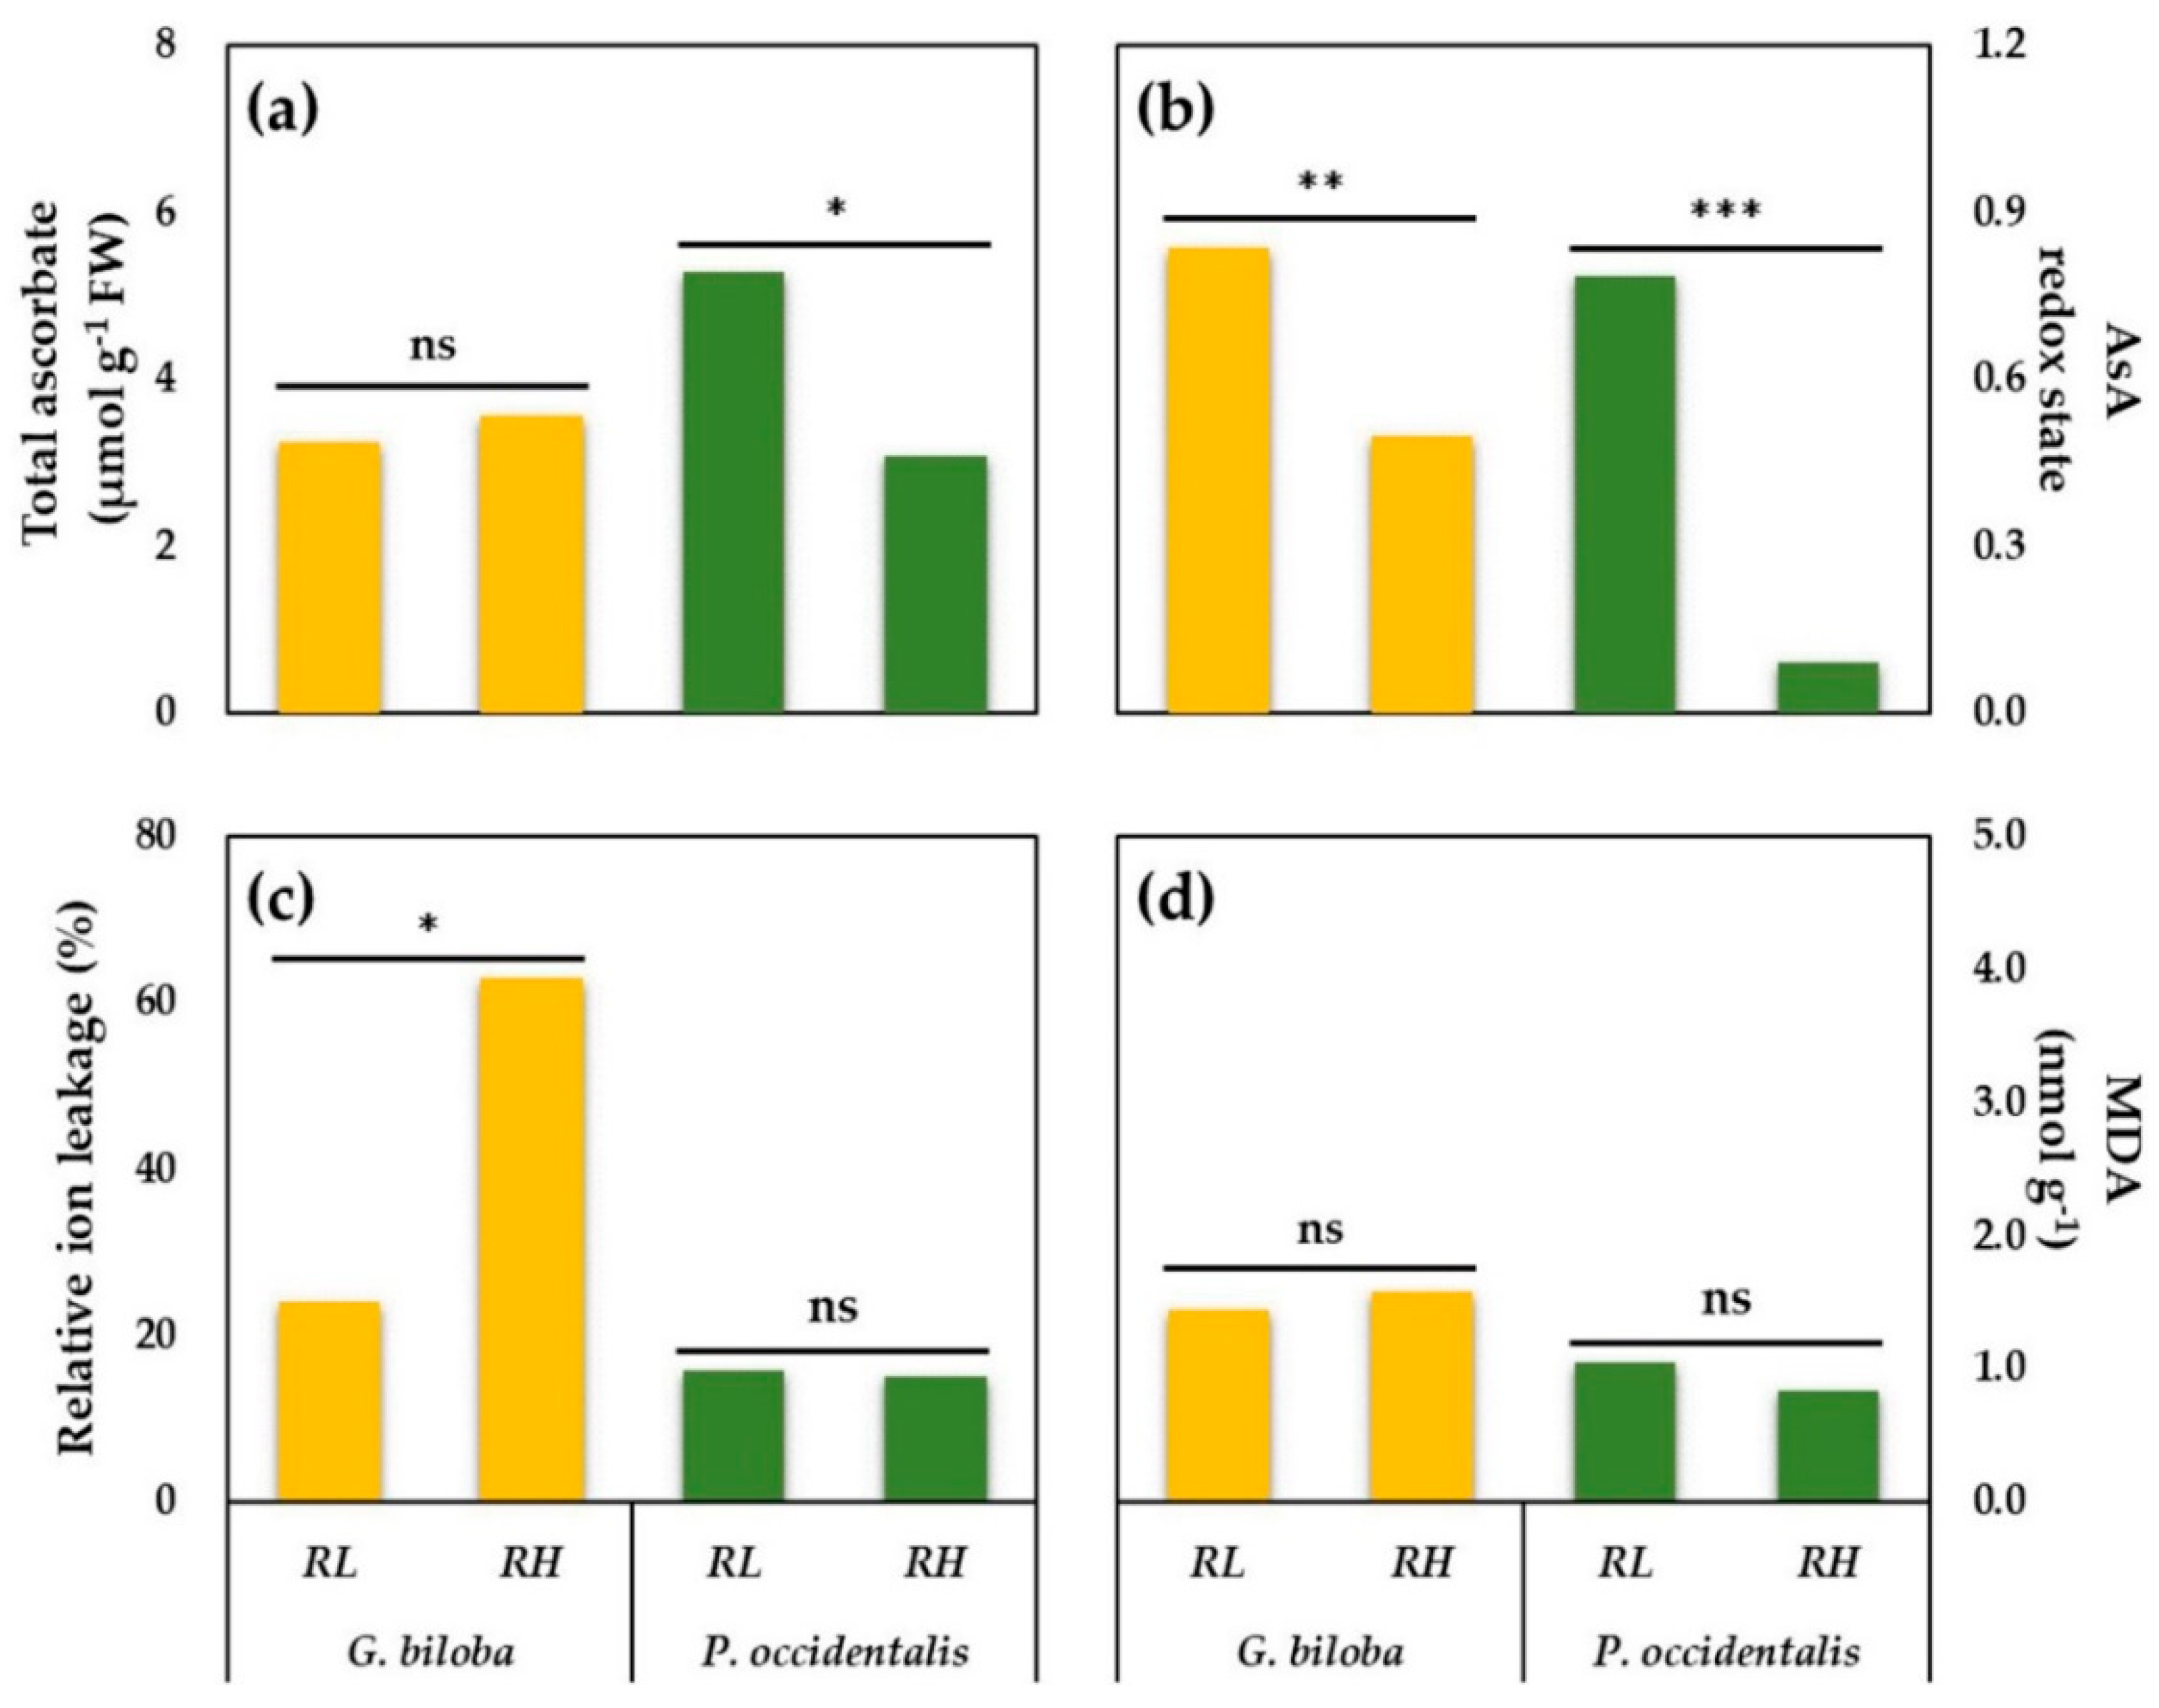
3.5. Ascorbate (AsA), AsA Redox State, Malondialdehyde (MDA), and Relative Ion Leakage

As shown in Figure 3, the total ascorbate content of G. biloba did not show a significant difference between RL and RH. In P. occidentalis, the total ascorbic acid content decreased significantly across RH compared with that across RL (Figure 3a). In both species, the AsA redox state declined significantly in the RH compared to that in RL (Figure 3b). DHA content was 2.0- and 1.5-fold higher in G. biloba and P. occidentalis in RH than in RL (data not shown). In June, the total ascorbate contents decreased by 22% and 58% in G. biloba and P. occidentalis, respectively, in RH compared with RL (data not shown). In particular, the phytotoxicity of RL and RH air environments was quantified by evaluating the formation of MDA content in leaves (as this compound is generally known to be an indicator of lipid peroxidation) (Figure 3d). G. biloba showed an enhanced great increase in electrolyte leakage in RH compared to that in RL, but there was no statistically significant difference in MDA content, inducing peroxidation, between RH and RL (Figure 3c). In P. occidentalis, electrolyte leakage and MDA showed a reduction of 3% and 20%, respectively, in RH compared with RL, but there were no statistically significant differences in the degree of change between RL and RH.

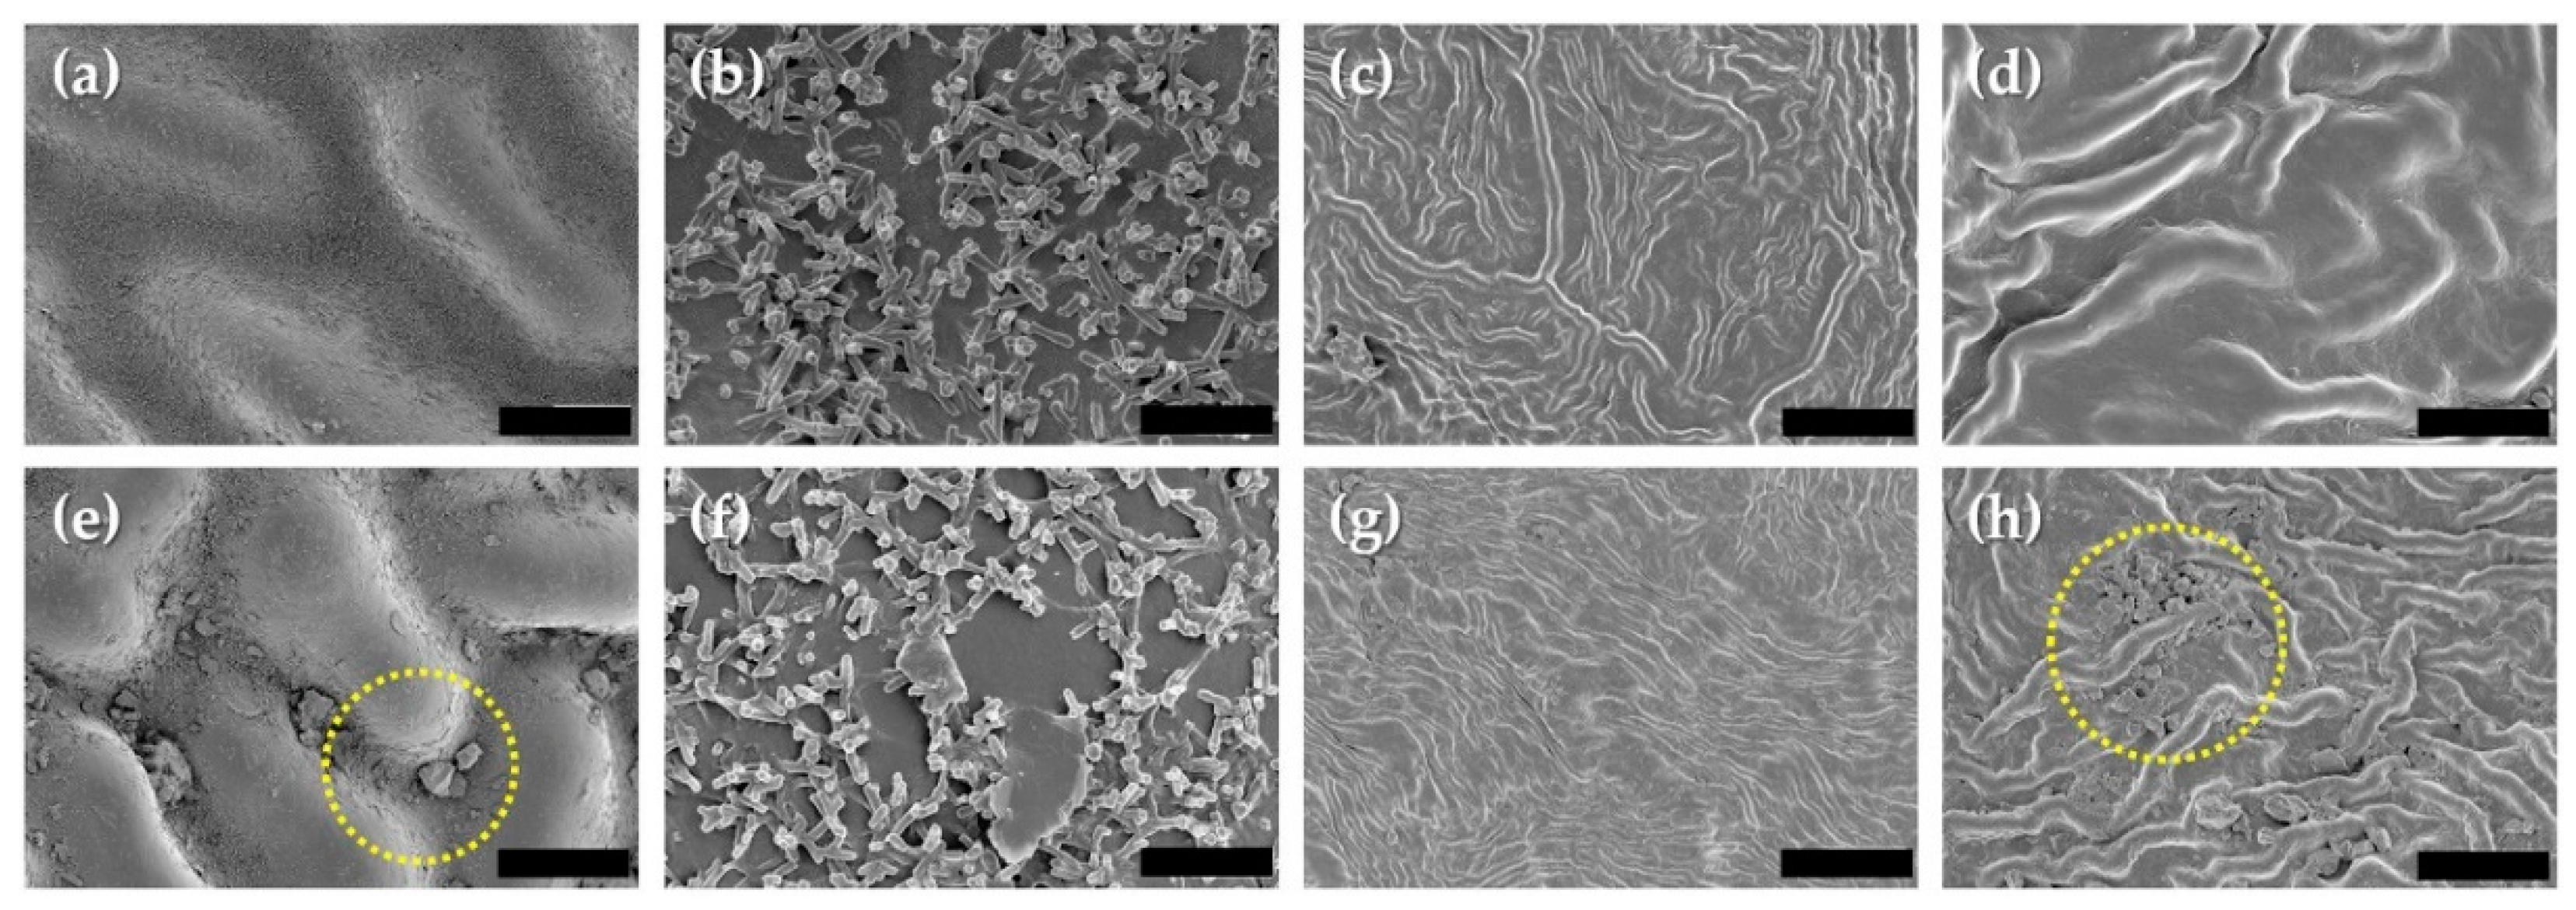
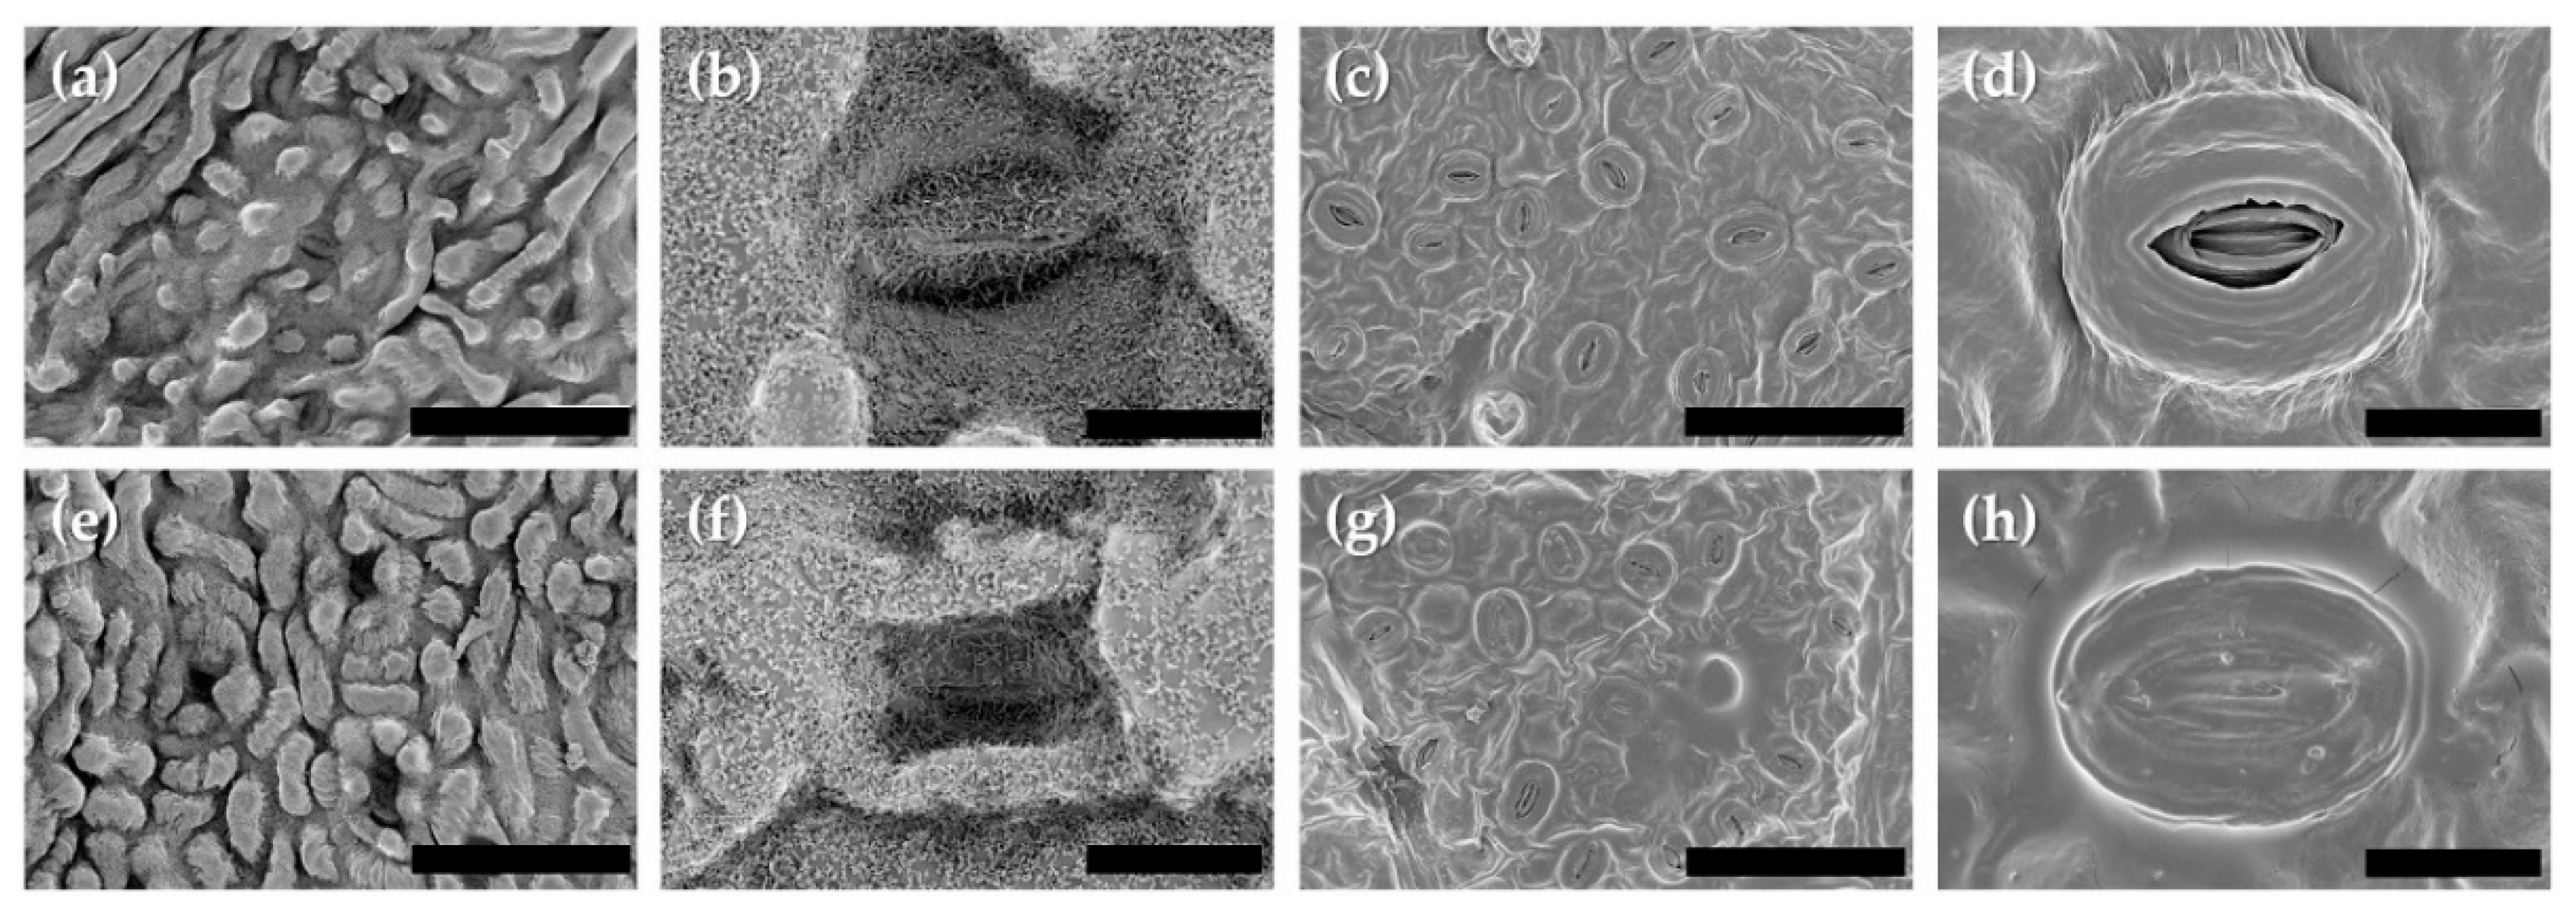
3.6. Leaf Roughness and Stomata Aperture

On a microscale, the adaxial leaf surfaces of G. biloba in RL were homogeneously covered by a dense layer of epicuticular wax tubules, as shown in Figure 4b. The adaxial leaf surfaces of P. occidentalis in RH were dusty and had greater shrinking (Figure 4h), whereas these surfaces of P. occidentalis growing in RL were clean and had less shrinking (Figure 4d). Compared with that in RL, we observed a higher adsorption of particulate matter on leaf adaxial surfaces in RH in both G. biloba and P. occidentalis (Figure 4e,h).
There were slight differences in the stomatal characteristics between G. biloba and P. occidentalis. In G. biloba, stomatal density was lower in RH than in RL (Table 4). Moreover, compared to those in RL areas, the stomata of G. biloba were surrounded by small wax layers and buried deeper in highly polluted RH areas (Figure 5b). However, there were slight differences in the stomatal densities of P. occidentalis between RL and RH, but these differences were not statistically significant. In addition to stomatal density on the abaxial leaf surfaces, there were few structural differences in the stomatal guard cell length of P. occidentalis between the different sites (Table 4). Interestingly, P. occidentalis in RH had more occluded pores and showed many degraded stomata compared with those in RL (Figure 5g).

4. Discussion

Photosynthesis mainly occurs in mesophyll cells, and pollutants diffuse into these cells through intercellular spaces [31,32]. Therefore, photosynthesis is one of the most important parameters when assessing plant physiological activity. Generally, photosynthetic activity decreases under polluted air conditions. At concentrations over 500 ppb, NO2 has a negative impact on plant photosynthesis. Moreover, when a plant is affected by more than one pollutant, the inhibition of photosynthetic activity intensifies [18]. Jensen [33] reported that the photosynthetic rate of Populus deltoides × trichocarpa decreased by about 50% under 150 ppb of O3 compared with that in the control. According to Nouchi [34], the combination of NO2 (100 ppb) and O3 (100 ppb) led to a decrease in photosynthesis in sunflowers. Yan et al. [15] showed that prolonged O3 fumigation induced a decrease in the photosynthetic rate of Quercus mongolica, which consequently accelerated leaf senescence. In this regard, our results showed that plants in highly polluted urban areas had lower photosynthetic rates than plants in low-polluted urban areas, and this was observed in both plant species during the experimental period (Figure 2a). The stomatal conductance of G. biloba in RH significantly decreased by 48% compared to that in RL. The stomatal conductance of P. occidentalis showed no statistically significant difference between RL and RH, which can be because it managed to maintain normal stomatal opening and maintenance (Figure 2c).
Leaf nitrogen content is one of the most important elements for sustaining plant physiological processes. Photosynthetic nitrogen-use efficiency (PNUE) can demonstrate how efficiently nitrogen is being used by plants for carbon assimilation [35]. In particular, photosynthesis can be closely related to plant PNUE [35], because nitrogen is an important component for chlorophyll, which is an essential pigment for photosynthesis. In addition, a large amount of nitrogen is needed to support the activity of rubisco. Field et al. [36] implied that nitrogenous compounds that limited the photosynthetic capacity could be reflected in leaf nitrogen content. However, in this study, the main factor affecting PNUE in G. biloba might be the different photosynthetic rate between trees in RH and RL rather than the difference in leaf nitrogen. Based on the chlorophyll contents and ion leakage data (Table 3, Figure 3c), different photosynthetic rates could be caused by oxidative stress interrupting chlorophyll biosynthesis in G. biloba.
The Chla/b ratio is an important parameter for assessing plant stress levels [17]. In RH, both tree species showed a significantly low Chla/b ratio in both seasons. Chlorophyll (especially chlorophyll a) is the main pigment for harvesting light energy in photosynthetic antenna systems [37,38]. During metabolic processes such as photosynthesis, reactive oxygen species (ROS) are produced as a by-product. In addition, when excited-state Chl cannot appropriately transmit solar energy through photochemical and non-photochemical quenching, singlet oxygen (1O2) is generated in a reaction between excited energy and oxygen molecules [39,40]. Therefore, chlorophyll content can be an important indicator for diagnosing plant physiological activity [41]. Carotenoids play a secondary role in light harvesting; if excessive solar energy cannot be exhausted by chlorophyll alone, carotenoids can help harvest solar energy and prevent the production of ROS. Therefore, carotenoids can control the production of ROS, which have toxic effects on plants [42]. In our study, the effect of air pollution on chlorophyll and carotenoid contents was species-specific. G. biloba showed a significant decrease in photosynthetic pigments, possibly resulting from oxidative stress caused by air pollution. However, there were no significant differences in photosynthetic pigments of P. occidentalis under different air quality. This result can indicate that different species have a unique response to oxidative stress caused by air pollution (Table 3).
Leaf temperature can indicate the outcome of the plant energy balance at the leaf level [43]. Changes in leaf temperature are caused by plant transpiration. When transpiration proceeds smoothly, the leaf temperature is lower than the ambient temperature. If the plant physiological activity sensor is in an abnormal state under a stress conditions, transpiration cannot work properly. Therefore, leaf temperature might be an indirect indicator of plant physiological activity. Leuzinger et al. [44] reported that the leaf temperature of urban trees varied among species and was correlated with the tree location, leaf size, stomatal conductance, and other traits.
Plant cell membranes support numerous physiological and biological reactions and are major targets of environmental stresses [45,46]. The cell membrane is selectively permeable to ions and organic molecules. If the lipid bilayer is damaged by oxidative stress, ions leak from the cytoplasm into the extracellular matrix. Therefore, the degree of cell membrane injury can be estimated by assessing the amount of electrolyte leakage [47]. In our study, significant ion leakage was found in G. biloba in RH, which suggests that the trees were suffering from oxidative stress. Recent research suggests that ROS are a stress factor that induces electrolyte leakage. This phenomenon is widely used as a sign of stress-induced damage to plant tissues and is mainly related to K+ efflux from plant cells [47,48]. Garcia-Mata et al. [49] also reported that a K+ efflux channel might be sensitive to ROS, especially to H2O2. Ascorbate is a major antioxidant in plant cells, and it also acts as a substrate for numerous antioxidant enzymes. When plants face oxidative stress under polluted environmental conditions, ascorbate can control the redox state to prevent cell oxidative damage [50]. Nakano and Asada [51] reported that ascorbate protects chloroplasts by donating an electron to scavenge the ROS production induced by air pollutants. ROS are mainly involved in MDA generation because they degrade polyunsaturated lipids. MDA is a direct product of lipid peroxidation of polyunsaturated fatty acids; it is used to assess the degree of cell membrane lipid damage by ROS level in plants. Therefore, MDA is a potential indicator of certain health-related acute responses indicating oxidative stress. In this study, we did not find significant differences in MDA contents between the trees at RH and RL. However, the MDA content in both species was two times higher than the MDA content found in Pinus armandii fumigated with O3 for 120 days (Figure 3d) [46]. Moreover, according to AsA results (Figure 3b), P. occidentalis represented a great ability to manage oxidative stress by operating the AsA redox state. This strategy seems to be effective in preventing further damage to the cell membrane (Figure 3b,c).
Many studies have reported that air pollution negatively affects leaf morphological structures, including stomatal density and stomatal length [52,53,54,55]. Furthermore, plants close their stomata in response to stress conditions, such as air pollution. Stomatal responses to major air pollution sources entering the leaf stomata are complex and vary widely among individual species and depend on other environmental factors [18,56,57]. Traffic-derived air pollutants can induce changes in stomatal features and may lead to a decrease in plant physiological activities such as transpiration and photosynthesis [58]. Chaturvedi et al. [59] also reported that the chemical composition of road dust particles around urban areas had a toxic effect on plant growth, thus affecting the physiological, biochemical, and morphological responses of plants.
In the present study, G. biloba located in highly air polluted areas exhibited yellowing of the leaf edges. Symptoms of tip dieback are the characteristic of conifer needles. Thus, our results suggested that G. biloba grown in highly air polluted areas exhibited a significant inhibitory effect on the regulation of photosynthetic capacity due to chlorophyll damage, resulting in compromised growth performance [17,37,38]. In a highly polluted environment, P. occidentalis exhibited necrotic flecks or spots on the leaf surfaces; however, these symptoms were not remarkable and frequent. In particular, the white spots of P. occidentalis can be induced not only by environmental stress but also by the invasive insect species Corythucha ciliata, which might disturb the physiological activity of P. occidentalis. Therefore, the decreased photosynthetic rates of P. occidentalis may have resulted from leaf-feeding damage caused by C. ciliata [60].
Finally, our findings emphasized the importance of simultaneously determining species-specific parameters in studies assessing the sensitivity and tolerance of plant species to environmental air pollution. However, the responses and defense mechanisms under stressful conditions caused by degraded air quality can vary by plant species. Moreover, other potential stress factors such as soil compaction, low nutrient availability, and biotic stresses, etc. should carefully be considered in understanding the tree responses. In addition, there are some other symbiotic organisms that can be used as bioindicators for air pollution. However, they are not frequently found in urban areas because of their high sensitivity to environmental pollution [12]. Therefore, plant physiological reactions can be an alternative bio-indicator [61] due to their relative tolerance to air pollution and distinctive physiological and biochemical responses.

5. Conclusions

Monitoring the environmental conditions around human habitats is important for maintaining human life quality. Roadside trees are planted near human habitats and can be used to study the effects of air pollution. Biomonitoring of air quality and environmental health in urban areas is defined as the response measurements of living organisms to environmental conditions and may offer a practical and cost-efficient biomarker for air quality and environmental health. Compared to physiological reactions of humans and other animals, plant physiological reactions show higher sensitivity to air pollutants; therefore, they have potential uses as bio-indicators. However, plant responses to single air pollutant or their combinations can be distinguished from one another at the same site. We found that physiological activities were inhibited in high-polluted sites in both tree species, but the degree of physiological and biochemical damages was different. Moreover, some parameters such as cell membrane damages and stomata apertures showed species-specific responses. In Ginkgo biloba, oxidative stress could be a major cause of the low content of chlorophyll, which in turn results in a decline of photosynthesis. However, the AsA redox state might be a relatively effective defense mechanism for oxidative stress in Platanus occidentalis. Therefore, further studies should be conducted to discover distinct stress responses for diverse roadside tree species. Altogether, this study suggests optimizing the selection for species-specific parameters of road-side trees to improve the effectiveness of biomonitoring using trees and to provide supporting information about environmental quality.

Supplementary Materials

The following are available online at https://www.mdpi.com/2073-445X/10/3/236/s1, Figure S1: Leaf temperature and leaf-to-air temperature differences (ΔTleaf-air) in Ginkgo biloba and Platanus occidentalis growing in roadsides with low air pollution (RL) and roadsides with high air pollution (RH). (a,b) leaf temperature in June and August; (c,d) ΔTleaf-air in June and August. Bars in each graphic represent the means of five replicates. Yellow and green bars denote Ginkgo biloba and Platanus occidentalis, respectively. Asterisks indicate statistically significant differences according to independent samples t-tests between RL and RH within each tree species (* p < 0.05; ** p < 0.01; *** p < 0.001; ns: not significant).

Author Contributions

Conceptualization, S.Y.W.; methodology, H.N.Y. and S.M.J.; validation, S.Y.W.; formal analysis, H.N.Y. and S.M.J.; investigation, H.N.Y. and M.J.K.; resources, J.K.L., Y.J.L., H.K., S.P. and S.G.J.; data curation, H.N.Y.; writing—original draft preparation, M.J.K. and H.N.Y.; writing—review and editing, M.J.K. and S.Y.W.; visualization, M.J.K.; supervision, S.Y.W.; project administration, Y.J.L.; funding acquisition, S.Y.W. and Y.S.C. All authors have read and agreed to the published version of the manuscript.

Funding

This work was supported by the Basic Study and Interdisciplinary R&D Foundation Fund of the University of Seoul (2019).

Institutional Review Board Statement

Not applicable.

Informed Consent Statement

Not applicable.

Data Availability Statement

The data presented in this study are available on request from the corresponding author. The data are not publicly available due to privacy or other restrictions.

Acknowledgments

Special thanks go to the National Instrumentation Center for Environmental Management (NICEM) at the Seoul National University for the microscope technical support in the experimental field.

Conflicts of Interest

The authors declare no conflict of interest. The funders had no role in the design of the study; in the collection, analyses, or interpretation of data; in the writing of the manuscript, or in the decision to publish the results.

References

  1. Fenger, J. Air pollution in the last 50 years—From local to global. Atmos. Environ. 2009, 43, 13–22. [Google Scholar] [CrossRef]
  2. Vingarzan, R. A review of surface ozone background levels and trends. Atmos. Environ. 2004, 38, 3431–3442. [Google Scholar] [CrossRef]
  3. Shukla, K.; Kumar, P.; Mann, G.S.; Khare, M. Mapping spatial distribution of particulate matter using Kriging and Inverse Distance Weighting at supersites of megacity Delhi. Sustain. Cities Soc. 2020, 54, 101997. [Google Scholar] [CrossRef]
  4. World Health Organization. Ambient (Outdoor) Air Quality and Health. Available online: https://www.who.int/news-room/fact-sheets/detail/ambient-(outdoor)-air-quality-and-health (accessed on 8 April 2019).
  5. Setälä, H.; Viippola, V.; Rantalainen, A.L.; Pennanen, A.; Yli-Pelkonen, V. Does urban vegetation mitigate air pollution in northern conditions? Environ. Pollut. 2013, 183, 104–112. [Google Scholar] [CrossRef] [PubMed]
  6. Nowak, D.J.; Hirabayashi, S.; Bodine, A.; Hoehn, R. Modeled PM2.5 removal by trees in ten U.S. cities and associated health effects. Environ. Pollut. 2013, 178, 395–402. [Google Scholar] [CrossRef]
  7. Yu, H.; Lee, W.-K.; Son, Y.; Kwak, D.; Nam, K.; Kim, M.; Byun, J.; Lee, S.; Kwon, T. Estimating carbon stocks in Korean forests between 2010 and 2110: A prediction based on forest volume–age relationships. For. Sci. Technol. 2013, 9, 105–110. [Google Scholar] [CrossRef]
  8. Lee, J.K.; Woo, S.Y.; Kwak, M.J.; Park, S.H.; Kim, H.D.; Lim, Y.J.; Park, J.H.; Lee, K.A. Effects of elevated temperature and ozone in Brassica juncea L.: Growth, physiology, and ROS accumulation. Forests 2020, 11, 68. [Google Scholar] [CrossRef] [Green Version]
  9. Heyneke, E.; Strauss, A.J.; Strasser, R.J.; Krüger, G.H.J. Open-top chamber facility to study air pollution impacts in South Africa. Part II: SO2-drought interactions on yield, photosynthesis and symbiotic nitrogen fixation in soybean. S. Afr. J. Plant Soil 2012, 29, 9–23. [Google Scholar] [CrossRef]
  10. White, K.L.; Hill, A.C.; Bennett, J.H. Synergistic Inhibition of Apparent Photosynthesis Rate of Alfalfa by Combinations of Sulfur Dioxide and Nitrogen Dioxide. Environ. Sci. Technol. 1974, 8, 574–576. [Google Scholar] [CrossRef]
  11. Foyer, C.H.; Shigeoka, S. Understanding oxidative stress and antioxidant functions to enhance photosynthesis. Plant Physiol. 2011, 155, 93–100. [Google Scholar] [CrossRef] [Green Version]
  12. Rao, D.N.; LeBlanc, F. Effects of Sulfur Dioxide on the Lichen Alga, with Special Reference to Chlorophyll. Bryologist 1966, 69, 69. [Google Scholar] [CrossRef]
  13. Rao, M.V.; Dubey, P.S. Plant response against SO2 in field conditions. Asian Environ. 1985, 10, 1–9. [Google Scholar]
  14. Mandloi, B.L.; Dubey, P.S. The industrial emission and plant response at Pithampur (M.P). Int. J. Ecol. Environ. Sci. 1988, 14, 75–99. [Google Scholar]
  15. Yan, K.; Chen, W.; He, X.; Zhang, G.; Xu, S.; Wang, L. Responses of photosynthesis, lipid peroxidation and antioxidant system in leaves of Quercus mongolica to elevated O3. Environ. Exp. Bot. 2010, 69, 198–204. [Google Scholar] [CrossRef]
  16. Singh, S.; Pandey, B.; Roy, L.B.; Shekhar, S.; Singh, R.K. Tree responses to foliar dust deposition and gradient of air pollution around opencast coal mines of Jharia coalfield, India: Gas exchange, antioxidative potential and tolerance level. Environ. Sci. Pollut. Res. 2020, 1–15. [Google Scholar] [CrossRef]
  17. Hikosaka, K.; Terashima, I. A model of the acclimation of photosynthesis in the leaves of C3 plants to sun and shade with respect to nitrogen use. Plant Cell Environ. 1995, 18, 605–618. [Google Scholar] [CrossRef]
  18. Darrall, N.M. The effect of air pollutants on physiological processes in plants. Plant Cell Environ. 1989, 12, 1–30. [Google Scholar] [CrossRef]
  19. Elkiey, T.; Ormrod, D.P. Ozone and/or sulphur dioxide effects on tissue permeability of petunia leaves. Atmos. Environ. 1979, 13, 1165–1168. [Google Scholar] [CrossRef]
  20. Rai, A.; Kulshreshtha, K.; Srivastava, P.K.; Mohanty, C.S. Leaf surface structure alterations due to particulate pollution in some common plants. Environmentalist 2010, 30, 18–23. [Google Scholar] [CrossRef]
  21. Mukherjee, A.; Agrawal, M. Use of GLM approach to assess the responses of tropical trees to urban air pollution in relation to leaf functional traits and tree characteristics. Ecotoxicol. Environ. Saf. 2018, 152, 42–54. [Google Scholar] [CrossRef] [PubMed]
  22. National Institute of Environmental Research. Annual Report of Air Quality in Korea 2013; The Korea Ministry of Environment: Seoul, Korea, 2014.
  23. Cernusak, L.A.; Aranda, J.; Marshall, J.D.; Winter, K. Large variation in whole-plant water-use efficiency among tropical tree species. New Phytol. 2007, 173, 294–305. [Google Scholar] [CrossRef] [Green Version]
  24. Harrison, M.T.; Edwards, E.J.; Farquhar, G.D.; Nicotra, A.B.; Evans, J.R. Nitrogen in cell walls of sclerophyllous leaves accounts for little of the variation in photosynthetic nitrogen-use efficiency. Plant Cell Environ. 2009, 32, 259–270. [Google Scholar] [CrossRef]
  25. Shang, B.; Xu, Y.; Dai, L.; Yuan, X.; Feng, Z. Elevated ozone reduced leaf nitrogen allocation to photosynthesis in poplar. Sci. Total Environ. 2019, 657, 169–178. [Google Scholar] [CrossRef]
  26. Arnon, D.I. Copper enzymes in isolated chloroplasts. Polyphenoloxidase in Beta vulgaris. Plant Physiol. 1949, 24, 1–15. [Google Scholar] [CrossRef] [PubMed] [Green Version]
  27. Heath, R.L.; Packer, L. Photoperoxidation in isolated chloroplasts: I. Kinetics and stoichiometry of fatty acid peroxidation. Arch. Biochem. Biophys. 1968, 125, 189–198. [Google Scholar] [CrossRef]
  28. Prado, C.; Prado, F.E.; Pagano, E.; Rosa, M. Differential effects of Cr (VI) on the ultrastructure of chloroplast and plasma membrane of Salvinia minima growing in summer and winter. Relationships with lipid peroxidation, electrolyte leakage, photosynthetic pigments, and carbohydrates. Water Air Soil Pollut. 2015, 226, 8. [Google Scholar] [CrossRef]
  29. Kampfenkel, K.; Van Montagu, M.; Inzé, D. Extraction and determination of ascorbate and dehydroascorbate from plant tissue. Anal. Biochem. 1995, 225, 165–167. [Google Scholar] [CrossRef]
  30. Kwak, M.J.; Lee, S.H.; Khaine, I.; Je, S.M.; Lee, T.Y.; You, H.N.; Lee, H.K.; Woo, S.Y. Stomatal movements depend on interactions between external night light cue and internal signals activated by rhythmic starch turnover and abscisic acid (ABA) levels at dawn and dusk. Acta Physiol. Plant. 2017, 39, 162. [Google Scholar] [CrossRef]
  31. Heath, R.L. Initial Events in Injury to Plants by Air Pollutants. Annu. Rev. Plant Physiol. 1980, 31, 395–431. [Google Scholar] [CrossRef]
  32. Buckley, T.N.; Warren, C.R. The role of mesophyll conductance in the economics of nitrogen and water use in photosynthesis. Photosynth. Res. 2014, 119, 77–88. [Google Scholar] [CrossRef]
  33. Jensen, K.F. Growth analysis of hybrid poplar cuttings fumigated with ozone and sulphur dioxide. Environ. Pollut. Ser. A Ecol. Biol. 1981, 26, 243–250. [Google Scholar] [CrossRef]
  34. Nouchi, I. Responses of Whole Plants to Air Pollutants. In Air Pollution and Plant Biotechnology; Springer: Tokyo, Japan, 2002; pp. 3–39. [Google Scholar] [CrossRef]
  35. Makino, A.; Osmond, B. Effects of nitrogen nutrition on nitrogen partitioning between chloroplasts and mitochondria in pea and wheat. Plant Physiol. 1991, 96, 355–362. [Google Scholar] [CrossRef] [Green Version]
  36. Field, C.; Merino, J.; Mooney, H.A. Compromises between water-use efficiency and nitrogen-use efficiency in five species of California evergreens. Oecologia 1983, 60, 384–389. [Google Scholar] [CrossRef] [PubMed]
  37. Tanaka, A.; Tanaka, R. Chlorophyll metabolism. Curr. Opin. Plant Biol. 2006, 9, 248–255. [Google Scholar] [CrossRef] [PubMed]
  38. Mezacasa, A.V.; Queiroz, A.M.; Graciano, D.E.; Pontes, M.S.; Santiago, E.F.; Oliveira, I.P.; Lopeze, A.J.; Casagrande, G.A.; Scherer, M.D.; dos Reis, D.D.; et al. Effects of gold nanoparticles on photophysical behaviour of chlorophyll and pheophytin. J. Photochem. Photobiol. A Chem. 2020, 389, 112252. [Google Scholar] [CrossRef]
  39. Asada, K. The water-water cycle in chloroplasts: Scavenging of active oxygens and dissipation of excess photons. Annu. Rev. Plant Biol. 1999, 50, 601–639. [Google Scholar] [CrossRef] [PubMed]
  40. Tripathy, B.C.; Oelmüller, R. Reactive oxygen species generation and signaling in plants. Plant Signal. Behav. 2012, 7, 1621–1633. [Google Scholar] [CrossRef]
  41. Marques, M.C.; Nascimento, C.W.A.; da Silva, A.J.; da Silva Gouveia-Neto, A. Tolerance of an energy crop (Jatropha curcas L.) to zinc and lead assessed by chlorophyll fluorescence and enzyme activity. S. Afr. J. Bot. 2017, 112, 275–282. [Google Scholar] [CrossRef]
  42. Knox, J.P.; Dodge, A.D. Singlet oxygen and plants. Phytochemistry 1985, 24, 889–896. [Google Scholar] [CrossRef]
  43. Monteith, J.; Unsworth, M. Principles of Enviromental Physics; Edward Arnold: London, UK, 1990; p. 291. [Google Scholar]
  44. Leuzinger, S.; Vogt, R.; Körner, C. Tree surface temperature in an urban environment. Agric. For. Meteorol. 2010, 150, 56–62. [Google Scholar] [CrossRef]
  45. Yan, K.; He, X.; Chen, W.; Lu, T.; Xu, S.; Shao, H.; Zhang, G. Variation of Antioxidant System in Pinus armandii under Elevated O3 in an Entire Growth Season. CLEAN Soil Air Water 2013, 41, 5–10. [Google Scholar] [CrossRef]
  46. Leshem, Y.Y. Plant Membranes: A Biophysical Approach to Structure, Development and Senescence; Kluwer Academic Publishers: Dordrecht, The Netherlands, 1992; p. 266. [Google Scholar]
  47. Campos, P.S.; Quartin, V.; Ramalho, J.C.; Nunes, M.A. Electrolyte leakage and lipid degradation account for cold sensitivity in leaves of Coffea sp. plants. J. Plant Physiol. 2003, 160, 283–292. [Google Scholar] [CrossRef] [PubMed] [Green Version]
  48. Demidchik, V.; Straltsova, D.; Medvedev, S.S.; Pozhvanov, G.A.; Sokolik, A.; Yurin, V. Stress-induced electrolyte leakage: The role of K+-permeable channels and involvement in programmed cell death and metabolic adjustment. J. Exp. Bot. 2014, 65, 1259–1270. [Google Scholar] [CrossRef] [PubMed]
  49. Garcia-Mata, C.; Wang, J.; Gajdanowicz, P.; Gonzalez, W.; Hills, A.; Donald, N.; Riedelsberger, J.; Amtmann, A.; Dreyer, I.; Blatt, M.R. A minimal cysteine motif required to activate the SKOR K+ channel of arabidopsis by the reactive oxygen species H2O2. J. Biol. Chem. 2010, 285, 29286–29294. [Google Scholar] [CrossRef] [PubMed] [Green Version]
  50. Foyer, C.H.; Noctor, G. Ascorbate and glutathione: The heart of the redox hub. Plant Physiol. 2011, 155, 2–18. [Google Scholar] [CrossRef] [Green Version]
  51. Nakano, Y.; Asada, K. Hydrogen peroxide is scavenged by ascorbate-specific peroxidase in spinach chloroplasts. Plant Cell Physiol. 1981, 22, 867–880. [Google Scholar] [CrossRef]
  52. Garg, K.K.; Varshney, C.K. Effect of air pollution on the leaf epidermis at the submicroscopic level. Experientia 1980, 36, 1364–1366. [Google Scholar] [CrossRef]
  53. Pourkhabbaz, A.; Rastin, N.; Olbrich, A.; Langenfeld-Heyser, R.; Polle, A. Influence of environmental pollution on Leaf properties of urban plane trees, Platanus orientalis L. Bull. Environ. Contam. Toxicol. 2010, 85, 251–255. [Google Scholar] [CrossRef] [Green Version]
  54. Sharma, G.K.; Butler, J. Leaf cuticular variations in Trifolium repens L. as indicators of environmental pollution. Environ. Pollut. 1973, 5, 287–293. [Google Scholar] [CrossRef]
  55. Rashidi, F.; Jalili, A.; Kafaki, S.B.; Sagheb-Talebi, K.; Hodgson, J. Anatomical responses of leaves of Black Locust (Robinia pseudoacacia L.) to urban pollutant gases and climatic factors. Trees 2012, 26, 363–375. [Google Scholar] [CrossRef]
  56. Paoletti, E. Ozone slows stomatal response to light and leaf wounding in a Mediterranean evergreen broadleaf, Arbutus unedo. Environ. Pollut. 2005, 134, 439–445. [Google Scholar] [CrossRef] [PubMed]
  57. García-Sánchez, I.E.; Barradas, V.L.; de León Hill, C.A.P.; Esperón-Rodríguez, M.; Pérez, I.R.; Ballinas, M. Effect of heavy metals and environmental variables on the assimilation of CO2 and stomatal conductance of Ligustrum lucidum, an urban tree from Mexico City. Urban For. Urban Green. 2019, 42, 72–81. [Google Scholar] [CrossRef]
  58. Gratani, L.; Crescente, M.A.; Petruzzi, M. Relationship between leaf life-span and photosynthetic activity of Quercus ilex in polluted urban areas (Rome). Environ. Pollut. 2000, 110, 19–28. [Google Scholar] [CrossRef]
  59. Chaturvedi, R.K.; Prasad, S.; Rana, S.; Obaidullah, S.M.; Pandey, V.; Singh, H. Effect of dust load on the leaf attributes of the tree species growing along the roadside. Environ. Monit. Assess. 2013, 185, 383–391. [Google Scholar] [CrossRef] [PubMed]
  60. Li, F.; Wu, C.; Dewer, Y.; Li, D.; Qu, C.; Luo, C. Changes in gene expression and metabolite profiles in Platanus acerifolia leaves in response to feeding damage caused by Corythucha ciliata. Int. J. Mol. Sci. 2019, 20, 3465. [Google Scholar] [CrossRef] [PubMed] [Green Version]
  61. Joshi, P.C.; Swami, A. Physiological responses of some tree species under roadside automobile pollution stress around city of Haridwar, India. Environmentalist 2007, 27, 365–374. [Google Scholar] [CrossRef]
Figure 1. Map showing the location of the field experimental sites in Seoul, South Korea. (a) Map of South Korea; (b) two different locations having different air quality in Seoul; (c) roadsides with low air pollution (RL), and (d) roadsides with high air pollution (RH).
Land 10 00236 g001
Figure 2. (a) Photosynthetic rate (Pn); (b) water-use efficiency (WUE); (c) stomatal conductance (gs); and (d) photosynthetic nitrogen use efficiency (PNUE) in Ginkgo biloba and Platanus occidentalis growing in roadsides with low air pollution (RL) and roadsides with high air pollution (RH). Bars in each graphic represent the means of five replicates. Yellow and green bars denote Ginkgo biloba and Platanus occidentalis, respectively. Asterisks indicate statistically significant differences according to independent samples t-tests between RL and RH within each tree species (* p < 0.05; ** p < 0.01; ns: not significant).
Land 10 00236 g002
Figure 3. (a) Total ascorbate contents; (b) ascorbate (AsA) redox state; (c) electrolyte leakage (EL, %); and (d) malondialdehyde (MDA, nmol·g−1 FW) in Ginkgo biloba and Platanus occidentalis growing in roadsides with low air pollution (RL) and roadsides with high air pollution (RH). Bars in each graphic represent the means of five replicates. Yellow and green bars denote Ginkgo biloba and Platanus occidentalis, respectively. Asterisks indicate statistically significant differences according to independent samples t-tests between RL and RH within each tree species (* p < 0.05; ** p < 0.01; *** p < 0.001; ns: not significant).
Land 10 00236 g003
Figure 4. Scanning electron microscope (SEM) images showing roughness on adaxial leaf surfaces of (a,b,e,f) Ginkgo biloba and (c,d,g,h) Platanus occidentalis in (ad) roadsides with low air pollution (RL) and (eh) roadsides with high air pollution (RH). Note: Yellow dotted circles in (e,h) images denote different PM particle fractions captured inside the spacing between grooves on adaxial surfaces in highly polluted areas. Magnification: (a,c,e,g) 3000×; (b,d,f,h) 30,000×. Scale bars: (a,c,e,g) 100 µm; (b,d,f,h) 10 µm.
Land 10 00236 g004
Figure 5. Scanning electron microscope (SEM) images showing stomata on abaxial leaf surfaces of (a,b,e,f) Ginkgo biloba and (c,d,g,h) Platanus occidentalis in (ad) roadsides with low air pollution (RL) and (eh) roadsides with high air pollution (RH). Magnification: (a,c,e,g) 1000×; (b,d,f,h) 7000×. Scale bars: (a,c,e,g) 20 µm; (b,d,f,h) 2 µm.
Land 10 00236 g005
Table 1. Diameter at breast height (DBH) of two studied tree species (Ginkgo biloba and Platanus occidentalis) grown at different locations with different air pollution conditions.
SiteGinkgo bilobaPlatanus occidentalis
JuneAugustJuneAugust
RL 116.9 ± 1.517.1 ± 1.632.0 ± 1.732.5 ± 2.0
RH 216.8 ± 1.717.2 ± 1.932.8 ± 4.333.2 ± 4.4
1 RL, roadsides with low air pollution; 2 RH, roadsides with high air pollution.
Table 2. Frequency of pollutant concentrations above the national baseline at RL and RH during the experimental period.
SiteNO2O3PM10
0.1 ppm/1 h0.06 ppm/24 h0.1 ppm/1 h0.06 ppm/8 h100 μg/m3/24 h
RL 1031393
RH 2201522508
1 RL, roadsides with low air pollution; 2 RH, roadsides with high air pollution.
Table 3. Chlorophyll and carotenoid contents and Chla/b and Car/Chl ratios in Ginkgo biloba and Platanus occidentalis in two different air pollution conditions.
SpeciesSiteChlorophyll
(mg·g−1 FW)
Carotenoid
(mg·g−1 FW)
Chla/b RatioCar/Chl Ratio
Ginkgo bilobaRL 10.680.122.860.18
RH 20.20 ***0.07 *2.25 **0.37 *
Platanus occidentalisRL1.220.162.330.13
RH1.080.122.040.11
1 RL, roadsides with low air pollution; 2 RH, roadsides with high air pollution. Data were analyzed by independent samples t-tests between the two air pollution conditions. Asterisks indicate statistically significant differences according to independent samples t-tests between RL and RH within each tree species (* p < 0.05; ** p < 0.01; *** p < 0.001).
Table 4. Stomatal density and stomatal guard cell length in two different air pollution conditions.
SpeciesTreatmentStomatal Density
(No. mm−2)
Guard Cell Length
(µm)
Ginkgo bilobaRL 169.3 ± 2.316.6 ± 3.0
RH 238.7 ± 2.3 *16.0 ± 2.6
Platanus occidentalisRL246.7 ± 34.9 18.4 ± 2.1
RH170.7 ± 37.220.1 ± 3.3
1 RL, roadsides with low air pollution; 2 RH, roadsides with high air pollution. Data were analyzed by independent samples t-tests between the two air pollution conditions. Asterisks indicate statistically significant differences according to independent samples t-tests between RL and RH within each tree species (* p < 0.05).
Publisher’s Note: MDPI stays neutral with regard to jurisdictional claims in published maps and institutional affiliations.

