Article

The Mechanical Impact of Water Affected the Soil Physical Quality of a Loam Soil under Minimum Tillage and No-Tillage: An Assessment Using Beerkan Multi-Height Runs and BEST-Procedure

1
Council for Agricultural Research and Economics–Research Center for Agriculture and Environment (CREA–AA) Via C. Ulpiani 5, 70125 Bari, Italy
2
Department of Soil Plant and Food Sciences, University of Bari “Aldo Moro” Via G. Amendola 165/a, 70126 Bari, Italy
3
Department of Agricultural Food and Forest Sciences, University of Palermo, Viale delle Scienze, 90128 Palermo, Italy
*
Author to whom correspondence should be addressed.
Land 2021, 10(2), 195; https://doi.org/10.3390/land10020195
Submission received: 15 January 2021 / Revised: 6 February 2021 / Accepted: 11 February 2021 / Published: 15 February 2021

Abstract

:
The multi-height (low, L = 3 cm; intermediate, M = 100 cm; high, H = 200 cm) Beerkan run methodology was applied on both a minimum tilled (MT) (i.e., up to a depth of 30 cm) and a no-tilled (NT) bare loam soil, and the soil water retention curve was estimated by the BEST-steady algorithm. Three indicators of soil physical quality (SPQ), i.e., macroporosity (Pmac), air capacity (AC) and relative field capacity (RFC) were calculated to assess the impact of water pouring height under alternative soil management practices. Results showed that, compared to the reference low run, M and H runs affected both the estimated soil water retention curves and derived SPQ indicators. Generally, M–H runs significantly reduced the mean values of Pmac and AC and increased RFC for both MT and NT soil management practices. According to the guidelines for assessment of SPQ, the M and H runs: (i) worsened Pmac classification of both MT and NT soils; (ii) did not worsen AC classification, regardless of soil management parameters; (iii) worsened RFC classification of only NT soil, as a consequence of insufficient soil aeration. For both soil management techniques, a strong negative correlation was found between the Pmac and AC values and the gravitational potential energy, Ep, of the water used for the infiltration runs. A positive correlation was detected between RFC and Ep. The relationships were plausible from a soil physics point of view. NT soil has proven to be more resilient than MT. This study contributes toward testing simple and robust methods capable of quantifying soil degradation effects, due to intense rainfall events, under different soil management practices in the Mediterranean environment.

1. Introduction

The mechanical impact of water drops, occurring during intense rainfall events, may deteriorate the soil physical properties [1,2,3]. The surface soil structure deterioration can occur due to the breakdown of the chemical-physical bonds responsible for soil aggregation, the displacement of the detached soil particles, and as a consequence of the subsequent re-compaction of the finest soil particles [2,4]. Because of these main processes, a soil seal, that is a relatively dense and compact surface soil layer, generally thin and with low permeability, can be formed [5]. Under specific critical soil conditions, i.e., a sloping bare soil, soil sealing may represent the main cause of surface runoff and erosion during rainstorms [6,7] particularly in arid and semi-arid environments [1,8].
References of literature report that compared to tilled soils, no-tillage (NT) is an agronomic practice that preserves the natural physical soil properties of the whole layer explored by roots. This allowing microbial and biotic activities, and increasing the water infiltration, bulk density, and water content both at wilting point and at field capacity [9,10]. Several works have extensively compared various types of soil management practices, including methods of tillage and crop residue management, compared to the no-tillage of the soil, under rainfall simulation. For example, Andraski et al. [11] investigated the impact of some simulated rainfall intensity during the corn growing season over a four-year period. For this, conventional (moldboard plow) and conservation (i.e., chisel plow or no-tillage) tillage effects on soil surface, i.e., runoff volumes and soil losses, were evaluated. Results showed that, across all sampling dates considered, the no-tillage decreased the soil loss until 90% as compared with conventional tillage, while other treatments reduced it to a lesser extent (about 45–90%). In a study conducted by Carretta et al. [12], aimed at investigating both runoff and soil erosion in a no-tilled soil in comparison with a tilled soil, during the transition period (i.e., a few years after conversion to no-tillage), results showed that the average sediment production under NT was only 47% as compared to conventional tillage (CT). Authors concluded that the observed reduction in runoff and sediment yield under NT may represent on-site benefits both in terms of sustainable soil management techniques and surface water quality. Rodrigo-Comino et al. [13], investigating sloping vineyards in a Mediterranean environment with bare soils, have pointed out that key factors negatively impacted on soil erosion processes are the extreme rainfall events and management practices, i.e., pruning, ploughing, and trampling. Therefore, a high-risk condition can be assumed when the soil is bare, without cover after tillage practices.
Although the literature on this topic is very extensive, the examples reported suggest that conservative (i.e., no-tillage) systems represent a viable solution to manage the soil in a sustainable way and reduce environmental risks. As a consequence, the scientific community has paid close attention to developing new methods, or refining existing ones, to investigate, and attempt to solve, some practical issues [4,14,15,16,17].
Bagarello et al. [18] have proposed a relatively simple infiltration procedure based on combination of multi-height Beerkan experiments and BEST-method application [19] for the estimation of soil hydraulic functions (i.e., soil water retention curve and hydraulic conductivity function) under conditions representative of the late stage of a rainfall event, i.e., when the soil deterioration effects have taken place. In that procedure, single ring infiltrations need to be performed on the soil surface of different sampling sites, because the water is poured from different heights, i.e., from a negligible height to avoid soil compaction (named low, L, about 3 cm), as is usual for the standard BEST-method [19], or from a relatively higher height (named high, H, 150 cm) to induce surface soil degradation. Therefore, the proposed experimental procedure was conceived to compare the hydraulic properties of practically undisturbed soils (L runs) with the soil hydraulic properties modified due to the water impact (H runs).
Castellini et al. [20] have extended the multi-height Beerkan run methodology to account for a larger infiltration surface (177 cm2 instead of 50 cm2), a higher range of water pouring heights, and three water pouring heights (3, 100 and 200 cm). This new procedure was applied to evaluate the effects on a loam soil recently tilled or undisturbed for a long time. The main results showed that: (i) saturated soil hydraulic conductivity significantly and monotonically decreased from the L to H runs, and lower Ks values were always detected under conventional tillage than no-tillage for each water pouring height; and (ii) the water retention scale parameter, hg, estimated by BEST, appreciably changed (i.e., about a factor of two) between non-perturbing (L) and perturbing (M, H) runs. Therefore, the authors concluded that the multi-height Beerkan run methodology is promising because, based on a single infiltration experiment and few routine measurements on the soil (texture, water content and dry bulk density), it allows: (i) studying of the relatively high energy effects on the soil during mimicked heavy rainfall events; and (ii) determining the hydraulic properties under such conditions and for different soil management practices [20]. However, to date, the methodology has not yet been applied for investigations on the physical quality of the soil.
The soil physical quality (SPQ) estimation makes use of capacitive soil indicators (among others, macroporosity, air capacity, plant available water capacity) obtained from the soil water retention curve [21,22]. They have proven to be a useful diagnostic tool for evaluating the environmental sustainability of Mediterranean agroecosystems [23,24,25,26]. In order to investigate the effect of the mechanical impact of water drops on soil water retention, a possible solution could be to sample undisturbed soil cores at the end of the M or H infiltration tests. However, uncertainty in estimates due to probable over-compaction is likely to be obtained. This is especially true when the soil is saturated or near saturated. Additionally, the timing of soil sampling is difficult to establish because the effects of water pouring heights could be transitory and not known a priori. In this regard, the BEST-derived soil water retention curves can be used to quantify the effects on SPQ. Consequently, the combination of Beerkan multi-height runs and BEST methods represents a possible experimental alternative, relatively simple and accurate, to investigate the aforementioned impact on soils, where opposite soil porosity conditions were established, as a consequence, for example, of long-term no-tilled (NT) and recently tilled (MT) soil conditions. Furthermore, the experimental information obtained could be easily extended to real field conditions, because the sustainability of no-tillage systems is a current research topic in the Mediterranean area [27,28].
The main aim of this study was to investigate the effects of mechanical impact of different heights of water pouring (low, L = 3 cm; intermediate, M = 100 cm; high, H = 200 cm) on the SPQ of NT and MT loam soil. For this, coupled Beerkan multi-height runs and BEST method were applied with the objective to estimate capacitive soil physical quality indicators, i.e., macroporosity, air capacity and relative field capacity from the soil water retention and then assessing the induced effects on porous medium, in agreement with literature guidelines.

2. Materials and Methods
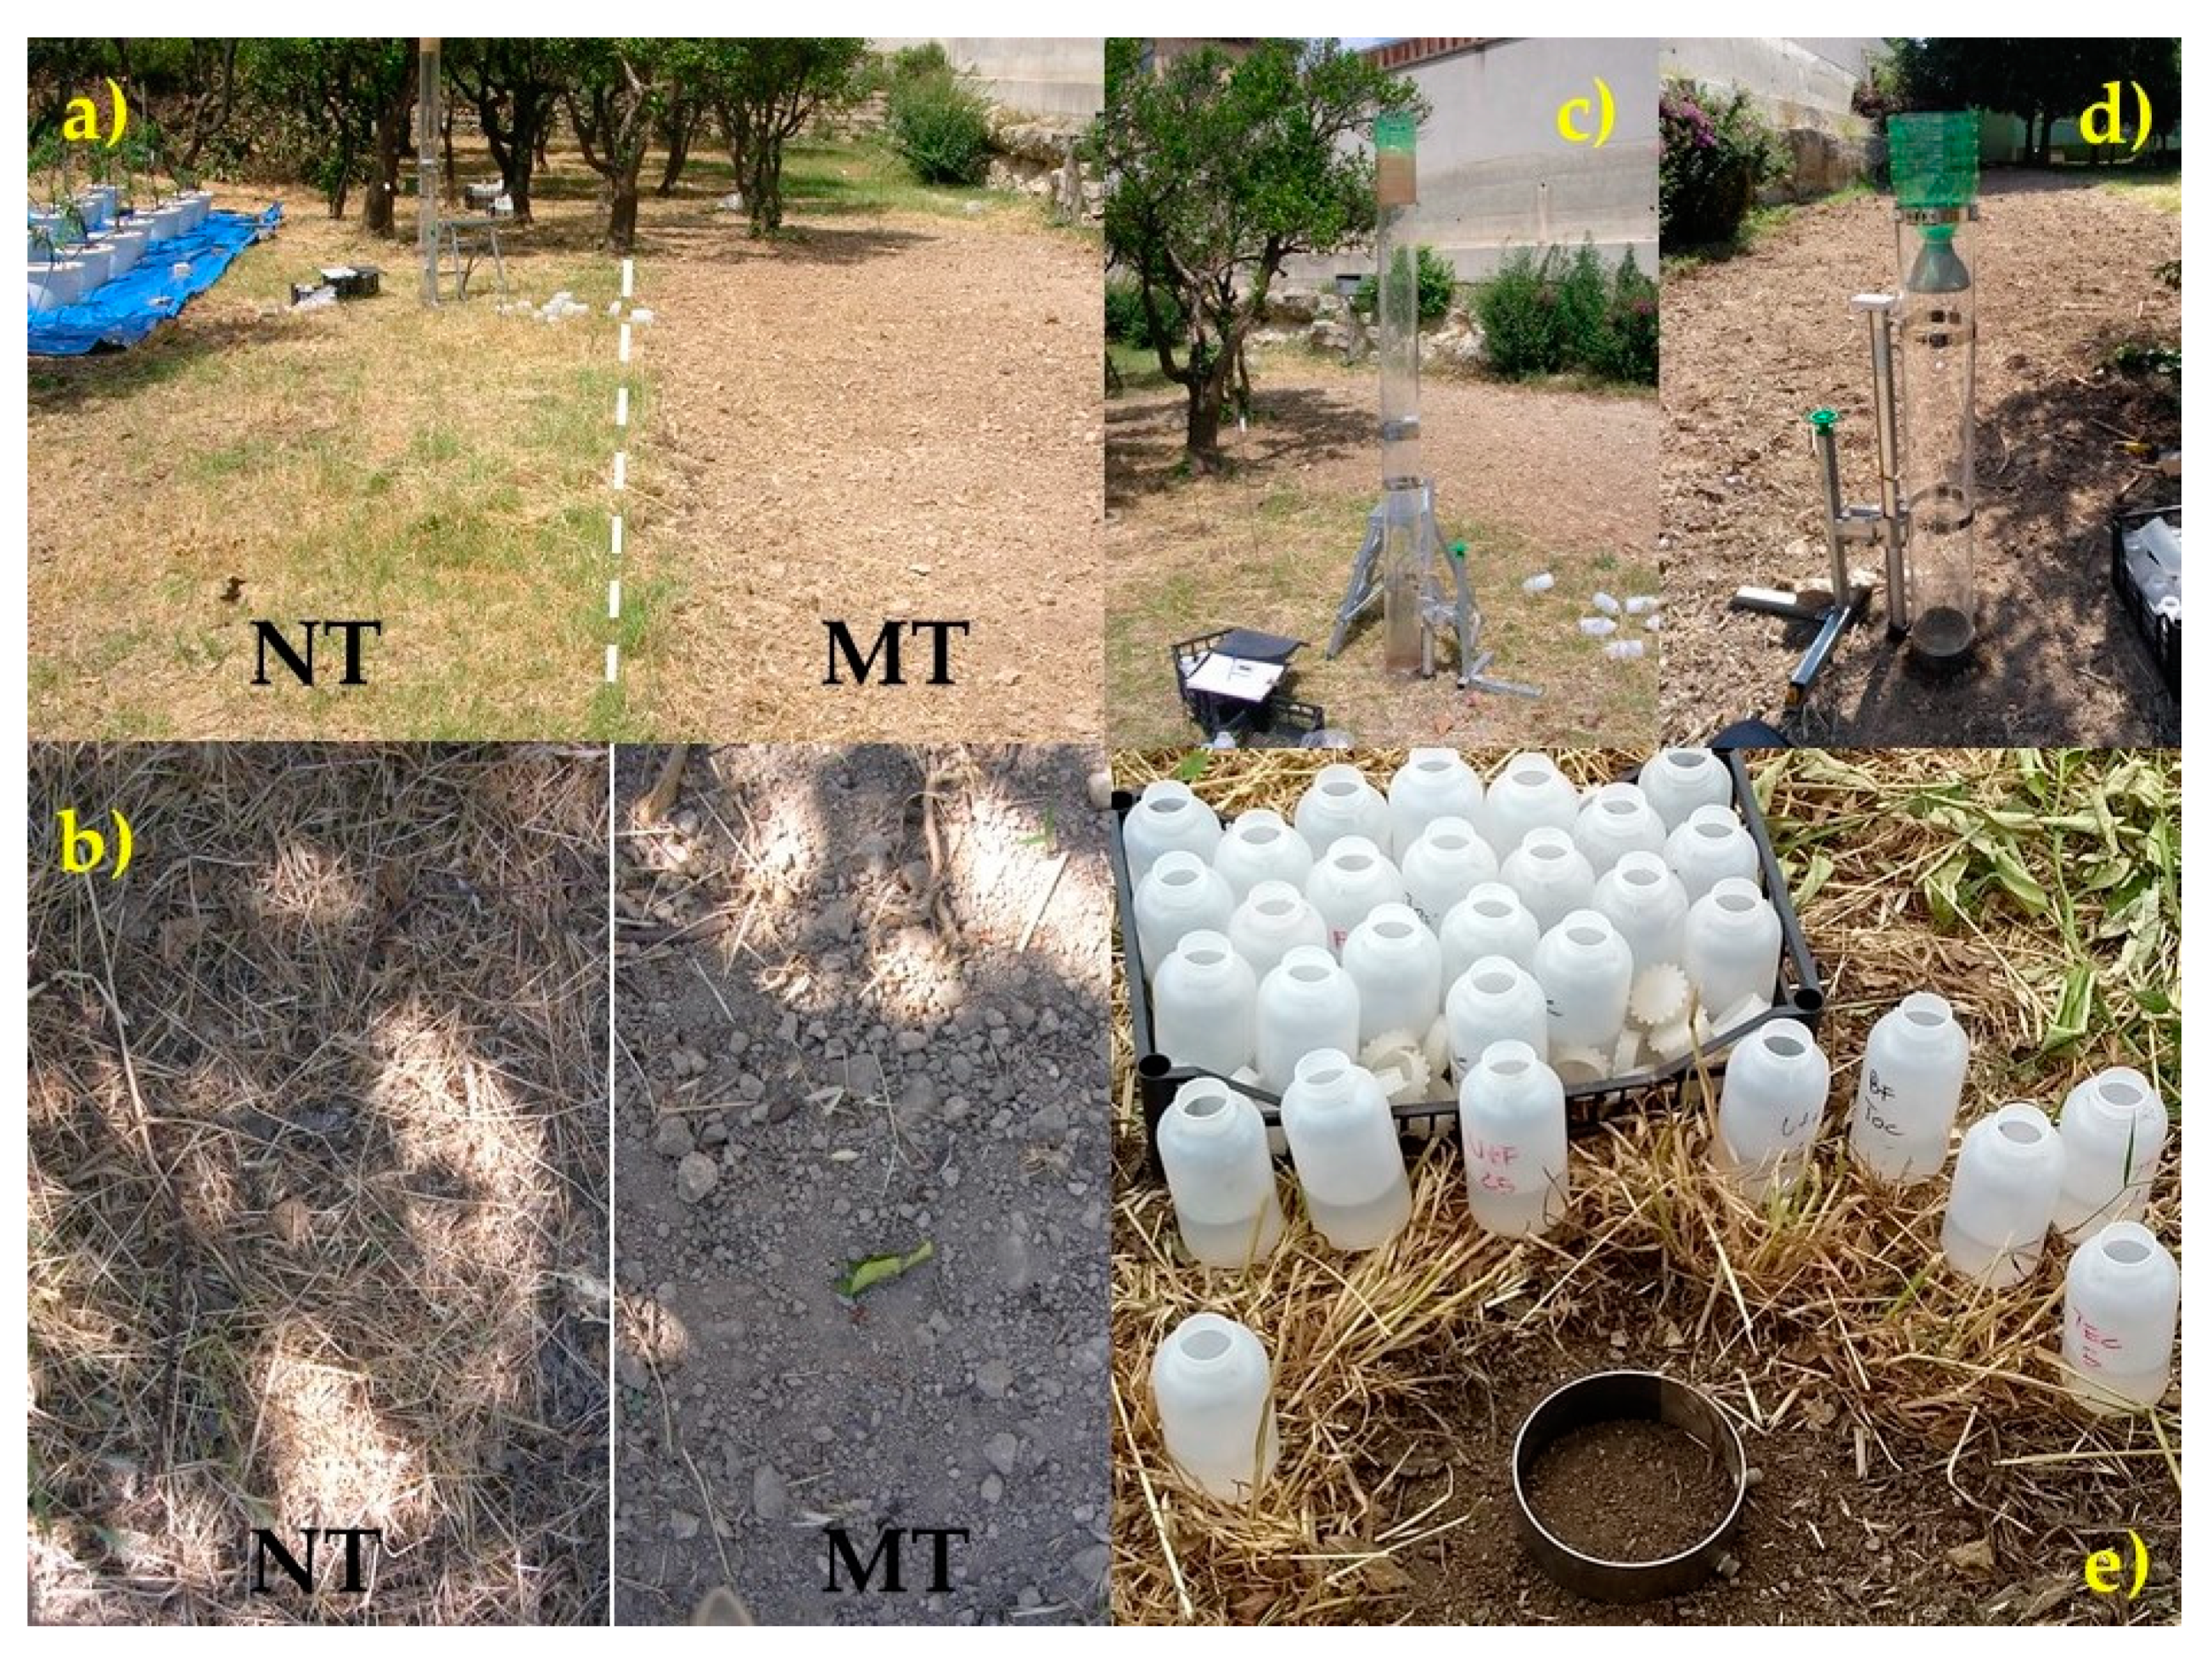
2.1. Field Site

This investigation was carried out at the experimental field of the Council for Agricultural Research and Economics, Research Center for Agriculture and Environment (CREA–AA) of Bari, Italy (41°06′37.31″ N, 16°52′40.12″ E) (Figure S1). The field site is in the Mediterranean region with warm temperate climate, and hot and dry summer. The mean annual temperature is 16.1 °C with a mean annual precipitation of 567 mm, calculated over the period 1995–2015 [29]. Using the aridity index defined by Holdridge et al. [30] the climate of the region was classified as dry [23,29].
The experimental field was fallow and undisturbed for at least five years, and the most representative spontaneous species was the common wood sorrel (Oxalis pes-caprae L.). According to the USDA classification, the investigated soil was a loam, with 43.2% and 17.2% of sand and clay, respectively [20]. An experimental area of about 200 m2 was selected and split in two parts in order to establish the two alternative soil management conditions (Figure 1). At the beginning of April 2018, half of the selected area was tilled with a rotary tiller up to a depth of about 30 cm to establish a minimum tilled (MT) plot, while the other half was cleaned by vegetation with a brush cutter and the vegetation was left in situ (no-tilled, NT, plot). This operation was made under relatively dry soil condition to prevent soil compaction.
One week after plot preparation, twelve sampling points were established for the given soil management parameters (MT and NT) and 36 Beerkan experiments were carried out using three heights of water pouring [20]. For a given soil management practice, water was poured from about 3 cm (low height runs, L; n = 12), 100 cm (intermediate height runs, M; n = 12) and 200 cm (high height runs, H; n = 12) (i.e., 2 treatments × 3 heights × 12 replicates). Beerkan experiments were conducted using fifteen volumes of water of 200 mL each. Field experiments ended in August and no precipitation occurred in the months of the investigation.

2.2. BEST Procedure and Soil Physical Quality Estimation

The BEST procedure by Lassabatere et al. [19] was applied to estimate the soil water retention curve. Therefore, at each sampling site, the following determinations were made: (i) soil bulk density (BD), using soil cores of 10 cm in height by 5 cm in diameter (196 cm3); (ii) soil porosity, estimated from BD, considering a mean particle density of 2.65 g cm−3; (iii) gravimetric soil water content at the time of infiltration run, using the soil sample collected for BD determination; and the (iv) percentages of clay, silt, and sand, according to the USDA classification.
Briefly, the BEST-method uses the van Genuchten [31] model with the Burdine [32] condition for the water retention curve (Equations (1) and (2)), and the Brook and Corey [33] model for hydraulic conductivity (Equations (3) and (4)):
θ θ r θ s θ r = [ 1 + ( h h g ) n ] m
m = 1 1 n
K ( θ ) K s = ( θ θ r θ s θ r ) η
η = 2 m n + 2 + p
where θ (L3L−3) is the volumetric soil water content, h (L) is the soil water pressure head, K (L T−1) is the unsaturated soil hydraulic conductivity, n (>2), m and η are shape parameters, p is a tortuosity parameter set equal to 1 following Burdine’s [32] condition, while hg (L), θs (field saturated soil water content; L3L−3), θr (residual soil water content; L3L−3), and Ks (field saturated hydraulic conductivity; LT−1) are scale parameters. In BEST, θr is assumed to be zero. Shape parameters, which are texture-dependent, are estimated from particle-size analysis and soil bulk density measurement, assuming a shape similarity between the particle-size distribution and the water retention curve [34].
The pedotransfer function by Minasny and McBratney [35] was applied to estimate the shape parameters from mean values (namely, for a given sampling point) of clay, silt and sand percentages measured at each sampling site [27,36]. Three alternative calculation algorithms were developed to analyze field infiltration data, i.e., BEST-slope [14], BEST-intercept [37], and BEST-steady [38]. They use the same experimental information (i.e., soil particle size distribution or soil texture, soil bulk density, volumetric soil water content at the time of experiment and cumulative infiltration), but differ in the procedure to fit the infiltration models for transient and steady states to the experimental data [16]. The scale parameter of the soil water retention curve, hg, is estimated by the equation:
h g = S 2 c p ( θ s θ i ) [ 1 ( θ i θ s ) η ] K s
where S (LT−1/2) is the soil sorptivity and cp is a coefficient dependent on n and m according to Equation (6) by Lassabatere et al. [19]. Castellini et al. [39] analytically showed that BEST-intercept and BEST-steady yielded an identical hg estimate. Therefore, two estimates of the soil water retention curve were obtained, depending on the use of the chosen algorithm, i.e., BEST-slope or BEST-intercept/steady. Previous studies [16,20] found that BEST-steady is the most appropriate calculation algorithm for multi-height infiltration tests. However, it was expected that water pouring heights can also affect the transient phase of the infiltration process [16]; therefore, a preliminary check of BEST-slope and BEST-intercept was also conducted. The reliability of the different BEST algorithms was evaluated in terms of success rate in providing complete soil hydraulic characterization and fitting performance of the infiltration model to the transient data. This latter parameter was evaluated only for BEST-slope and BEST-intercept, which make use of transient data by calculating the percentage relative fitting error, RE, as suggested by Lassabatere et al. [19]:
R E = i = 1 k [ I e x p ( t i ) I m o d ( t i ) ] 2 i = 1 k I e x p ( t i ) 2   × 100
where Iexp and Imod stand for experimental and modelled cumulative infiltrations, respectively, and k is the number of experimental data points selected to fit the transient state model. Further information on the BEST method can be found in the original paper by Lassabatere et al. [19] and the review by Angulo-Jaramillo et al. [40].
The soil water retention curve estimated by BEST-steady was used to calculate three soil physical quality indicators, namely, macroporosity (Pmac), air capacity (AC) and relative field capacity (RFC):
P m a c = θ s θ 10
A C = θ s θ 100
R F C = θ 100 θ s
where θ10 and θ100 represent the volumetric water content corresponding to h = −10 and −100 cm, indicating the volume of pores less than 0.3 mm equivalent diameter and the field capacity, respectively [21].
The impact of water pouring height on SPQ assessment was conducted on the basis of literature indications [21,22]. Specifically, SPQ values were classified as optimal when the average values for the considered indicators fell within the following ranges: (i) 0.04 ≤ Pmac ≤ 0.10 cm3 cm−3; (ii) 0.10 ≤ AC ≤ 0.26 cm3 cm−3; (iii) 0.6 ≤ RFC ≤ 0.7.
For each main variable considered in this investigation (BD, Pmac, AC and RFC), a given dataset was summarized by calculating the arithmetic mean and the associated coefficient of variation, and variables were assumed to be normally distributed, as commonly suggested in the literature (among others, Castellini et al. [22]). A preliminary linear correlation analysis was carried out among main variables to check relationships between the independently measured bulk density and the capacitive SPQ indicators (Pmac, AC and RFC) obtained by BEST. The impact of soil management and water pouring height on correlations was also explored. For a given soil management practice, a Tukey HSD test was used to compare the mean values of SPQ indicators corresponding to the water pouring heights. A two tailed t-test was used to compare, for a given water height, the effects of soil management practices. A probability level of p = 0.05 was always assumed, unless otherwise specified.

3. Results

3.1. Soil Condition at the Time of Infiltration Experiments

The initial soil condition showed soil bulk density and volumetric water content values equal to 1.2389 g cm−3 and 0.0860 cm3 cm−3 (coefficients of variation, CV, equal to 7.6 and 26.0%, respectively) under MT, and equal to 1.2646 g cm−3 and 0.1002 cm3 cm−3 (CV equal to 6.1 and 20.7%) under NT. Consequently, estimated saturated soil water contents from soil bulk density were 0.5325 cm3 cm−3 and 0.5228 cm3 cm−3, under MT and NT, respectively.

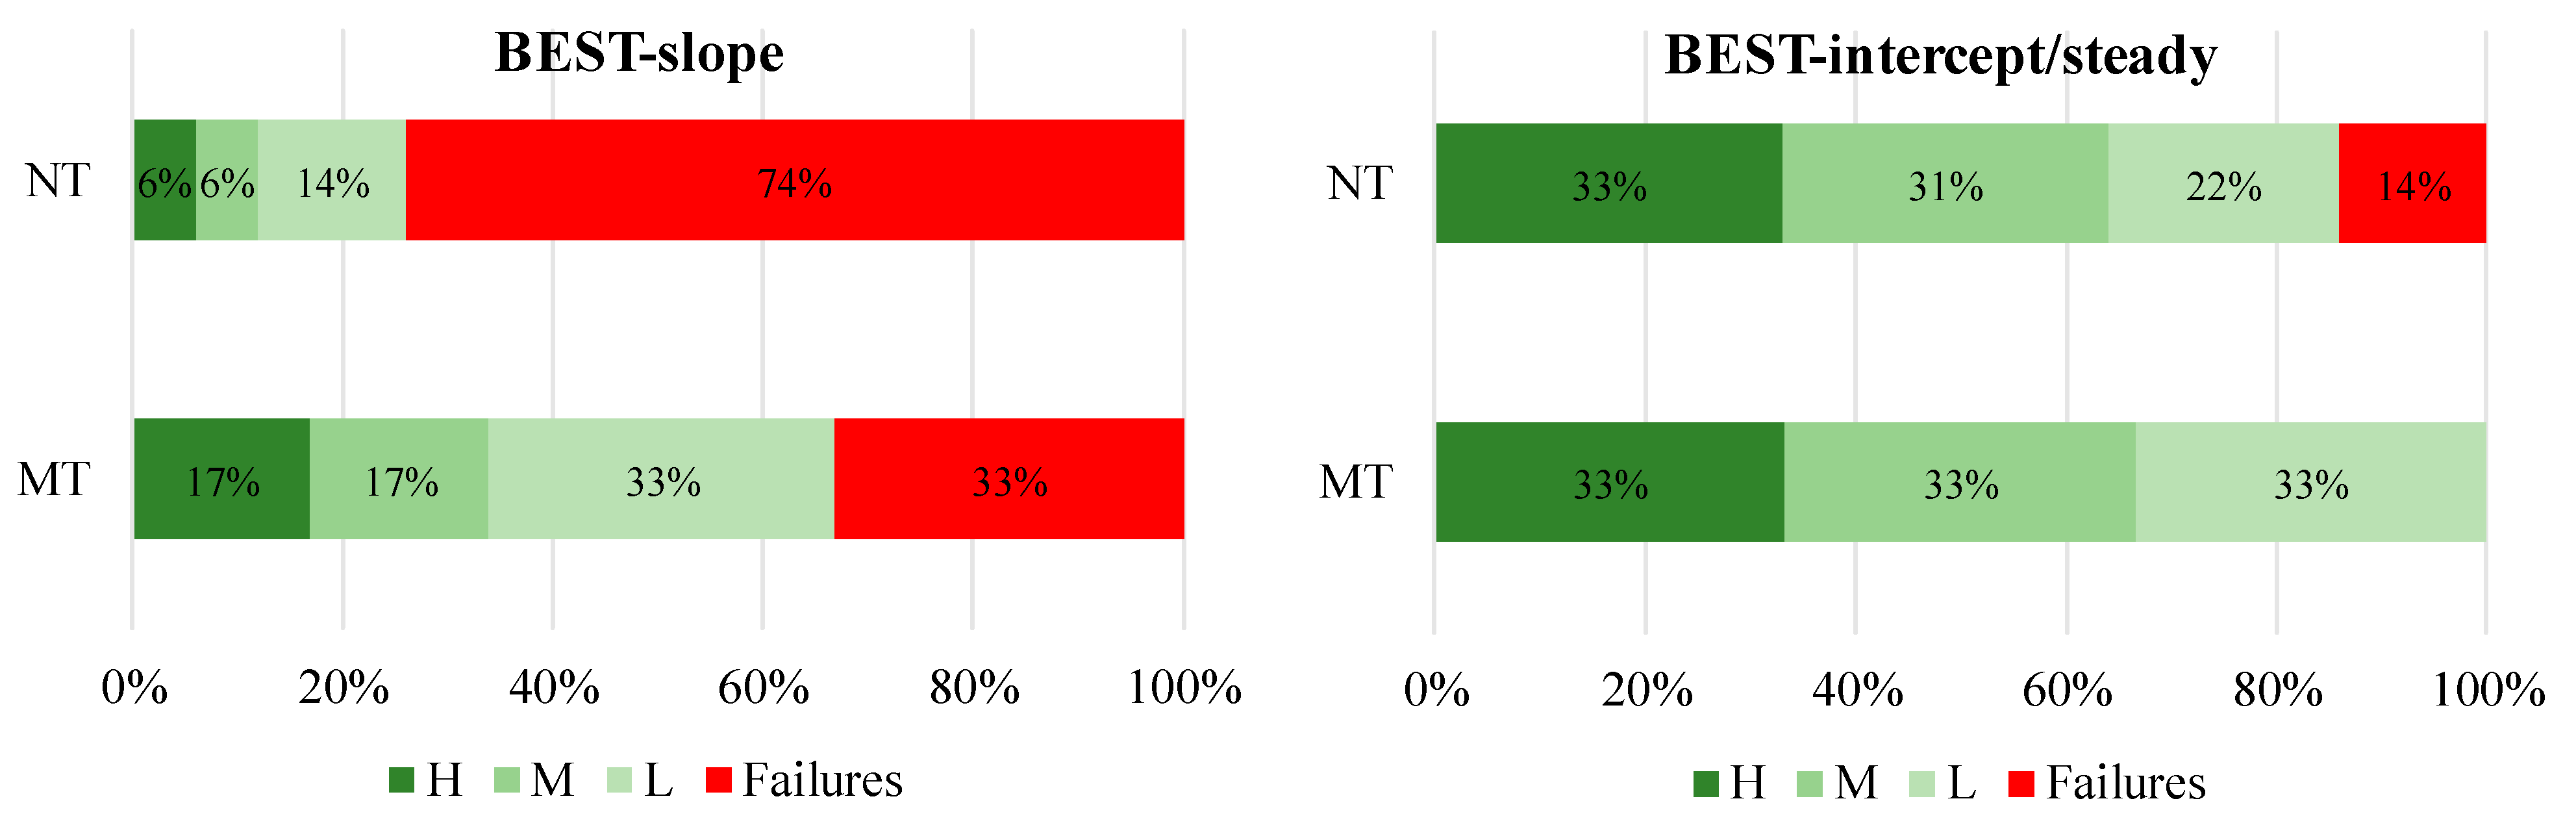
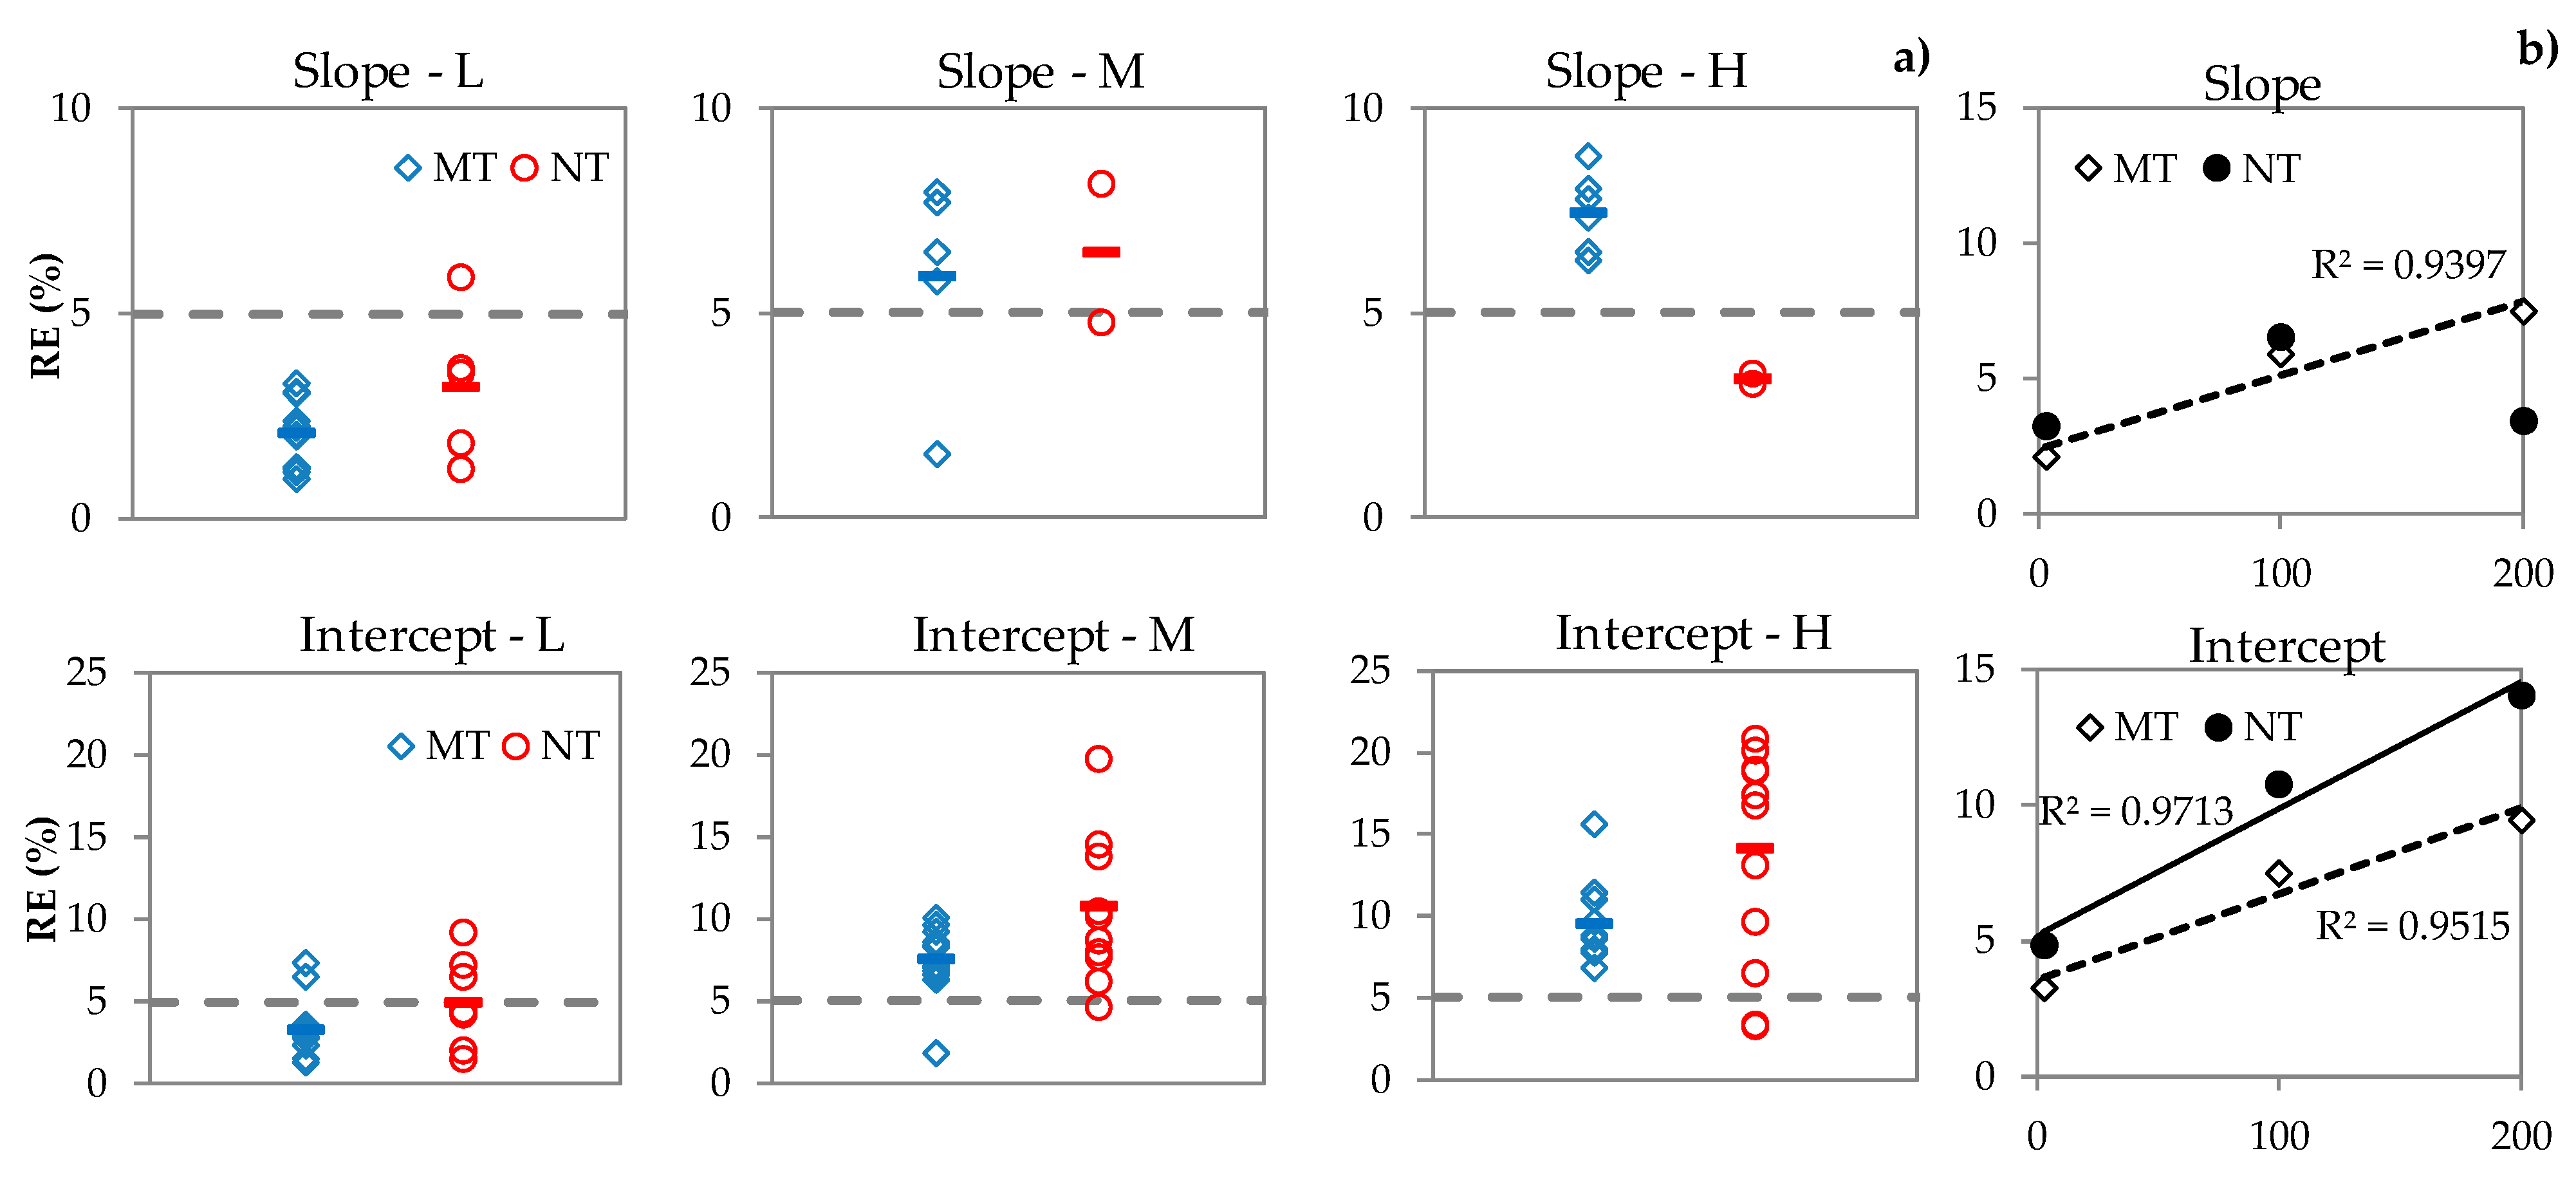
3.2. Evaluation of the BEST-Algorithms for Multi-Height Experiments

The three BEST-algorithms resulted in a different efficiency in providing a complete soil hydraulic characterization (Figure 2). BEST-slope failed in about 74% of the analyzed runs (i.e., 27/36) under NT and in 33% (12/36) under MT. The reasons are due to the relatively low ability of the BEST-slope algorithm to yield valid estimations of saturated hydraulic conductivity (Ks) and soil sorptivity (S) under the specific experimental conditions considered (i.e., soil physical status and height of water pouring). Moreover, in other two runs (one MT-M and one NT-L) BEST-slope provided unreasonably high values of the hg parameter (i.e., about 8000–9000 mm) and, therefore, these runs were discarded. The relatively low efficiency of BEST-slope compared to the other BEST-algorithms is quite well known in the literature [40]. However, our results showed that the water pouring height affected the efficiency, because the failure rate increased by a factor two (i.e., M and L) or three (H) passing from NT to MT (Figure 2). On the contrary, BEST-intercept and BEST-steady were more efficient because they provided soil hydraulic estimations in 85–100% of the analyzed runs under NT-MT.
The accuracy of BEST-algorithms that make use of the transient infiltration data, i.e., BEST-slope and BEST-intercept, under different water pouring heights was further evaluated. Figure 3 summarizes the relationship between the percentage relative error (RE) of fitting for BEST-slope and BEST-intercept, as a function of water pouring height (i.e., L, M and H), under MT and NT. Overall, relatively higher RE values were observed for H runs and lower for L runs, with the only exception of slope-H under NT for which only two data values were available (Figure 3a). Regardless of the algorithm considered, the mean values of RE were lower than the suggested threshold (5%) only under L runs. As expected, RE increased as the disturbance on the soil surface increased (Figure 3b). Overall, large RE values may occur when the assumed infiltration model is not adequate for the studied soil or infiltration measurements have a poor quality [18,41]. In this case, comparatively higher RE values are linked only to the perturbative effect due to the higher water heights (M and H), as verified in previous investigations [18]. Due to the relatively high percentage of failure of BEST-slope and the inaccurate fitting of the transient infiltration data for the higher water pouring heights by both BEST-slope and BEST-intercept, soil water retention curves were estimated by BEST-steady.

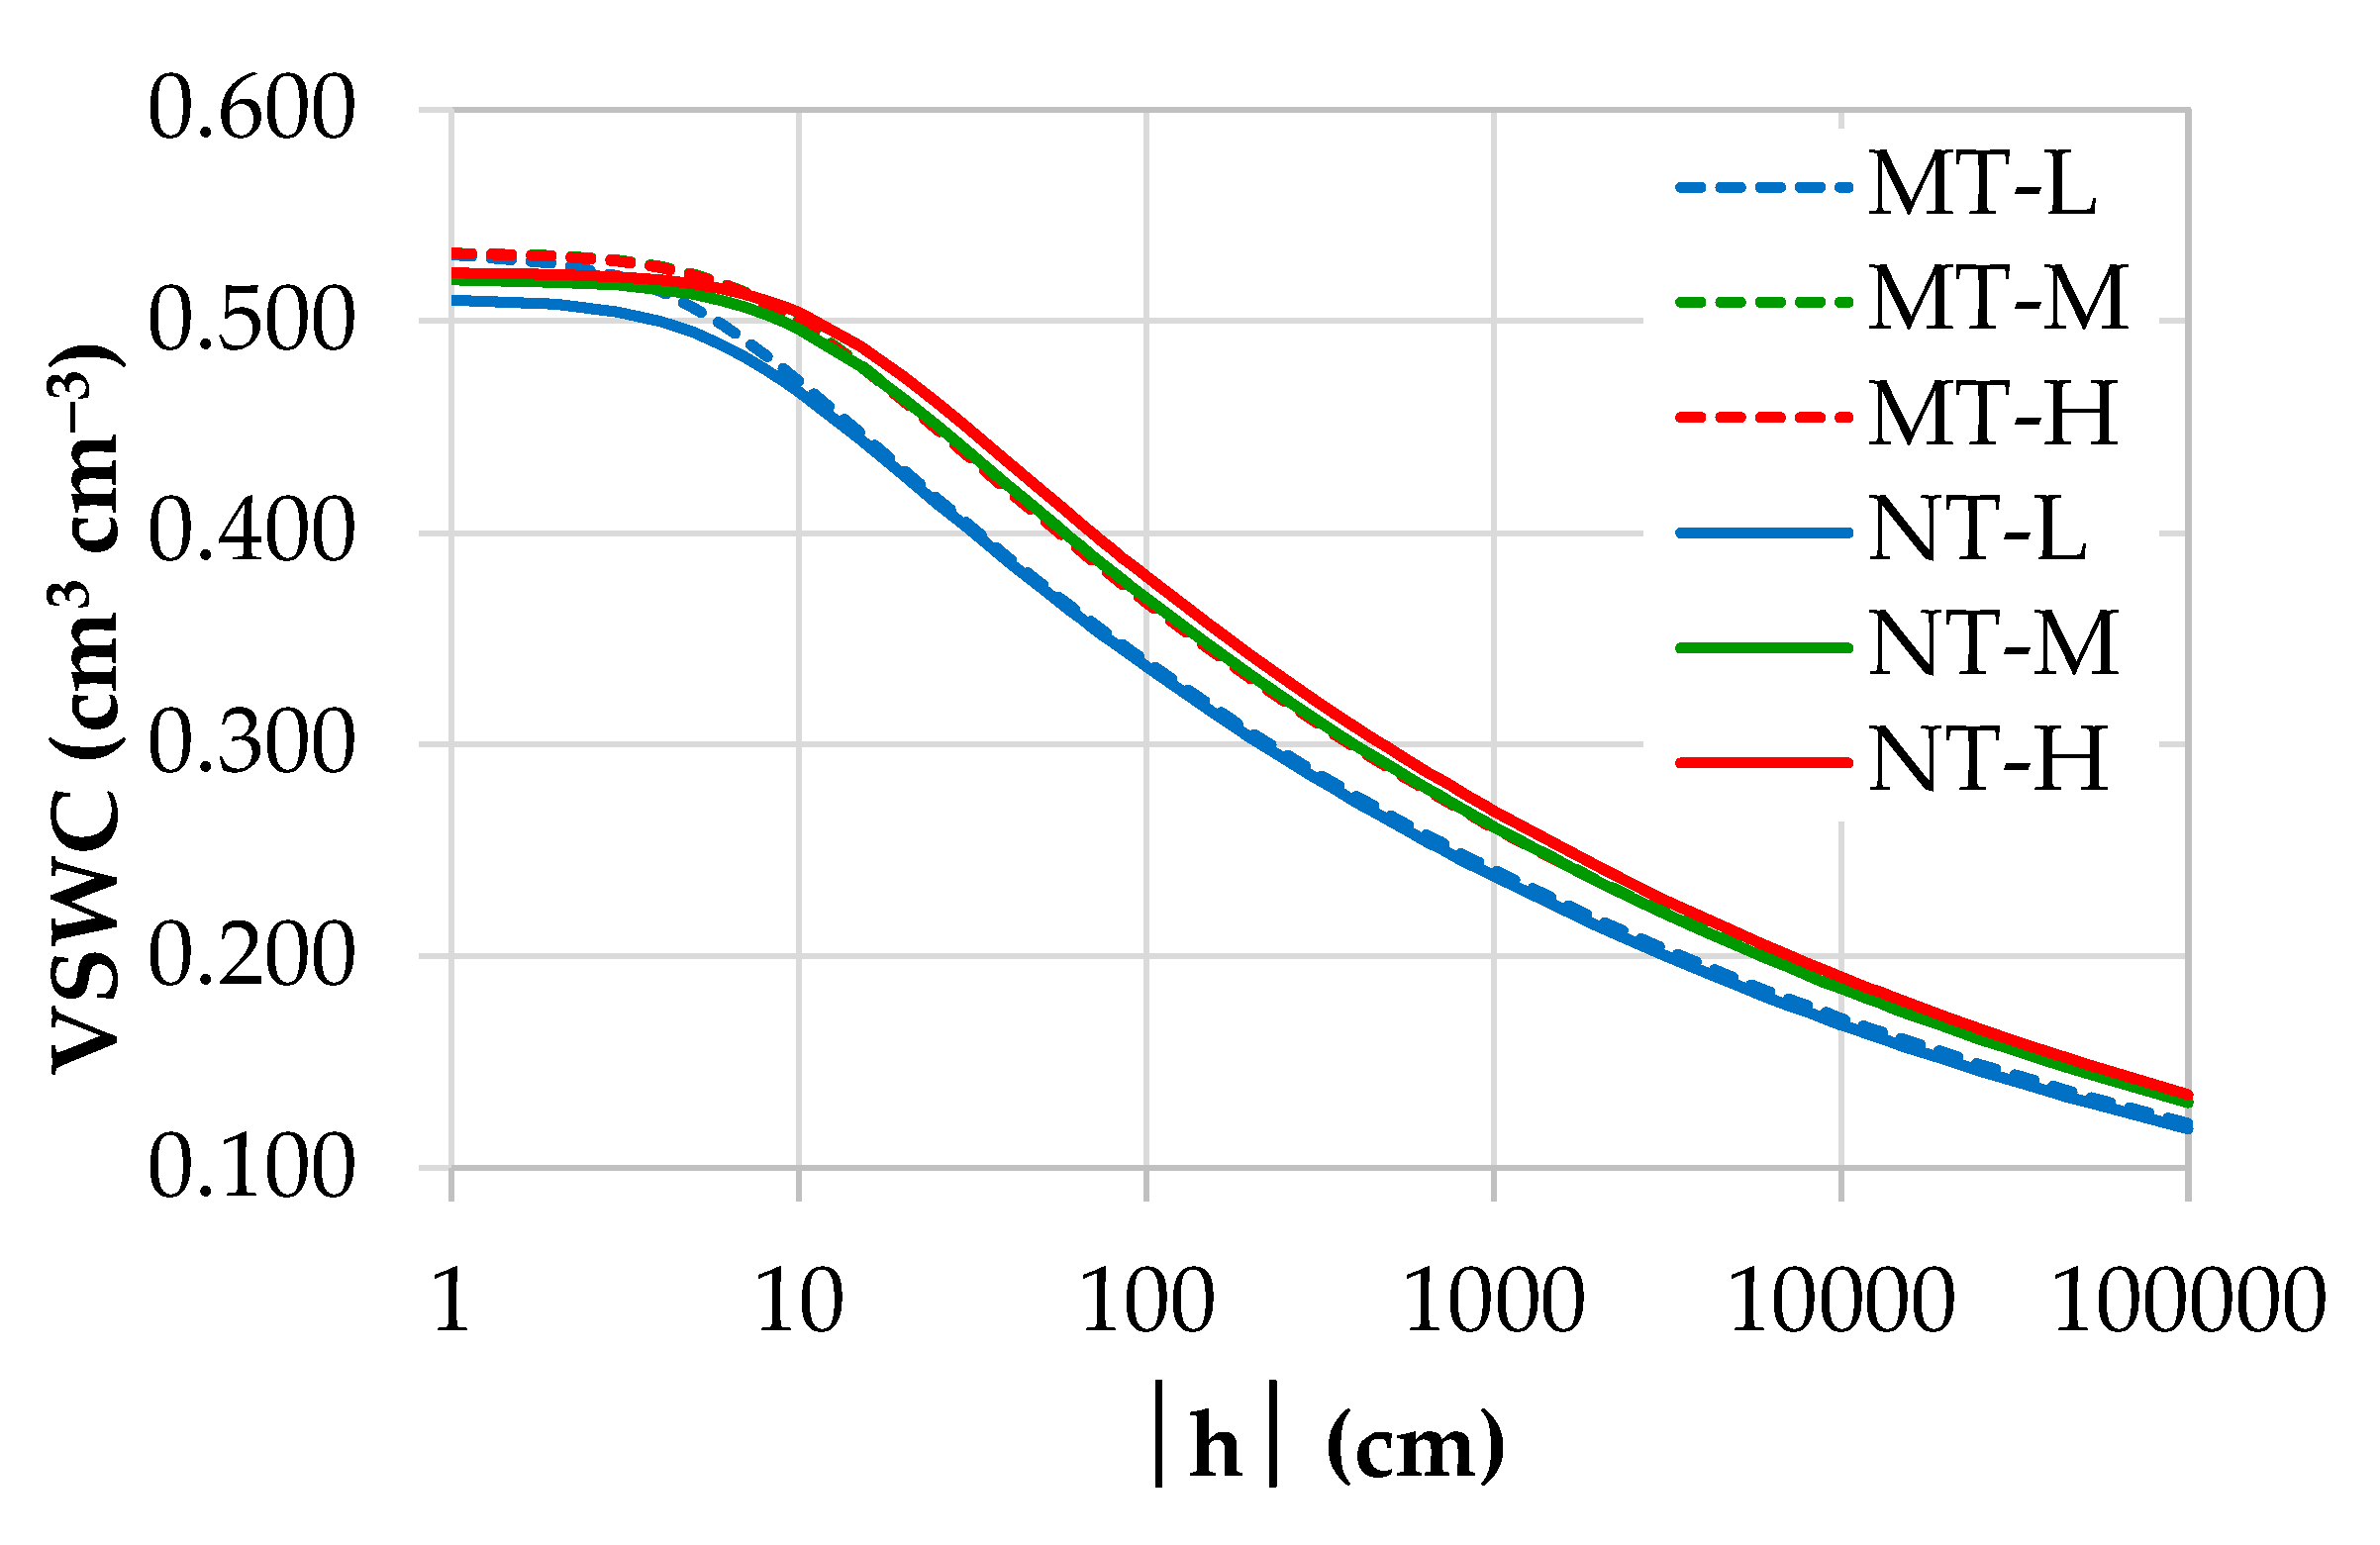
3.3. Soil Water Retention Curve Estimation

The estimated soil water retention curves determined for NT and MT, and the different heights of water pouring are depicted in Figure 4. The corresponding parameters of van Genuchten model are reported in Table 1. A visual inspection shows small differences among curves. Relatively lower values of soil water retention were detected when L runs were considered, while M–H curves overlapped. Following application of the BEST procedure, the estimated soil water retention curves mainly changed according to the scale parameter, hg. Indeed, a clear increase in hg was observed, in both soil management practices as the water pouring height increased from 3 cm (L run) to 100 cm (M run) (Table 1). Practically, this more appreciably affected the water retention for L–M runs, with a maximum (max) percentage difference between the two θ predictions for a given h of 3.65% (mean = 2.42%) or 3.36% (mean = 2.13%) under NT or MT, respectively. Increasing the water pouring height up to 200 cm resulted in minimum (NT) or negligible (MT) increase in hg, and the θ values increased a little more under NT (max = 4.75%; mean = 3.16%) or were practically equivalent (max = 3.27%; mean = 2.07%) under MT. Regardless of soil management technique, the maximum differences were in the range 20 < h < 30 cm. The other model parameters (θs, n, m) were the same under MT (100% success rate) because similar initial soil conditions were considered for the three Beerkan tests (L, M and H) conducted at each site. Slight differences were obtained under NT because the different heights were characterized by a different sample size (86% success rate). The mean retention curves were used to estimate the SPQ indicators for the different heights of water pouring and soil management parameter.

3.4. Linear Correlations among Soil Properties

A preliminary check on correlation among the estimated SPQ indicators, i.e., relative field capacity, RFC, air capacity, AC, macroporosity, Pmac, obtained by BEST-steady and soil bulk density, BD, is reported in Table 2. Overall, the expected correlations were obtained when L or M runs were considered, because AC and Pmac decreased and RFC increased as BD increased, both under MT and NT. However, only AC and Pmac yielded significant linear correlations. Conversely, more uncertain (ACPmac vs. BD) or unexpected (i.e., RFC decreasing at increasing BD) correlations were obtained when H runs were considered, and a significant inverse relationship between AC and BD was only maintained under NT soil (Table 2). Therefore, based on correlation analysis, only H runs seems to have influenced the SPQ estimates while M results were similar to the reference ones (L).

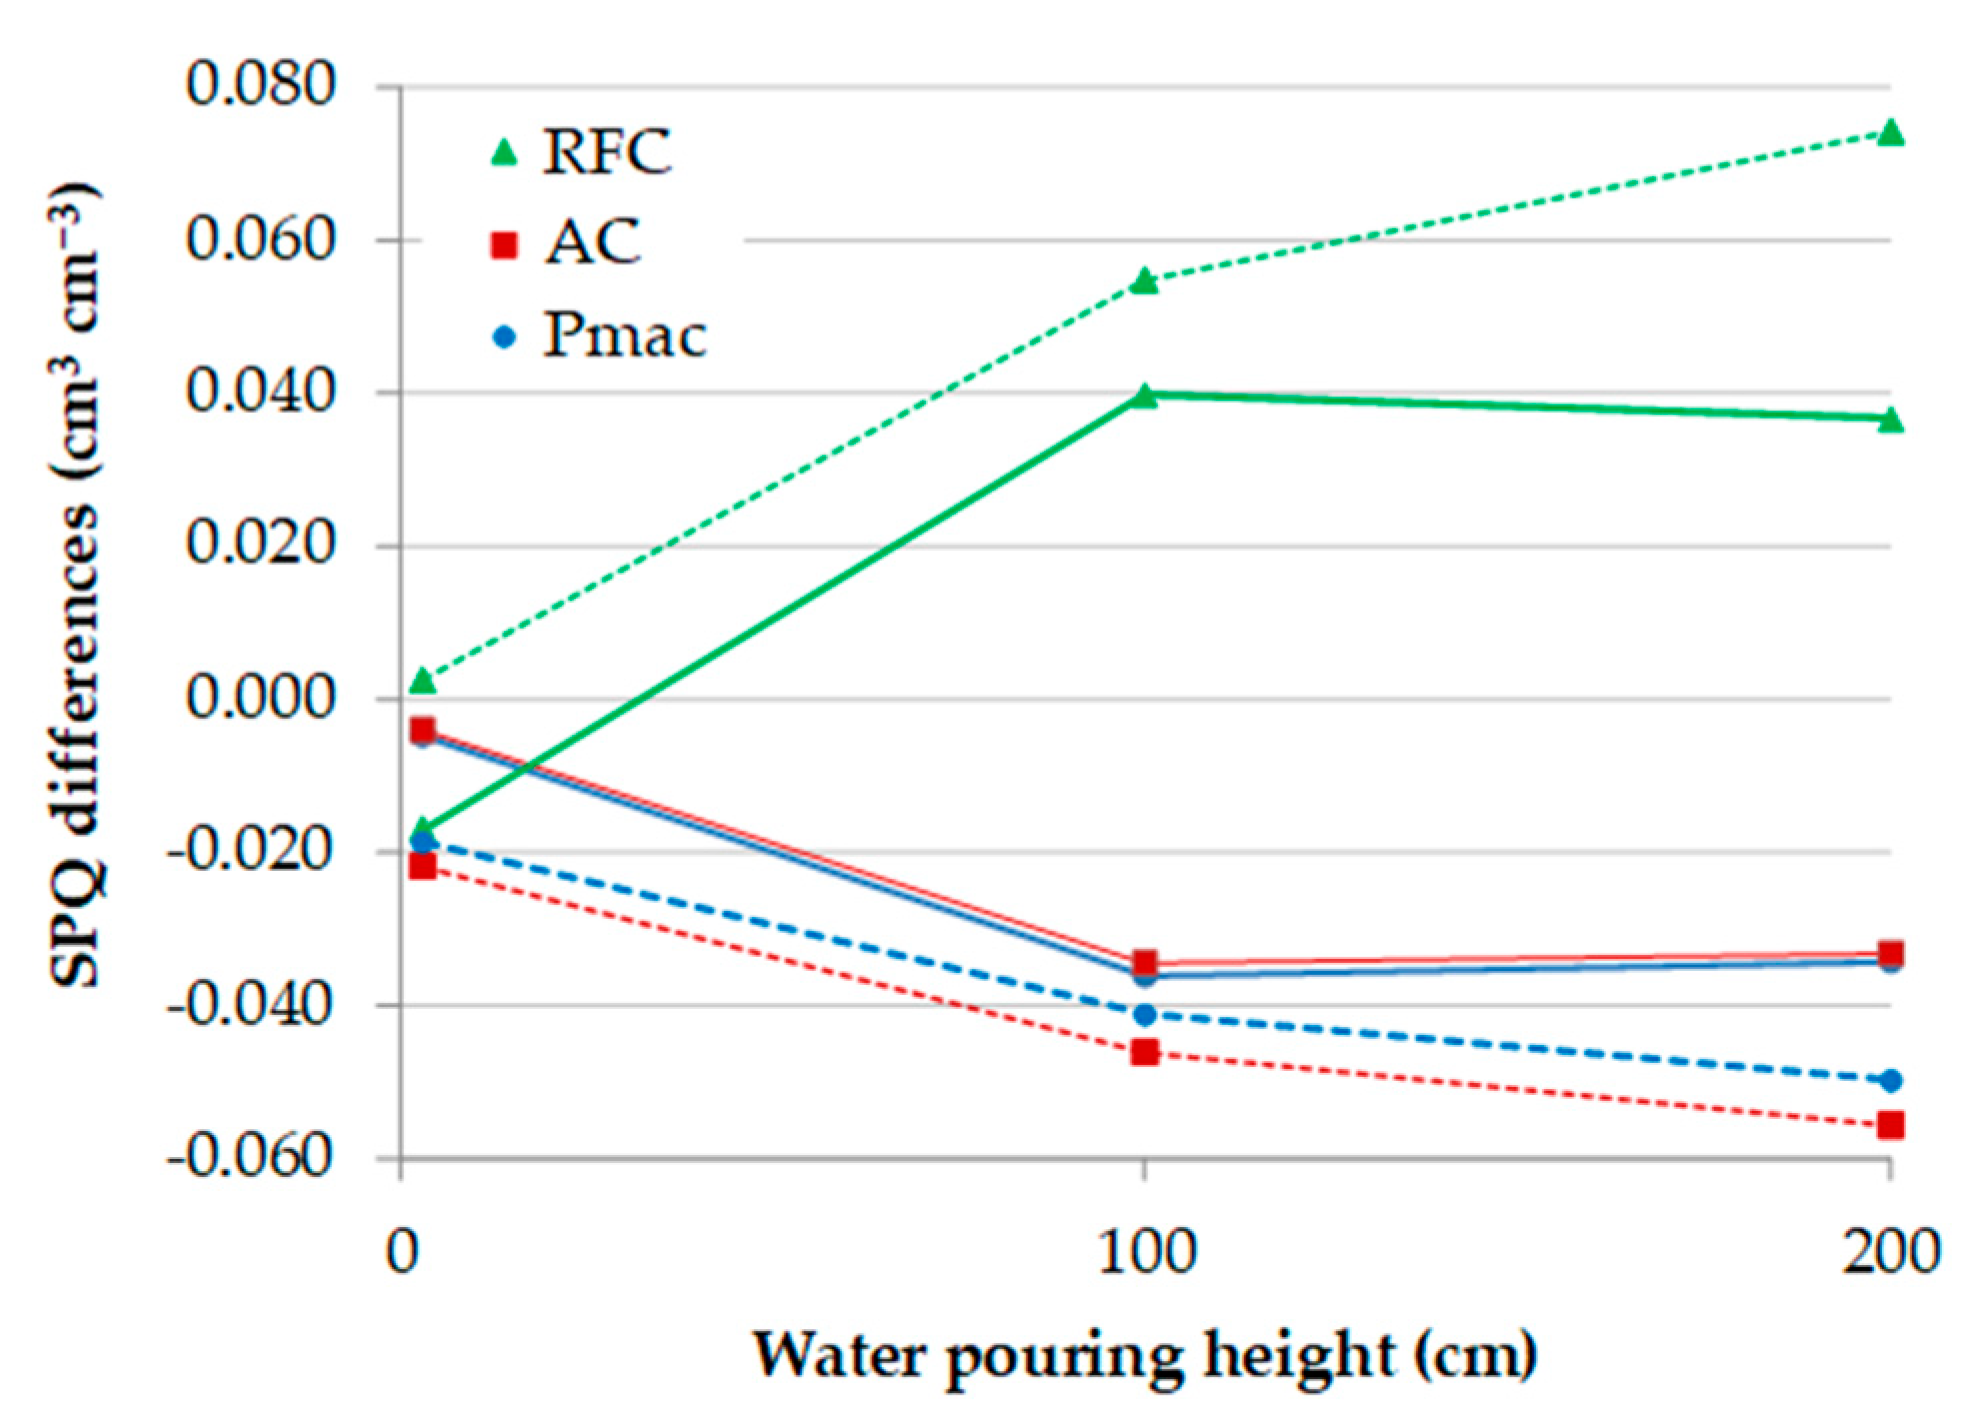
3.5. Soil Physical Quality Eestimation

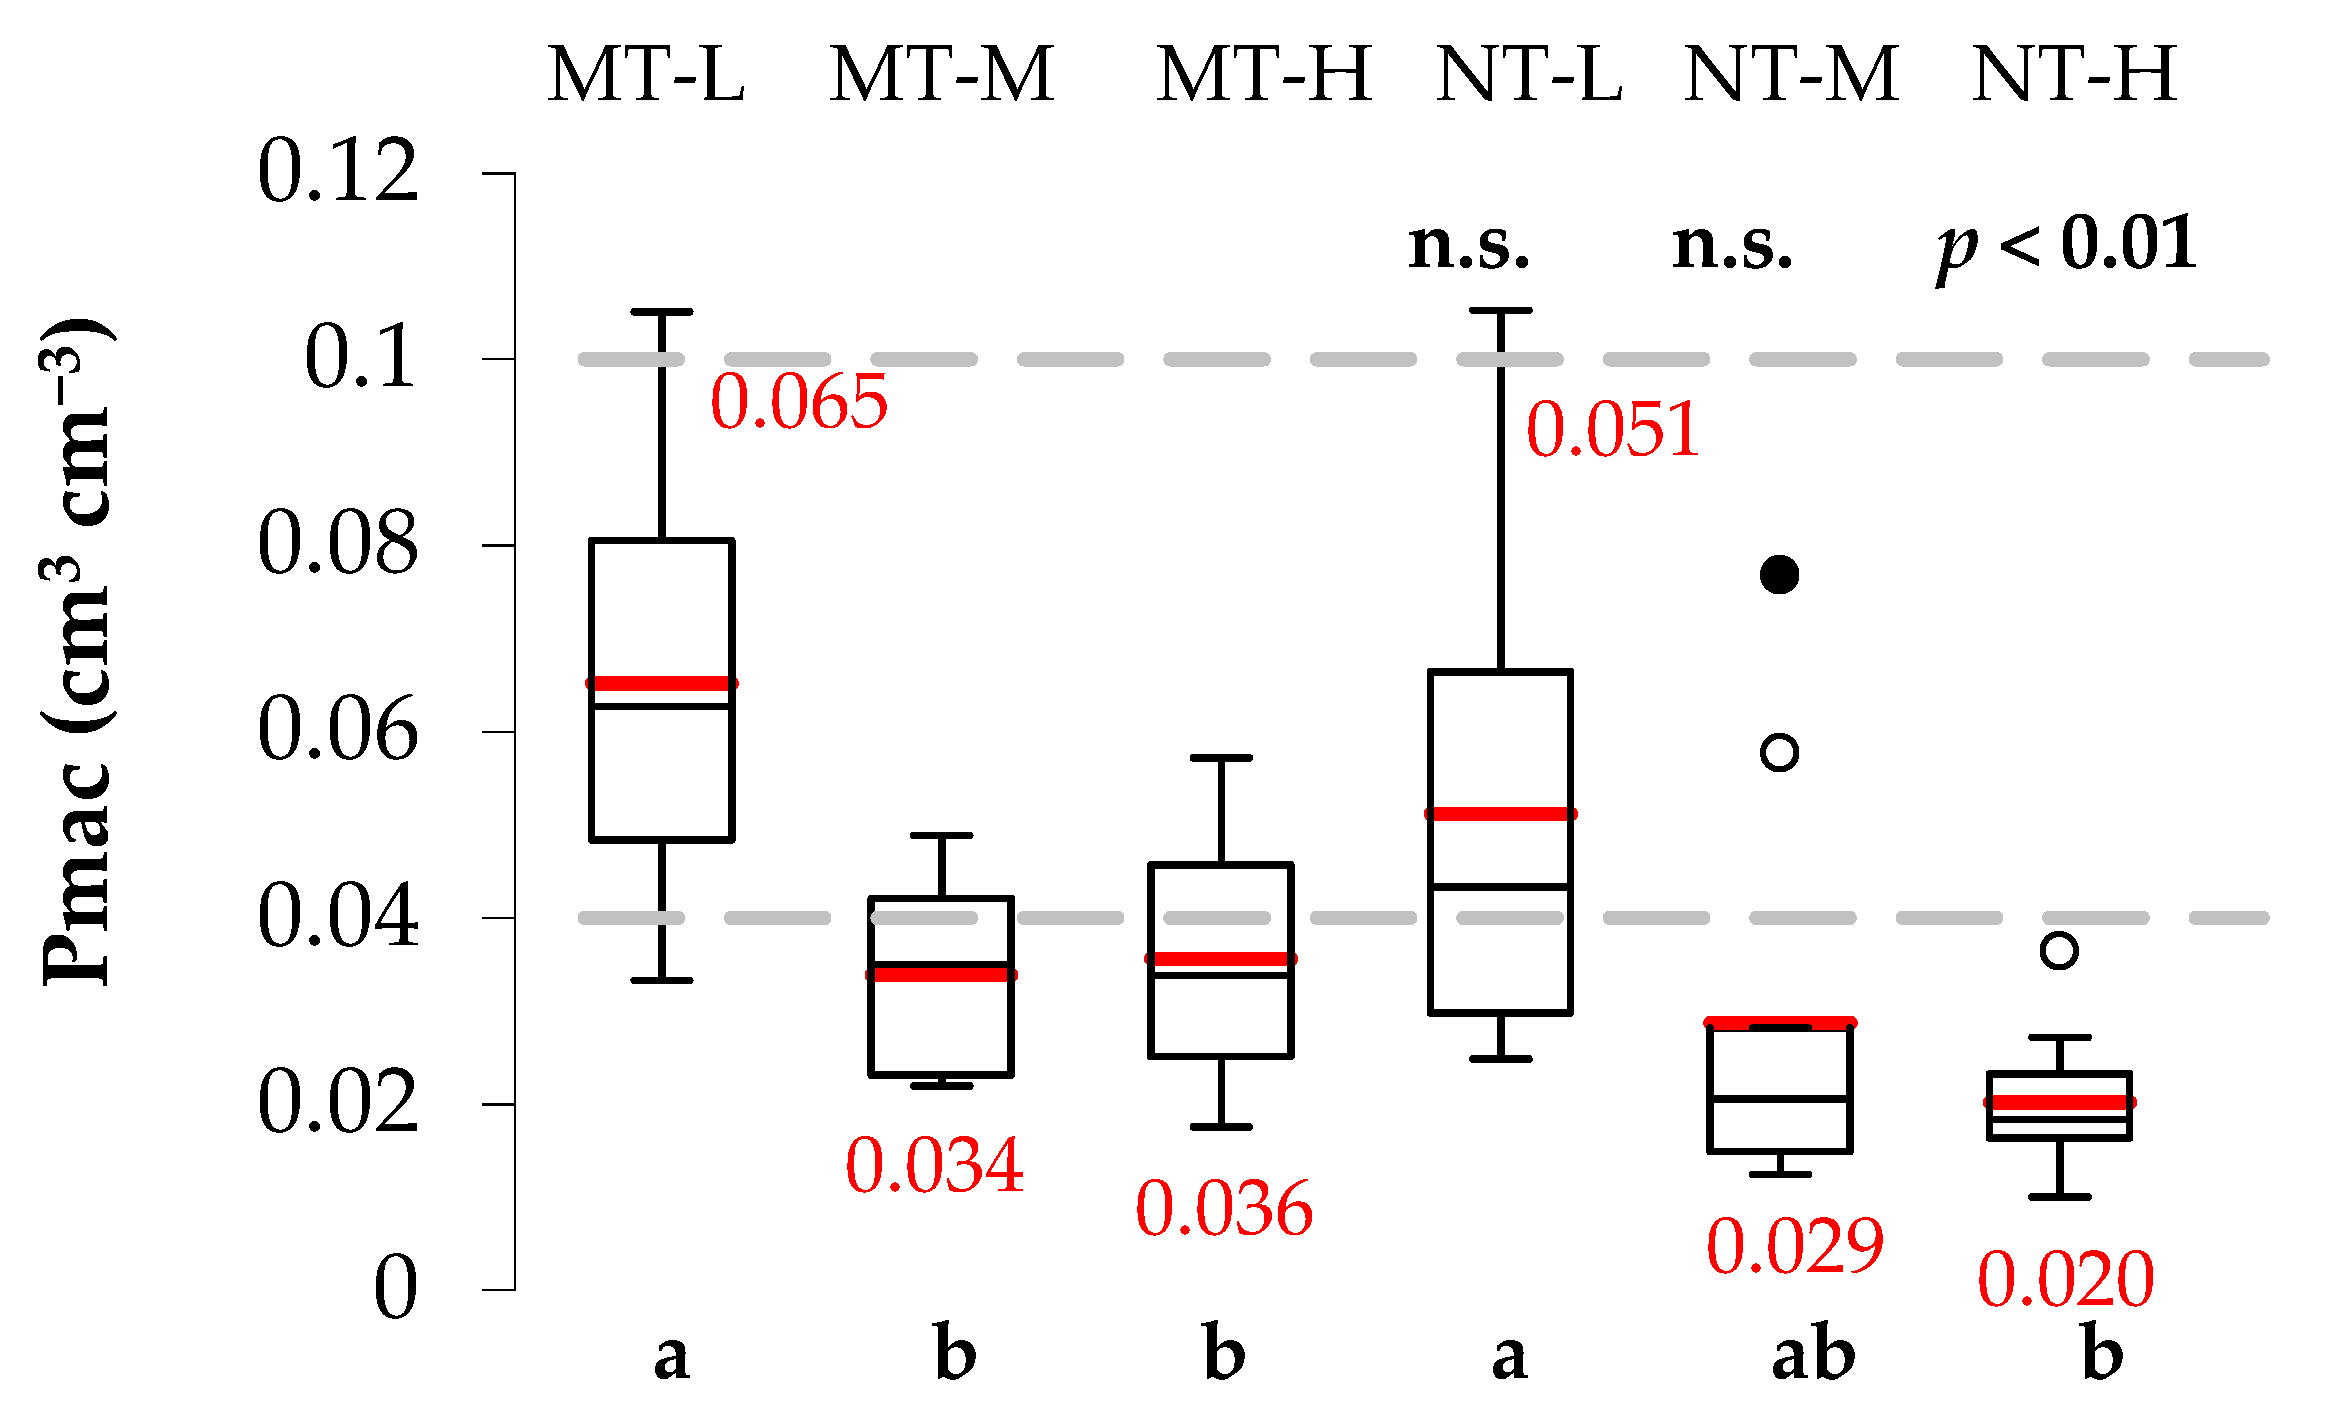
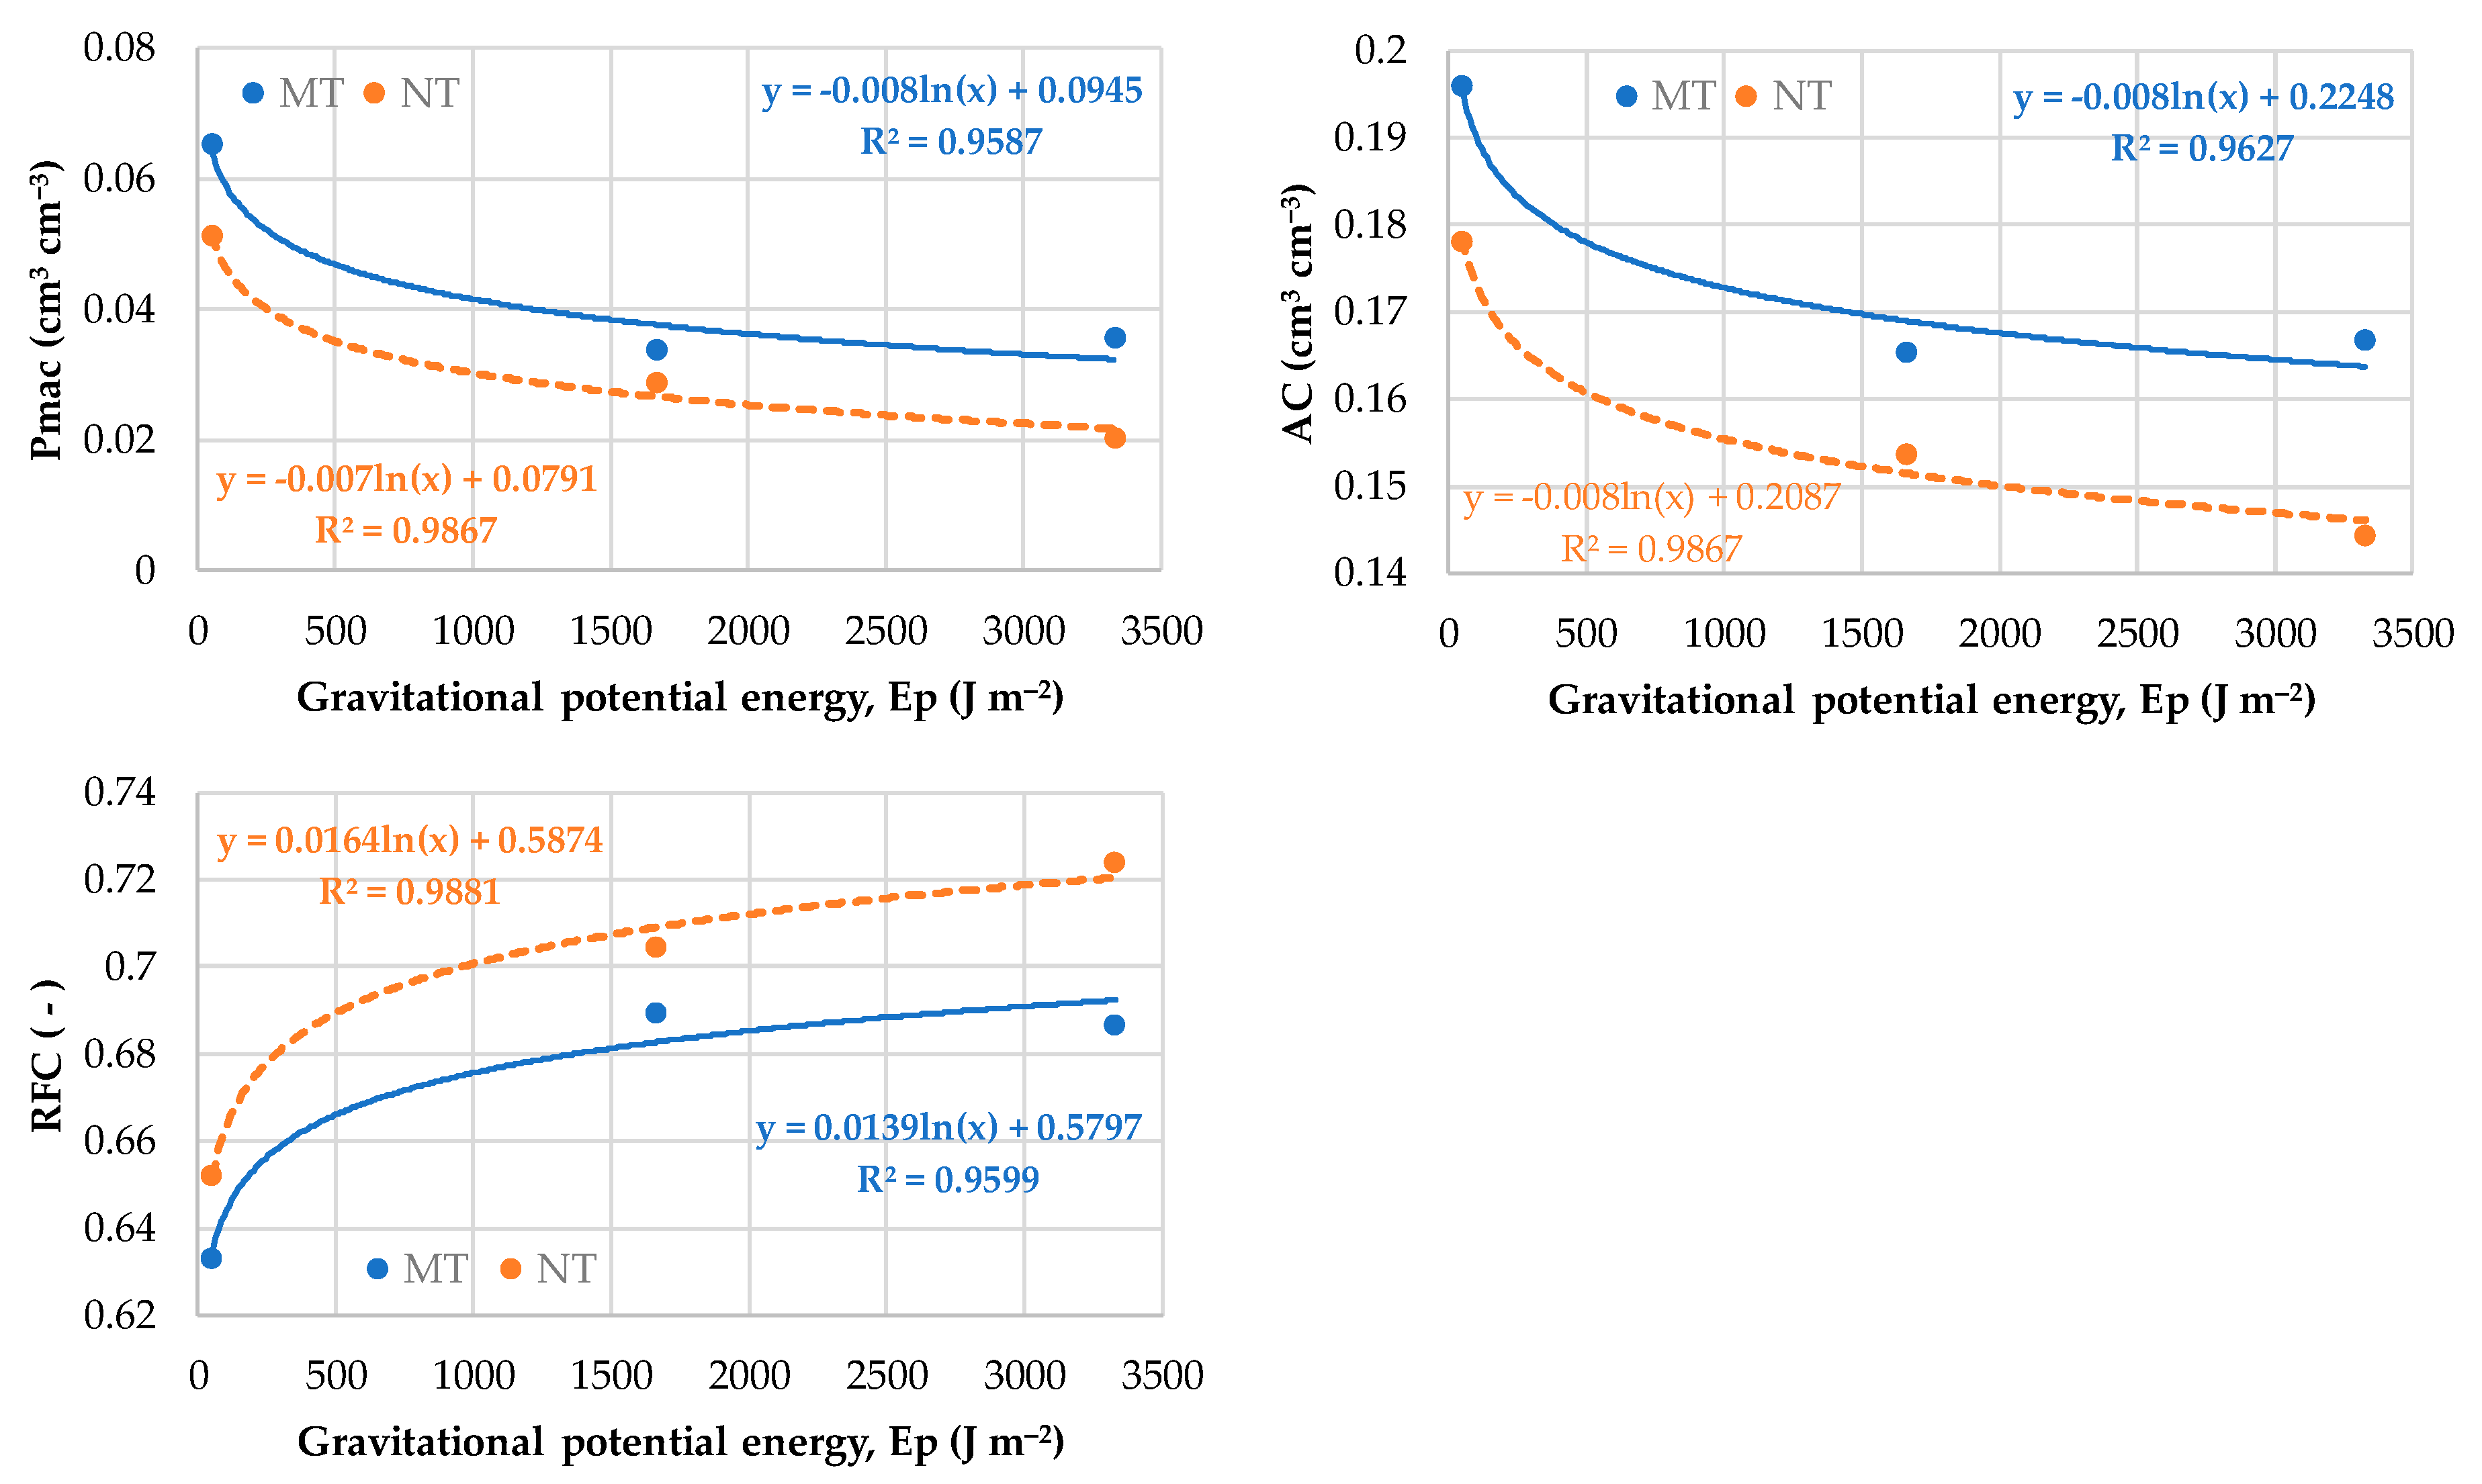
3.5.1. Macroporosity
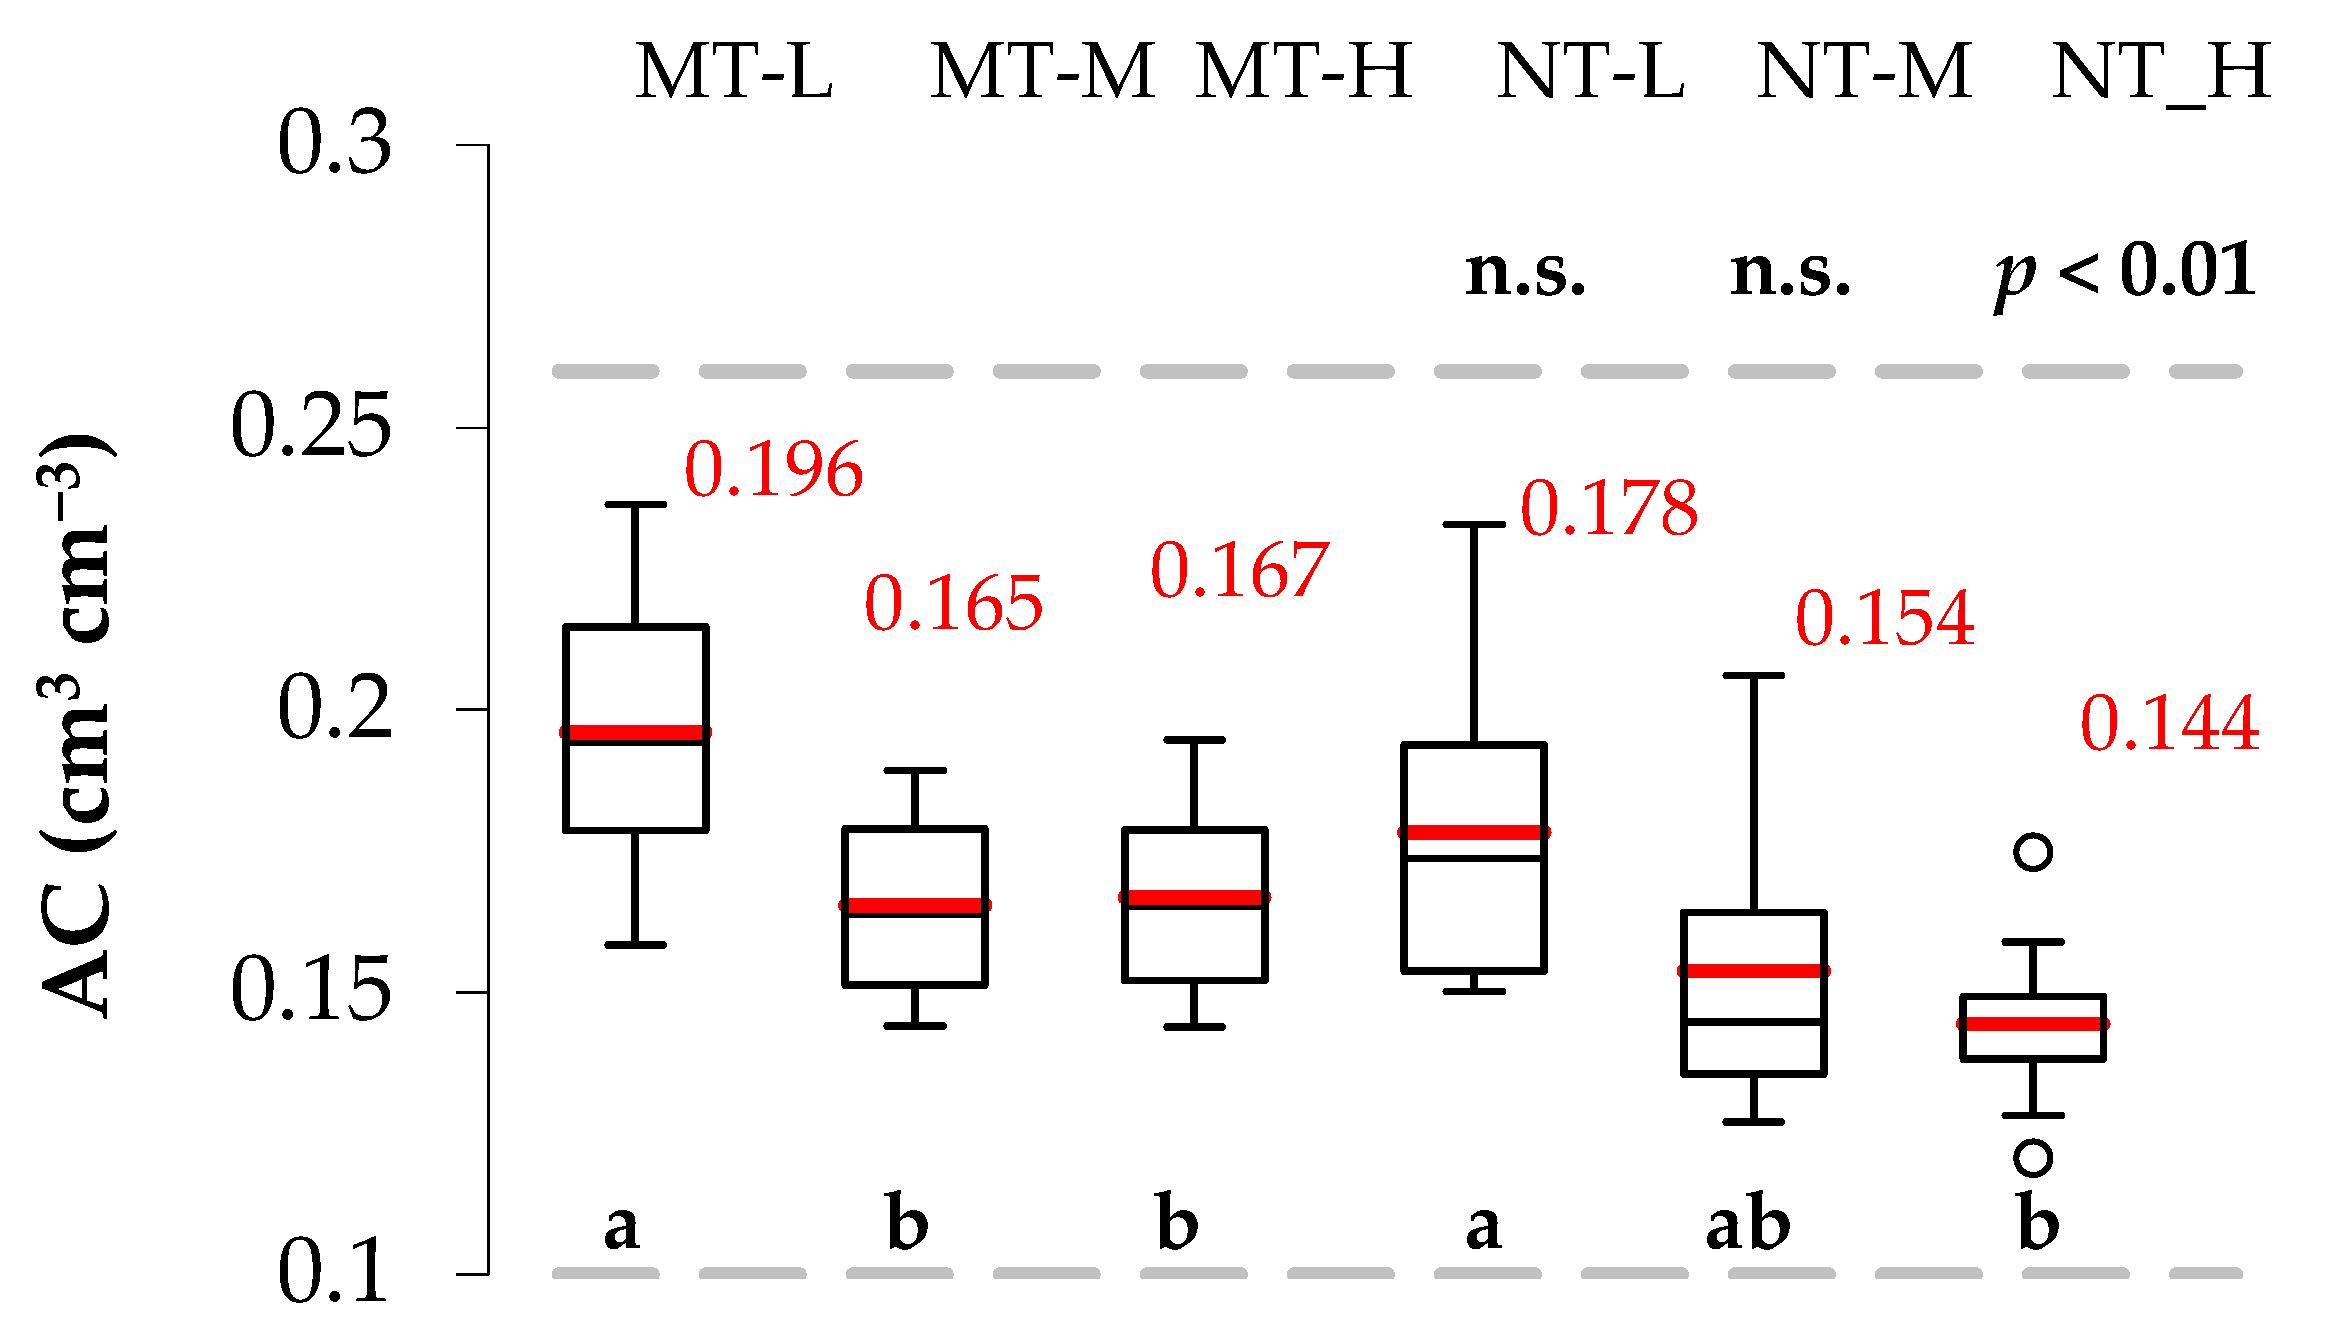
The box plot in Figure 5 summarizes the impact of water pouring height (i.e., using M–H instead of L) on Pmac estimation, under MT and NT soil management practices. Assuming the mean Pmac for L runs as reference, the reduction in macroporosity was, on average, equal to a factor of 1.8–1.9 under MT and 1.8-2.5 under NT. NT soil showed some outliers for M and H runs. Overall, a decreasing, but not significant (R2 = 0.068), correlation between the coefficients of variation, CV, and the height of water pouring was detected. According to the Tukey test, M and H runs determined a significant reduction in macroporosity for MT soil management; this effect was statistically significant only for the highest perturbative runs (H) under NT. According to a t-test, only H runs showed significant differences between soil management factors. The water impact also changed the soil physical quality assessment; according to the literature guidelines, M and H cause a decrease in macroporosity below the critical limit of 0.04 cm3 cm−3, i.e., the results suggested soil degradation due to excessive compaction (Figure 5).

3.5.2. Air Capacity

The box plot in Figure 6 summarizes the impact of water pouring height on AC estimation. The reduction in air capacity was equal to a factor 1.2, regardless of water heights or soil management practices. Only NT soil showed some outliers for H runs. A weak, but significant (R2 = 0.355) correlation between CV and water pouring height was detected. According to the Tukey test, M or H runs determined a significant reduction in air capacity for MT soil management, whereas for NT, a significant reduction in AC was detected only for H runs. According to a t-test, only H runs produced significant differences in air capacity between the two soil management factors, whereas no statistical difference was found for L and M water pouring heights. The detected reductions did not change the SPQ assessment, because AC was always classified as optimal.

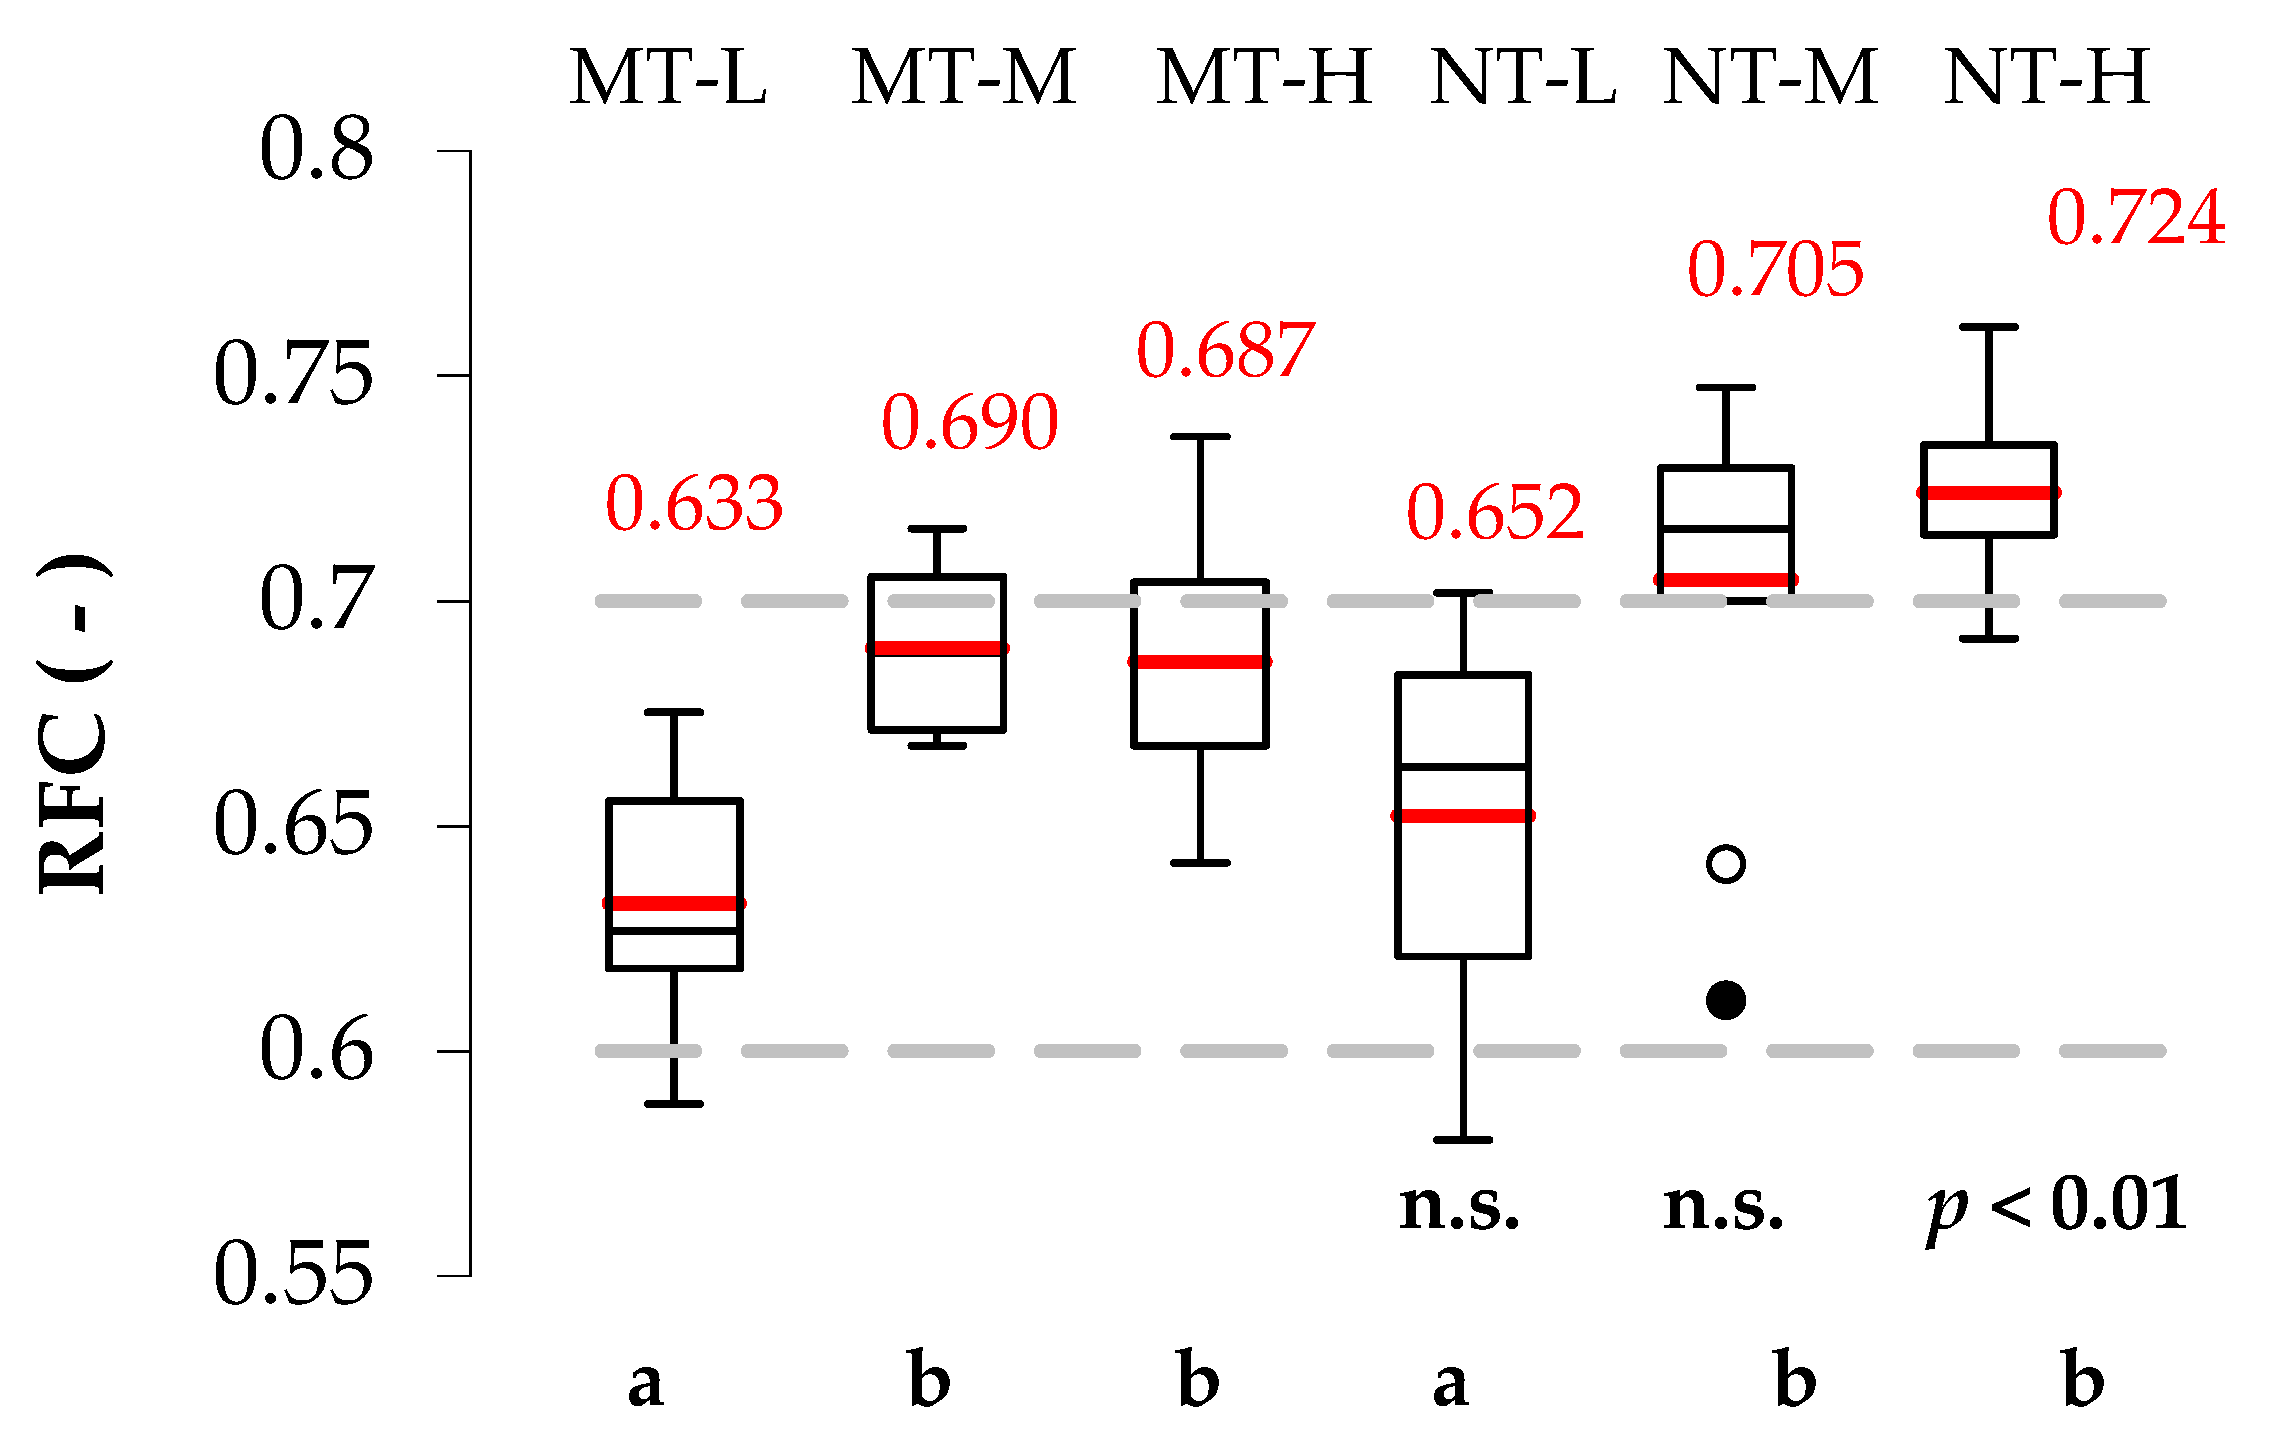
3.5.3. Relative Field Capacity

The box plot in Figure 7 summarizes the impact of water pouring height on RFC estimations. The increase in RFC with increasing water pouring height was mainly due to the growth of the smaller pores in relation to total porosity (Equation (9)), and it was in accordance with the macropore reduction. RFC increased by a factor 1.08–1.09 under MT and 1.08–1.11 under NT, for the ratios H/L–M/L, respectively. Only NT soil showed some outliers for M runs. A moderate, but significant (R2 = 0.324) correlation between CV and water pouring height was detected. According to a Tukey test, M or H runs determined a significant increase in relative field capacity, compared to L runs, under both soil management practices. Differences in RFC between MT and NT were significant only under H runs (Figure 7). Independently of the applied water pouring height, RFC was classified as optimal under MT, whereas signs of SPQ degradation were detected for M–H runs under NT indicating limited soil aeration (RFC > 0.7).

4. Discussion

The multi-height Beerkan run methodology proposed by Castellini et al. [20] was applied to detect the mechanical impact of water pouring height (from 3 to 200 cm) on the soil physical quality of a loam soil under minimum tillage and no tillage. To this aim, the BEST-steady procedure was applied to estimate the soil water retention curve, and three SPQ indicators, i.e., Pmac, AC and RFC, were considered.
Checking how soil properties are correlated to each other and if, in some cases, they are not consistent with the expected trends, is the basic prerequisite to validate the findings. The correlation analysis between independently measured soil bulk density values and the BEST-derived SPQ indicators, conducted for the “control” L runs, and the perturbative M and H runs, suggested credible findings on the induced soil physical quality changes. Indeed, an expected significant relationship with BD was detected for both Pmac and AC (Table 2), but signs of a more uncertain correlation were observed as the water pouring heights increased. The lack of statistical significance for the correlation between BD and RFC was not a completely unexpected result, because in a previous field investigation (i.e., fine-textured soil under durum wheat crop), similar poor correlations were observed when BEST was applied [27]. Given that RFC is the ratio between volumetric water contents at two different pressure heads, h= −100 and 0 cm, respectively, it can be interpreted as an index of the relative importance of meso-micropores to total porosity. This could explain why correlation between RFC and BD, which is indicative of total soil porosity, is generally weak. Quite interestingly, the worse correlations observed as water height increased further support the reliability of the SPQ estimations conducted by BEST. Indeed, for the experimental conditions considered in this investigation, soil bulk density accounted only for the initial “non-perturbed” soil condition, whereas capacitive indicators progressively worsened from L to M or H, signaling deterioration of soil physical quality.
Following the guidelines in the literature, optimal SPQ values were always detected with L runs (Figure 5, Figure 6 and Figure 7). This is in line with the previous BEST studies, that suggest a negligible soil compaction when a “standard” Beerkan infiltration experiment (L) is performed [20,40]. However, three different results were obtained with the perturbative runs (M–H runs), depending on the considered indicator: (i) air capacity classification did not change because the starting optimal AC values (L) remained optimal even after the M and H runs; (ii) macroporosity classification worsened for both soil management parameters (MT and NT); (iii) relative field capacity classification worsened only for the NT soil. The lack of sensitivity to soil degradation for the AC indicator suggests that guidelines consider an “optimal” range (0.10–0.26 cm3 cm−3) that is probably too wide for the investigated loam soil. Reynolds et al. [21] proposed a lower limit of AC = 0.14 cm3 cm−3 for sandy loam to clay loam soils, which is very close to the mean AC value observed in NT soil management exposed to H runs in this study (Figure 6).
The soil management practice affected the influence of water pouring height on SPQ estimation. Figure 8 summarizes the relative differences between the measured mean SPQ indicators and the average of the optimal range (i.e., the arithmetic mean between the upper and the lower values of the optimal interval) as a function of water pouring heights. Results showed that, regardless of the SPQ indicator considered, there was no further degradation of MT soil when the highest height (H) was applied, because the relative differences in SPQ were practically constant between M and H. On the contrary, a further soil degradation was detected under NT, suggesting greater resilience of undisturbed soil. Tillage is expected to weaken soil structure [42], and stable aggregation under wetting can be better under no-tilled than tilled soils, because more soil organic carbon is sequestered within macro-aggregates in the former case than the latter [43]. Results of this investigation further confirm previous findings obtained by Castellini et al. [20] on the same loam soil for saturation hydraulic conductivity. Compared to a no-tilled soil, in fact, it was necessary to apply less energy under tilled soils and, probably, the soil degradation effect can wear off with consecutive M runs. On the contrary, a greater energy needs to be applied on the surface of NT soil, i.e., using H rather than M runs, or a higher number (>15) of H runs, before observing the curve flattening.
The energy of the water impacting the soil from predetermined heights was suggested as a viable solution to predict the mean saturated soil hydraulic conductivity, Ks, in a soil condition that is closer to that expected when runoff is formed [20,44]. For conventional tillage and no-tillage soil management practices, a strong negative logarithmic relationship between the gravitational potential energy, Ep, of the water used for the infiltration runs and Ks values was reported by Castellini et al. [20]. A similar relationship was obtained in this study for Pmac and AC, indicating a reduction in relatively larger pores, while an increasing relationship was obtained for RFC, as a consequence of the counteracting increase in the relatively smaller pores (Figure 9). These findings agree with those obtained for Ks on the same loam soil, although the R2 values were comparatively lower (R2 = 0.958–0.962 under MT and R2 = 0.986–0.988 under NT). These findings suggest that, besides returning accurate estimations of hydrodynamic parameters of the soil [45,46,47], BEST can also be usefully applied to evaluate the effect of the impact of rainfall on capacitive indicators of soil physical quality.
The results of this investigation showed that, regardless of the soil physical quality indicators considered, soil management may play a major role when intense (extreme) rainfalls events occurs, because a significant soil degradation occurred in NT soil only when H runs were carried out.

5. Conclusions

The multi-height Beerkan run methodology was applied to mimic the mechanical impact of rainfall on the surface of a loam soil under minimum tillage and no-tillage. Three soil physical quality indicators (i.e., macroporosity, air capacity and relative field capacity), estimated from the soil water retention curve obtained by BEST-steady, unanimously signaled a reduction in the proportion of the relatively larger soil pores when perturbative runs were performed (height of water pouring of 100–200 cm) as compared to the control, i.e., non-perturbative L-runs (water poured from about 3 cm). As a consequence of these modifications, macroporosity and air capacity of the soil decreased, and field capacity increased for both MT and NT soil management.
According to the guidelines suggested in the literature to classify optimal soil physical quality, the perturbative M and H runs worsened the Pmac classification of both MT and NT soil management practices, and the RFC classification of only NT. Conversely, AC classification was not affected, regardless of water heights and soil management practices; results were always optimal. The lack of sensitivity for AC indicators was attributed to a reference optimal range that was probably too large for the studied soil.
From the sustainable soil management point of view (i.e., agricultural or marginal soils), this study supports the available literature that recommends the conversion to no-tillage, to reach a better agro-environmental sustainability.
This investigation extended findings of previous studies, because the soil degradation effects induced by M and H runs were evaluated, for the first time, in terms of capacitive indicators, and some signs of a different resilience of NT compared to MT soil were showed when H runs were used to mimic very intense rainfall events. Therefore, the proposed methodology appears attractive for future investigations aimed at studying the effects of mechanical raindrop impact to various agronomic conditions in the Mediterranean environments.

Supplementary Materials

The following are available online at https://www.mdpi.com/2073-445X/10/2/195/s1, Figure S1: View of the experimental site at CREA-AA (outline in red) (a,b), details of the soil conditions at the time of the experiments under minimum tillage (c) and no-tillage (d).

Author Contributions

Conceptualization, M.C. and M.I.; methodology, M.C. and M.I.; formal analysis, M.C., D.S. and A.M.S.; investigation, M.C., D.S. and A.M.S.; data curation, M.C. and D.S.; writing—original draft preparation, M.C.; writing—review and editing, M.C., M.I. and A.M.S. All authors have read and agreed to the published version of the manuscript.

Funding

The work was supported by the projects: (i) “STRATEGA, Sperimentazione e TRAsferimento di TEcniche innovative di aGricoltura conservativA”, funded by Regione Puglia–Dipartimento Agricoltura, Sviluppo Rurale ed Ambientale, CUP: B36J14001230007; (ii) PRIMA Fundation, call 2019-Section 1–GA n.1912 “Research-based participatory approaches for adopting Conservation Agriculture in the Mediterranean Area – CAMA” project.

Institutional Review Board Statement

Not applicable.

Informed Consent Statement

Not applicable.

Data Availability Statement

The data presented in this study are available on request from the corresponding author.

Acknowledgments

The authors would like to thank Luisa Giglio and Angela Pinto for their help in field and lab measurements, and Alessandro Vittorio Vonella for help in assembling the experimental device.

Conflicts of Interest

The authors declare no conflict of interest.

References

  1. Assouline, S.; Mualem, Y. Infiltration during soil sealing: The effect of areal heterogeneity of soil hydraulic properties. Water Resour. Res. 2002, 38, 1286. [Google Scholar] [CrossRef]
  2. Assouline, S. Rainfall-induced soil surface sealing: A critical review of observations, conceptual models, and solutions. Vadose Zone J. 2004, 3, 570–591. [Google Scholar] [CrossRef]
  3. Mingxi, Y.; Yu, F.; Guanglu, L.; Yangyang, R.; Zefang, L.; Gangan, M. Microcharacteristics of soil pores after raindrop action. Soil Sci. Soc. Am. J. 2020, 84, 1693–1704. [Google Scholar] [CrossRef]
  4. Armenise, E.; Simmons, R.W.; Ahn, S.; Garbout, A.; Doerr, S.H.; Mooney, S.J.; Sturrock, C.J.; Ritz, K. Soil seal development under simulated rainfall: Structural, physical and hydrological dynamics. J. Hydrol. 2018, 556, 211–219. [Google Scholar] [CrossRef] [PubMed]
  5. Assouline, S.; Mualem, Y. Modeling the dynamics of seal formation and its effect on infiltration as related to soil and rainfall characteristics. Water Resour. Res. 1997, 33, 1527–1536. [Google Scholar] [CrossRef]
  6. Kosmas, C.; Danalatos, N.; Cammeraat, L.H.; Chabart, M.; Diamantopoulos, J.; Farand, L.; Gutierrez, L.; Jacob, A.; Marques, H.; Martınez-Fernandez, J.; et al. The effect of land use on runoff and soil erosion rates under Mediterranean conditions. Catena 1997, 29, 45–60. [Google Scholar] [CrossRef]
  7. Liang, Y.; Jiao, J.Y.; Tang, B.Z.; Cao, B.T.; Li, H. Response of runoff and soil erosion to erosive rainstorm events and vegetation restoration on abandoned slope farmland in the Loess Plateau region, China. J. Hydrol. 2020, 584, 124694. [Google Scholar] [CrossRef]
  8. Assouline, S.; Mualem, Y. Runoff from heterogeneous small bare catchments during soil surface sealing. Water Resour. Res. 2006, 42, W12405. [Google Scholar] [CrossRef] [Green Version]
  9. Ahn, S.-R.; Kim, S.-J. The effect of rice straw mulching and no-tillage practice in upland crop areas on nonpoint-source pollution loads based on HSPF. Water 2016, 8, 106. [Google Scholar] [CrossRef] [Green Version]
  10. Ahmad, N.S.B.N.; Mustafa, F.B.; Gideon, D. A systematic review of soil erosion control practices on the agricultural land in Asia. Int. Soil Water Conserv. Res. 2020, 8, 103–115. [Google Scholar] [CrossRef]
  11. Andraski, B.J.; Mueller, D.H.; Daniel, T.C. Effects of tillage and rainfall simulation date on water and soil losses. Soil Sci. Soc. Am. J. 1985, 49, 1512–1517. [Google Scholar] [CrossRef]
  12. Carretta, L.; Tarolli, P.; Cardinali, A.; Nasta, P.; Romano, N.; Masin, R. Evaluation of runoff and soil erosion under conventional tillage and no-till management: A case study in northeast Italy. Catena 2021, 197, 104972. [Google Scholar] [CrossRef]
  13. Rodrigo-Comino, J.; Senciales, J.M.; Ramos, M.C.; Martínez-Casasnovas, J.A.; Lasanta, T.; Brevik, E.C.; Ries, J.B.; Ruiz-Sinoga, J.D. Understanding soil erosion processes in Mediterranean sloping vineyards (Montes de Málaga, Spain). Geoderma 2017, 296, 47–59. [Google Scholar] [CrossRef] [Green Version]
  14. Alagna, V.; Bagarello, V.; Di Prima, S.; Giordano, G.; Iovino, M. A simple field method to measure the hydrodynamic properties of soil surface crust. J. Agric. Eng. 2013, 44, 74–79. [Google Scholar] [CrossRef]
  15. Alagna, V.; Bagarello, V.; Cecere, N.; Concialdi, P.; Iovino, M. A test of water pouring height and run intermittence effects on single-ring infiltration rates. Hydrol. Process. 2018, 32, 3793–3804. [Google Scholar] [CrossRef]
  16. Di Prima, S.; Concialdi, P.; Lassabatere, L.; Angulo-Jaramillo, R.; Pirastru, M.; Cerdà, A.; Keesstra, S. Laboratory testing of Beerkan infiltration experiments for assessing the role of soil sealing on water infiltration. Catena 2018, 167, 373–384. [Google Scholar] [CrossRef]
  17. Rodrigo-Comino, J.; Seeger, M.; Iserloh, T.; González, J.M.S.; Ruiz-Sinoga, J.D.; Ries, J.B. Rainfall-simulated quantification of initial soil erosion processes in sloping and poorly maintained terraced vineyards—Key issues for sustainable management systems. Sci. Total Environ. 2019, 660, 1047–1057. [Google Scholar] [CrossRef]
  18. Bagarello, V.; Castellini, M.; Di Prima, S.; Iovino, M. Soil hydraulic properties determined by infiltration experiments and different heights of water pouring. Geoderma 2014, 213, 492–501. [Google Scholar] [CrossRef]
  19. Lassabatere, L.; Angulo-Jaramillo, R.; Soria Ugalde, J.M.; Cuenca, R.; Braud, I.; Haverkamp, R. Beerkan estimation of soil transfer parameters through infiltration experiments—BEST. Soil Sci. Soc. Am. J. 2006, 70, 521–532. [Google Scholar] [CrossRef]
  20. Castellini, M.; Stellacci, A.M.; Di Prima, S.; Iovino, M.; Bagarello, V. Improved beerkan run methodology to assess water impact effects on infiltration and hydraulic properties of a loam soil under conventional- and no-tillage. Soil Sci. Soc. Am. J. 2020. accepted author manuscript. [Google Scholar] [CrossRef]
  21. Reynolds, W.D.; Drury, C.F.; Tan, C.S.; Fox, C.A.; Yang, X.M. Use of indicators and pore volume-function characteristics to quantify soil physical quality. Geoderma 2009, 152, 252–263. [Google Scholar] [CrossRef]
  22. Castellini, M.; Stellacci, A.M.; Barca, E.; Iovino, M. Application of multivariate analysis techniques for selecting soil physical quality indicators: A case study in long-term field experiments in Apulia (southern Italy). Soil Sci. Soc. Am. J. 2019, 83, 707–720. [Google Scholar] [CrossRef] [Green Version]
  23. Ferrara, R.M.; Mazza, G.; Muschitiello, C.; Castellini, M.; Stellacci, A.M.; Navarro, A.; Lagomarsino, A.; Vitti, C.; Rossi, R.; Rana, G. Short-term effects of conversion to no-tillage on respiration and chemical-physical properties of the soil: A case study in a wheat cropping system in semi-dry environment. Ital. J. Agrometeorol. 2017, 1, 47–58. [Google Scholar]
  24. Manici, L.M.; Castellini, M.; Caputo, F. Soil-inhabiting fungi can integrate soil physical indicators in multivariate analysis of Mediterranean agroecosystem dominated by old olive groves. Ecol. Indic. 2019, 106, 105490. [Google Scholar] [CrossRef]
  25. Castellini, M.; Giglio, L.; Modugno, F. Sampled soil volume effect on soil physical quality determination: A case study on conventional tillage and no-tillage of the soil under winter wheat. Soil Syst. 2020, 4, 72. [Google Scholar] [CrossRef]
  26. Martínez-Mena, M.; Perez, M.; Almagro, M.; Garcia-Franco, N.; Díaz-Pereira, E. Long-term effects of sustainable management practices on soil properties and crop yields in rainfed Mediterranean almond agroecosystems. Eur. J. Agron. 2021, 123, 126207. [Google Scholar] [CrossRef]
  27. Castellini, M.; Stellacci, A.M.; Tomaiuolo, M.; Barca, E. Spatial variability of soil physical and hydraulic properties in a durum wheat field: An assessment by the BEST-Procedure. Water 2019, 11, 1434. [Google Scholar] [CrossRef] [Green Version]
  28. Castellini, M.; Vonella, A.V.; Ventrella, D.; Rinaldi, M.; Baiamonte, G. Determining soil hydraulic properties using infiltrometer techniques: An assessment of temporal variability in a long-term experiment under minimum- and no-tillage soil management. Sustainability 2020, 12, 5019. [Google Scholar] [CrossRef]
  29. Rana, G.; Ferrara, R.M.; Mazza, G. A model for estimating transpiration of rainfed urban trees in Mediterranean environment. Theor. Appl. Climatol. 2019, 138, 683–699. [Google Scholar] [CrossRef]
  30. Holdridge, L.R.; Grenke, W.C.; Hatheway, W.H.; Liang, T.; Tosi, J.A. Forest Environments in Tropical Life Zones: A Pilot Study; Pergamon Press: Oxford, UK, 1971. [Google Scholar]
  31. van Genuchten, M.T. A closed-form equation for predicting the hydraulic conductivity of unsaturated soils. Soil Sci. Soc. Am. J. 1980, 44, 892–898. [Google Scholar] [CrossRef] [Green Version]
  32. Burdine, N.T. Relative permeability calculation from pore size distribution data. Petr. Trans. Am. Inst. Min. Metall. Eng. 1953, 198, 71–77. [Google Scholar] [CrossRef]
  33. Brooks, R.H.; Corey, T. Hydraulic Properties of Porous Media; Hydrology Paper 3; Colorado State University: Fort Collins, CO, USA, 1964. [Google Scholar]
  34. Haverkamp, R.; Debionne, S.; Viallet, P.; Angulo-Jaramillo, R.; de Condappa, D. Soil properties and moisture movement in the unsaturated zone. In The Handbook of Groundwater Engineering; Delleur, J.W., Ed.; CRC Press: Boca Raton, FL, USA, 2006; pp. 1–59. [Google Scholar]
  35. Minasny, B.; McBratney, A.B. Estimating the water retention shape parameter from sand and clay content. Soil Sci. Soc. Am. J. 2007, 71, 1105–1110. [Google Scholar] [CrossRef]
  36. Castellini, M.; Fornaro, F.; Garofalo, P.; Giglio, L.; Rinaldi, M.; Ventrella, D.; Vitti, C.; Vonella, A.V. Effects of no-tillage and conventional tillage on physical and hydraulic properties of fine textured soils under winter wheat. Water 2019, 11, 484. [Google Scholar] [CrossRef] [Green Version]
  37. Yilmaz, D.; Lassabatere, L.; Angulo-Jaramillo, R.; Deneele, D.; Legret, M. Hydrodynamic characterization of basic oxygen furnace slag through an adapted BEST method. Vadose Zone J. 2010, 9, 107. [Google Scholar] [CrossRef]
  38. Bagarello, V.; Di Prima, S.; Iovino, M. Comparing alternative algorithms to analyze the Beerkan infiltration experiment. Soil Sci. Soc. Am. J. 2014, 78, 724–736. [Google Scholar] [CrossRef]
  39. Castellini, M.; Di Prima, S.; Iovino, M. An assessment of the BEST procedure to estimate the soil water retention curve: A comparison with the evaporation method. Geoderma 2018, 320, 82–94. [Google Scholar] [CrossRef]
  40. Angulo-Jaramillo, R.; Bagarello, V.; Di Prima, S.; Gosset, A.; Iovino, M.; Lassabatere, L. Beerkan Estimation of soil transfer parameters (BEST) across soils and scales. J. Hydrol. 2019, 576, 239–261. [Google Scholar] [CrossRef]
  41. Bagarello, V.; Di Prima, S.; Iovino, M.; Provenzano, G.; Sgroi, A. Testing different approaches to characterize Burundian soils by the BEST procedure. Geoderma 2011, 162, 141–150. [Google Scholar] [CrossRef]
  42. Or, D.; Ghezzehei, T.A. Modeling post-tillage soil structuraldynamics: A review. Soil Till. Res. 2002, 64, 41–59. [Google Scholar] [CrossRef]
  43. Arshad, M.A.; Franzluebbers, A.J.; Azooz, R.H. Components of surface soil structure under conventional and no-tillage in northwestern Canada. Soil Till. Res. 1999, 53, 41–47. [Google Scholar] [CrossRef]
  44. Auteri, N.; Bagarello, V.; Concialdi, P.; Iovino, M. Testing an adapted beerkan infiltration run for a hydrologically relevant soil hydraulic characterization. J. Hydrol. 2020, 584, 124697. [Google Scholar] [CrossRef]
  45. Alagna, V.; Bagarello, V.; Di Prima, S.; Iovino, M. Determining hydraulic properties of a loam soil by alternative infiltrometer techniques. Hydrol. Process. 2016, 30, 263–275. [Google Scholar] [CrossRef] [Green Version]
  46. Aiello, R.; Bagarello, V.; Barbagallo, S.; Consoli, S.; Di Prima, S.; Giordano, G.; Iovino, M. An assessment of the Beerkan method for determining the hydraulic properties of a sandy loam soil. Geoderma 2014, 235–236, 300–307. [Google Scholar] [CrossRef]
  47. Castellini, M.; Stellacci, A.M.; Mastrangelo, M.; Caputo, F.; Manici, L.M. Estimating the soil hydraulic functions of some olive orchards: Soil management implications for water saving in soils of Salento Peninsula (southern Italy). Agronomy 2020, 10, 177. [Google Scholar] [CrossRef] [Green Version]
Figure 1. View of experimental field with indication of tilled (MT) and no-tilled (NT) plots (a,b), and the device used to ensure flow verticality and to prevent wind effects during the runs with a height of water pouring of 200 cm (c), 100 cm (d), and 3 cm (e).
Land 10 00195 g001
Figure 2. Success rate in obtaining a water retention curve with BEST-slope and BEST-intercept/steady for different heights of water pouring (high, H; intermediate, M; low, L) and soil management practices (minimum tillage, MT; no-tillage, NT). The percentages are related to the total sample size, n = 36.
Land 10 00195 g002
Figure 3. Results of percentage relative error (RE) of the fitting of the BEST-slope and BEST-intercept infiltration model (abbreviated as slope and intercept, respectively) to the transient phase of the infiltration runs, as a function of heights of water pouring (low, L; intermediate, M; high, H), under minimum tillage (MT) and no-tillage (NT) (a); relationship between mean values of RE and water pouring height (L = 3 cm, M = 100 cm and H = 200 cm) (b).
Land 10 00195 g003
Figure 4. Mean values of volumetric soil water content, VSWC, vs. absolute value of soil pressure head, h, obtained with BEST-steady for low (L), intermediate (M) and high (H) infiltration runs, under minimum tillage (MT) and no-tillage (NT).
Land 10 00195 g004
Figure 5. Box plots of macroporosity (Pmac) corresponding to low (L), intermediate (M) and high (H) runs, under minimum tillage (MT) and no-tillage (NT). The thick red line on each box represents the mean value, and the thin black line represents the median; the former is also reported with numbers. White circles represent outliers (extreme outliers in black). Interval between the dashed lines represents the optimal values of Pmac according to Reynolds et al. [21]. For a given soil management practice, mean values of water height followed by the same letter are not statistically different according to a Tukey HSD test; for a given water height, differences in soil management were reported according to a two-tailed t-test (n.s. = not significant).
Land 10 00195 g005
Figure 6. Box plots of air capacity (AC). Interval between the dashed lines represents the optimal values of AC according to Castellini et al. [22]. For a given soil management practice, mean values of water height followed by the same letter are not statistically different according to a Tukey HSD test; for a given water height, differences in soil management were reported according to a two-tailed t-test (n.s. = not significant). For the meaning of the abbreviations or interpret box plots, please refer to the caption of Figure 5.
Land 10 00195 g006
Figure 7. Box plots of relative field capacity (RFC). Intervals between the dashed lines represent the optimal values of RFC according to Reynolds et al. [16]. For a given soil management practice, mean values of water height followed by the same letter are not statistically different according to a Tukey HSD test; for a given water height, differences in soil management practices were reported according to a two-tailed t-test (n.s. = not significant). For the meaning of the abbreviations or interpret box plots, please refer to the caption of Figure 5.
Land 10 00195 g007
Figure 8. Relative differences in SPQ between measured mean values and the average of the optimal range as a function of heights of water pouring (low, 3 cm; intermediate, 100 cm; high, 200 cm), under minimum and no-tillage (solid and dotted lines, respectively).
Land 10 00195 g008
Figure 9. Relationship between the mean values of macroporosity (Pmac), air capacity (AC) and relative field capacity (RFC), and the gravitational potential energy (Ep) of the water for the two soil management practices (MT and NT).
Land 10 00195 g009
Table 1. Statistics of soil water retention curve parameters, i.e., saturated soil water content, θs, n, m and scale parameter, hg, obtained with BEST-steady, under different water pouring heights and soil management practices.
L M H
Parameter (Units)SoilnMeanCV (%)nMeanCV (%)nMeanCV (%)
θs (cm3 cm−3)NT80.5115.1110.5195.4120.5235.6
n (-)82.1510.1112.1500.1122.1500.2
m (-)80.0701.8110.0702.0120.0702.1
|hg| (cm)86.440.71110.433.31211.819.0
θs (cm3 cm−3)MT120.5336.7120.5336.7120.5336.7
n (-)122.1490.2122.1490.2122.1490.2
m (-)120.0692.6120.0692.6120.0692.6
|hg| (cm)124.833.7128.420.1128.227.5
n, sample size; CV, coefficient of variation; L, low runs; M, intermediate runs; H, high runs; NT, no-tillage; MT, minimum tillage.
Table 2. Matrix of linear correlation between soil bulk density (BD) and capacitive indicators obtained by BEST-steady (relative field capacity, RFC, air capacity, AC, macroporosity, Pmac), under low (L), intermediate (M) and high (H) heights of water pouring. Significant correlations were highlighted in bold.
Minimum Tillage No-Tillage
L BDRFCACPmac BDRFCACPmac
BD1 BD1
RFC0.51161 RFC0.60381
AC−0.8538−0.88311 AC−0.7861−0.96671
Pmac−0.7525−0.94500.98421 Pmac−0.7223−0.98060.99241
M BDRFCACPmac BDRFCACPmac
BD1 BD1
RFC0.19421 RFC0.27791
AC−0.8210−0.71881 AC−0.5507−0.95481
Pmac−0.6416−0.87290.96371 Pmac−0.3541−0.98710.96811
H BDRFCACPmac BDRFCACPmac
BD1 BD1
RFC−0.13321 RFC0.16621
AC−0.5488−0.75431 AC−0.7048−0.81571
Pmac−0.2689−0.91310.94781 Pmac−0.5116−0.91180.96041
Publisher’s Note: MDPI stays neutral with regard to jurisdictional claims in published maps and institutional affiliations.

