The Impact of Cropland Balance Policy on Ecosystem Service of Water Purification—A Case Study of Wuhan, China


College of Public Administration, Huazhong Agricultural University, Wuhan 430070, China
*
Author to whom correspondence should be addressed.
Water 2017, 9(8), 620; https://doi.org/10.3390/w9080620
Submission received: 29 June 2017
/
Revised: 16 August 2017
/
Accepted: 16 August 2017
/
Published: 18 August 2017
(This article belongs to the Special Issue Sustainable Water Management within Inland River Watershed)
Abstract
:Urbanization has been responsible for the loss of cropland worldwide, especially in China. Since this trend is expected to continue in the near future, China has implemented the strictest cropland protection policies in the world, to guarantee its national food security. However, the negative impact of cropland protection policies on ecosystem services has always been ignored. In this paper, we used LANDSCAPE (Land System Cellular Automata model for Potential Effects) model to assess the ecological lands loss under different scenarios in Wuhan, China during S2010–2020. Our scenarios differ in whether or not the cropland protection policy is imposed. Then, the InVEST (Integrated Valuation of Ecosystem Services and Tradeoffs) model was used to calculate the amount of nutrient export under two different scenarios and to analyze the mechanism of impact of Cropland Balance Policy on water purification. Results show that the scenarios with strict cropland protection (CP) will lead to more losses of ecological lands compared with scenarios without cropland protection (NCP). Besides, the nitrogen export in the CP scenario is average 8.6% higher than the NCP scenario, which indicates that the Cropland Balance Policy has a negative impact on water purification. The nitrogen export is transported mainly by subsurface, which is 1.73 times higher than the surface averaged over the two scenarios. Accordingly, this study proposed that reasonable land use planning, and lowering the nutrient delivery ratio would be more beneficial to the ecosystem service of water purification.
1. Introduction
With ongoing population growth, economic development and rural-to-urban migration, global urbanization is at the stage of rapid development [1]. For example, the requirement of the total additional land globally is estimated to range from 285 to 792 million hectares between 2000 and 2030 [2]. Since the Open Reform Policy in 1978, China’s urban population has increased from 170 million to 730 million in 2013, with an urbanization level of 53.7% in 2013 [3]. The average annual growth rate of urban area was 3.20% globally between 1990 and 2000 [4], while that of China was 6.66% in the same period, yielding 10,505.40 km2 of additional urban land (Statistical Yearbook of China’s Urban Construction, 2007).
However, with the rapid development of socio-economy, disorderly urban land expansion leads to a large amount of high-quality cropland loss [5]. According to the Second National Land Survey, China’s cropland area decreased from 135.38 million hectares in 2009 to 134.99 million hectares in 2015, with a net reduction of 385,800 hectares (China Bureau of Statistics, 2016). It can be seen that the rapid development of China’s socio-economy has caused huge losses of cropland. To guarantee the food security of 1.3 billion people, China has formulated a series of policies, including the Cropland Balance Policy, aiming to protect the quantity and quality of cropland in China.
The nearly 20-year effects and efficiency of China’s Cropland Balance Policy is worthy of our reflection. Song and Pijanowski [5] argued that the Cropland Balance Policy could only ensure the balance of the quantity of cropland rather than the quality due to both the loss of highly productive cropland from urban expansion and economic development and a flawed approach to adding new cropland. Lichtenberg and Ding [6] proposed that the loss of cropland does not mean food shortages; other factors such as improving productivity can make up for the problem of food security. The policies of cropland protection are not the only effective and necessary way to protect national food security. In addition, Zhong et al. assessed the performance of China’s primary cropland protection planning and found that it was helpful to protect cropland generally in China, while it failed in some areas [7]. The above studies have shown that the implementation of the policies of cropland conservation has at least a negative effect on the ecosystem.
On the other hand, it is inevitable that urbanization results in loss of ecosystem services. Between 2009 and 2015, the area of forestland in China decreased by 957.53 thousand hectares, grassland by 911.47 thousand hectares, and wetland by 184.6 thousand hectares (National Bureau of Statistics of the People’s Republic of China, 2009–2015). The reduction of ecological lands (which refers to forest, grassland and wetland in this paper) is not only caused by urban expansion directly, but also partly due to coupling of urban expansion and strict cropland protection indirectly. For example, built-up area expansion results in a loss of ecological lands directly, by converting ecological lands into built up land. Moreover, urbanization also causes indirect ecological land loss, when the compensation of cropland losses caused by built-up area expansion yield a conversion of ecological lands elsewhere [8]. Consequently, urbanization not only threatens biodiversity directly, but also indirectly, through the displacement of cropland [9].
Unfortunately, the indirect loss of ecological lands and the destruction of ecosystem services are rarely taken into account in the evaluation of the performance of cropland protection policies. Theoretically, the implementation of strict cropland protection policies in rapid urbanization area may lead to extra ecological land loss and ecosystem services degradation.
In addition, many scholars discovered that land use change plays an important role on ecosystem services of water purification. Activities such as agriculture, industry and urban development have a negative impact on water purification [10,11]. Furthermore, studies have shown that non-point source pollution resulting from increased intensity of cropland is one of the main causes of water quality deterioration [12]. For example, Turner studies the relationship between landscape patterns and water quality in the Mississippi River Basin. The results show that the widespread distribution of agriculture, especially the use of fertilizers, has a significant impact on water purification [13].
Therefore, we explored the impacts of the implementation of strict cropland protection policy on ecological lands, as well as the ecosystem services, specifically water purification, for the city of Wuhan, a typical city experiencing rapid urbanization in China. Further, we also explored the key mechanism of these impacts. We set up scenarios under two different policies: (1) No strict Cropland Protection scenario (NCP); and (2) strict Cropland Protection scenario (CP), with the strict cropland protection policies which require keeping constant cropland area during 2010–2020.
In the first step, we applied the calibrated LANDSCAPE model [14] to simulated different land use changes in Wuhan between 2010 and 2020 under the two scenarios, by calculating the area of forest land, grassland and wetland, separately, in different scenarios to reflect the impact of strict cropland protection policy on ecological lands loss. Then, the InVEST model was used to calculate the amount of nutrient export from land use under two different scenarios and analyze the main factors for the impacts of policy on ecosystem service of water purification.
2. Study Area and Data Sources
2.1. Study Area
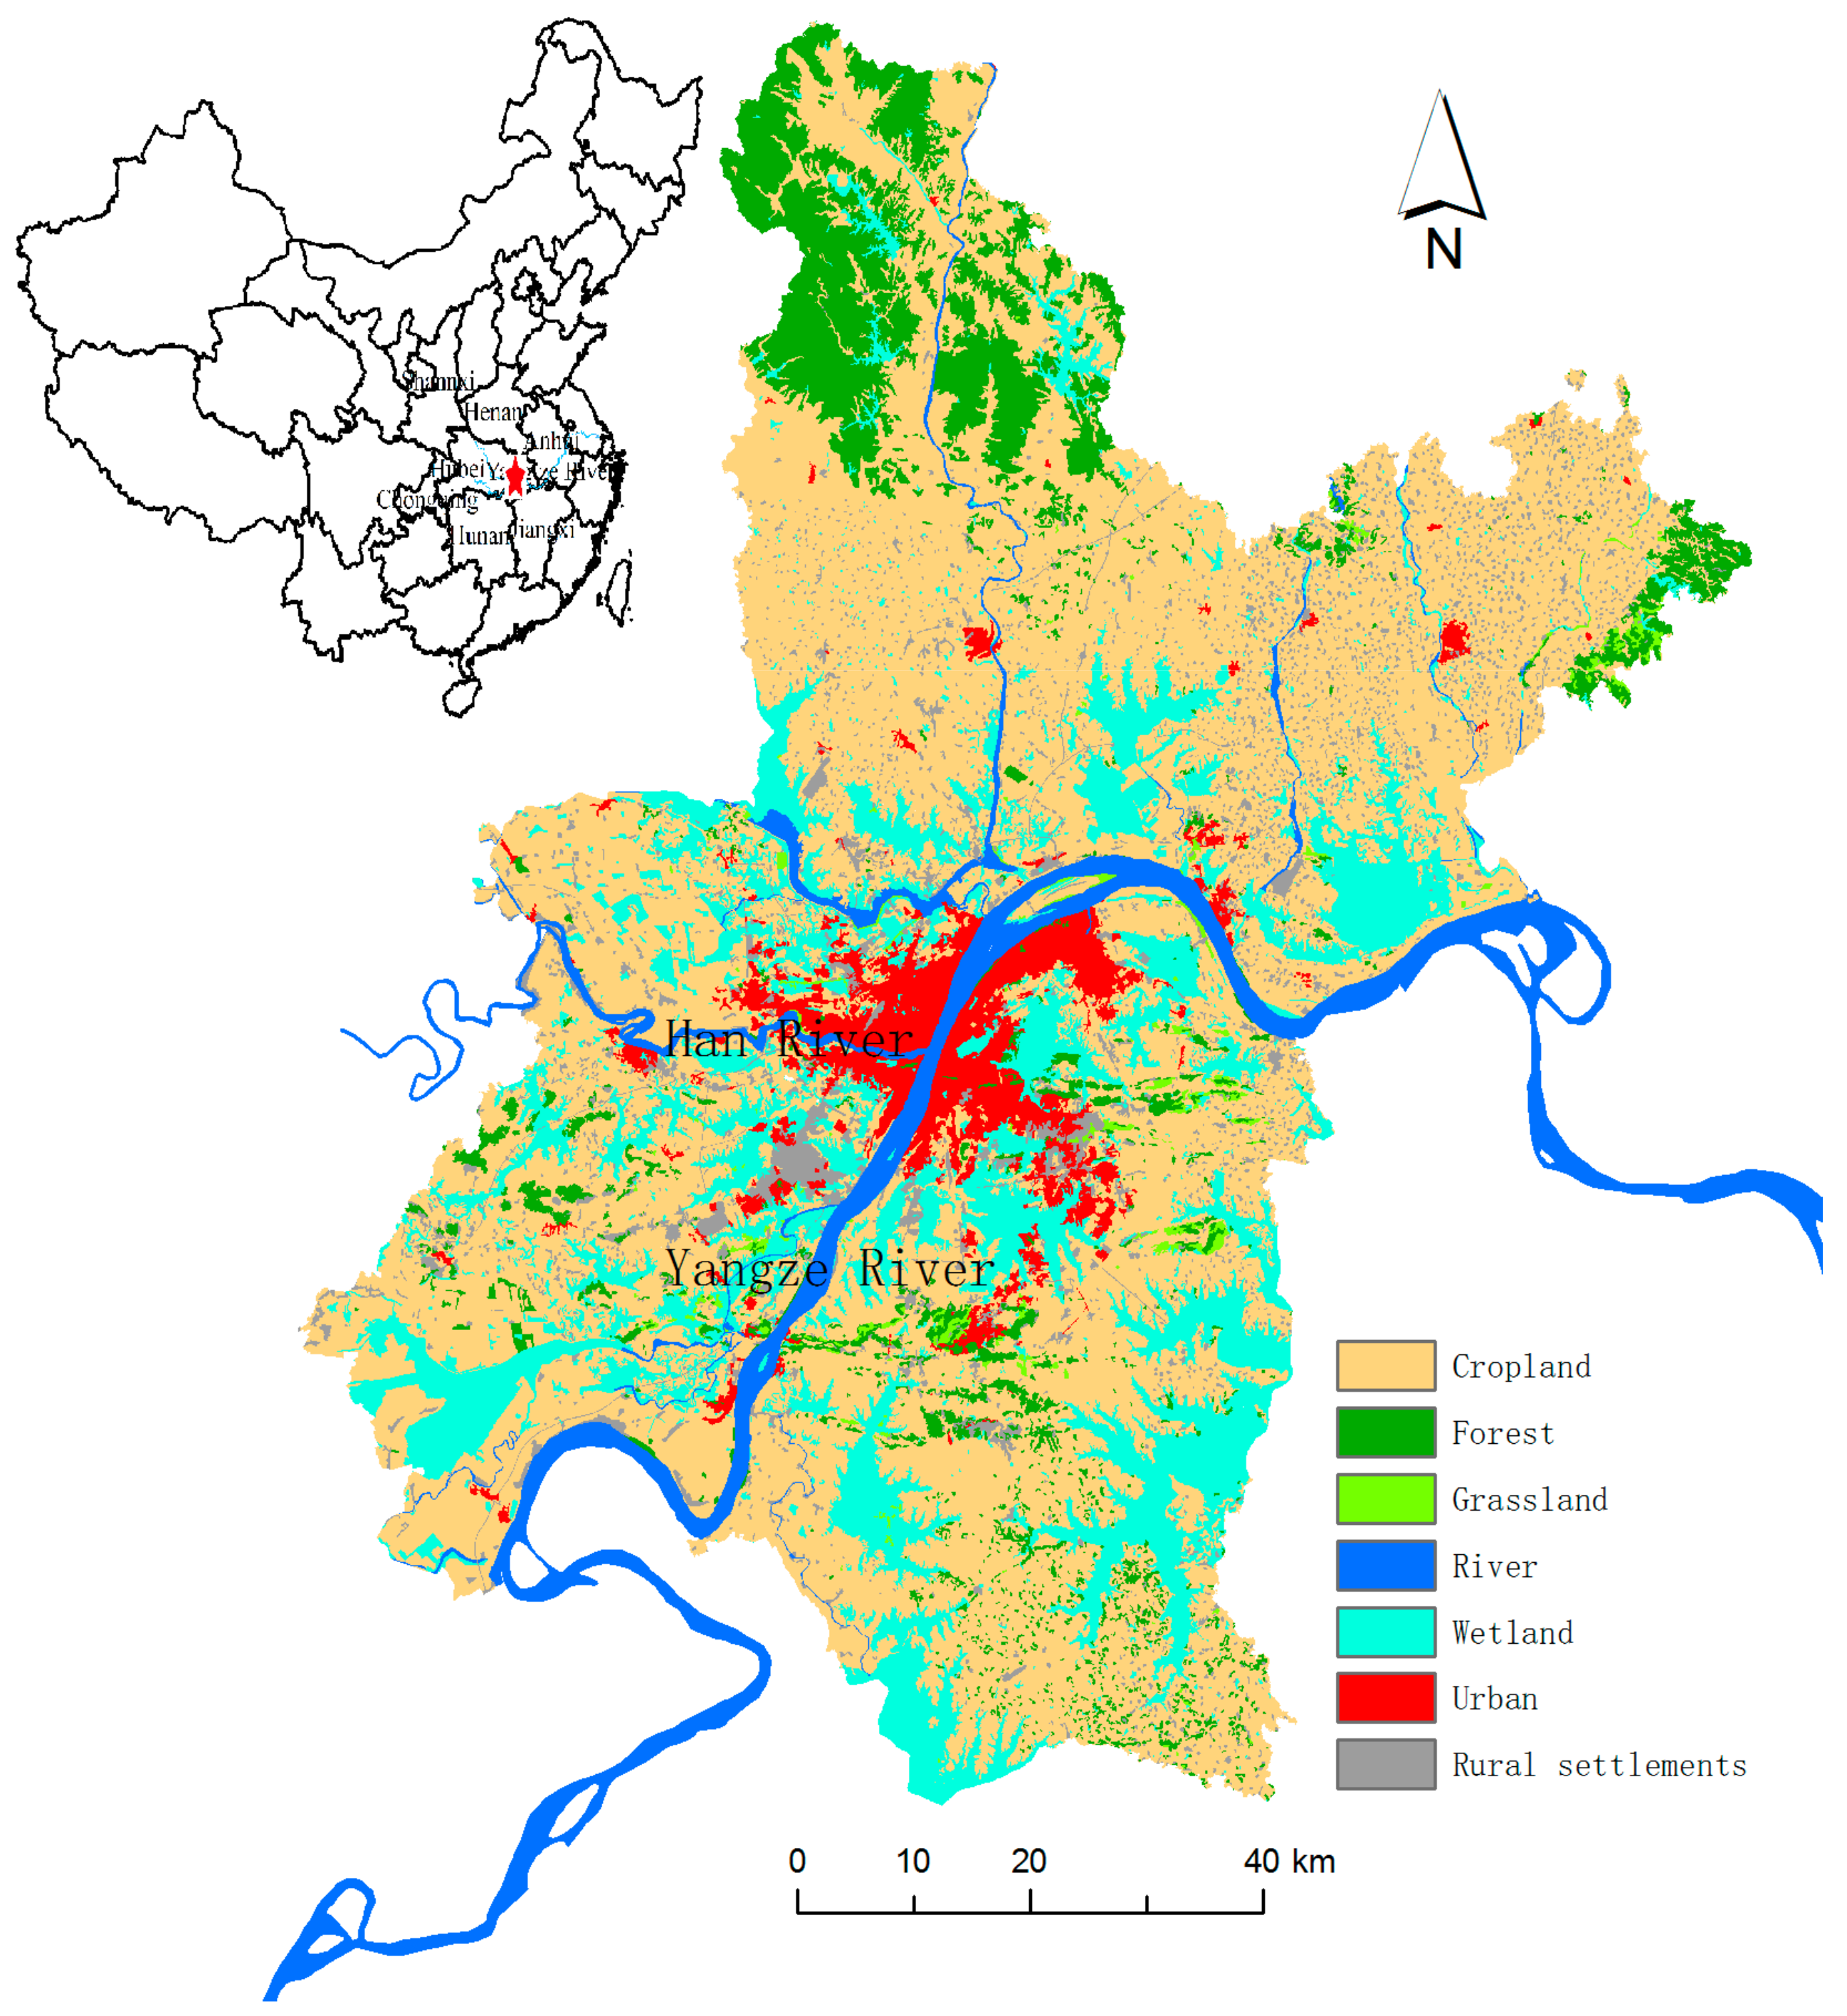
Wuhan is a rapidly urbanizing city in central China, with an area of 8569.15 km2 and a population of 10.61 million in 2015 (Hubei Bureau of Statistics, 2016). It is located at the middle and lower reaches of the Yangtze River and east of the Han Rivers Plain, with fertile land suitable for cultivation (Figure 1). However, with the acceleration of urbanization process, the built-up areas of Wuhan have increased from 1185.39 km2 to 1869.35 km2 between 2000 and 2014, while the area of cropland decreased from 5188.00 km2 to 3018.68 km2 in the same period. In the meantime, the ecological lands such as forests, grasslands and wetlands are all shrunk. For example, 28 km2 of wetlands in Wuhan has disappeared between 1990 and 2013, including 77% of Shahu Lake and 52% of Nanhu Lake [15]. Consequently, ecosystems in this area have become more vulnerable, as illustrated by the flooding disaster in Wuhan in 2016. Consequently, land use change in Wuhan is driven by a severe competition among food security, economy development, and ecosystem conservation, as is the case for many other cities in China.
2.2. Data Sources
Five datasets were used in this paper: land use data, accessibility data, terrain data, soil data, and meteorological data. Land use data have three roles in this modeling exercise: (1) calculating the suitability; (2) representing the initial land use map for the simulation; and (3) providing a target for model calibration. Accessibility data, terrain data, soil data, and meteorological data were used as input for the Support Vector Machines (SVM) algorithm, to derive the relationship between suitability of locations for each land use type and characteristics of these locations.
Land use data were available for 2000 and 2010, representing seven land use types (cropland, forest, grassland, river, wetland, rural settlements, and urban area). The land use data of both 2000 and 2010 have a spatial resolution of 30 m and were obtained from the land use database of the Data Centre Resources and Environment, Chinese Academy of Science (http://www.resdc.cn). Since the maximum size of land use data in current LANDSCAPE model is 4000 × 4000 cells, land use data were resampled to a spatial resolution of 100 m using a majority aggregation.
For the calculation of the accessibility, we used six types of infrastructure networks: railways, highways, national roads, provincial roads, main roads and minor roads. All datasets of transport network were extracted from the Traffic Atlas of Wuhan. Distance raster datasets for each type of road were calculated based on their Euclidean distance to the different road types.
There are two types of terrain datasets used in this research, representing elevation and slope. Both were used for calculating suitability maps. The DEM dataset was obtained from the Shuttle Radar Topography Mission (SRTM) [16]. The spatial resolution of the SRTM DEM in the study area is 90 m. A slope dataset was derived from the SRTM DEM dataset by the SLOPE function. Finally, both datasets were resampled to the spatial resolution of 100 m to make them consistent with the spatial resolution of the land use datasets.
Soil data used to calculate the suitability maps represent information about soil nitrogen content, derived from the China Soil Database (gis.soil.csdb.cn). All the original soil datasets were in shapefile format with a measuring scale of 1:1,000,000. To match the format and spatial resolution of the land use datasets, we converted soil datasets in shapefile format to raster datasets with a spatial resolution of 100 m.
We obtained meteorological data for daily precipitation and temperature during 1981–2010 from the ground meteorological observatory in Hubei Province. Subsequently, we applied Kriging to interpolate between these point data for both annual average accumulated temperature and annual precipitation.
3 Method
3.1. Scenarios of Land Use Strategies
Two land use scenarios were designed according to the implementation of strict cropland protection policies. Each scenario has the same demand for both urban and rural settlements in Wuhan to ensure comparability (Table 1).
The NCP means the scenario that follows the current land use change trend of urban expansion, cropland loss and ecological land decrease without any cropland protection policies. Thus, the demands for urban and rural settlements were given based on the land use planning of Wuhan during 2006–2020 (hubei.gov.cn/) [17]. Changes of all other land use types, including cropland, forest, grassland, and wetland, were driven by changes of built-up area expansion, according to the land use change trend during 2000 to 2010. Meanwhile, the resistances of each land use type in NCP scenario were kept the same with their resistances in the period of 2000 to 2010, which were calibrated manually to match the observed land use changes in Wuhan between 2000 and 2010.
The CP scenario means a strict regulation to maintain the current amount of cropland, so the area of cropland was required to remain the same as that in 2010, i.e., 4706 km2, to meet the requirement of strict cropland protection policies. The demands of urban and rural settlements, and the resistances for each land use type remained the same with the NCP scenario.
3.2. Modeling Land Use Changes by LANDSCAPE Model
Cellular Automata (CA) based models are widely used in land use simulation for its simplicity, flexibility and intuitiveness [18]. However, most can only simulate the process of urban expansion or single land-use, rather than demonstrate the cascading process of multiple land use. The LANDSCAPE model is a CA-based model that can simulate cascading processes of multiple land uses and understand land competitions as well [19]. Therefore, the LANDSCAPE model is used to project land use change during 2010–2020 in Wuhan under the two different policy scenarios.
In LANDSCAPE model, based on the influencing extent of human activities, land uses are categorized into two groups: active and passive [20,21]. Active land use types change is directly driven by human activities, such as urban land and cropland. Passive land use types, such as grassland, wetland or forest, are driven by active land use change, such as urban growth or cropland expansion. Accordingly, land use are allocated in two interactive cascading processes in LANDSCAPE model: active land use change according to demands of human activities, while passive land use may consequently be changed according to changes of active land uses.
Allocation of individual active land uses is determined by two factors: suitability and resistance. Suitability is a parameter that represents the attractiveness of a location for becoming a target land use, while the resistance parameter indicates the degree of difficulty a cell exhibits toward being transferred. Generally, the combined effect of suitability and resistance is calculated by Equation (1):
where is the total probability of location l to become land u; refers to suitability to being the target land use in location l, which is decided by biophysical and socio-economical characteristics, neighborhood effects and constraint conditions; and indicates the resistance to be converted from current land use to target land use in location, which is decided by current land use map and resistance coefficient of each land use type. In Equation (1), is calculated by Equation (2):
where is a stochastic factor ranging from 0 to 1 [22]. is the suitability of a cell to become the target land use, which represents the impacts of driving forces on land use allocation, such as elevation, slope distance to road, etc. It can be determined by expert knowledge, statistical analysis, machine learning approaches or econometric analysis. In this paper, SVM is employed to calculate for its elegance and simplicity. is the constraint score for each cells, with 0 for stable cell and 1 for changeable cells. is the effect of neighboring land use types.
3.3. Assessing Nutrient Export by InVEST Model
InVEST model is a tool that is used to map and value the goods and services from nature that sustain and fulfill human life. Based on the InVEST model, we can assess the ecosystem services and the impacts of human activities on the environment. The model is widely used in government, non-governmental organizations and research institutions [23,24,25].
NDR model (Nutrient Delivery and Retention model) is a module in InVEST, which is mainly used to map nutrient sources from watersheds and their transport to the stream. The spatial information in the NDR model can be used to assess the service of nutrient retention by natural vegetation to reflect the water purification. Anthropogenic nutrient sources include point sources and non-point sources. When it rains or snows, water flows over the landscape carrying pollutants from these surfaces into streams, rivers, lakes, and the ocean, which lead to water pollutants. Land-use planners need information regarding the contribution of ecosystems to mitigating water pollution. The NDR model provides this information for non-point source pollutants. The model was designed for nutrients: nitrogen or phosphorous or other contaminants (persistent organics, pathogens, etc.).
NDR model uses a mass balance approach, describing the movement of mass of nutrient through space [26,27]. Based on the NDR model, the paper studies the effect of land use change on nutrient export under the scenarios of CP and NCP. Specifically, we used nitrogen export to represent ecosystem service of water purification in this paper. The lower the nitrogen content, the better the water quality. In the NDR model, the nutrient export is calculated by Equations (3) and (4):
where is the total nutrient each user-defined outlet, namely the sum of the contributions from all pixels within that watershed. Pixels are determined according to resolution size of the LULC (the land use and land cover) map. means the nutrient export from each pixel i, which is reflected by the nitrogen content in this paper. represents nutrients that are transported by surface for a pixel i, while represents nutrients transported by shallow subsurface runoff. Both of the and are determined based on the LULC map and associated loading rates. NDR is the concept of nutrient delivery ratio, two delivery ratios are computed, the for nutrient transported by surface flow, and the for subsurface flow.
In Equation (3), the is the product of a delivery factor, representing the ability of downstream pixels to transport nutrient without retention, and a topographic index, representing the position on the landscape. It is calculated by Equation (5):
where and k are calibration parameters, and is a topographic index, calculated by Equation (6).
where is the average slope gradient of the upslope contributing area (m/m), A is the upslope contributing area (m2); is the length of the flow path along the cell i according to the steepest downslope direction (m); and is the slope gradient of the cell i, respectively.
is the proportion of nutrient that is not retained by downstream pixels, which is based on the maximum retention efficiency of the land between a pixel and the stream and calculated by Equations (7)–(9).
where . is the effective downstream retention on the pixel directly downstream from i, and is the maximum retention efficiency that LULC type it can reach, varying between 0 and 1. The nutrient retention capacity for a given vegetation is expressed as a proportion of the amount of nutrient from upstream. For example, high values (0.6 to 0.8) may be assigned to all natural vegetation types (such as forests, natural pastures, wetlands, or prairie), indicating that 60–80% of nutrient is retained [28,29]; is the length of the flow path from pixel i to its downstream neighbor; and is the LULC retention length of the land cover type on pixel i.
In Equation (3), the expression of the is a simple exponential decay with distance to stream, plateauing at the value corresponding to the user-defined maximum subsurface nutrient retention. The is calculated by Equation (10).
where is the maximum nutrient retention efficiency that can be reached through subsurface flow; is the subsurface flow retention length, i.e., the distance after which it can be assumed that soil retains nutrient at its maximum capacity; and l is the distance from the pixel to the stream.
4. Results
4.1. The Loss of Ecological Lands under the Two Scenarios
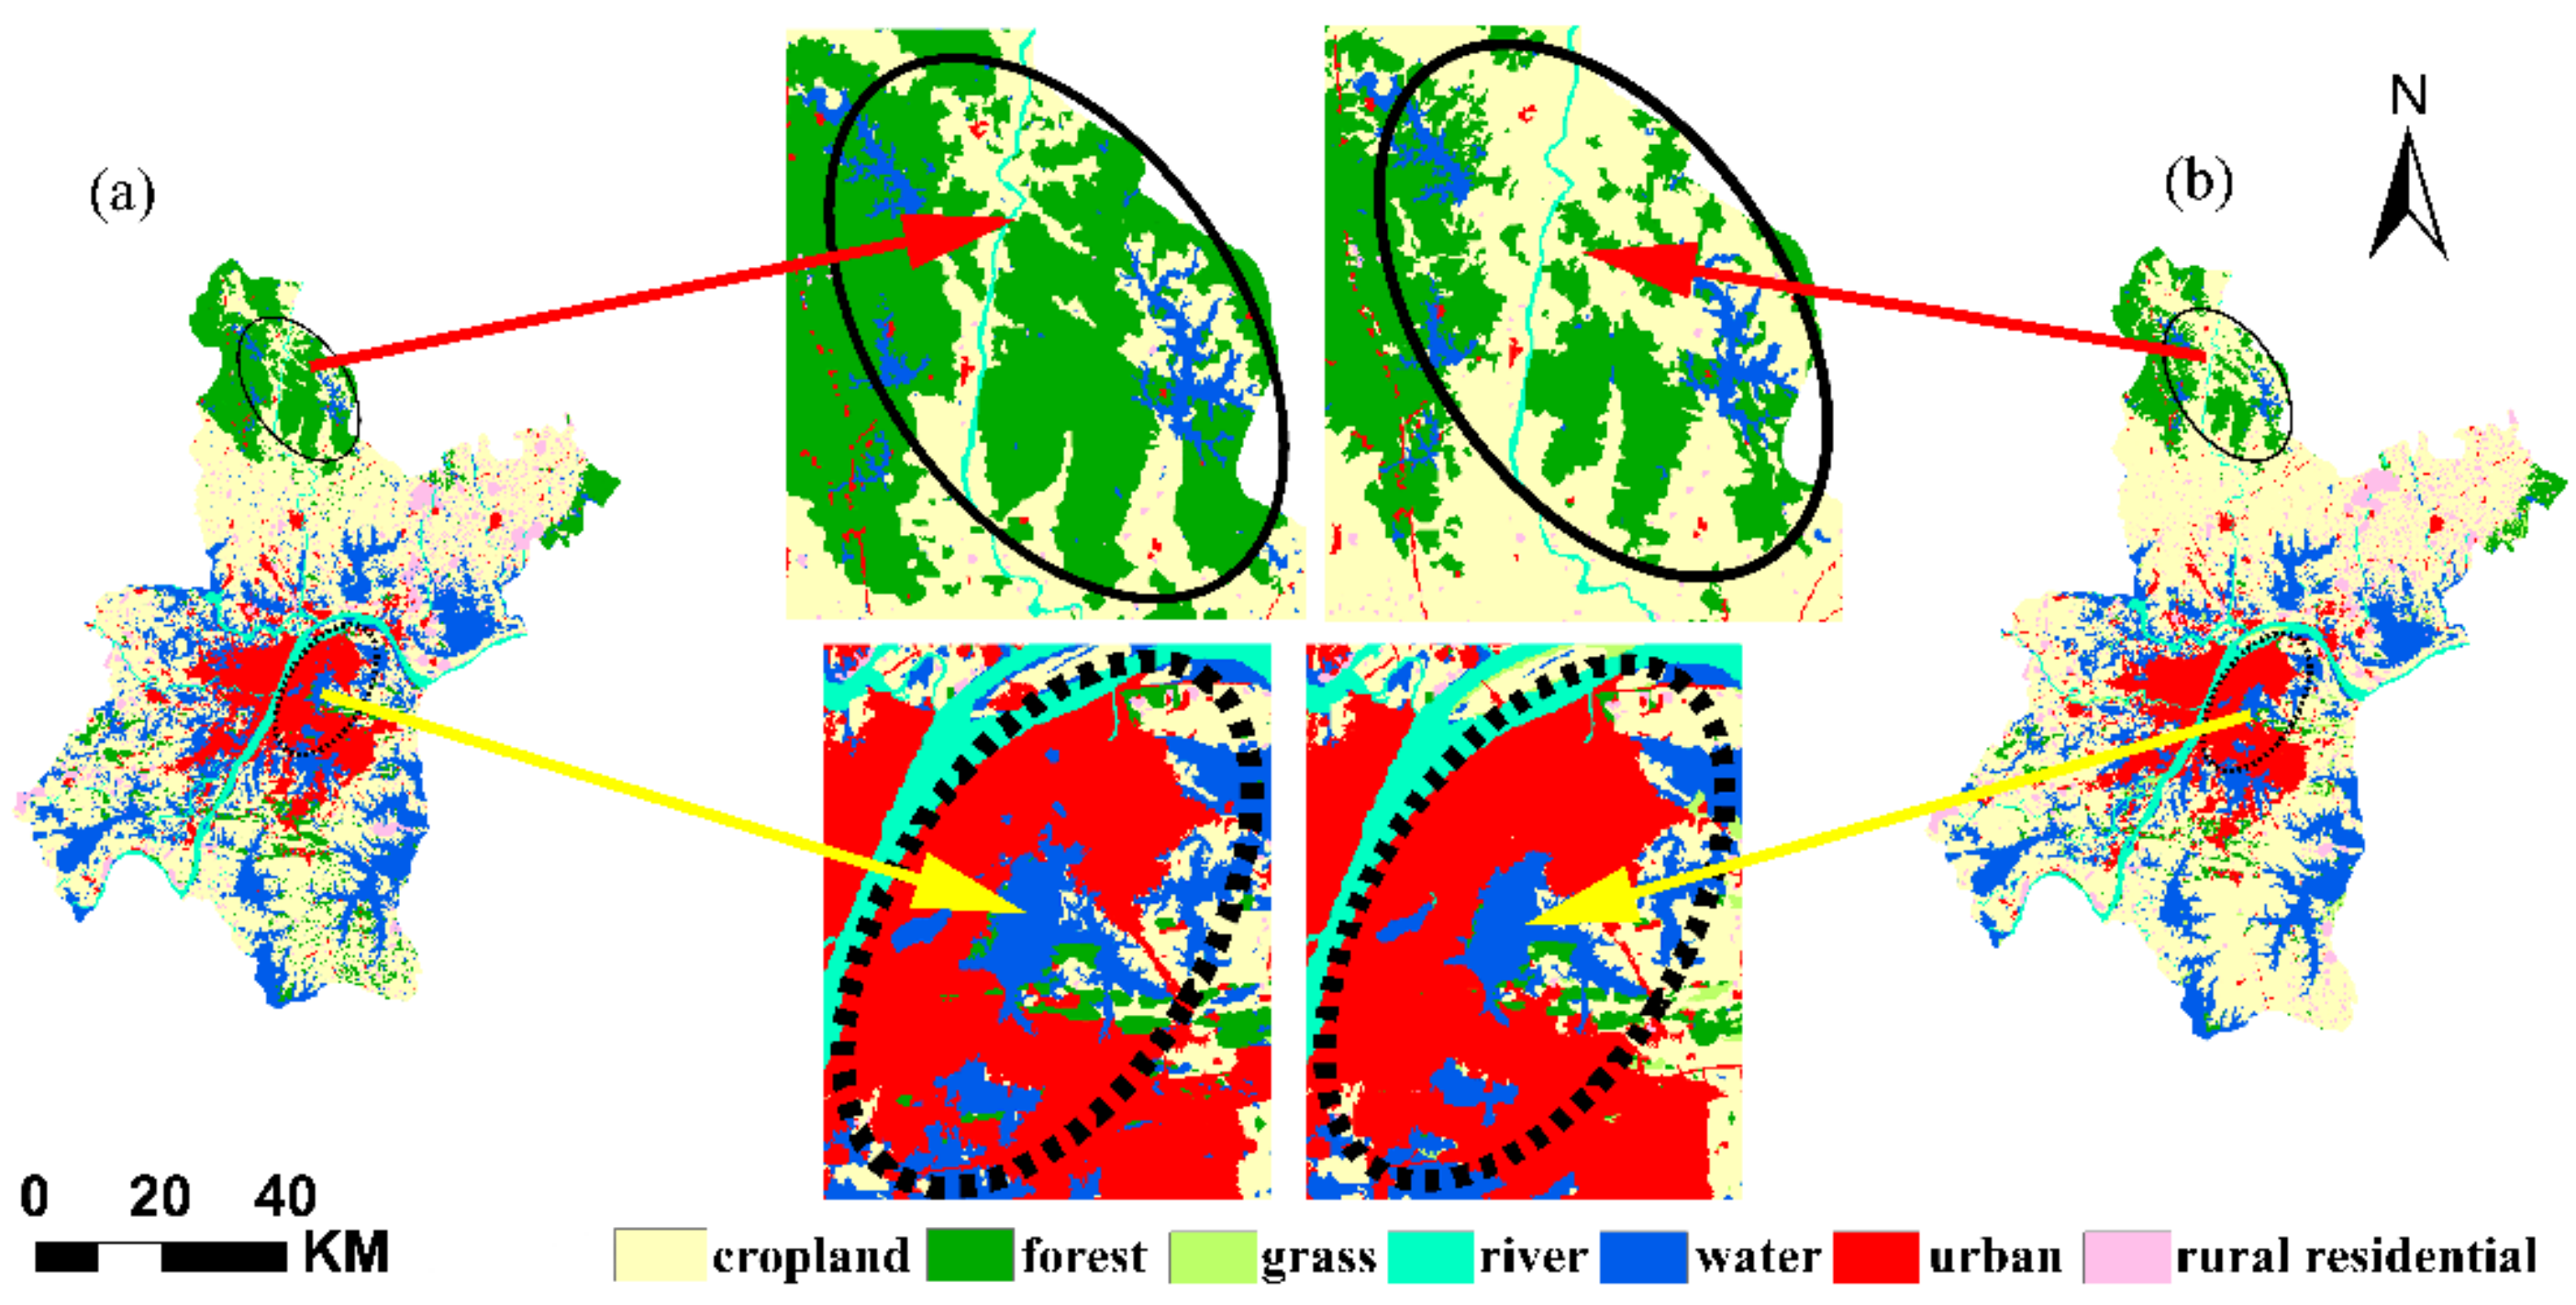
Figure 2 shows the projected land use in Wuhan in 2020 for the two scenarios: (a) No Cropland Protection (NCP); and (b) Cropland Protection (CP). Interestingly, the simulated land use maps demonstrate that the NCP and CP scenarios yield a similar expansion pattern for built-up area but a different expansion pattern for cropland (Figure 3). The solid circles indicate that more forest lands are occupied by cropland displacement in scenarios with strict cropland protection policies (CP scenario) than those without such policies (NCP scenario), while the dashed circles demonstrate that more wetlands are taken by built-up expansion in CP scenario than that in NCP scenario.
Figure 3 demonstrates that ecological lands loss take place in the scenario with strict cropland protection policies (CP scenario) because of the pressure from both built-up area expansion and cropland displacement, while all ecological lands loss will be occupied by built-up expansion in scenario without strict cropland protect policies (NCP scenario). Specifically, the processes of ecological land loss differ between the two scenarios. In scenario of NCP, only built-up area expansion caused ecological lands loss (Figure 3a). In contrast, the result of CP scenario shows both direct and indirect ecological lands loss: it is lost due to conversion into built-up area, as well as through conversion into cropland to compensate for cropland losses elsewhere as a result of urbanization (Figure 3b).
In Figure 3, bars on the left side of 0 indicate loss of each land use types, while bars on the right side of 0 illustrate gains. Different colors represent contribution of each land use type to the loss or gain. It is clear that strict cropland protection policy (CP scenario) will result in extra indirect ecological land loss, which is significantly higher than direct loss caused by built-up expansion. On the contrary, there is no indirect ecological land loss in scenario without strict cropland protection policy (NCP scenario).
The total area of ecological land loss during 2010–2020 in the CP scenario is 309 km2, while the loss from cropland displacement alone is 241 km2. In other words, 78% of the ecological land loss is an indirect result of cropland displacement. In summary, cropland displacement is responsible for most of the ecological lands loss in scenario with strict cropland protection policies.
Figure 4 shows the loss of each ecological land during 2010–2020 in different scenarios. As shown in Figure 5, forest loss in the CP scenario is 120 km2, while it is 17 km2 in NCP scenario. Grassland loss reaches 33 km2 in CP scenario, while only 15 km2 for NCP scenario. Furthermore, the loss of wetlands in the CP scenario reaches 156 km2, while it is only 36 km2 in the NCP scenario.
4.2. The Impact of Cropland Balance Policy on the Service of Water Purification
Based on the InVEST NDR model, the nutrient exports of the two different scenarios were calculated to explore the impact of Cropland Balance Policy on the service of water purification. In this paper, we use the nitrogen export to characterize the water purification. The higher the nitrogen export, the worse the water purification. The result shows that the nitrogen export in the NCP scenario is , while it is in CP scenario, which is 8.36% higher than that in NCP scenario. Obviously, strict cropland protection policies will lead to more nutrient export, which further influence the water purification.
4.3. Mechanism of the Impacts of Cropland Protection Policy on Ecosystem Service of Water Purification
Figure 5 shows the nitrogen exports transported by surface and subsurface flow under the two different scenarios. It is shown that the nitrogen export transported by subsurface is while the surface is in NCP scenario, thus the former is 1.79 times greater than the latter. Similarly, in CP scenario, the nitrogen export transported by subsurface is , 1.67 times greater than the surface, which is . In general, the nutrients transported by subsurface is 1.73 times greater than the surface average in the two scenarios. We therefore believe that, to improve the service of water purification, it is better to decrease the nutrients export mainly by subsurface.
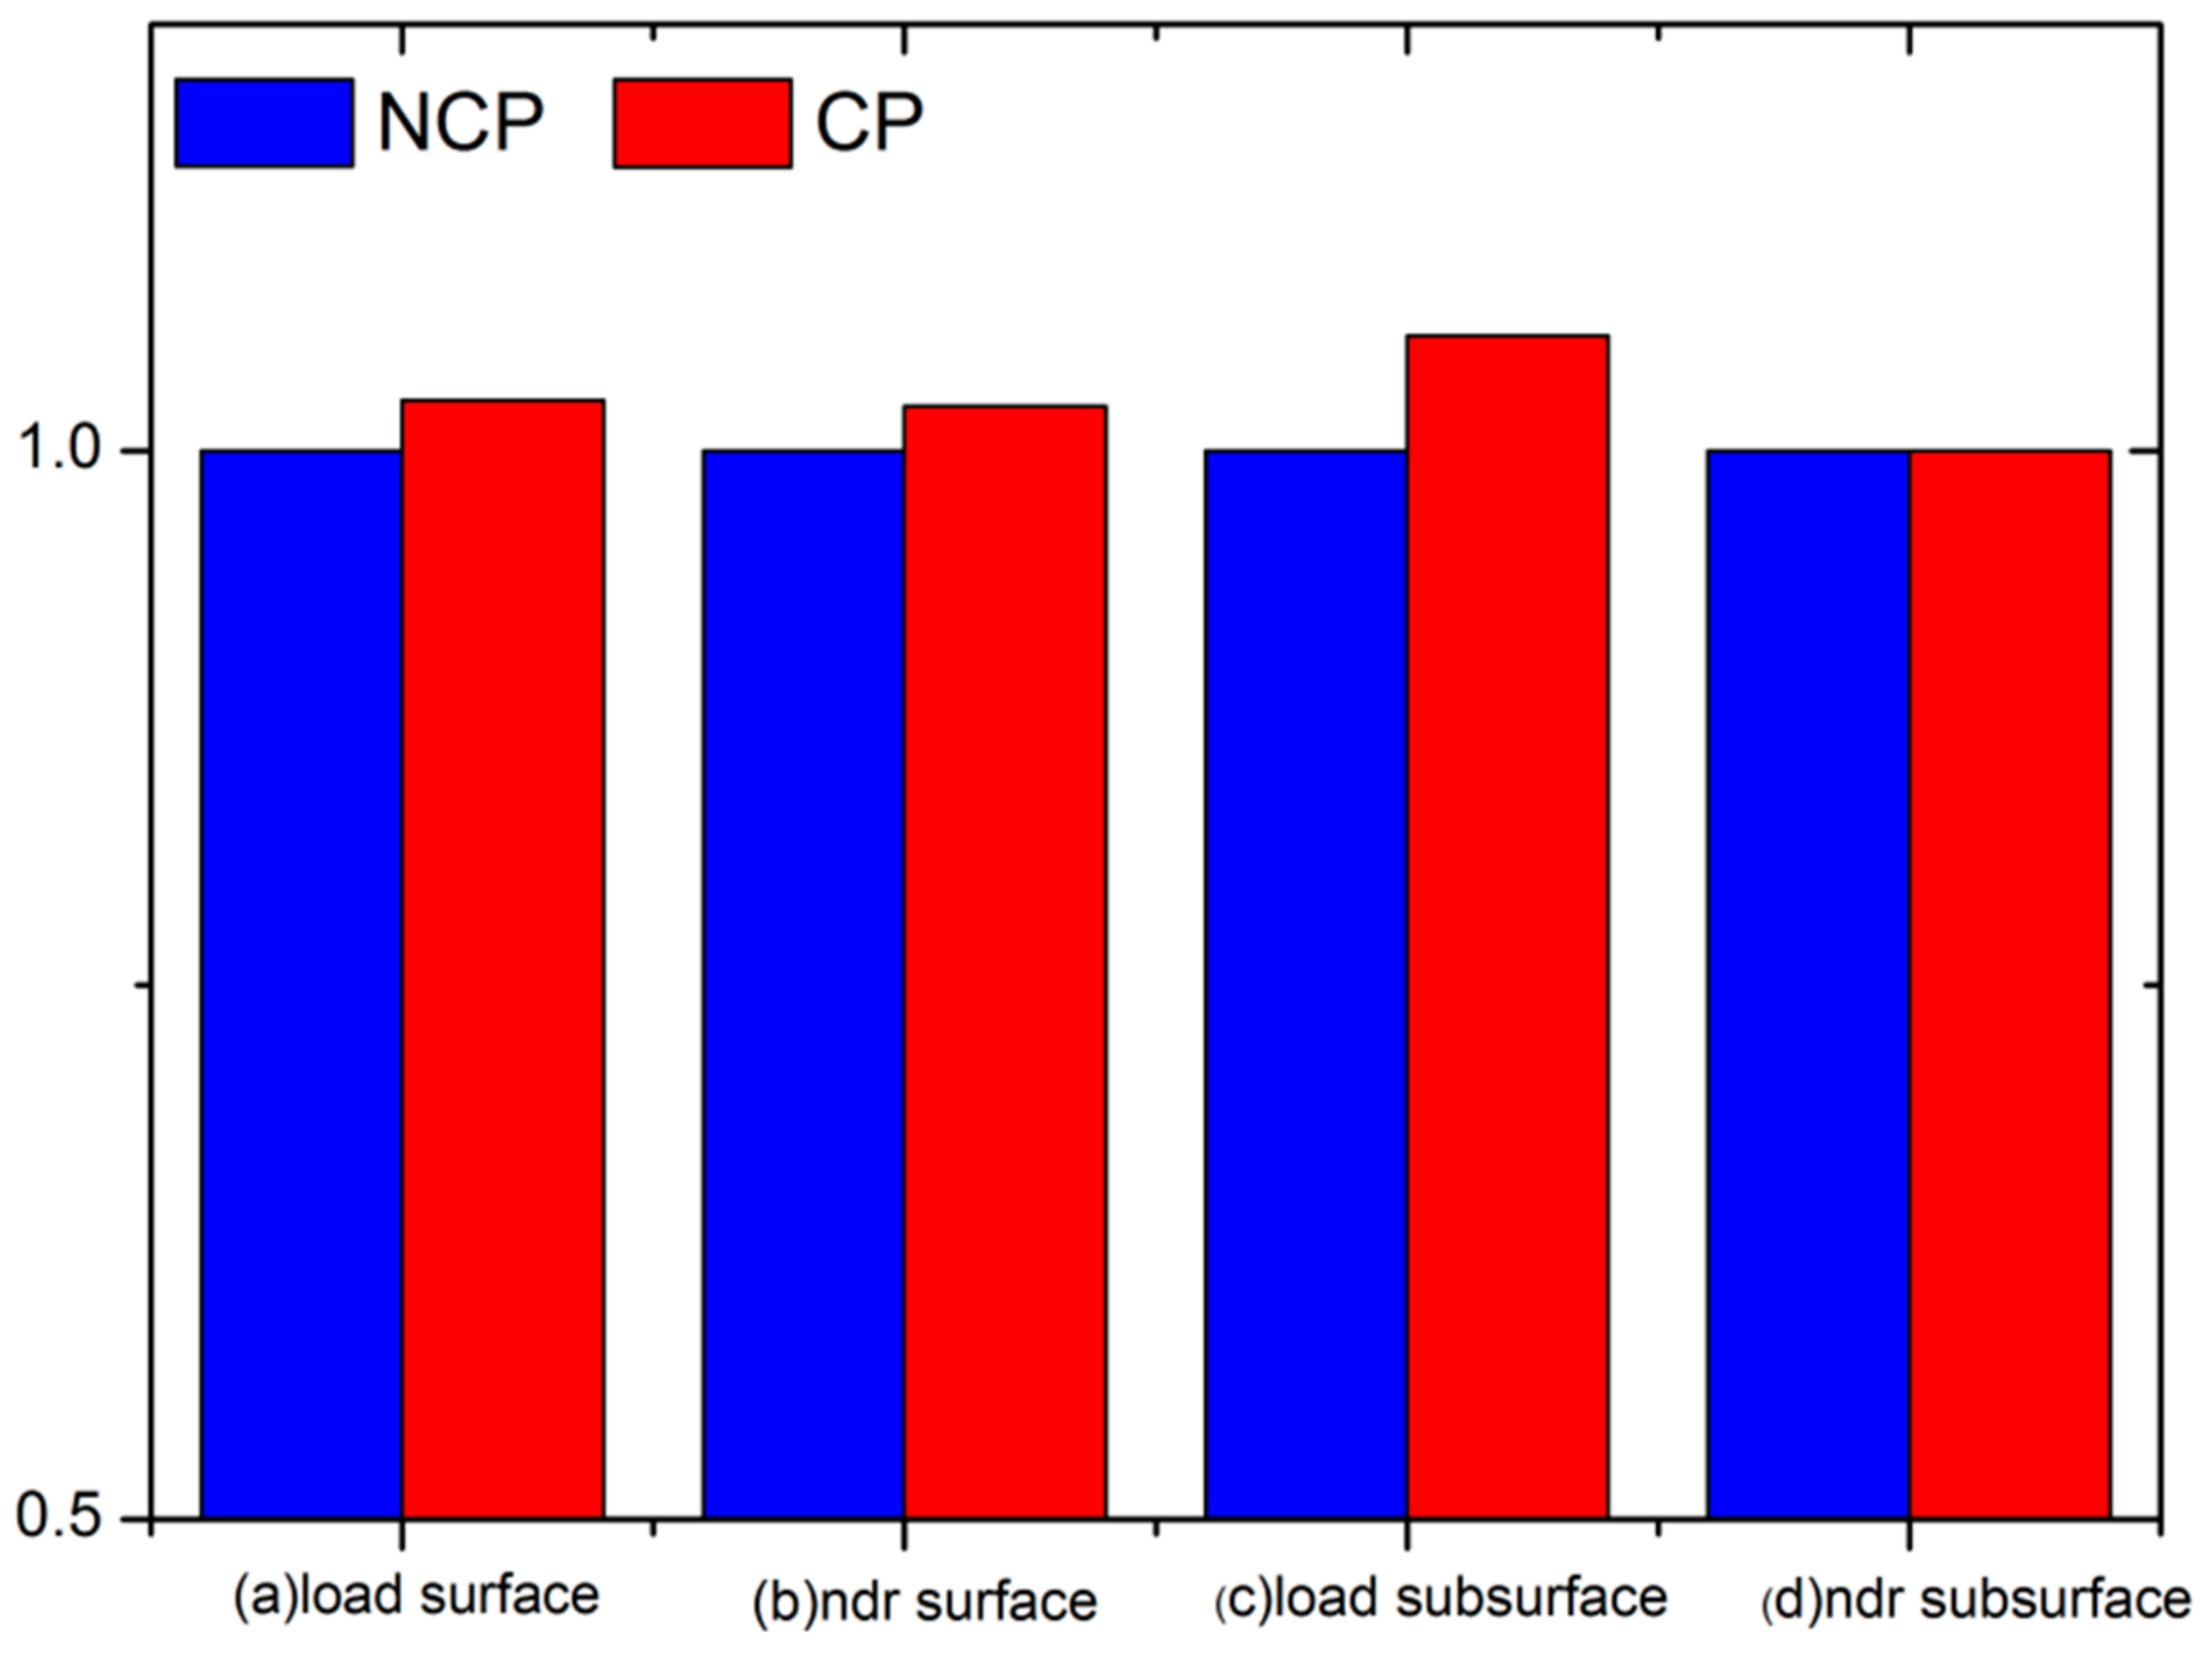
Table 2 shows the value of variables under the two different scenarios in the NDR model. Due to the inconsistent magnitude of each variable, we take the value of NCP scenario as the reference, that is, the value is set to 1, and then the value of CP scenarios is set according to the same proportion. In this way, the effect of each scenario on the difference of nutrient export can be observed more intuitively.
From Equation (3), the nutrient export is mainly composed of four parts: , , and . Among them, and represent nutrients that are transported by surface and shallow subsurface runoff, respectively, while and are the nutrient delivery ratios of the nutrient transported by surface and subsurface flow, respectively. As can be seen in Figure 6, the differences of and in the two different scenarios are relatively small, while the has large difference between the two scenarios, and the almost keep the same. It is inferred that the difference of nutrient export in the two scenarios is mainly caused by , followed by and . The value of does not change with the different policy scenarios.
5. Discussion and Conclusions
In this paper, we set up scenarios under two different policies: (1) No strict Cropland Protection scenario (NCP); and (2) strict Cropland Protection scenario (CP), and aim to explore the impact of Cropland Balance Policy on ecological lands. The results show that the scenarios with strict cropland protection will lead to more amount of ecological land loss compared with scenarios without cropland protection. The conclusion is consistent with Van Vliet et al. [8], who think that the ecological land loss resulted by built-up area expansion directly as well as ecological land loss indirectly from the compensation of cropland losses caused by built-up area expansion yield a conversion of natural habitat elsewhere.
Ecological lands, especially water resources, are of prime importance for human beings and society. However, water resources are vulnerable because of the need for socio-economic development [30]. As one of the cities with the largest water resources in China, the importance of the impact of Cropland Balance Policy on ecological lands, especially the water resources, is obvious for Wuhan. The paper shows that the nitrogen export in the NCP scenario is , while the CP scenario is , which is 8.36% higher than the former. The result respects that the Cropland Balance Policy has a negative impact on water purification.
Water purification is one of the indicators to measure ecosystem services. In this study, the nitrogen transported by subsurface is 1.73 times greater than the surface average in the two scenarios, which proves that nutrient was mainly transported by subsurface flow.
To improve the service of water purification, we can consider reducing the load and NDR. However, different scenarios affect the water purification mainly by , which depends on the amount of anthropogenic nutrient export. Since anthropogenic nutrient sources include point sources and non-point sources, a direct way to reduce water pollution is to reduce the amount of anthropogenic inputs. When this option fails, ecosystems can provide a purification service by retaining or degrading pollutants before they enter the stream. For instance, vegetation can remove pollutants by storing them in tissue or releasing them back to the environment in another form. Soils can also store and trap some soluble pollutants. Wetlands can slow flow long enough for pollutants to be taken up by vegetation. Thus, the land-use planners need enough information and knowledge of the contribution of ecosystems to mitigate the water pollution.
In addition, we can reduce the nutrient export by lowering the NDR (nutrient delivery ratio). As can be seen from Equations (5)–(10), the main factors affecting NDR are eff, li and lLULC. Among them, eff is the maximum nutrient retention efficiency that can be reached through surface or subsurface flow, varying from 0 and 1. Usually, the value of eff is based on empirical studies, and the smaller the value, the more the nutrient export. The li respects the distance from the pixel to the stream, and the higher the value of li, the less the nutrient export. Thus, we can place the nutrient source as far as possible from the stream to increase the li. This view is consistent with Taniwaki et al. [31], who strongly recommend the preservation of robust riparian forests in the headwaters of tropical watersheds with intensive agriculture to improve water purification. The lLULC is the surface or subsurface flow retention length; that is, the distance after which it can be assumed that soil retains nutrient at its maximum capacity. However, if nutrients travel a distance smaller than the retention length, the retention efficiency will be less than the maximum value eff, following an exponential decay.
Acknowledgments
This study was supported by the National Natural Science Foundation of China (No. 41371113, 91325302, and 41101098), Fundamental Research Funds for the Central Universities (No. 2662017PY063), and the Outstanding Youth Foundation Project for Humanities and Social Sciences in Huazhong Agricultural University. This research contributes to the Global Land Programme (www.glp.earth).
Author Contributions
Yun Mei, Xinghe Kong, Xinli Ke and Bohan Yang designed research; Yun Mei and Xinli Ke performed research; Yun Mei and Xinli Ke analyzed data; and Yun Mei, Xinghe Kong, Xinli Ke and Bohan Yang wrote the paper.
Conflicts of Interest
The authors declare no conflict of interest.
References
- Zhang, C.; Zhou, K.; Yang, S.; Shao, Z. On electricity consumption and economic growth in China. Renew. Sustain. Energy Rev. 2017, 76, 353–368. [Google Scholar] [CrossRef]
- Meyfroidt, P.; Lambin, E.F. Global Forest Transition: Prospects for an End to Deforestation. Annu. Rev. Environ. Resour. 2011, 36, 343–371. [Google Scholar] [CrossRef]
- Wang, X.; Hui, C.; Choguill, C.; Jia, S. The new urbanization policy in China: Which way forward? Habitat Int. 2015, 47, 279–284. [Google Scholar] [CrossRef]
- He, C.; Liu, Z.; Tian, J.; Ma, Q. Urban expansion dynamics and natural habitat loss in China: A multiscale landscape perspective. Glob. Chang. Biol. 2014, 20, 2886. [Google Scholar] [CrossRef] [PubMed]
- Wei, S.; Pijanowski, B.C. The effects of China’s cultivated land balance program on potential land productivity at a national scale. Appl. Geogr. 2014, 46, 158–170. [Google Scholar]
- Lichtenberg, E.; Ding, C. Assessing Farmland Protection Policy in China. Land Use Policy 2008, 25, 59–68. [Google Scholar] [CrossRef]
- Zhong, T.; Huang, X.; Zhang, X.; Scott, S.; Wang, K. The effects of basic arable land protection planning in Fuyang County, Zhejiang Province, China. Appl. Geogr. 2012, 35, 422–438. [Google Scholar] [CrossRef]
- Vliet, J.V.; Bregt, A.K.; Brown, D.G.; Delden, H.V.; Heckbert, S. A review of current calibration and validation practices in land-change modeling. Environ. Model. Softw. 2016, 82, 174–182. [Google Scholar] [CrossRef]
- Seto, K.C.; Güneralp, B.; Hutyra, L.R. Global forecasts of urban expansion to 2030 and direct impacts on biodiversity and carbon pools. Proc. Natl. Acad. Sci. USA 2012, 109, 16083–16088. [Google Scholar] [CrossRef] [PubMed]
- Nhapi, I.; Hoko, Z.; Siebel, A.; Gijzen, H.J. Assessment of the MajorWater Andnutrient Flows in the Chivero Catchment Area, Zimbabwe. Phys. Chem. Earth 2002, 27, 783–792. [Google Scholar] [CrossRef]
- Ouyanga, Y.; Nkedi Kizza, P.; Wu, Q.T.; Shinde, D.; Huang, C.H. Assessment of Seasonal Variations in Surface Water Quality. Water Res. 2006, 40, 3800–3810. [Google Scholar] [CrossRef] [PubMed]
- Ekholm, P.; Kallio, K.; Salo, S.; Pietilainen, O.P.; Rekolainen, S. Relationship between Catchment Characteristics and Nutrient Concentrations in an Agricultural River System. Water Res. 2000, 34, 3709–3716. [Google Scholar] [CrossRef]
- Turner, R.E.; Rabalais, N.N. Linking Landscape and Water Quality in the Mississippi River Basin for 200 Years. Bioscience 2003, 53, 563–572. [Google Scholar] [CrossRef]
- Ke, X.; Qi, L.; Zeng, C. A partitioned and asynchronous cellular automata model for urban growth simulation. Int. J. Geogr. Inf. Sci. 2015, 30, 1–23. [Google Scholar] [CrossRef]
- Yang, B.; Meng, F.; Ke, X. Analysis on Urban Lake Change during Rapid Urbanization Using a Synergistic Approach: A Case Study of Wuhan, China. Phys. Chem. Earth 2015, 80–90, 127–135. [Google Scholar] [CrossRef]
- Berry, P.A.M.; Garlick, J.D.; Smith, R.G. Near-global validation of the SRTM DEM using satellite radar altimetry. Remote Sens. Environ. 2007, 49, 100–105. [Google Scholar] [CrossRef]
- Government of Hubei Province. Land Use Planning for Hubei Province (2016–2020). 2009. Available online: http://www.hubei.gov.cn/zwgk/zdlyxxgk/zdhfwzs/tdlygh/201208/t20120821_392757_1.shtml (accessed on 17 August 2017).
- Liu, X.; Li, X.; Liu, L.; He, J.; Ai, B. A bottom-up approach to discover transition 494 rules of cellular automata using ant intelligence. Int. J. Geogr. Inf. Sci. 2008, 22, 1247–1269. [Google Scholar] [CrossRef]
- Brown, G.; Brabyn, L. The extrapolation of social landscape values to a national level in New Zealand using landscape character classification. Appl. Geogr. 2012, 35, 84–94. [Google Scholar] [CrossRef]
- White, R.; Engelen, G. Cellular automata as the basis of integrated dynamic regional modelling. Environ. Plan. B Urban Anal. City Sci. 2008, 24, 235–246. [Google Scholar] [CrossRef]
- Xie, Y. A Generalized Model for Cellular Urban Dynamics. Geogr. Anal. 2010, 28, 350–373. [Google Scholar] [CrossRef]
- Ke, X.; Zheng, W.; Zhou, T.; Liu, X. A CA-based land system change model: LANDSCAPE. Int. J. Geogr. Inf. Sci. 2017. [Google Scholar] [CrossRef]
- Hamel, P.; Chaplin-Kramer, R.; Sim, S.; Mueller, C. A new approach to modeling the sediment retention service (InVEST 3.0): Case study of the Cape Fear catchment, North Carolina, USA. Sci. Total Environ. 2015, 524–525, 166–177. [Google Scholar] [CrossRef] [PubMed]
- He, C.; Zhang, D.; Huang, Q.; Zhao, Y. Assessing the potential impacts of urban expansion on regional carbon storage by linking the LUSD-urban and InVEST models. Environ. Model. Softw. 2016, 75, 44–58. [Google Scholar] [CrossRef]
- Jiang, W.; Deng, Y.; Tang, Z.; Lei, X.; Chen, Z. Modelling the potential impacts of urban ecosystem changes on carbon storage under different scenarios by linking the CLUE-S and the InVEST models. Ecol. Model. 2017, 345, 30–40. [Google Scholar] [CrossRef]
- Endreny, T.A.; Wood, E.F. Watershed weighting of export coefficients to map critical phosphorous loading areas. J. Am. Water Resour. Assoc. 2003, 39, 165–181. [Google Scholar] [CrossRef]
- Mayer, P.M.; Reynolds, S.K.; Mccutchen, M.D.; Canfield, T.J. Meta-Analysis of Nitrogen Removal in Riparian Buffers. J. Environ. Qual. 2007, 36, 1172–1180. [Google Scholar] [CrossRef] [PubMed]
- Zhang, X.; Liu, X.; Zhang, M.; Dahlgren, R.A.; Eitzel, M. A review of vegetated buffers and a meta-analysis of their mitigation efficacy in reducing nonpoint source pollution. J. Environ. Qual. 2009, 39, 76–84. [Google Scholar] [CrossRef] [PubMed]
- Heathwaite, A.L.; Quinn, P.F.; Hewett, C.J.M. Modelling and managing critical source areas of diffuse pollution from agricultural land using flow connectivity simulation. J. Hydrol. 2005, 304, 446–461. [Google Scholar] [CrossRef]
- Cai, J.; Varis, O.; Yin, H. China’s water resources vulnerability: A spatio-temporal analysis during 2003–2013. J. Clean. Prod. 2017, 142, 2901–2910. [Google Scholar] [CrossRef]
- Taniwaki, R.J.; Cassiano, C.C.; Filoso, S.; Ferraz, S.F.B.; Camargo, P.B.; Martinelli, L.A. Impacts of converting low-intensity pastureland to high-intensity bioenergy cropland on the water quality of tropical streams in Brazil. Sci. Total Environ. 2017, 15, 339–347. [Google Scholar] [CrossRef] [PubMed]
Figure 1.
Land use in the study area in 2010, and its location in China.

Figure 2.
Simulated land use maps of Wuhan in 2020 with different scenarios of: (a) NCP (No Cropland Protection) scenario; and (b) CP (Cropland Protection) scenario.
Figure 2.
Simulated land use maps of Wuhan in 2020 with different scenarios of: (a) NCP (No Cropland Protection) scenario; and (b) CP (Cropland Protection) scenario.
Figure 3.
Process of ecological lands loss during 2010–2020 in Wuhan in Scenario of: (a) NCP; and (b) CP.
Figure 3.
Process of ecological lands loss during 2010–2020 in Wuhan in Scenario of: (a) NCP; and (b) CP.
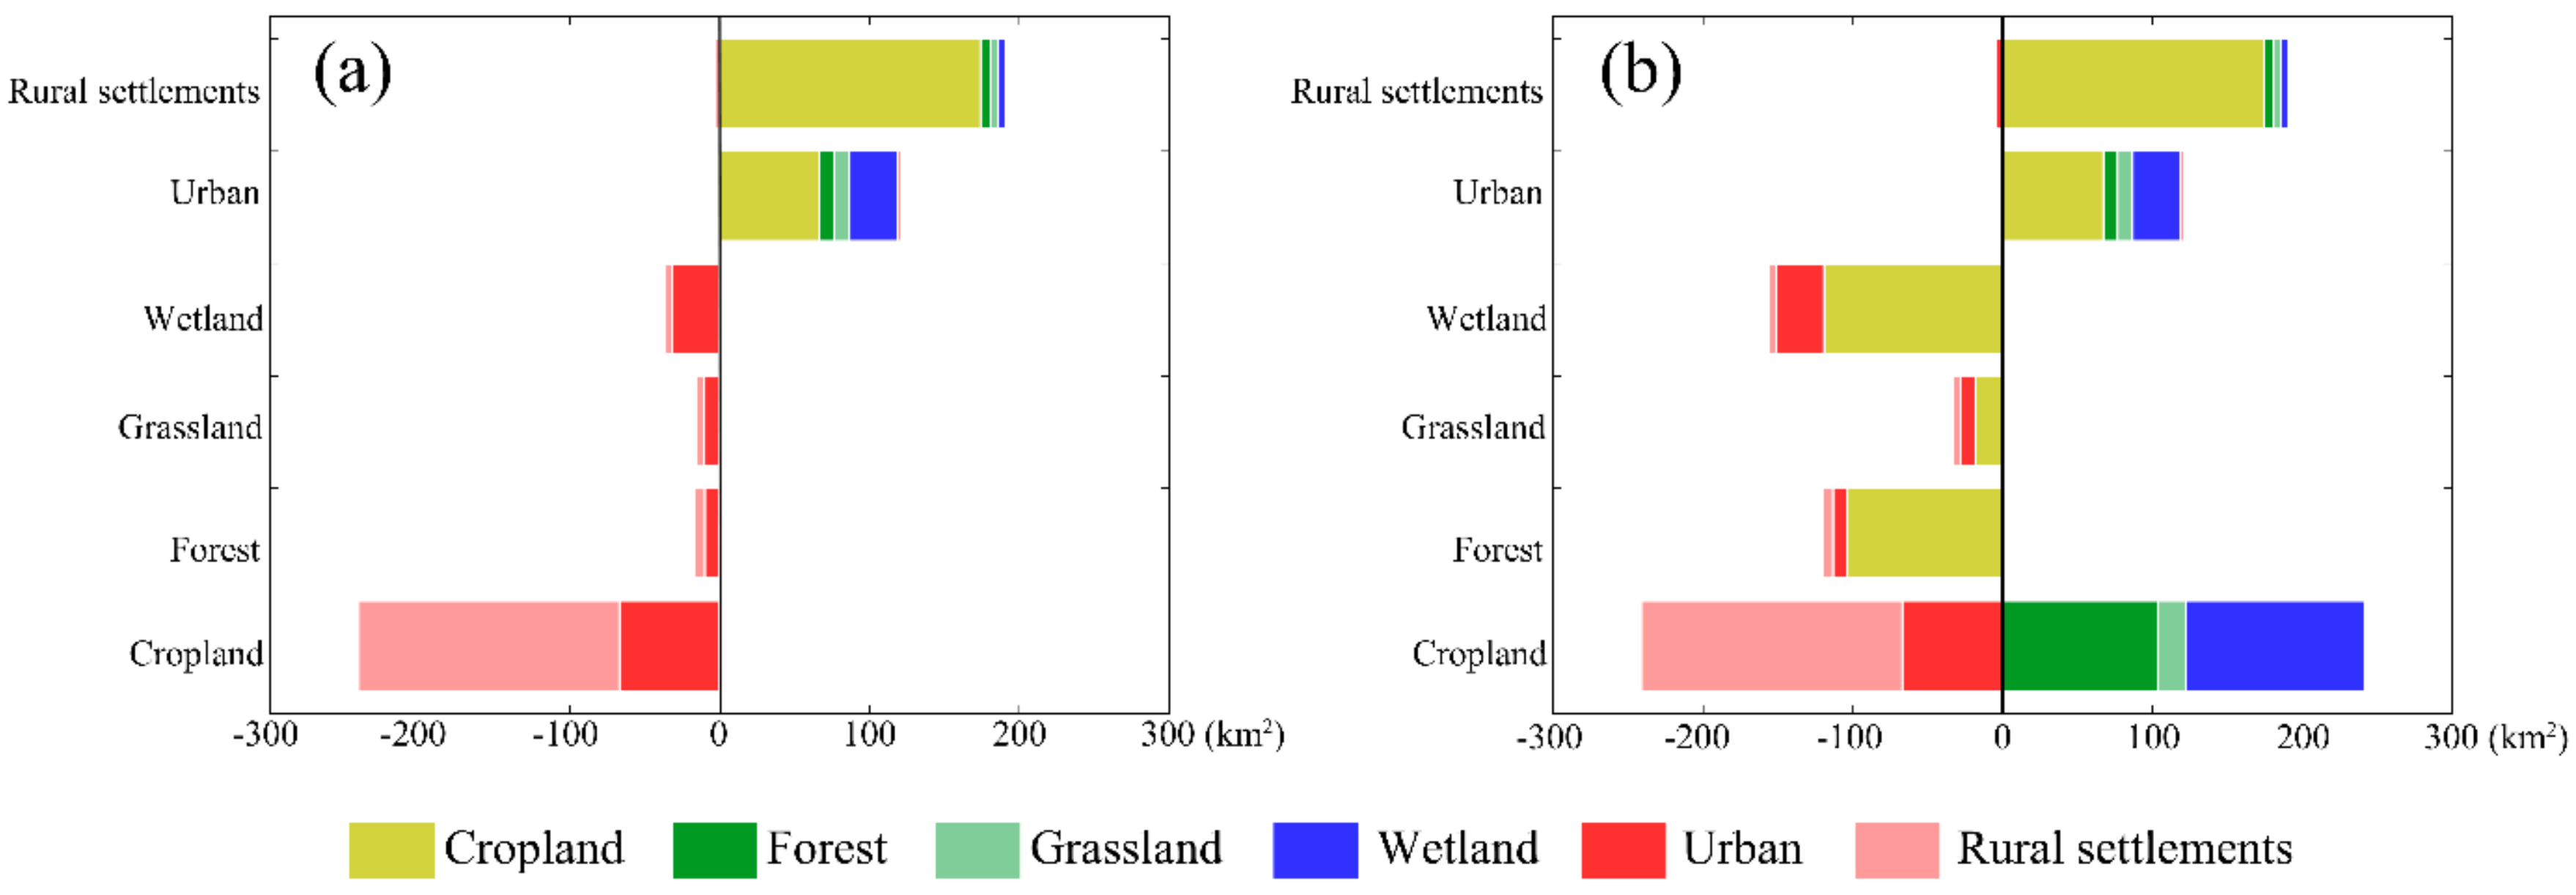
Figure 4.
Loss of each ecological land type during 2010–2020 in NCP and CP scenarios.
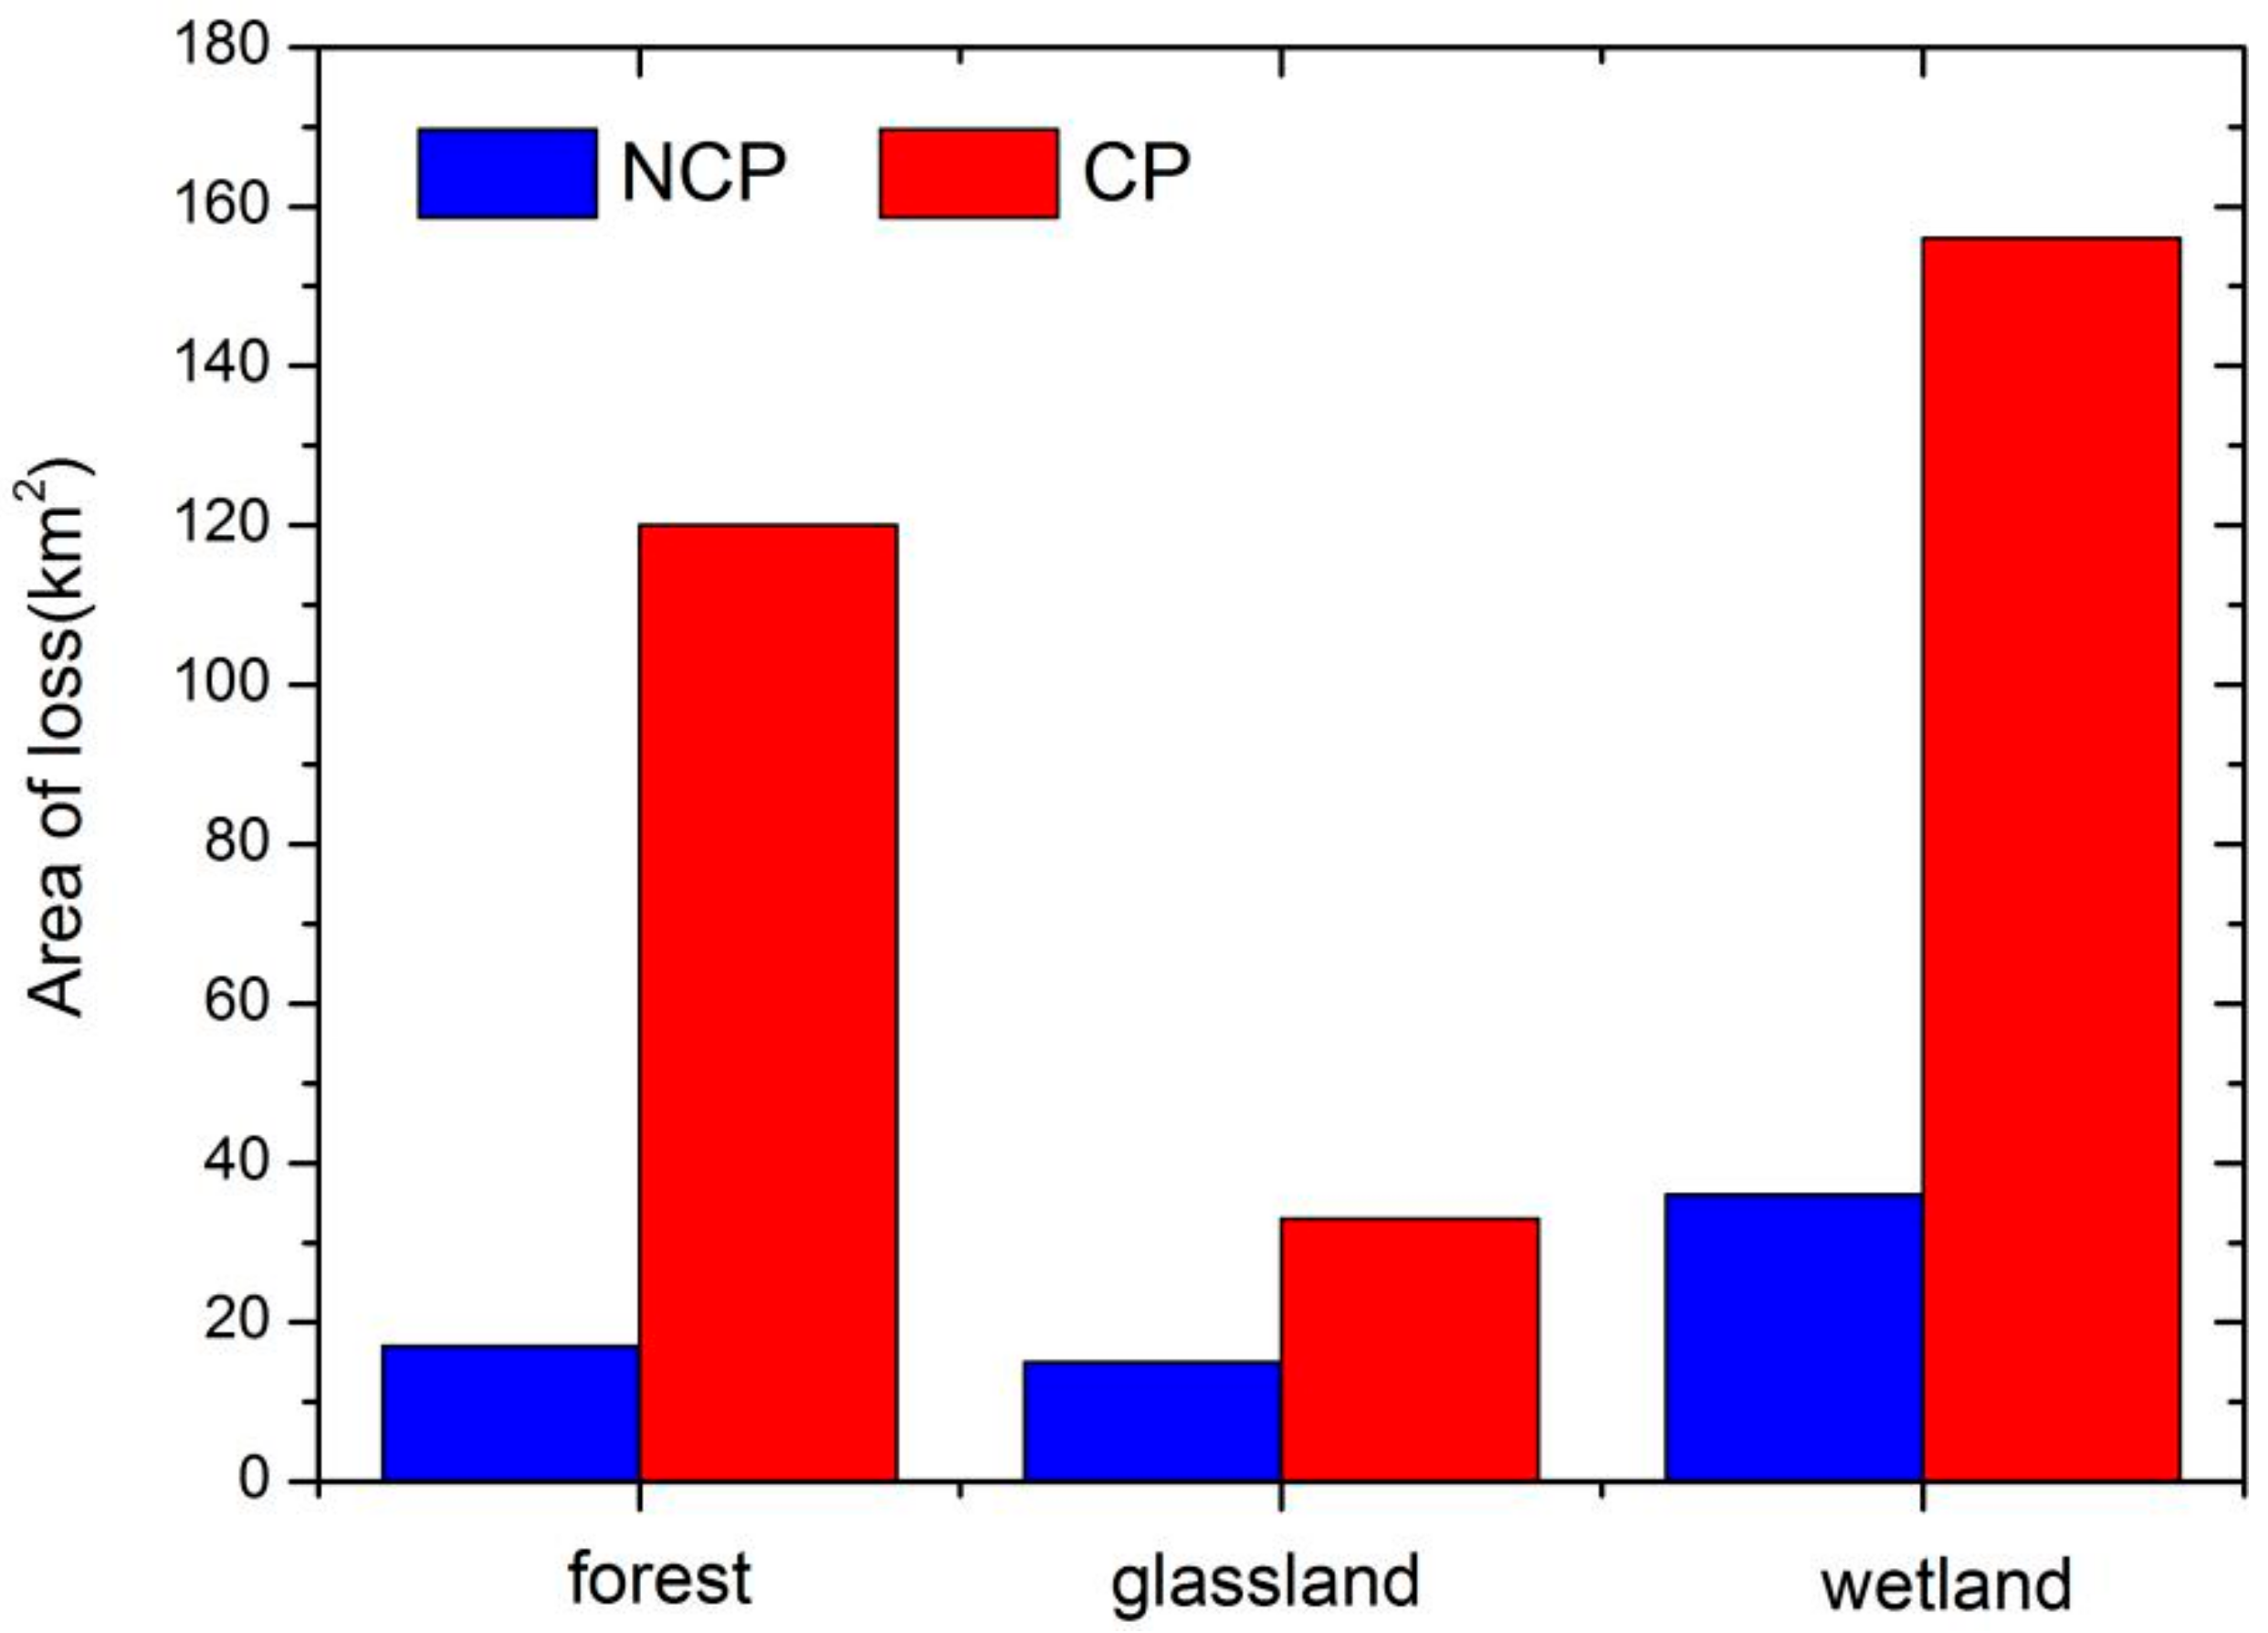
Figure 5.
Nitrogen export transported by surface and subsurface in two different scenarios.
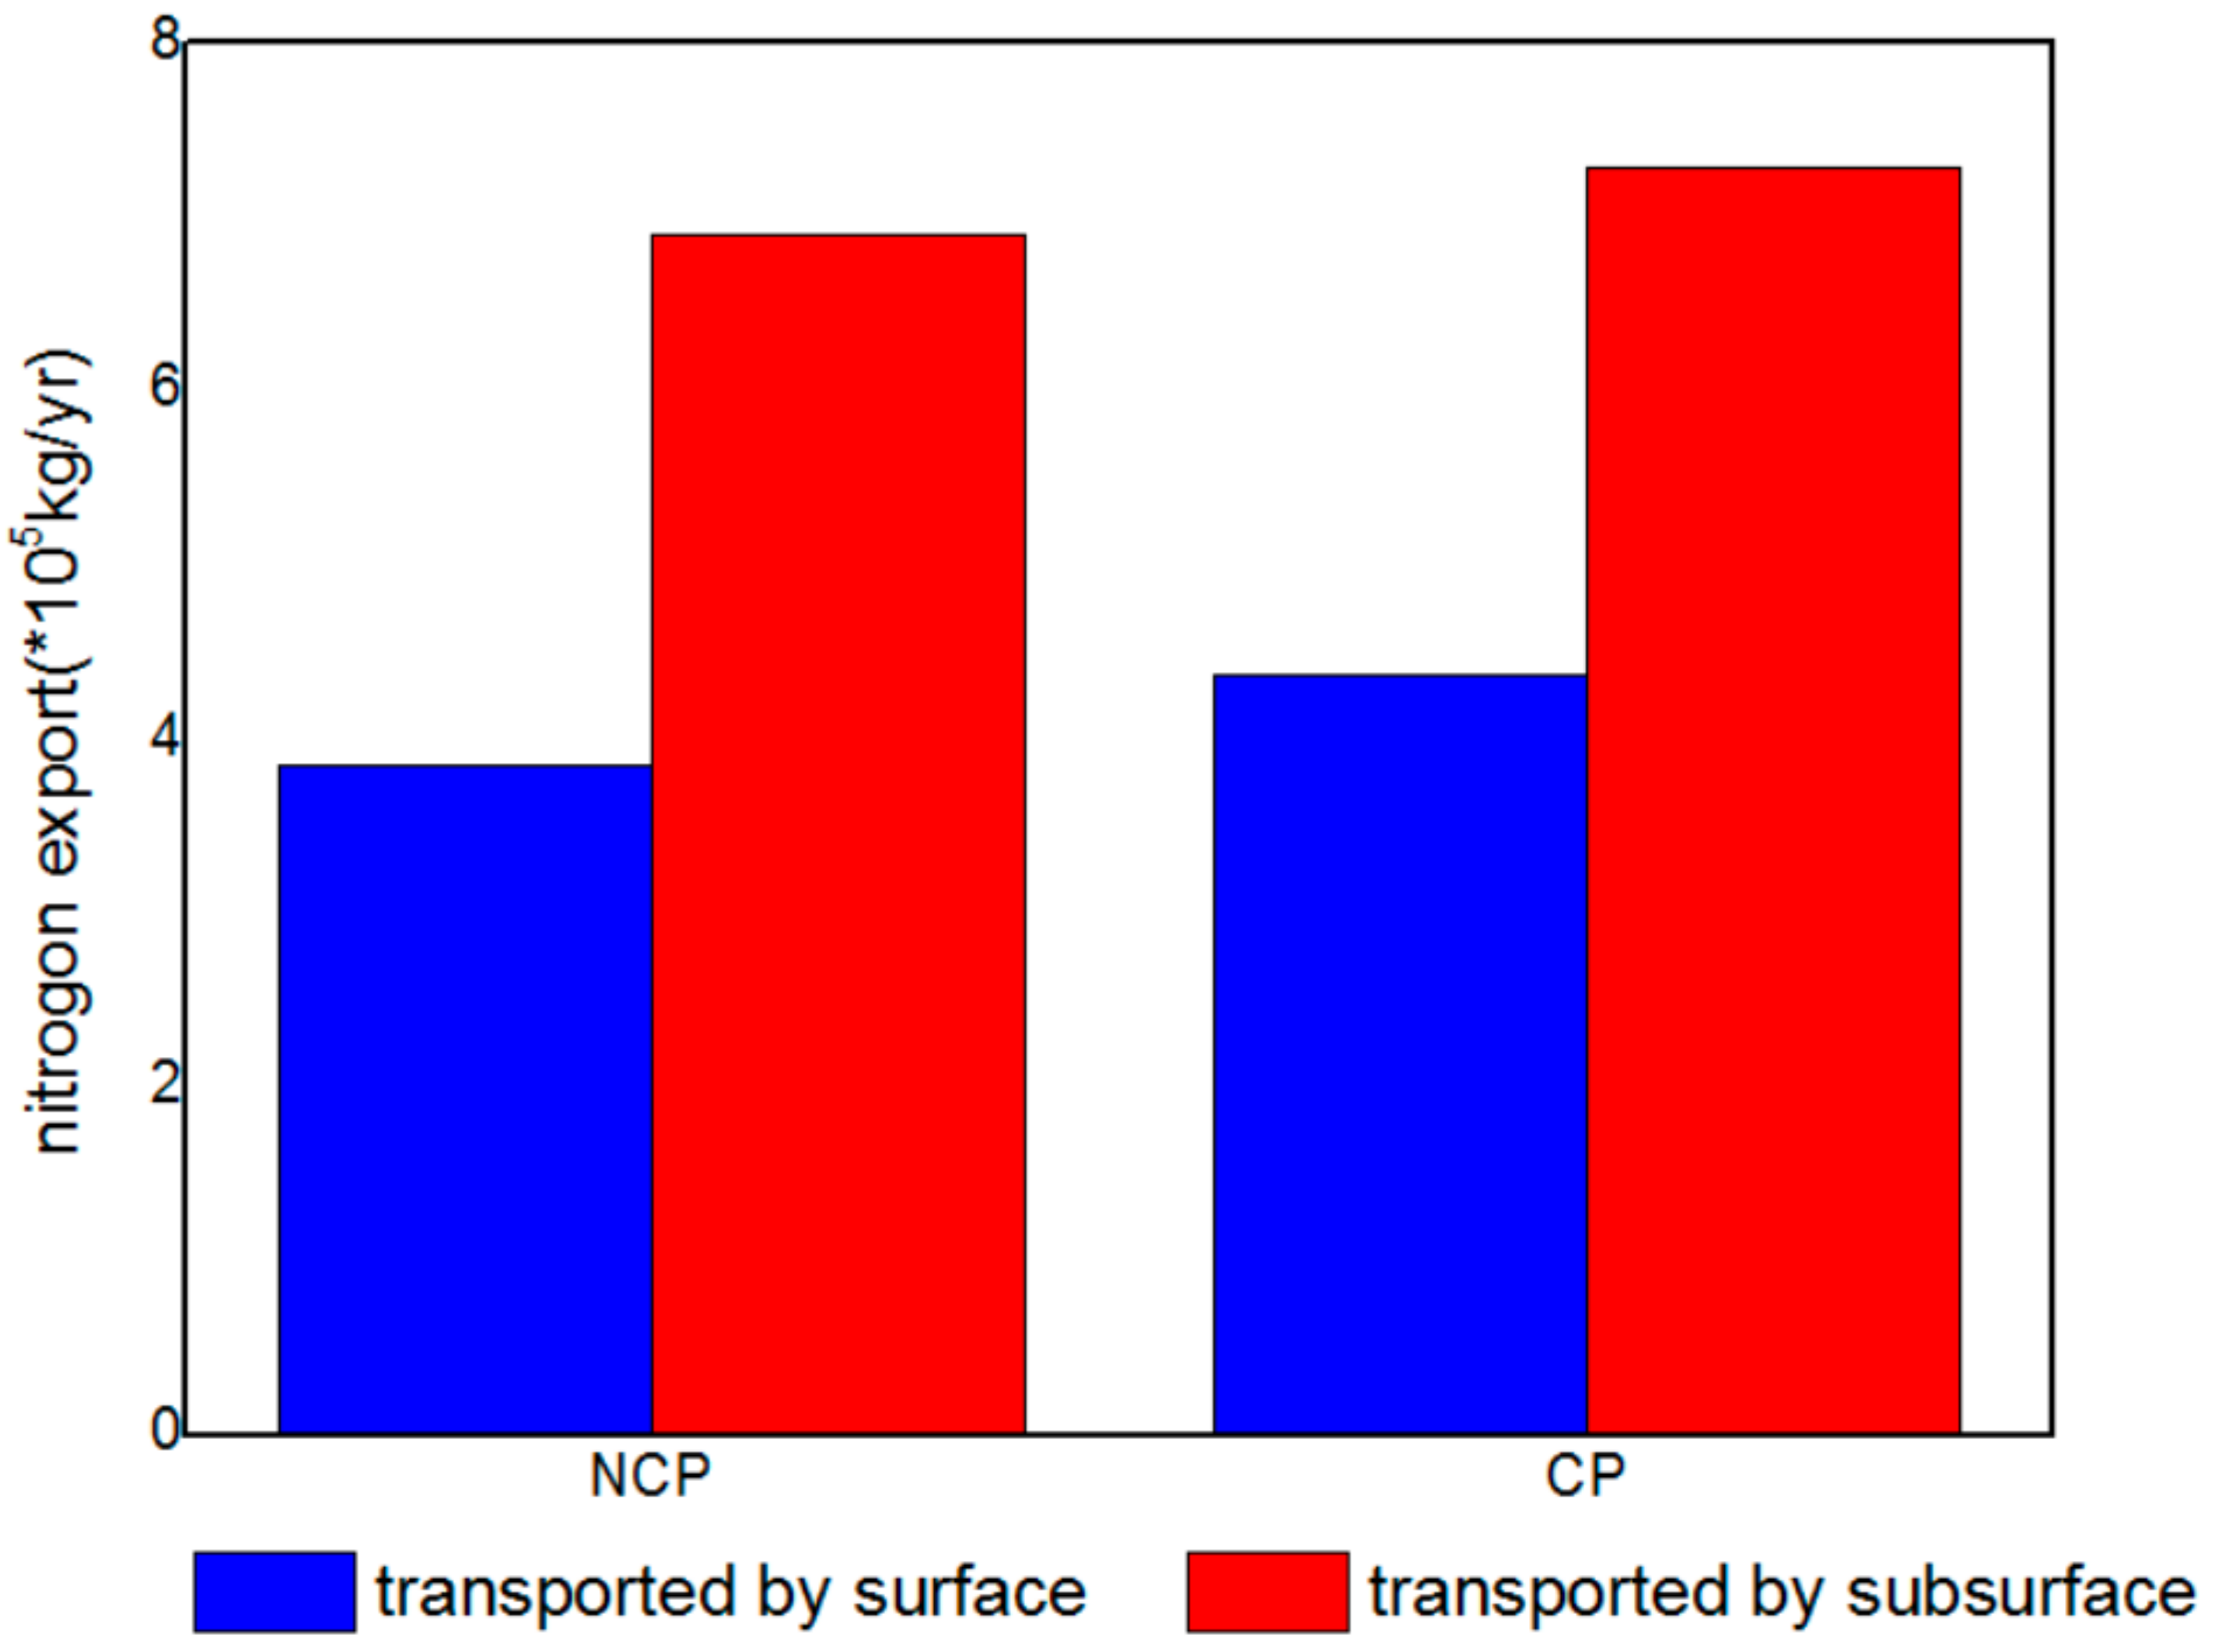
Figure 6.
The value of variables in NDR model in different scenarios.

Table 1.
The parameters set for land use scenarios.
| Different Scenarios | Cropland | Forest | Grassland | River | Wetland | Urban | Rural Settlements | |
|---|---|---|---|---|---|---|---|---|
| Initial | Amount (km2) (2000) | 5188 | 804 | 146 | 304 | 1458 | 378 | 228 |
| Amount (km2) (2010) | 4706 | 783 | 138 | 304 | 1531 | 789 | 255 | |
| NCP (2020) | Demand (km2) | - | - | - | - | - | 910 | 443 |
| Resistance (2010–2020) | 1.1 | 1.05 | 1 | 1 | 1 | 1.2 | 1.15 | |
| CP (2020) | Demand (km2) | 4706 | - | - | - | - | 910 | 443 |
| Resistance (2010–2020) | 1.1 | 1.05 | 1 | 1 | 1 | 1.2 | 1.15 | |
Note: The parameters for demand are only indicated for active land use types.
Table 2.
The value of variables in the NDR (Nutrient Delivery and Retention) model.
| Scenarios | NCP | CP |
|---|---|---|
| Nitrogen export () | 10.75 | 11.65 |
| Load surface () | 5.43 | 5.56 |
| NDR surface | 0.16 | 0.17 |
| Load subsurface () | 3.57 | 3.76 |
| NDR subsurface | 0.22 | 0.22 |
© 2017 by the authors. Licensee MDPI, Basel, Switzerland. This article is an open access article distributed under the terms and conditions of the Creative Commons Attribution (CC BY) license (http://creativecommons.org/licenses/by/4.0/).
Share and Cite
MDPI and ACS Style
Mei, Y.; Kong, X.; Ke, X.; Yang, B. The Impact of Cropland Balance Policy on Ecosystem Service of Water Purification—A Case Study of Wuhan, China. Water 2017, 9, 620. https://doi.org/10.3390/w9080620
AMA Style
Mei Y, Kong X, Ke X, Yang B. The Impact of Cropland Balance Policy on Ecosystem Service of Water Purification—A Case Study of Wuhan, China. Water. 2017; 9(8):620. https://doi.org/10.3390/w9080620
Chicago/Turabian StyleMei, Yun, Xinghe Kong, Xinli Ke, and Bohan Yang. 2017. "The Impact of Cropland Balance Policy on Ecosystem Service of Water Purification—A Case Study of Wuhan, China" Water 9, no. 8: 620. https://doi.org/10.3390/w9080620
Note that from the first issue of 2016, this journal uses article numbers instead of page numbers. See further details here.