Article

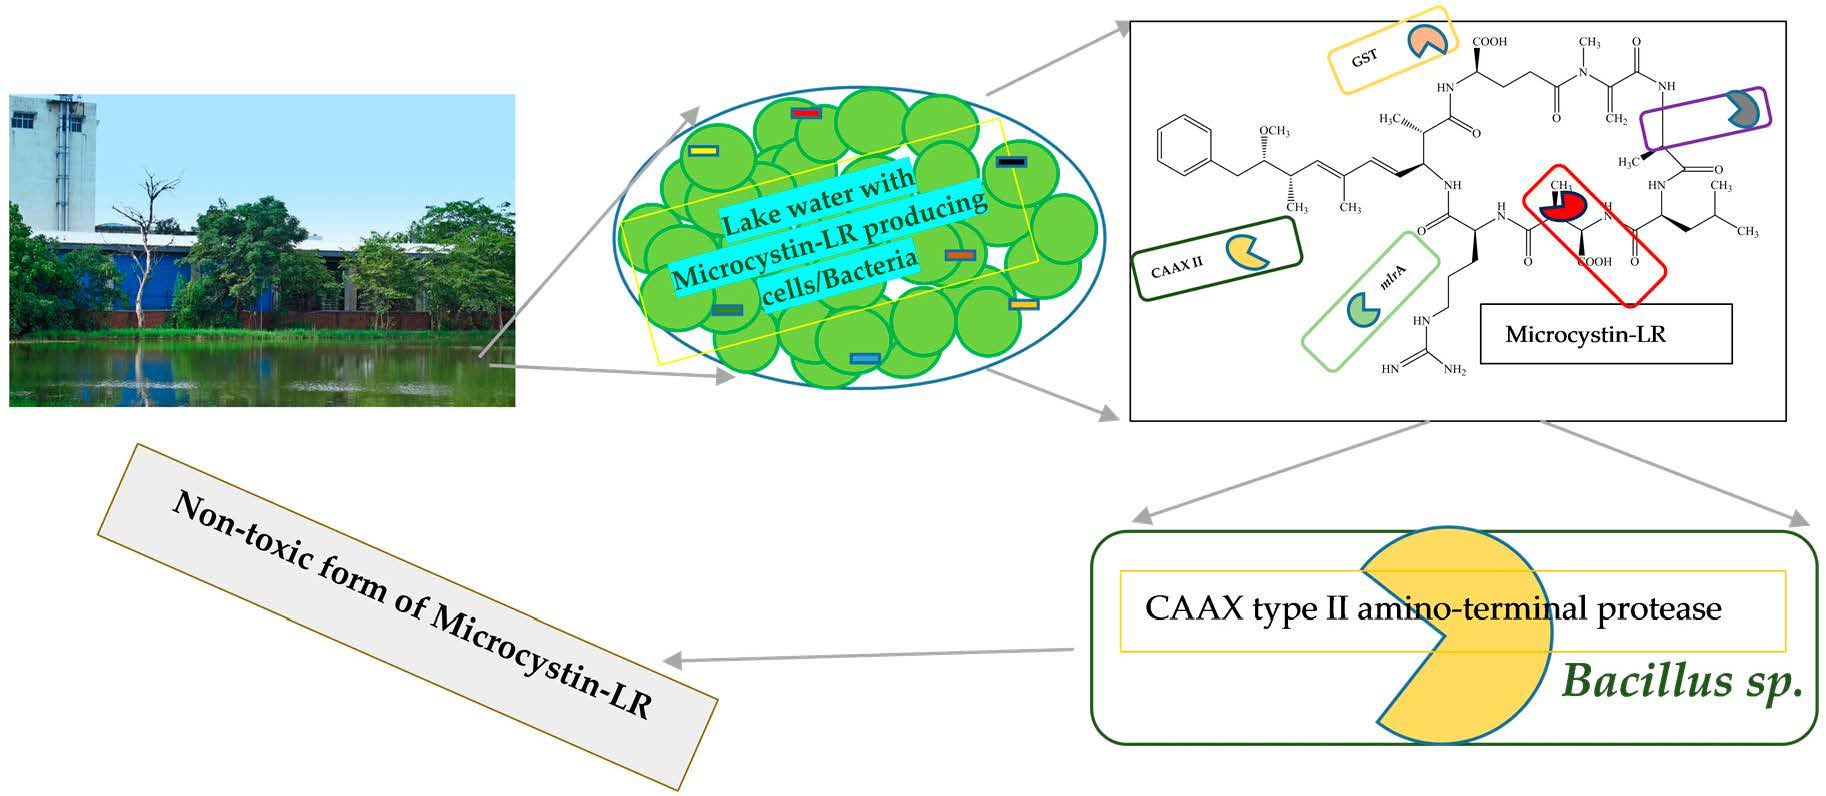
Microcystin-LR Biodegradation by Bacillus sp.: Reaction Rates and Possible Genes Involved in the Degradation

by
Michelline M. R. Kansole
1 and
Tsair-Fuh Lin
1,2,*
1
Department of Environmental Engineering, National Cheng Kung University, Tainan 70101, Taiwan
2
Global Water Quality Research Center, National Cheng Kung University, Tainan 70955, Taiwan
*
Author to whom correspondence should be addressed.
Water 2016, 8(11), 508; https://doi.org/10.3390/w8110508
Submission received: 29 August 2016 / Revised: 25 October 2016 / Accepted: 27 October 2016 / Published: 4 November 2016

Abstract

:
Harmful cyanobacteria blooms may deteriorate freshwater environments, leading to bad water quality that can adversely affect the health of humans, animals, and aquatic life. Many cyanobacteria can produce toxic metabolites, with Microcystin-LR (MC-LR) being the most commonly detected cyanotoxin in fresh water bodies. In this study, a MC-LR degrading Bacillus sp. strain was isolated from Hulupi Lake (HLPL), Taiwan and tested for its degradability of the cyanotoxin. The results showed that the degradation of Microcystin-LR by the isolated Bacillus sp. was temperature-dependent with an optimum MC-LR removal at 37 °C and a first order degradation constant rate for 0.22 day−1. The degradation rate was also found to increase with decreasing MC-LR concentrations and increasing Bacillus sp. concentrations. Biomolecular monitoring of three types of genes (mlrA, CAAX, and GST) involved in the degradation indicated that mlrA, and CAAX genes were present in the indigenous bacteria in HLPL water samples. However, for the isolated Bacillus sp. strain, only CAAX genes were detected. The absence of the mlrA gene in the isolated Bacillus sp. strain shows that the degradation of MC-LR does not necessarily follow the pathways with mlrA, and can also follow the pathways involved with CAAX type II amino-terminal protease.

Graphical Abstract

1. Introduction

Lakes and reservoirs are the main sources of drinking and recreational water in Taiwan and many other countries. Understanding the quality of these waters is therefore an important issue to safeguard public health. Cyanobacteria are an important group of microorganisms present in lakes and reservoirs, and some produce toxins [1,2] and taste and odor compounds [3,4]. Microcystins (MCs) [cyclo-(D-Ala1-X2-D-MeAsp3-Z4-Adda5-D-Glu6-Mdha7)], a group of heptapeptide hepatotoxins, are produced by several cyanobacteria genus, such as Microcystis, Anabaena, Nostoc, and Planktothrix [5], and they are toxic to animals and humans [6,7]. Two of the amino acids at positions two and four in MCs are changeable, leading to more than 100 congeners of microcystins [8]. Among these, Microcystin-LR (MC-LR) with Leucine and Arginine at positions two and four, respectively, is known to date to be the most toxic [9], the most abundant, and the most studied microcystin congener [10]. The presence of microcystins in the public water supply has been extensively documented [2,11,12,13,14]. In 2014, the MC-LR concentration in the finished water of Toledo, OH, USA, was found to be higher than the World Health Organization (WHO) drinking water guideline value of 1.0 μg·L−1 [15], which led to a state of emergency and left more than half a million people without potable water for three days [16]. Besides the effect on the public water supply, the presence of harmful algae blooms and MCs may negatively impact the activities and aesthetics of recreational water bodies [17], and the product quality of fisheries and the aquaculture industry [18].
In natural waters, microcystins have been reported to be degraded by some bacteria [19], and it is beneficial to water utilities if such microorganisms can degrade the toxins in source water before coming into the water treatment plants. Biodegradation has been reported to efficiently remove MC-LR in laboratories [20,21] and in natural waters [22]. Therefore, for better removal efficiency, attempts have been made to isolate microcystin degrading bacteria from natural environments [23,24,25]. Biodegradation of MC-LR has been reported as a three-step process, including the linearization of heptapeptide, cutting this down into smaller peptides, and then into amino acids [19,26,27]. Linearization is the critical step to detoxify MC-LR, as the toxicity will be greatly reduced once the toxin is linearized [28]. The mlr cluster genes have been reported to be involved in the biodegradation of MC-LR, with six genes identified, including mlrA, mlrB, mlrC, mlrD, mlrE, and mlrF [29]. Among these, mlrA is the one responsible for the linearization of the cyclic heptapeptide [24,25,27,30]. A few bacteria, including the Sphingomonadaceae family and the Burkholderiales order, are known to contain the mlr cluster genes and are considered to be MC-LR degraders [31,32,33,34]. Besides the mlr genes cluster, a couple of other genes could be involved in MC-LR degradation, such as the CAAX type II amino-terminal protease gene [35]. Although both the CAAX and mlr cluster genes belong to the type II CAAX Proteases and Bacteriocin-Processing metalloproteases family [36], to date the pathways of the CAAX type II amino-terminal protease as a microcystin remain unclarified [37]. Another probable pathway in MC-LR degradation via bacteria is the xenobiotic metabolism [38]. Mou et al. [38] reported an overrepresentation within their isolated MC-LR degrading bacteria of the Glutathione S-transferase (GST) genes, known to be the key enzymes in xenobiotic metabolisms. Considering the xenobiotic degradation of MC-LR via the GST genes, Yang et al. [39] noted a very high MC-LR degradation rate of 3.0 mg·L−1·day−1 at 30 °C with an initial MC-LR concentration of 21.2 mg·L−1.
Although many bacteria have been isolated and studied for their capacity to effectively degrade MC-LR with regards to the optimum reaction rate, temperature, light, and pH, the probable genes involved in the degradation pathways are documented to a much lesser extent [38,40]. This study aims to evaluate the biodegradation of MC-LR under different temperatures, MC-LR concentrations, and bacterial concentrations. In addition, this study also monitors the evolution of mlrA gene abundance in natural environment surface water during the MC-LR degradation; it assesses the total bacteria abundance, and carries out the isolation of a bacterial strain which is a MC-LR degrader within Hulupi Lake in Taiwan. In the current study, the presence of CAAX type II amino-terminal protease and the Glutathione-S-Tranferase (GST) genes in the isolated bacterial strain is discussed in order to know more about their importance in the MC-LR degradation process in natural water environments.

2. Materials and Methods
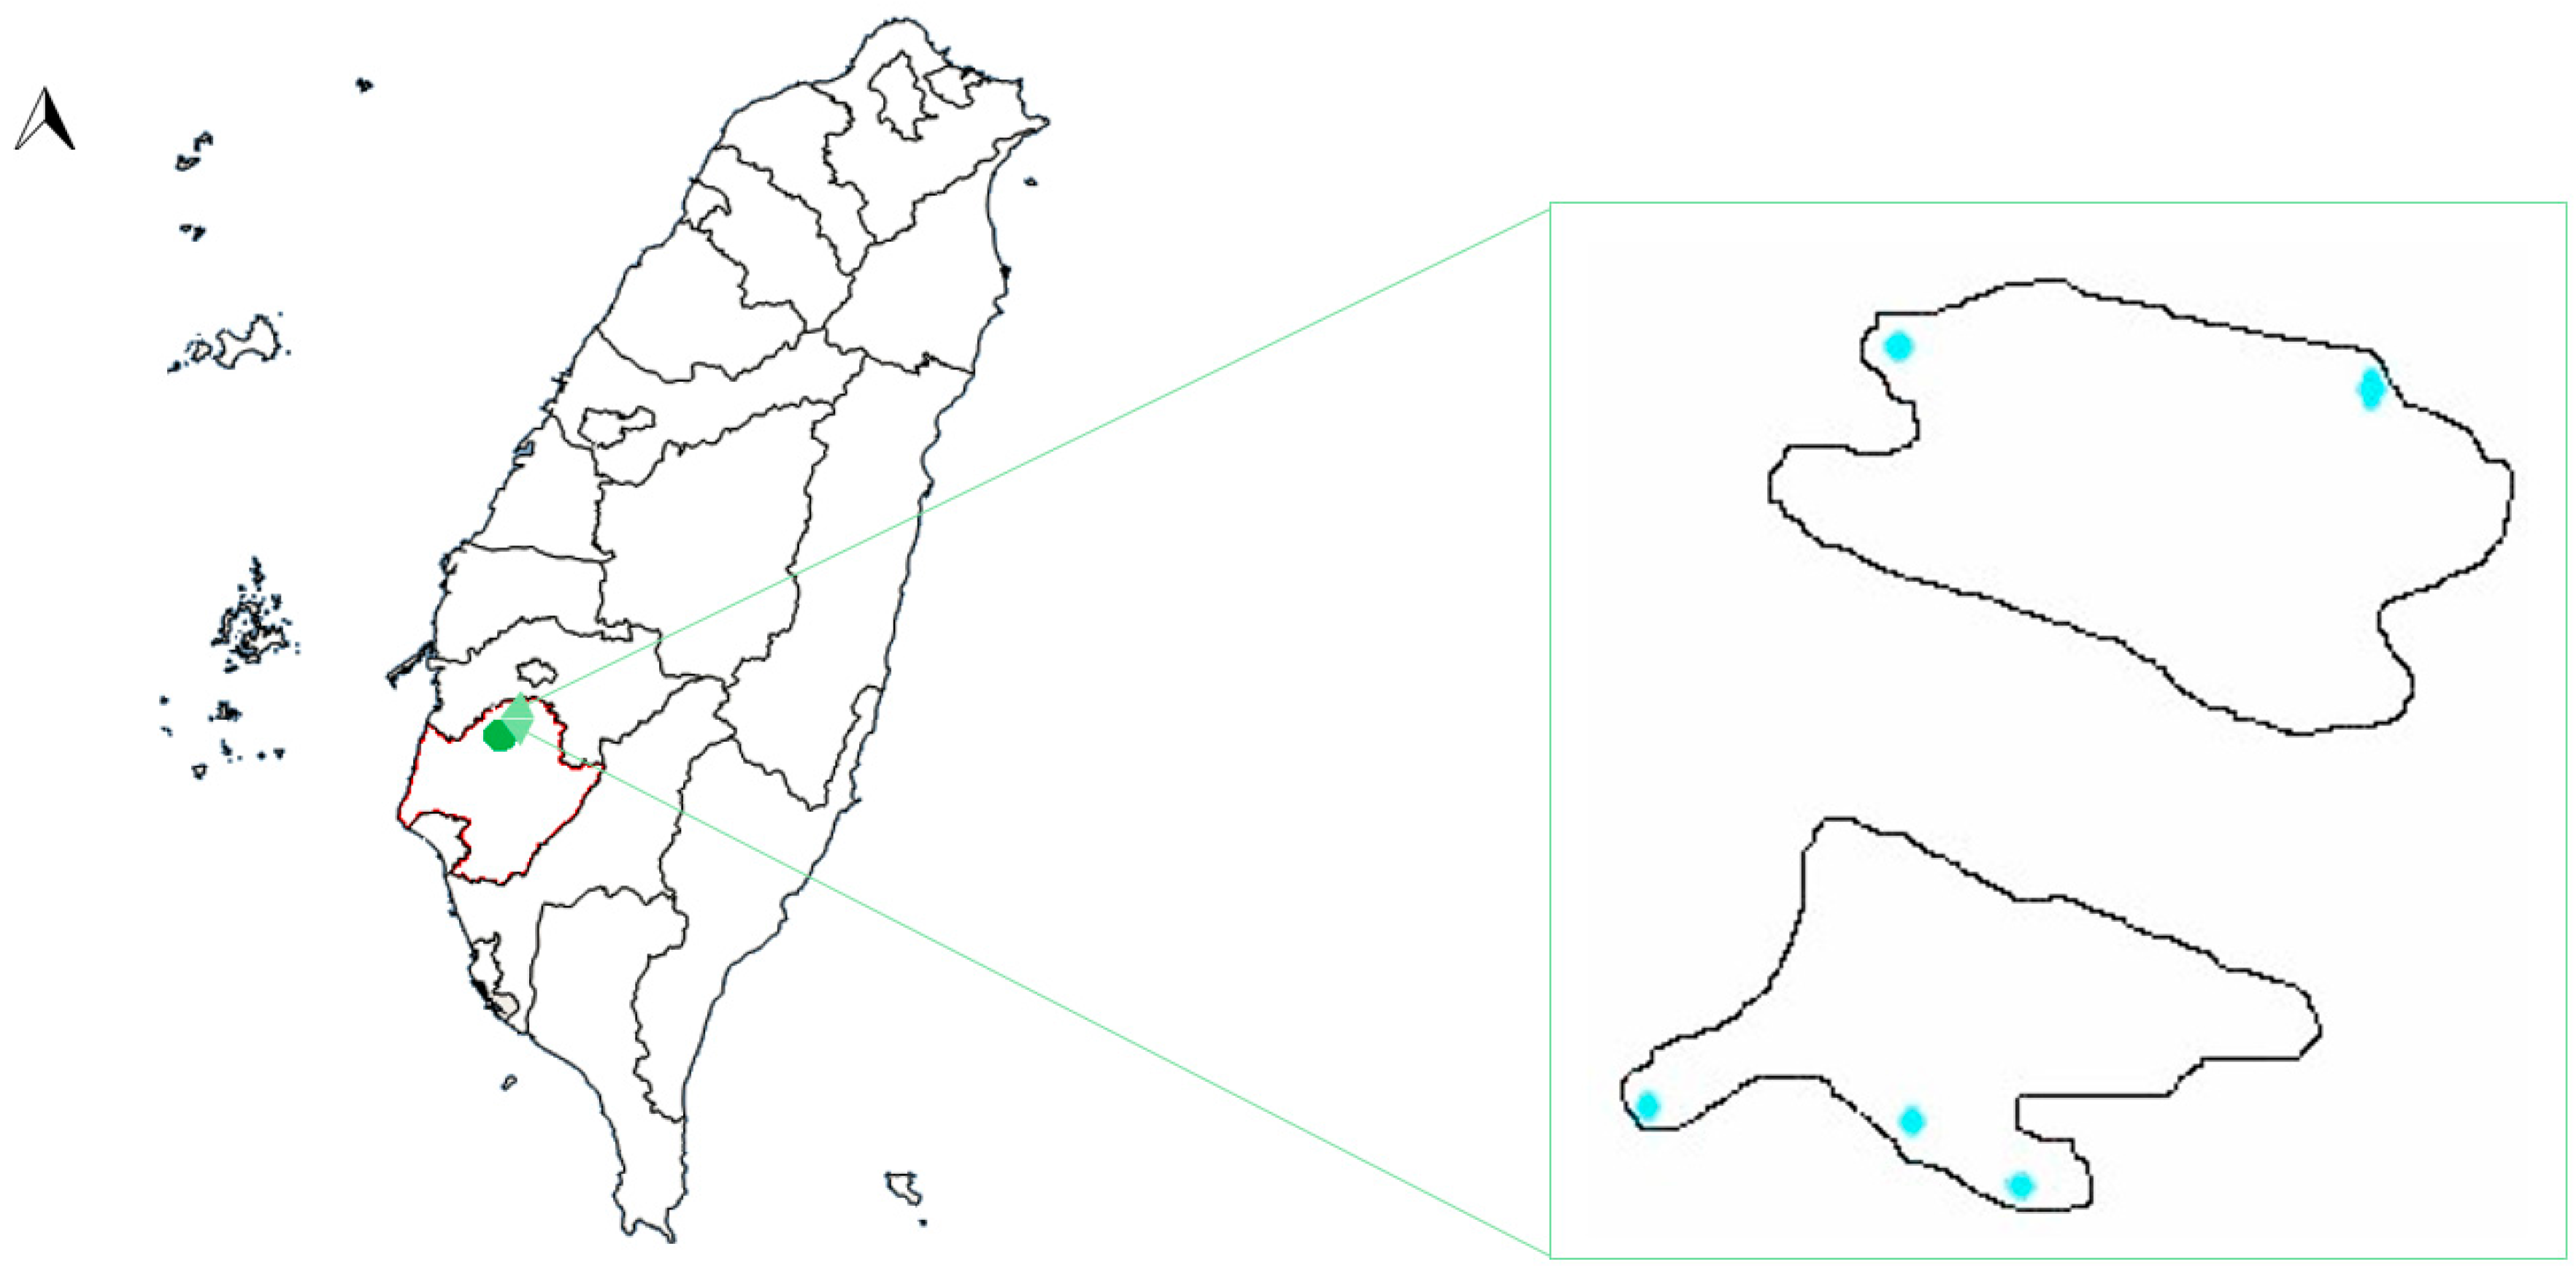
2.1. Hulupi Lake

Hulupi Lake (HLPL), located in Guantian District, Tainan City, Taiwan (Figure 1), was selected as the source of water for the bacteria isolation and water matrix for MC degradation experiments, as it has frequent Microcystis blooms. The lake is a lowland rainwater storage reservoir for irrigation purposes, with a surface area of 940,000 m2. Samples were collected at a depth of 15 cm below the surface. The fresh samples were then used for the experiments.

2.2. Extraction of Crude MC-LR from M. aeruginosa Culture

A laboratory cyanobacteria culture, M. aeruginosa PCC7820, a producer of microcystin-LR [41,42] obtained from the Pasteur Culture Collection of Cyanobacteria, France, was used as the source of microcystin in this study. The production of MC-LR by this cyanobacterium has also been confirmed in our laboratory using a liquid chromatograph (Agilent 1260 LC System) coupled with a tandem mass spectrometer (MS/MS) (Thermo TSQ Quantum Ultra). The conditions to grow the cyanobacterium are listed in the Supplementary Materials S1.
After 55 days of culture, Microcystis cells (~3 × 10⁶ cells/mL) were concentrated from 5 L of the cultured solution using centrifugation at 3000× g for 1.5 min with 50 mL tubes (Labcon, Super Clear™, Petaluma, CA, USA) in a centrifuge (Hermle Labortechnik GmbH, Model Z206A, Wehingen, Germany). After centrifugation, the supernatant was removed from the sample tube, with 1 mL of cyanobacteria pellet laden solution remaining. The concentrated solution was put into 50 mL tubes and was frozen at −80 °C for 1 day, and dried using a freeze dryer (FD3-12P, Kingmech, Taiwan) for ~2 days. The dried M. aeruginosa powder was then used for the extraction of MC-LR following the procedures modified from Hu et al. [43]. In brief, 0.4 g of the cyanobacteria powder were put into a 100 mL amber glass vial, 10 mL of water-methanol solution (20:80 by volume) was added, the solution was sonicated for 30 min (110 V-43 KHz, Model D200H, DELTA®, Sacramento, CA USA), and then centrifuged at 12,000 rpm for 10 min at 4 °C (0.7 KW, Refrigerated Micro Centrifuge -Smart R17, Hanil BioMed Inc., Gwangju, Korea). The supernatant was then put in a 500 mL glass beaker, and incubated at 37 °C (low temperature incubator, Cheng Sang, Taiwan) for two days for drying. The dried extract was diluted with 10 mL of deionized water (produced by Milli-Q® RiOs™, Darmstadt, Germany), and adjusted to pH 3.0 with 0.1% acetic acid (CH3COOH) (99.8%, Sigma-Aldrich Chemie, Steinheim, Germany). The ensemble was centrifuged again at 12,000 rpm for 10 min at 4 °C. The new supernatant was then filtered with a 0.2 μm pore size cellulose membrane (Sartorius Stedim Biotech Gmbh, Goettingen, Germany), was adjusted to pH 7.0 with a 10% ammonia solution (NH3) (25%, Merck KGaA 64271, Darmstadt, Germany), and was then stored at 4 °C for experimental use. Since this is a crude extract, cyanobacterial metabolites other than MC-LR are expected to be present in the MC-LR laden solution. As stipulated earlier, M. aeruginosa cells were harvested after 55 days as the MC-LR concentration was higher during that period of time (Figure S1). MC-LR extraction gave a 10 mg·L−1 concentration in the solution, and the cell quota of MC-LR for M. aeruginosa PCC7820 was 0.2 pg·cell−1 (Figure S2), similar to that found in a previous MC-LR monitoring analysis [44].

2.3. MC-LR and TOC Concentration Measurements

MC-LR concentration was determined with an Enzyme-Linked Immuno-Sorbent Assay (ELISA) with specificity to microcystins, using a commercial kit (Prod. No. ALX-850-319-KI01, Enzo Life Sciences Inc., Farmingdale, NY, USA). Following the protocol described by the manufacturer [45], the concentration was measured at 450 nm using a Microplate Spectrophotometer Reader (Thermo Scientific™ Multiskan™ GO Microplate Spectrophotometer type 357, Thermo Scientific, Helsinki, Finland), with a microcystin detection limit of 0.1 μg·L−1.
Total organic carbon (TOC) of HLPL water was analyzed via the NPOC (non-purgeable organic carbon) measurement. 20 mL of each sample was filtered using a 0.45 μm syringe (Whatman® GD/X syringe filters sterile, Sigma-Aldrich, GmbH, Essen, Germany). The filtrate was transferred into a 40 mL TOC vial (Zodiac Life Sciences, Telangana, India) for analysis. The samples were acidified with high purity HCl (Hydrochloric acid ≥ 37%, Sigma-Aldrich, GmbH, Essen, Germany) to pH 2, and the TOC was immediately measured using a TOC analyzer (TOC-500, Shimadzu, Singapore).

2.4. Isolation of Bacterial Strain

Water collected from HLPL was used for bacterial isolation. HLPL water was first filtered through a 0.7 μm glass microfiber filter (Z242519 ALDRICH Whatman® glass microfiber filters, Germany) to remove large particles. 10 mL of the filtered HLPL water was then placed into a 150 mL crystal grade polystyrene cell culture flask, and 90 mL of mineral salts medium (MSM) was added, the composition of which is listed in the Supplementary Materials (S6) [46], and spiked with crude MC-LR solution to allow for a final concentration of MC-LR = 3 mg·L−1. The samples were then incubated for 12 days at 30 °C in the dark under shaking conditions (200 rev·min−1) in a low-temperature orbital shaker incubator (Model LM-570R, Yihder Technology, Taipei, Taiwan). 2 mL of the incubated solution was then mixed with 38 mL of fresh MSM in a new 150 mL polystyrene flask for another incubation under the same conditions for 12 days. The initial MC-LR concentration in the solution was 5 mg·L−1. To monitor the degradation of MC, the remaining MC-LR in the solution was measured with the ELISA test. Serial dilutions were streaked onto LB agar plates (Section S6) and incubated at 30 °C. The colonies were streaked onto new LB agar plates four times for further purification. Finally, the colonies were used for the experiments of biomolecular tests and biodegradation.

2.5. MC-LR Biodegradation in HLPL Water

Biodegradation of MC-LR in HLPL water containing the natural bacterial community was conducted for different MC-LR concentrations. The experiments were conducted in 40 L portable water plastic tank (polyethylene resins) reactors, filled with HLPL water (for biodegradation) or with filtered and autoclaved (autoclave TM-320, TOMIN, Hsinchu City, Taiwan) HLPL water (for control). Three experimental runs were conducted; one with the original MC-LR concentration in the lake water at 0.55 μg·L−1, another one spiked with MC-LR to reach a concentration of 9.2 μg·L−1, and the last one spiked with MC-LR to reach 9.2 μg·L−1 into the autoclaved HLPL water. In addition, a set of experiments was also conducted, in the same conditions, by spiking M. aeruginosa in original HLPL water to allow for a final M. aeruginosa concentration of 7 × 10⁵ cells/mL).
The reactors were all incubated at 25 °C and all runs were conducted in triplicate. Samples were collected from the reactors and analyzed for MC-LR and/or bacteria concentrations, in which the former followed those described in Section 2.3 and the latter was measured with heterotrophic plate counts (HPC) according to the method described by Bartram et al. [47]. In addition, the quantitative polymerase chain reaction (qPCR) method was also used to analyze the abundance of mlrA and/or EUB genes in the samples, following the procedure discussed in Section 2.8.
The degradation rates of MC-LR in the samples were calculated according to a first order reaction (Equation (1)).
C C 0 = e k t
where C is the MC-LR concentration, C0 is the MC-LR concentration at time = 0, k is the reaction rate constant, and t is the time of degradation.

2.6. MC-LR Biodegradation by the Isolated Bacteria

The isolated bacteria were tested for their degradation of MC-LR under different temperatures, cell concentrations, and initial concentrations. The batch reactors, same as those for degradation in HLPL water (Section 2.5), was used for the experiments. In conducting the experiments, the isolated bacteria were first prepared. Five colonies of isolated bacteria were picked using a sterile pipette tip, and spiked in 9 mL of sterile LB broth (Section S6) using a 50 mL plastic vial (Labcon, SuperClear™, Petaluma, CA, USA) for 72 h in the dark at 25 °C and under constant shaking for 150 rpm. After reaching exponential growth stage, the bacteria laden samples were centrifuged at 5000× g for 5 min, washed with distilled water, and centrifuged again at 5000× g for 5 min, with the washing and centrifuging processes being repeated three times. The centrifuged bacterial laden pellets were then incubated with MSM medium and MC-LR to reach predetermined bacterial concentrations.
One set of experiments was conducted to evaluate the effects of different temperatures on MC-LR biodegradation at 15 °C, 25 °C, 30 °C, and 37 °C. The experiments were conducted in 50 mL tube (Labcon, Super Clear™, Petaluma, CA, USA) reactors, filled with autoclaved HLPL water, with MC-LR concentration = 0.22 mg·L−1 and bacterial concentration = 8.3 × 10⁶ CFU/mL.
To test the degradation ability of the isolated bacteria for MC-LR, another set of experiments was performed with two different isolated bacteria concentrations, 8.3 × 10⁶ and 8.1 × 10¹⁰ CFU/mL. Each concentration of the isolated bacteria was tested against four concentrations of MC-LR; 0.022, 0.1, 0.35, and 0.51 mg·L−1, and in triplicate at 25 °C. The reactors for the degradation experiments were incubated at 25 °C for 12 days under 12 h/12 h day/light conditions and the residual MC-LR was measured according to the protocol described previously in Section 2.3. Similar to those for degradation in HLPL water, the samples in the current experiments were also analyzed for the abundance of mlrA and EUB genes, using the qPCR method.

2.7. DNA Extraction for Cyanobacteria and Bacteria

A commercial kit (Plant Genomic DNA Extraction Mini Kit, FAVOR PREP™, Pingtung, Taiwan) was used for the extraction of DNA from bacteria and cyanobacteria, according to the manufacturer’s protocol. In the extraction of laboratory cultures, 1 mL of cultured M. aeruginosa was first centrifuged at 5000× g for 10 min, and the centrifuged pellets were used for the DNA extraction. For the lake water samples, 1 L of the lake water was filtered with a 47 mm diameter cellulose acetate 0.2 μm-pore-size filter (Sartorius Stedim Biotech GMBH 37070, Goettingen, Germany), and the membrane was used as the matrix for the DNA extraction of the bacteria. The extracted DNA was then stored at −20 °C until utilization. For extraction of the DNA from the agar plate, 10 colonies of isolated bacteria were picked using a sterile pipette tip, inoculated in 90 mL of sterile LB broth, and left to grow at 37 °C for 72 h. 1 mL of the bacterial solution was then centrifuged at 5000× g for 5 min; and the laden bacterial pellets were utilized for the isolated bacterial DNA extraction (Plant Genomic DNA Extraction Mini Kit, FAVOR TREP™), according to the manufacturer’s instructions.

2.8. Polymerase Chain Reaction (PCR) and Quantitative PCR (q-PCR)

The experiments were conducted according to the Minimum Information for Publication of Quantitative Real-Time PCR Experiments (MIQE) in its guidelines of 2009 [48], for a good quality in both PCR (C1000™ Thermal Cycler, Bio-Rad Laboratories, Foster City, CA, USA), and q-PCR (Smart Cycler® II, Cepheid, q-PCR device, Foster City, CA, USA) results. The primers and their probes/dyes used in this study are listed in Table 1. Only CAAX type II amino-protease gene amplification primers were developed in this study, with the PCR conditions as follows: an initial denaturation of 95 °C for 120 s, followed by 45 cycles of a typical denaturation of 95 °C for 5 s, an annealing at 55 °C for 20 s, and a typical extension at 72 °C for 20 s. Standard curves for mlrA and EUB genes are represented respectively in Figures S3 and S4.

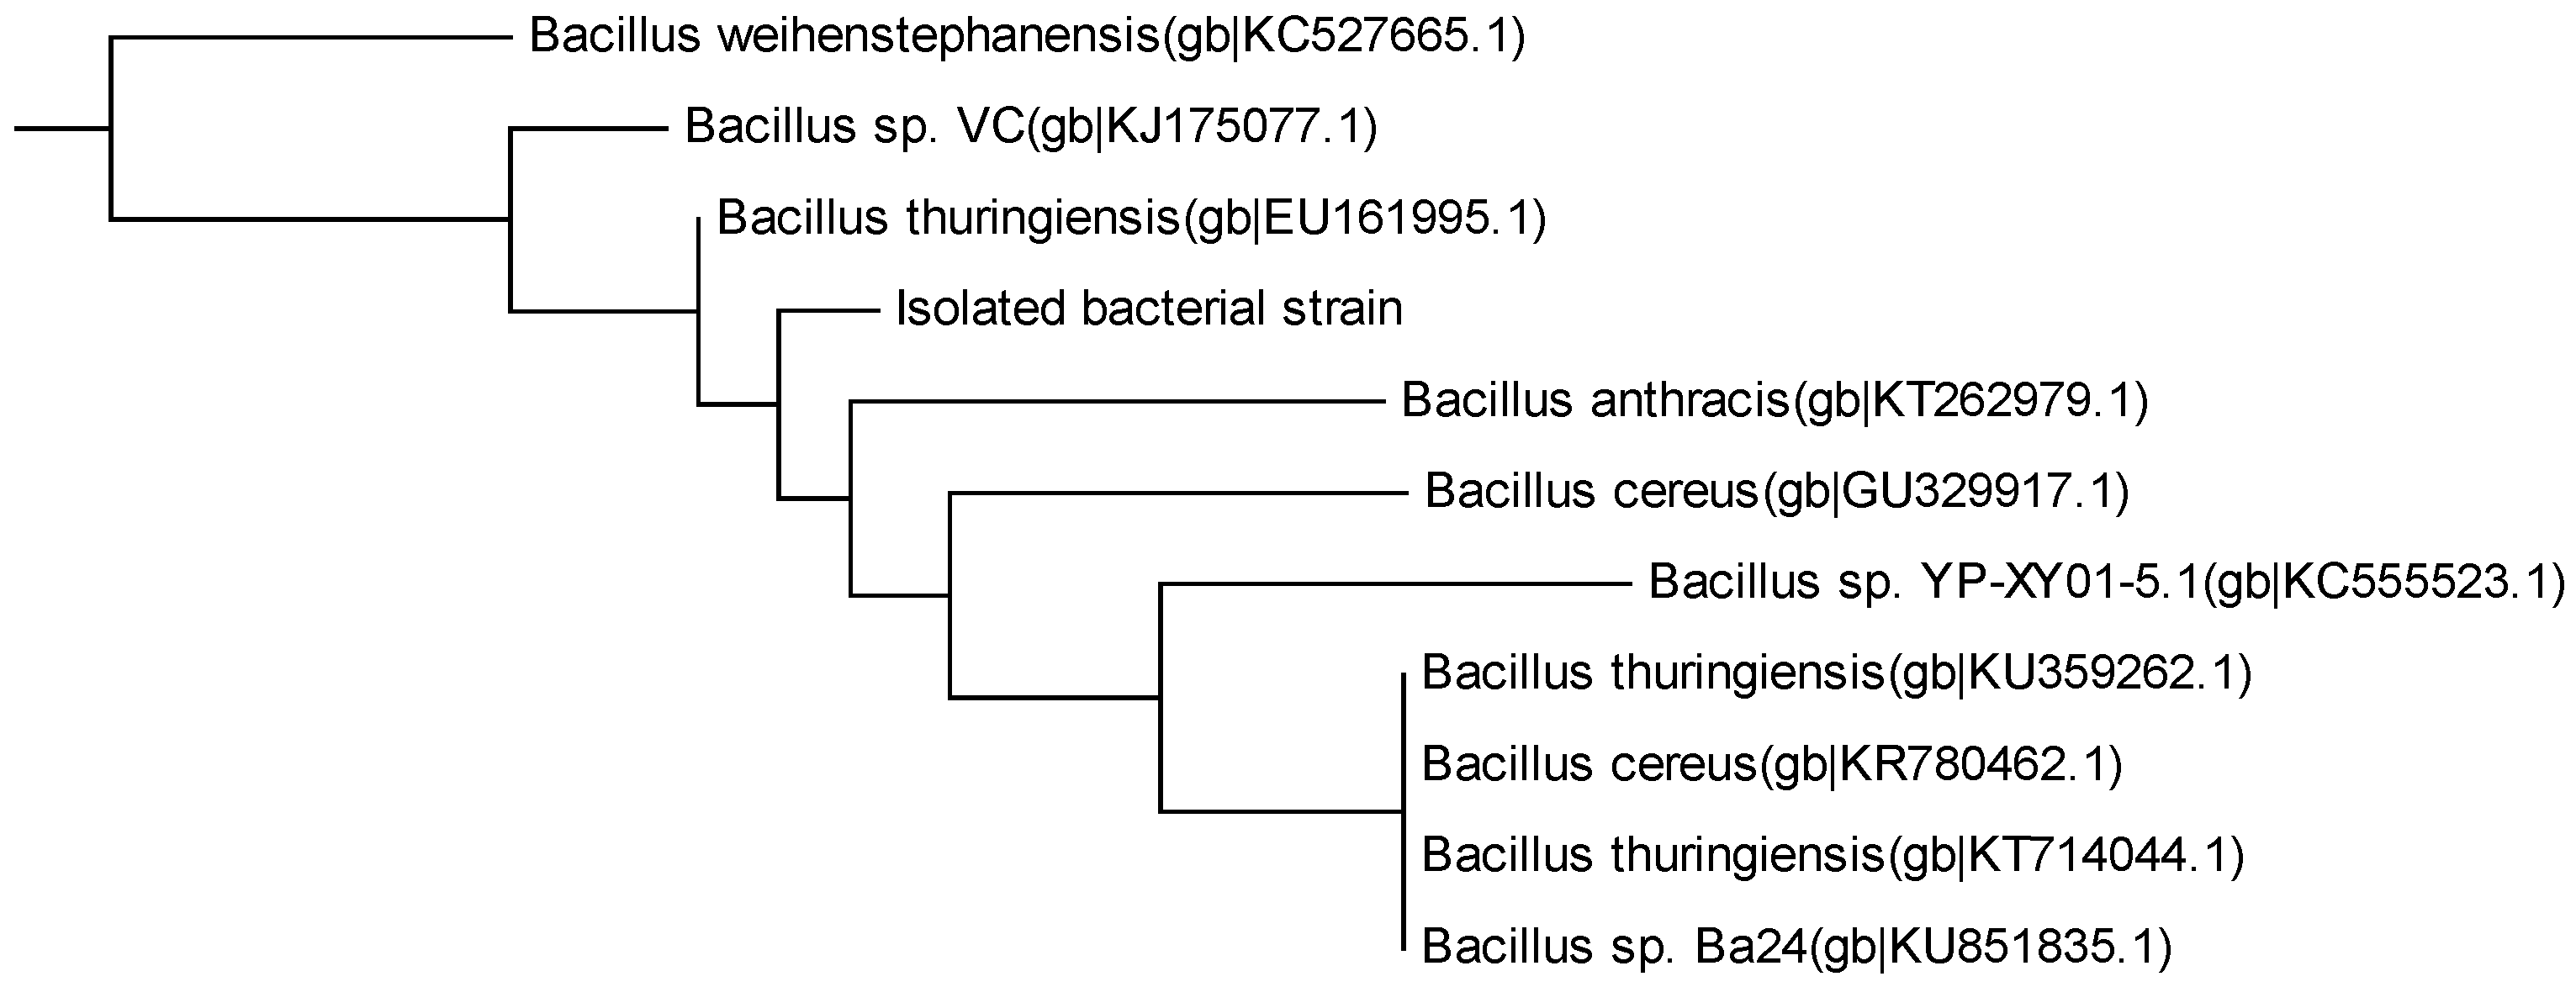
2.9. DNA Cloning, Sequencing, and Phylogenetic Tree Analysis for Bacteria

Bacterial DNA cloning was carried out following the method described by Knoche and Kephart [56]. The 16S rRNA sequencing was conducted at National Cheng Kung University Hospital (NCKUH) in Taiwan, and the obtained 16S rRNA sequence was used to specify the isolated bacterium via a neighbor-joining phylogenetic tree. The phylogenetic tree was constructed using the NCBI website [57] and Mega6 program [58].

2.10. Statistical Analyses

Statistical analyses were performed using a one-way ANOVA (p < 0.05) and a Normality Test (Shapiro-Wilk) (p ≥ 0.05 normal, and p < 0.05 not normal) (Sigma Plot v.11, Systat Software Inc. (SSI), San Jose, CA, USA) to know if there was a significant difference and/or a normal distribution in the MC-LR biodegradation by the isolated bacterial strain under different initial MC-LR concentrations, bacterial concentrations, and different temperatures, as well as for the biomolecular aspect of the degradation.

3. Results and Discussion

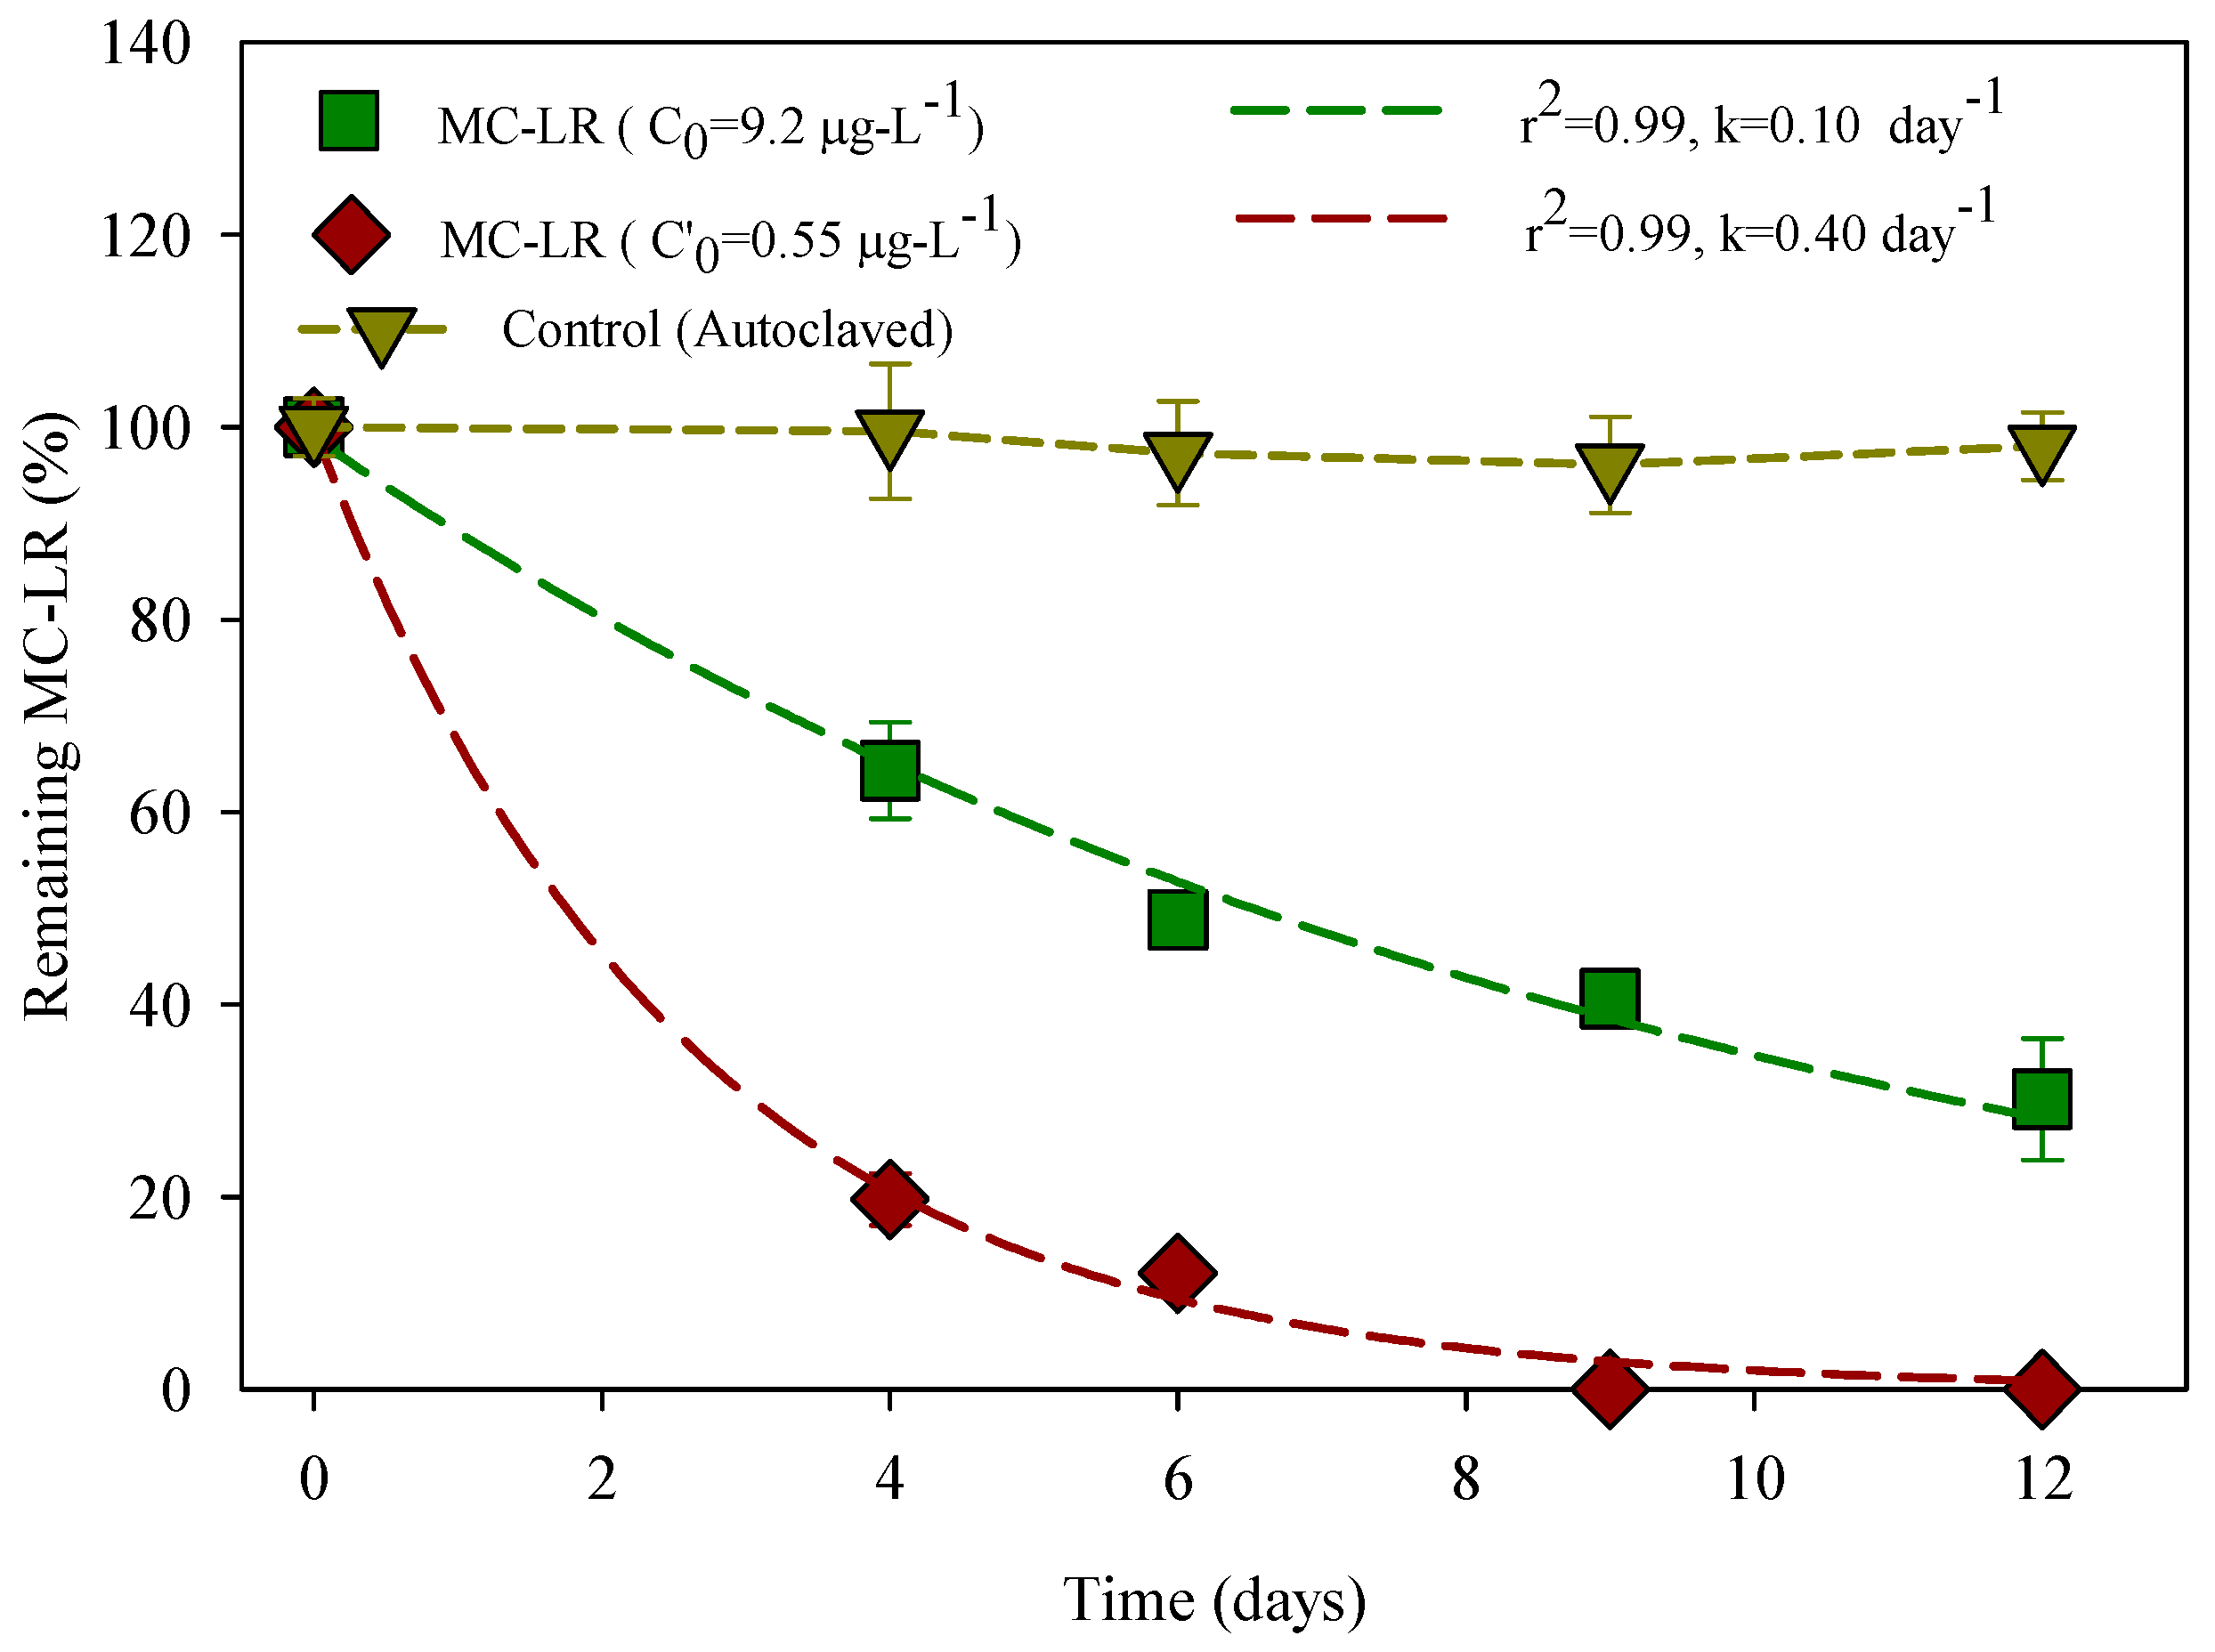
3.1. Degradation of MC-LR in HLPL Water

For the control sample, Figure 2 shows that no obvious change of MC-LR concentration was found, as the concentrations remained almost constant throughout the experimental period (MC-LR concentrations were read against the ELISA calibration curve Figure S5 of the Supplementary Materials). In the batch experiment for the HLPL water sample, all the MC-LR was degraded after six days of incubation, with a half-life time of 2 days and a k at 0.4 day−1. HLPL water heterotrophic bacterial count (HPC) at the sampling time (September 2015) was 5 × 10⁵ CFU/mL, with high similarity to the HPC of riverine samples in South Africa for 105–106 CFU/mL [59]. However, the same HLPL water spiked with MC-LR for a final concentration of 9.2 μg·L−1 shows a removal rate of 70% after 12 days of incubation with a MC-LR half-life time of 7 days and a first-order rate constant k of 0.1 day−1. There was not a statistically significant difference in MC-LR degradation by HLPL bacterioplankton at p < 0.05. In addition, for 9.2 μg·L−1, data matches the pattern expected from a population with a normal distribution (p = 0.52).
The stable cyclic structure of MC-LR is a real challenge for its removal via abiotic methods, which are generally used in conventional drinking water treatment plants [60]. In addition, MC-LR resists boiling and chemical hydrolysis at neutral pH [61]. Compared to the control which was autoclaved to remove all kind of biological organisms, the water from HLPL presented a MC-LR degradation, leading us to conclude that MC-LR was degraded by indigenous bacteria since no other degrader was brought into the batch culture [62]. The biodegradability shows that bacteria exist within HLPL water, and the degradation relevant characteristics of the probable bacteria in the lake water are discussed in a later section.
Figure 3 shows the total bacteria concentrations in the experimental system, with almost stable concentrations within twelve days, although the MC-LR was degraded. In addition, the total organic carbon (TOC) concentrations did not change much during the experimental period. Farhadkhani et al. [63] observed that TOC did not significantly impact the microbial community growth during MC-LR degradation, which is similar to our observation in the current study. Mou et al. [38] reported that in a biodegradation study of MC-LR, the degrading bacteria did not use MC-LR as a carbon source and MC-LR might be removed via a xenobiotic method. This may be the reason why the degradation of MC-LR did not lead to an increase in total bacteria concentration in this study. However, there was a statistically significant difference between the mean of the sampled population and the hypothesized population mean (p < 0.01) for EUB gene evolution. In addition, both TOC and EUB gene evolution data matched the pattern expected if the data were drawn from a population with a normal distribution.

3.2. Isolated MC-LR Degrading Bacteria

Isolation was conducted to obtain a bacterial strain with the capability to degrade MC-LR. A strain was isolated from HLPL, and was able to degrade MC-LR. The neighbor-joining tree (Figure 4) obtained by blasting the 16S rRNA sequence against the sequences in the NCBI software [57] gave a 93% similarity with Bacillus sp. Figure S6 (Supplementary Materials) shows a rod-shaped bacteria, as observed via a scanning electron microscope (SEM), which concords with the general shape of Bacillus sp. [64].
The isolated Bacillus sp. strain was further tested for its degradability of MC-LR under different temperatures, and the degradation kinetics will be discussed in Section 3.3.

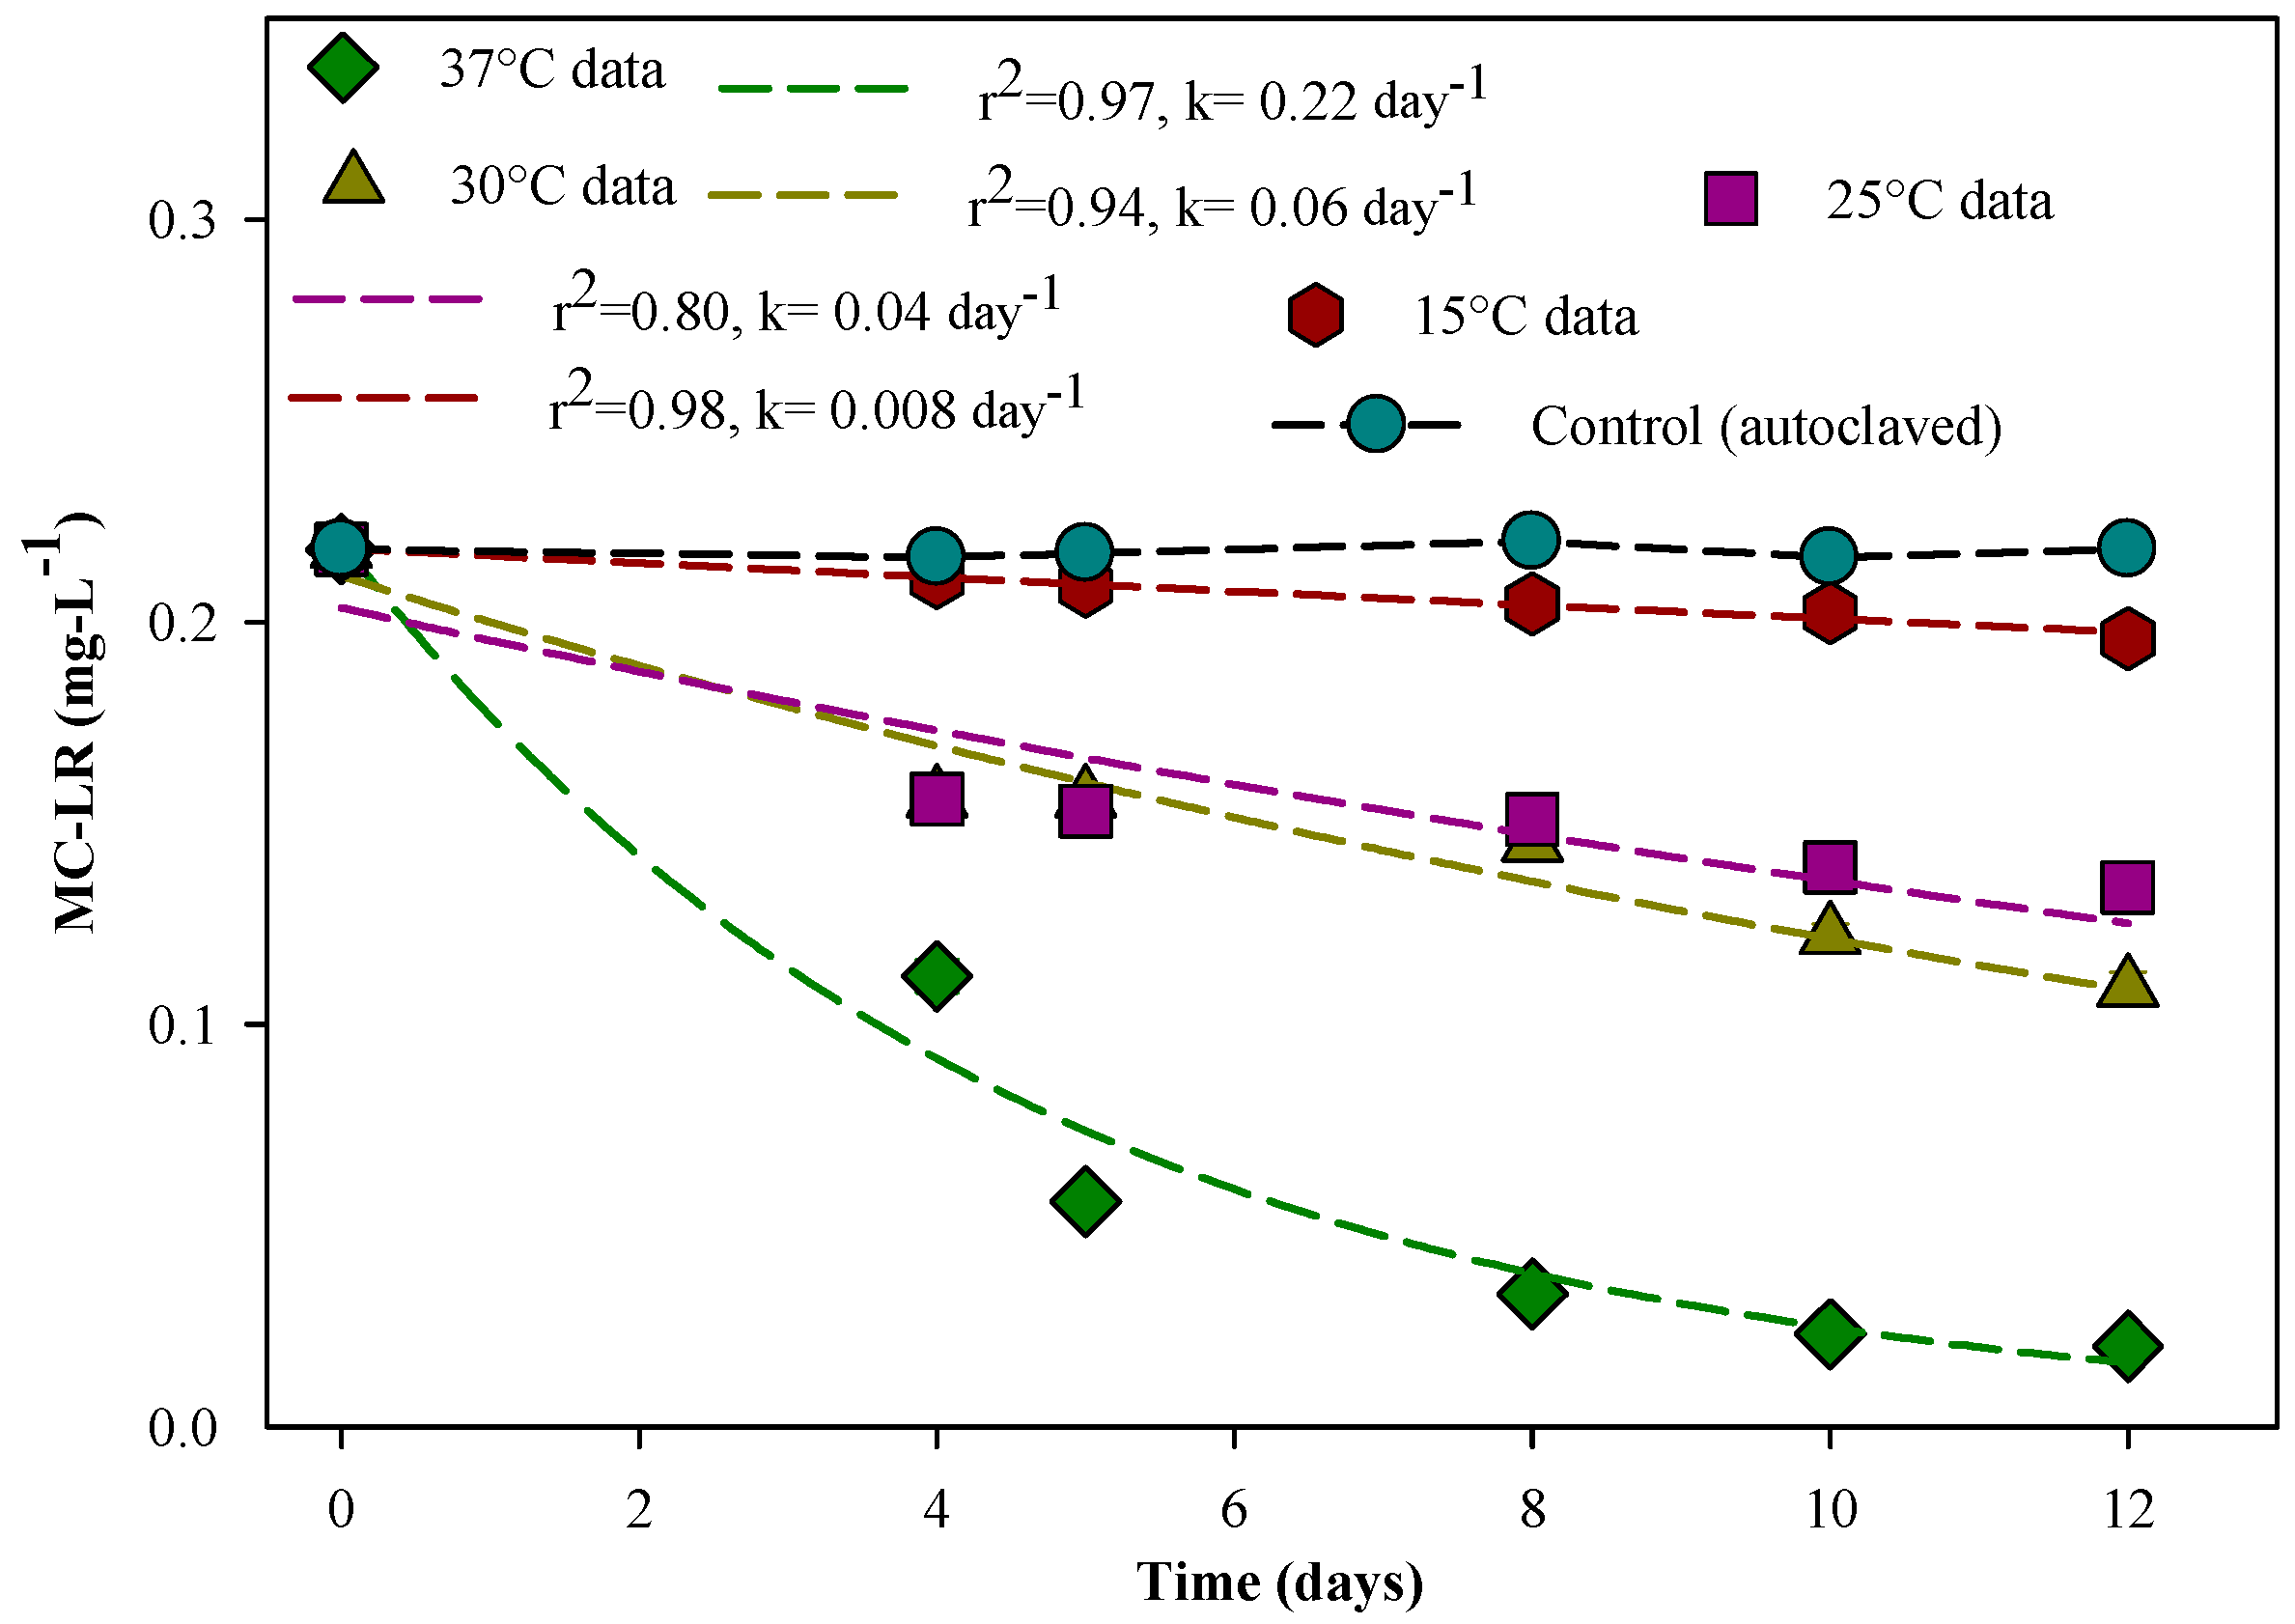
3.3. Effect of Temperature on MC-LR Degradation

As the bacterial degradation rate depends on the incubation temperature [30], the degradation of MC-LR (for an initial concentration of 0.22 mg·L−1) was conducted for four different temperatures (15 °C, 25 °C, 30 °C, and 37 °C) and under the same bacterial concentration (8.4 × 10⁶ CFU/mL). It was observed that the degradation kinetics follow a first order reaction and differ at the studied temperatures. MC-LR was degraded rapidly at 37 °C (rate constant k = 0.22 day−1) with 74% of MC-LR being removed within 12 days. The rate constant at 37 °C is 27.5 times higher than that at 15 °C (k = 0.008 day−1) (Figure 5). Based on the experimental results, the degradation rates of MC-LR were 0.06 day−1 and 0.04 day−1 respectively at 30 °C and 25 °C. Sumaiya et al. [26] reported that at 18 °C, no MC-LR was degraded with Bacillus cereus (12 GK strain), however a pronounced MC-LR degradation was observed at 32 °C with complete MC-LR removal after six days of incubation. Somdee et al. [30] reported a slow MC-LR degradation with 20% of MC-LR (initial concentration of 25 μg·L−1) removal after one day of incubation at 30 °C in a system spiked with 7.9 × 10⁶ CFU/mL of NV-3 bacterial concentration. They also noticed that the degradation rates increased with increasing incubation temperature from 15 °C to 30 °C. It is clear that the temperature plays an important role in MC-LR degradation by bacteria, and the MC-LR degradation rate strongly depends on the temperature [26,65]. The statistical analyses showed that the degradation of MC-LR was quite dependent on the temperature, and the degradation rate constants were significant for p = 0.027 for 37 °C, 30 °C, and 15 °C with a normal distribution, except at 25 °C (with p = 0.02).

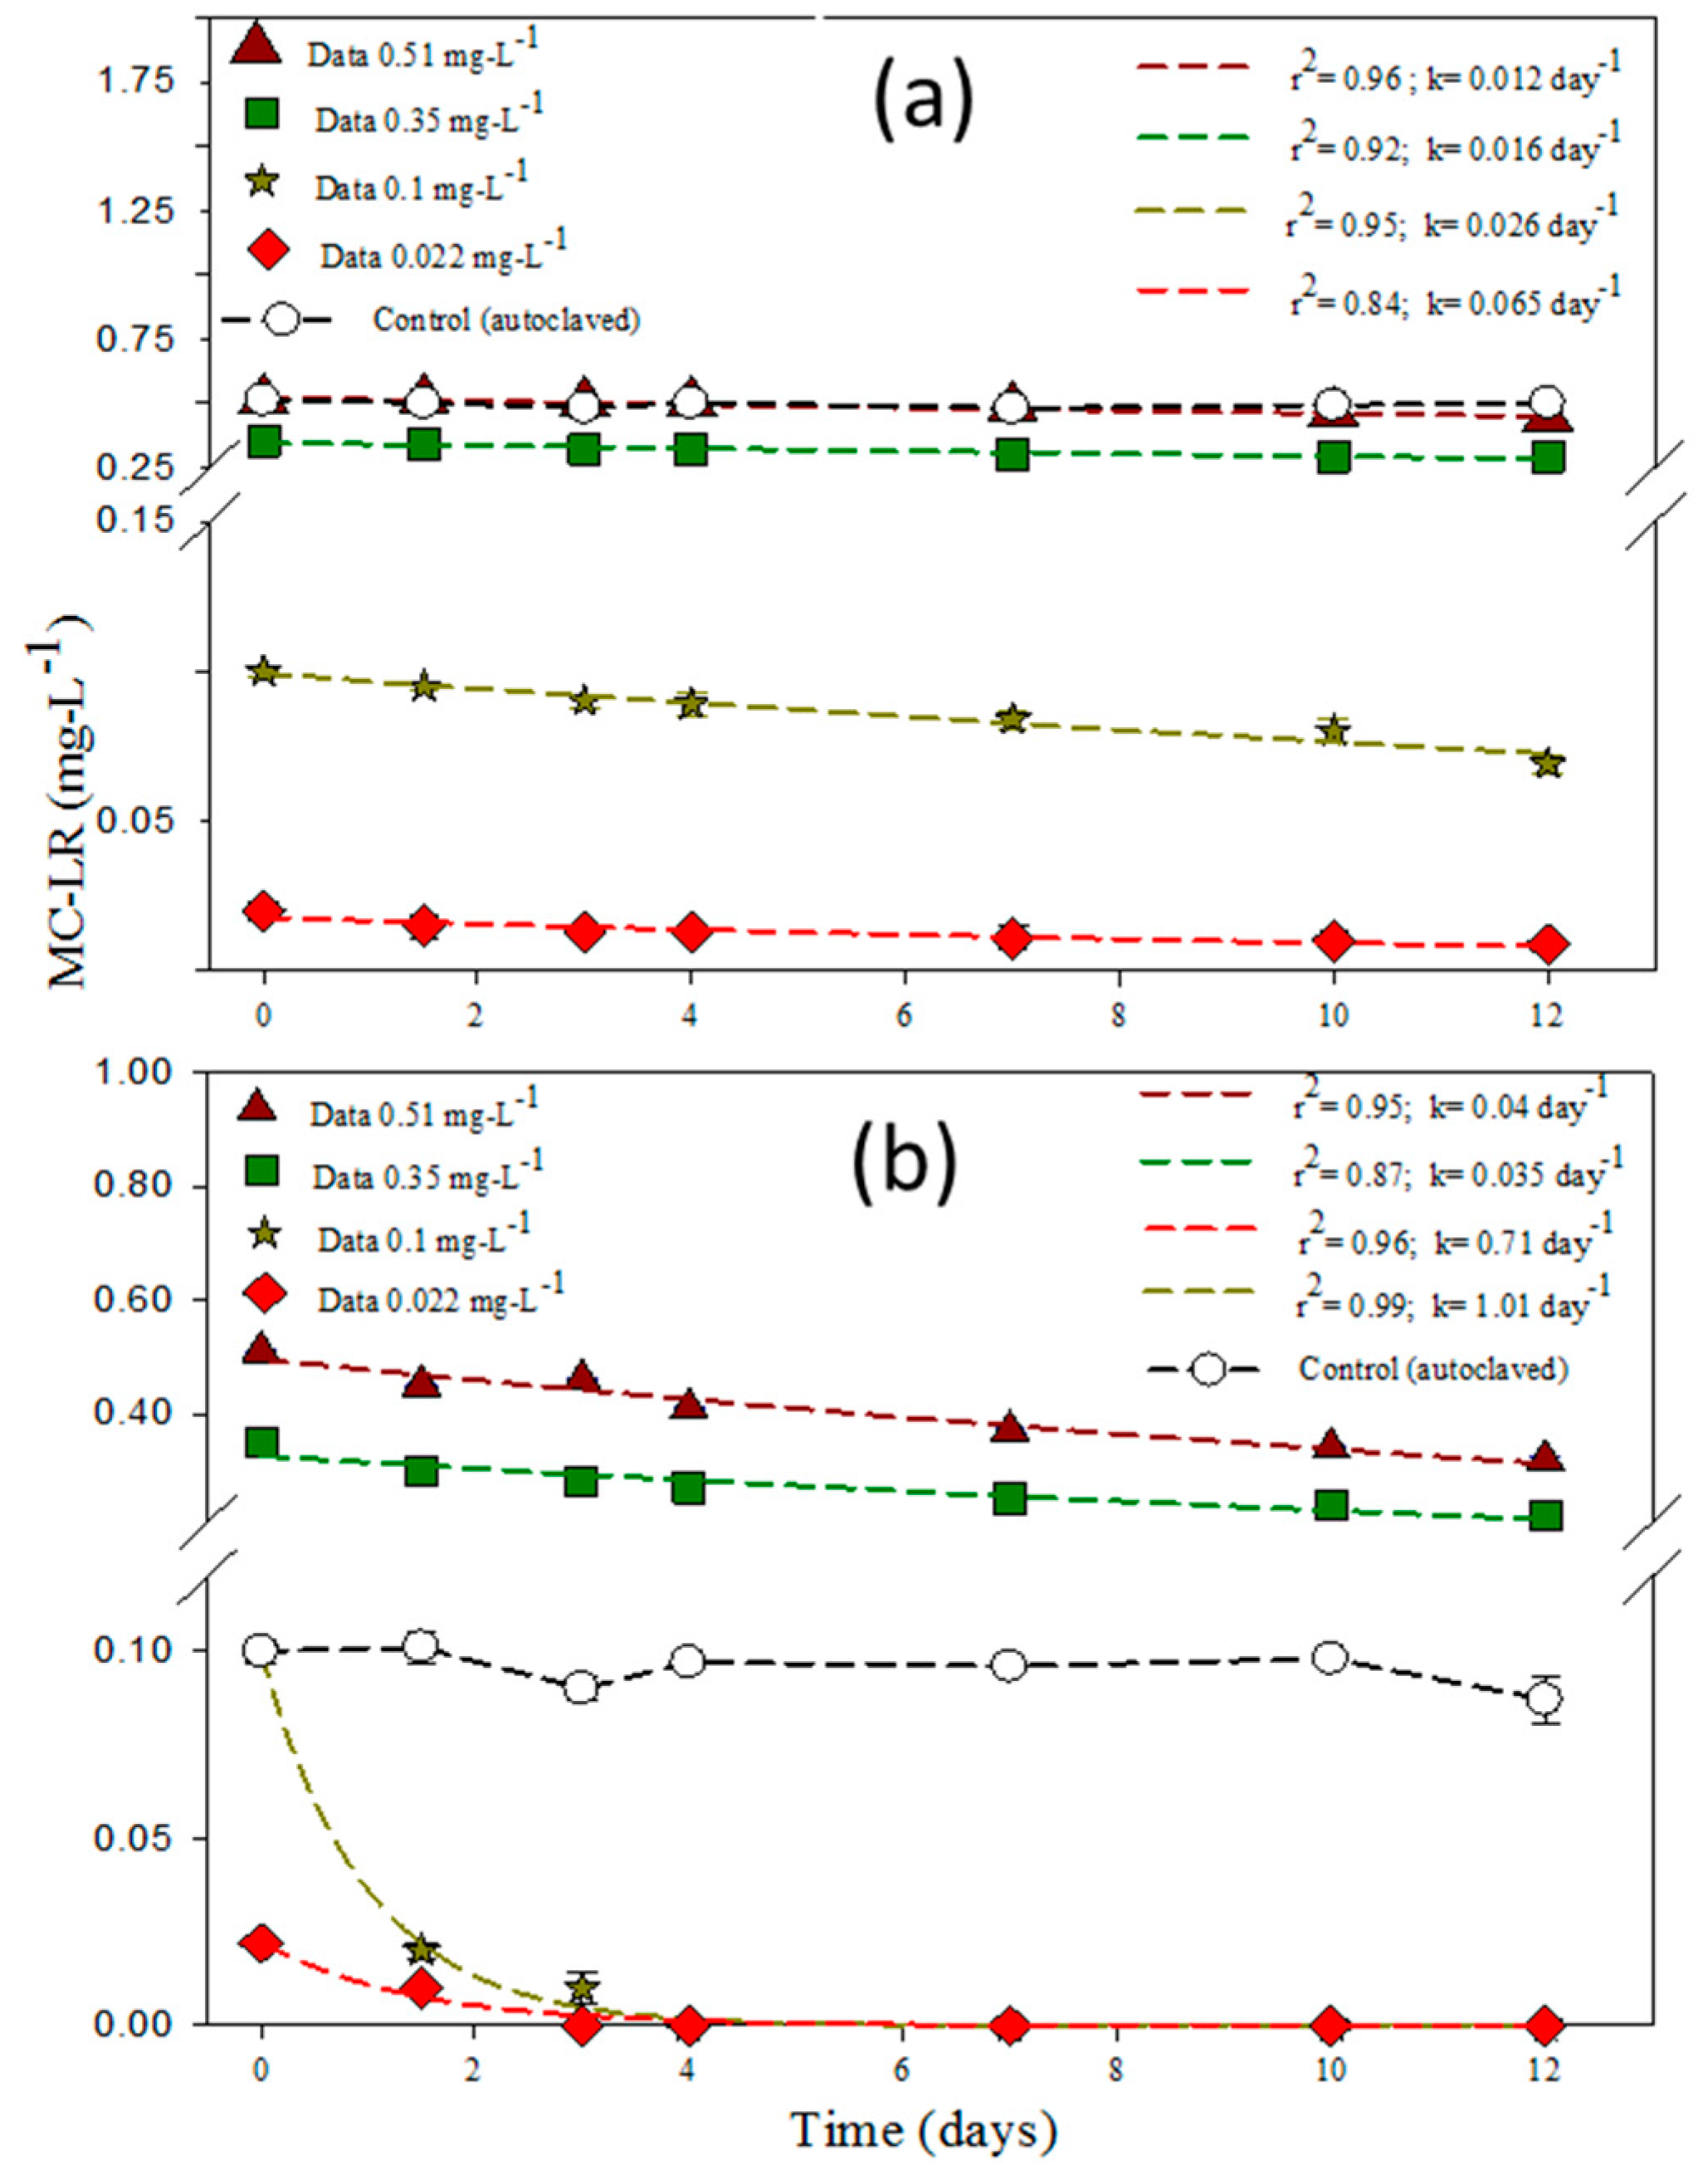
3.4. Effect of MC-LR and Bacteria Concentration on the Degradation Rates

Figure 6a shows the degradation rates of MC-LR by 8.3 × 10⁶ CFU/mL of Bacillus sp. under different initial MC-LR concentrations at 25 °C. The degradation rates were 0.065 day−1, 0.026 day−1, 0.016 day−1, and 0.022 day−1 for the cases of MC-LR concentrations of 0.022 mg·L−1, 0.1 mg·L−1, 0.35 mg·L−1, and 0.51 mg·L−1, respectively. As stipulated earlier in Section 3.3, MC-LR degradation is temperature-dependent. The MC-LR concentration did not significantly impact the kinetics of the toxin’s removal at 25 °C under 8.3 × 10⁶ CFU/mL of Bacillus sp. For a 25 times higher MC-LR concentration level (0.022 mg·L−1 and 0.51 mg·L−1), the degradation rate under 8.3 × 10⁶ CFU/mL of Bacillus sp. at 25 °C was observed to be only 5.41 times different (respectively k = 0.065 day−1 and k = 0.012 day−1). Yang et al. [39] reported that MC-LR degradation rates were pH-, temperature-, and initial MC-LR concentration-dependent for Stenotrophomonas acidaminiphila MC-LTH2, with the highest degradation rate of 3.0 mg·L−1·day−1 standing for a rate constant k = 0.14 day−1 at 30 °C under an initial MC-LR concentration of 21.2 mg·L−1 using a 48 h bacterial culture, although their experiments were conducted separately in order to know the importance of the environmental parameters with regards to the degradation kinetics.
Another batch experiment was conducted for MC-LR degradability for higher Bacillus sp. concentrations and under 25 °C. Figure 6b shows the degradation rate constants of MC-LR by 8.1 × 10¹⁰ CFU/mL of Bacillus sp. under different initial MC-LR concentrations. We observed that for 8.1 × 10¹⁰ CFU/mL Bacillus sp. incubated with 0.022 mg·L−1, 0.1 mg·L−1, 0.35 mg·L−1, and 0.51 mg·L−1 of MC-LR, the degradation rate constants k were respectively 0.71 day−1, 1.01 day−1, 0.035 day−1, and 0.04 day−1 (Figure 6b). Therefore, at higher bacterial concentration the MC-LR degradation kinetics were proportionally higher, although low degradation rate constants were observed for 0.35 mg·L−1 and 0.51 mg·L−1 of MC-LR. The degradation rate constant under 8.1 × 10¹⁰ CFU/mL of Bacillus sp. at 25 °C for a MC-LR concentration ratio of 25 times (0.022 mg·L−1 and 0.51 mg·L−1) was 18 times different (respectively k = 0.71 day−1 and k = 0.04 day−1). In the same experimental conditions, Somdee et al. [30], with an incubation temperature of 30 °C (known to be the optimal temperature for the isolated NV-3 bacterial strain), observed that with a higher NV-3 bacterial concentration of 1.0 × 10⁸ CFU/mL, only 20% of the initial MC-LR was remaining after one day of incubation. In addition, they reported that at low concentrations of 1 μg·L−1 and 10 μg·L−1, the MC-LR was completely degraded within one day of incubation, while at a higher concentration of 50 μg·L−1, a period of 6 days was necessary to reach a complete MC-LR removal with a degradation rate constant k = 0.17 day−1.
Under 25 °C, Bacillus sp. concentrations (8.1 × 10¹⁰ CFU-mL−1 and 8.3 × 10⁶ CFU-mL−1) led to statistically significant MC-LR degradation rate constants, even for different microcystin concentrations, with exact p values of 0.038, 0.017, 0.040, and 0.038 respectively for MC-LR concentrations of 0.022 mg·L−1, 0.1 mg·L−1, 0.35 mg·L−1, and 0.51 mg·L−1. However, there was no growth in the Bacillus sp. population when incubated with MC-LR (Figure S7), and the difference in data was not statistically significant when the Bacillus sp. was not incubated with MC-LR (p = 0.049). For the normality test, data from 8.3 × 10⁶ CFU/mL of Bacillus sp. matched the pattern expected if the data were drawn from a population with a normal distribution. Nevertheless, for 8.1 × 10¹⁰ CFU/mL, there was a normal distribution only for higher MC-LR concentrations of 0.51 mg·L−1 and 0.35 mg·L−1, although there was a non-normal distribution for lower MC-LR concentrations of 0.1 mg·L−1 and 0.022 mg·L−1.

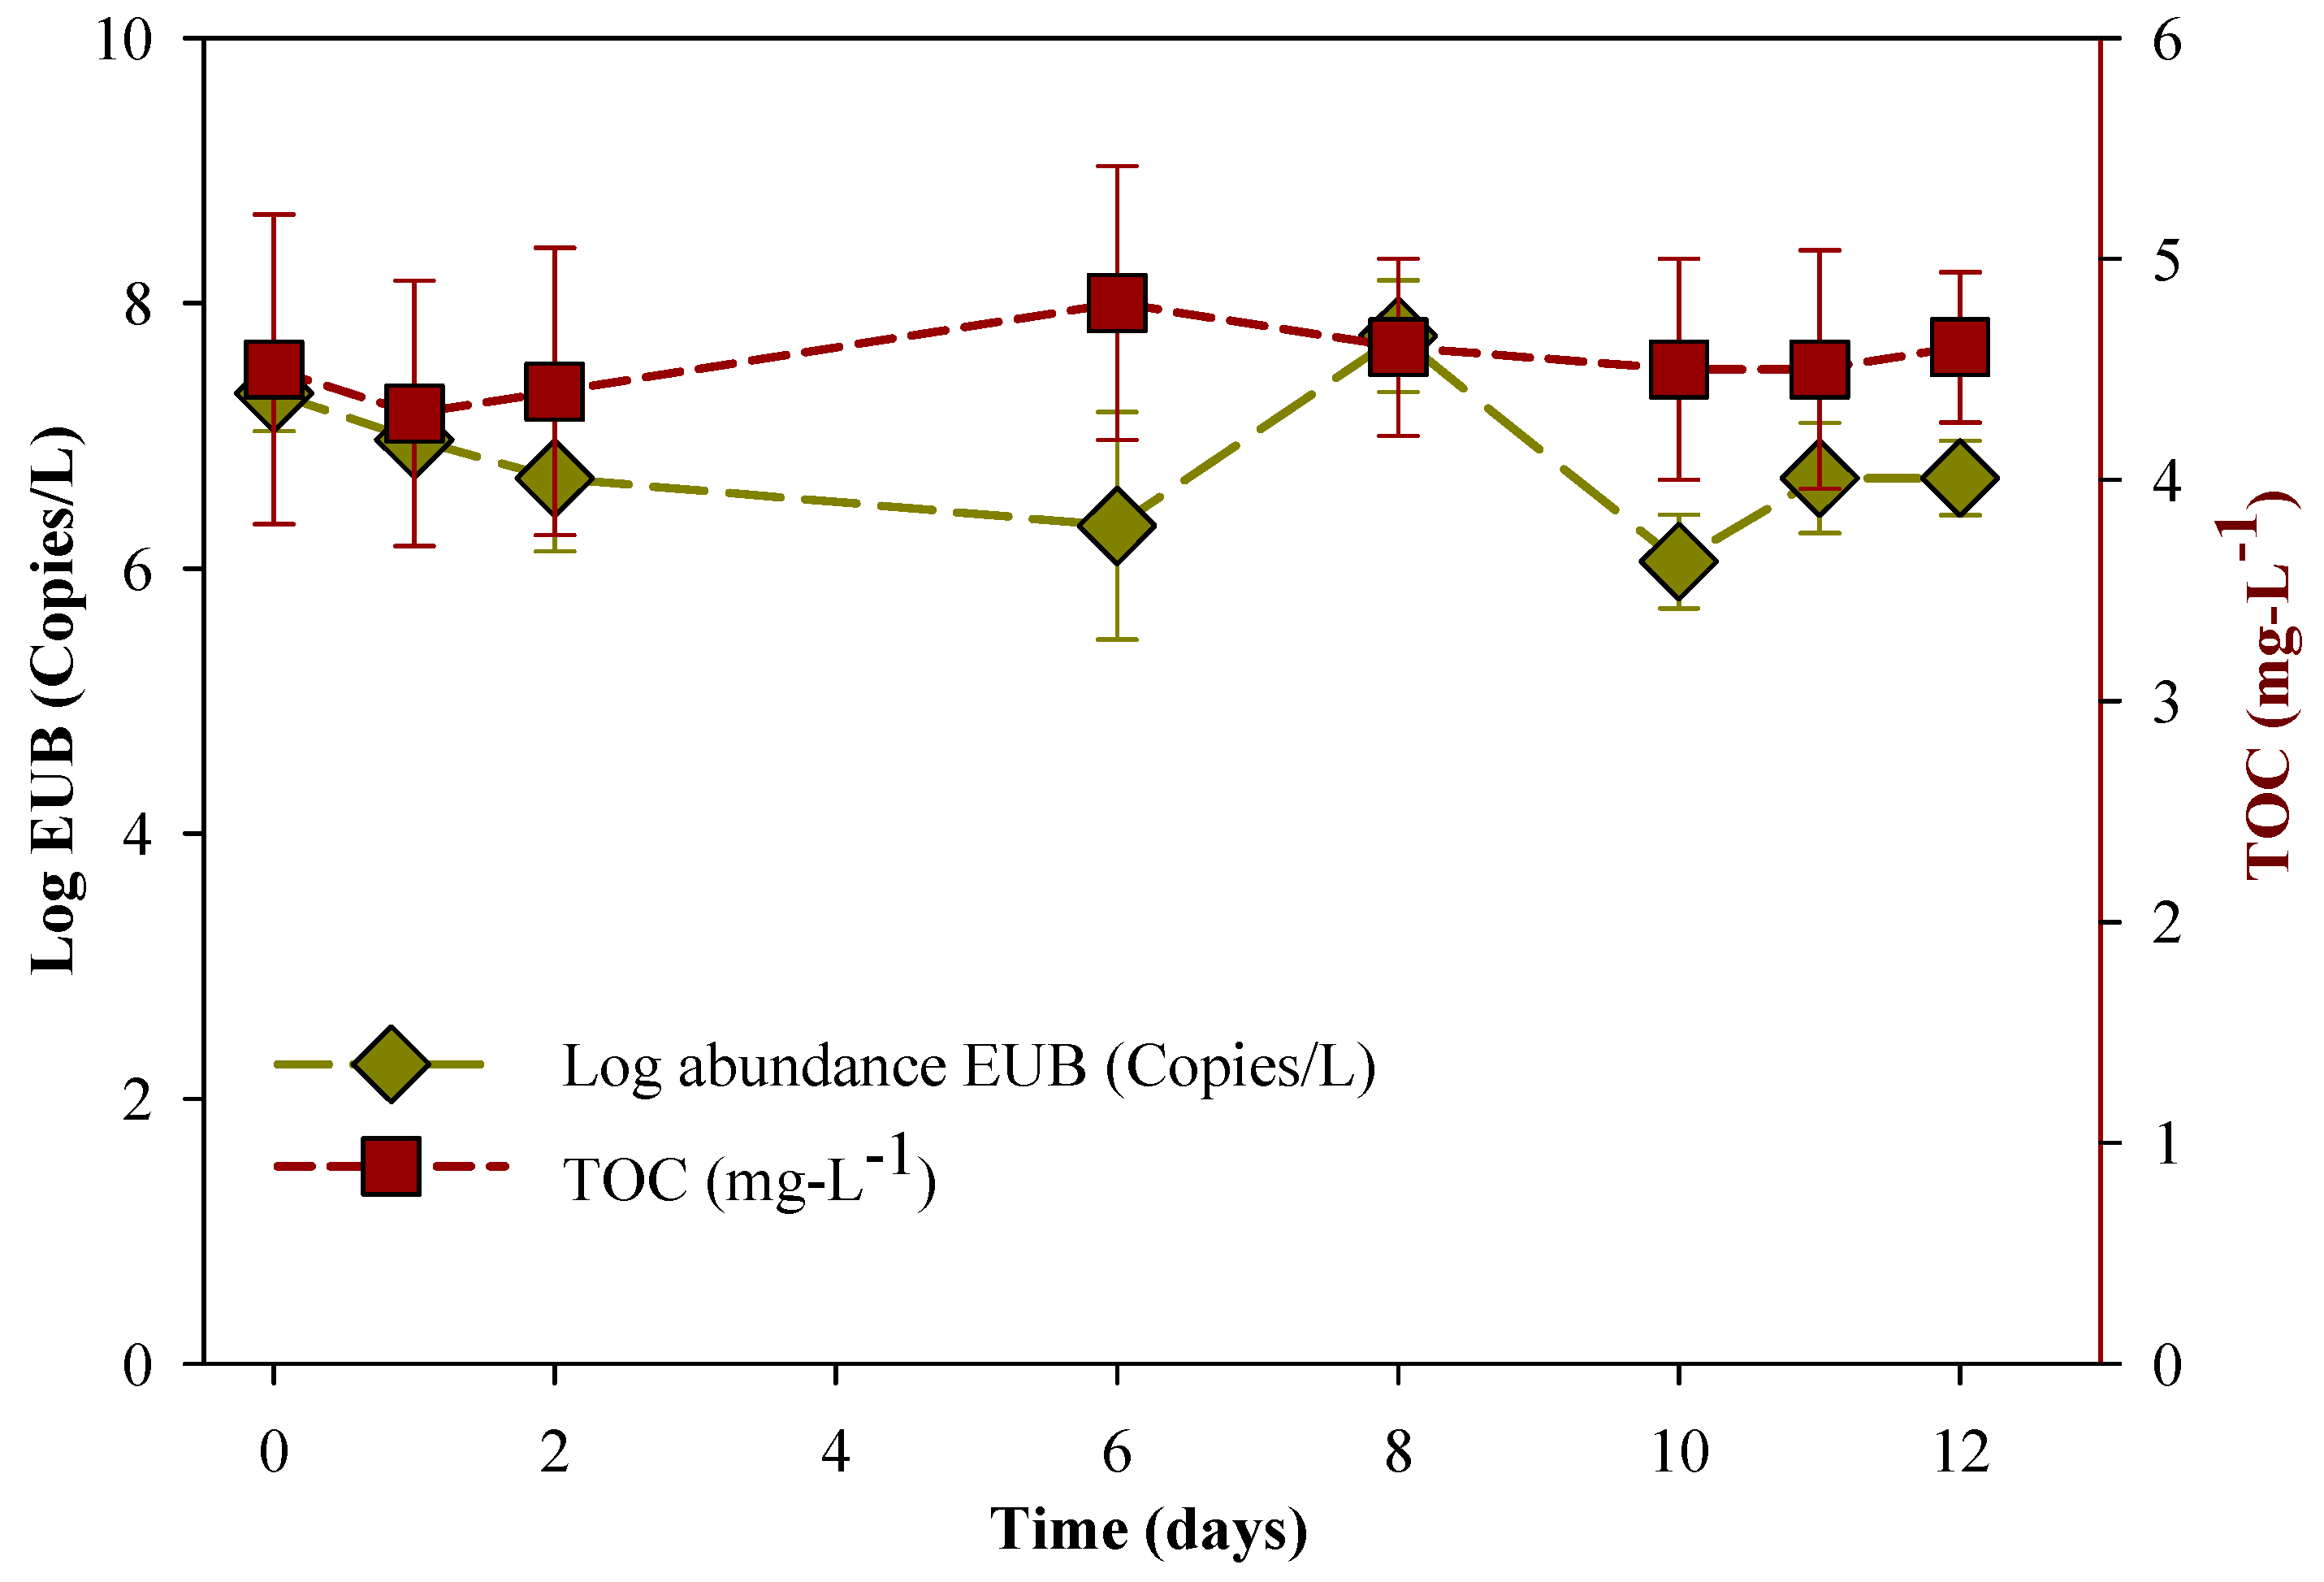
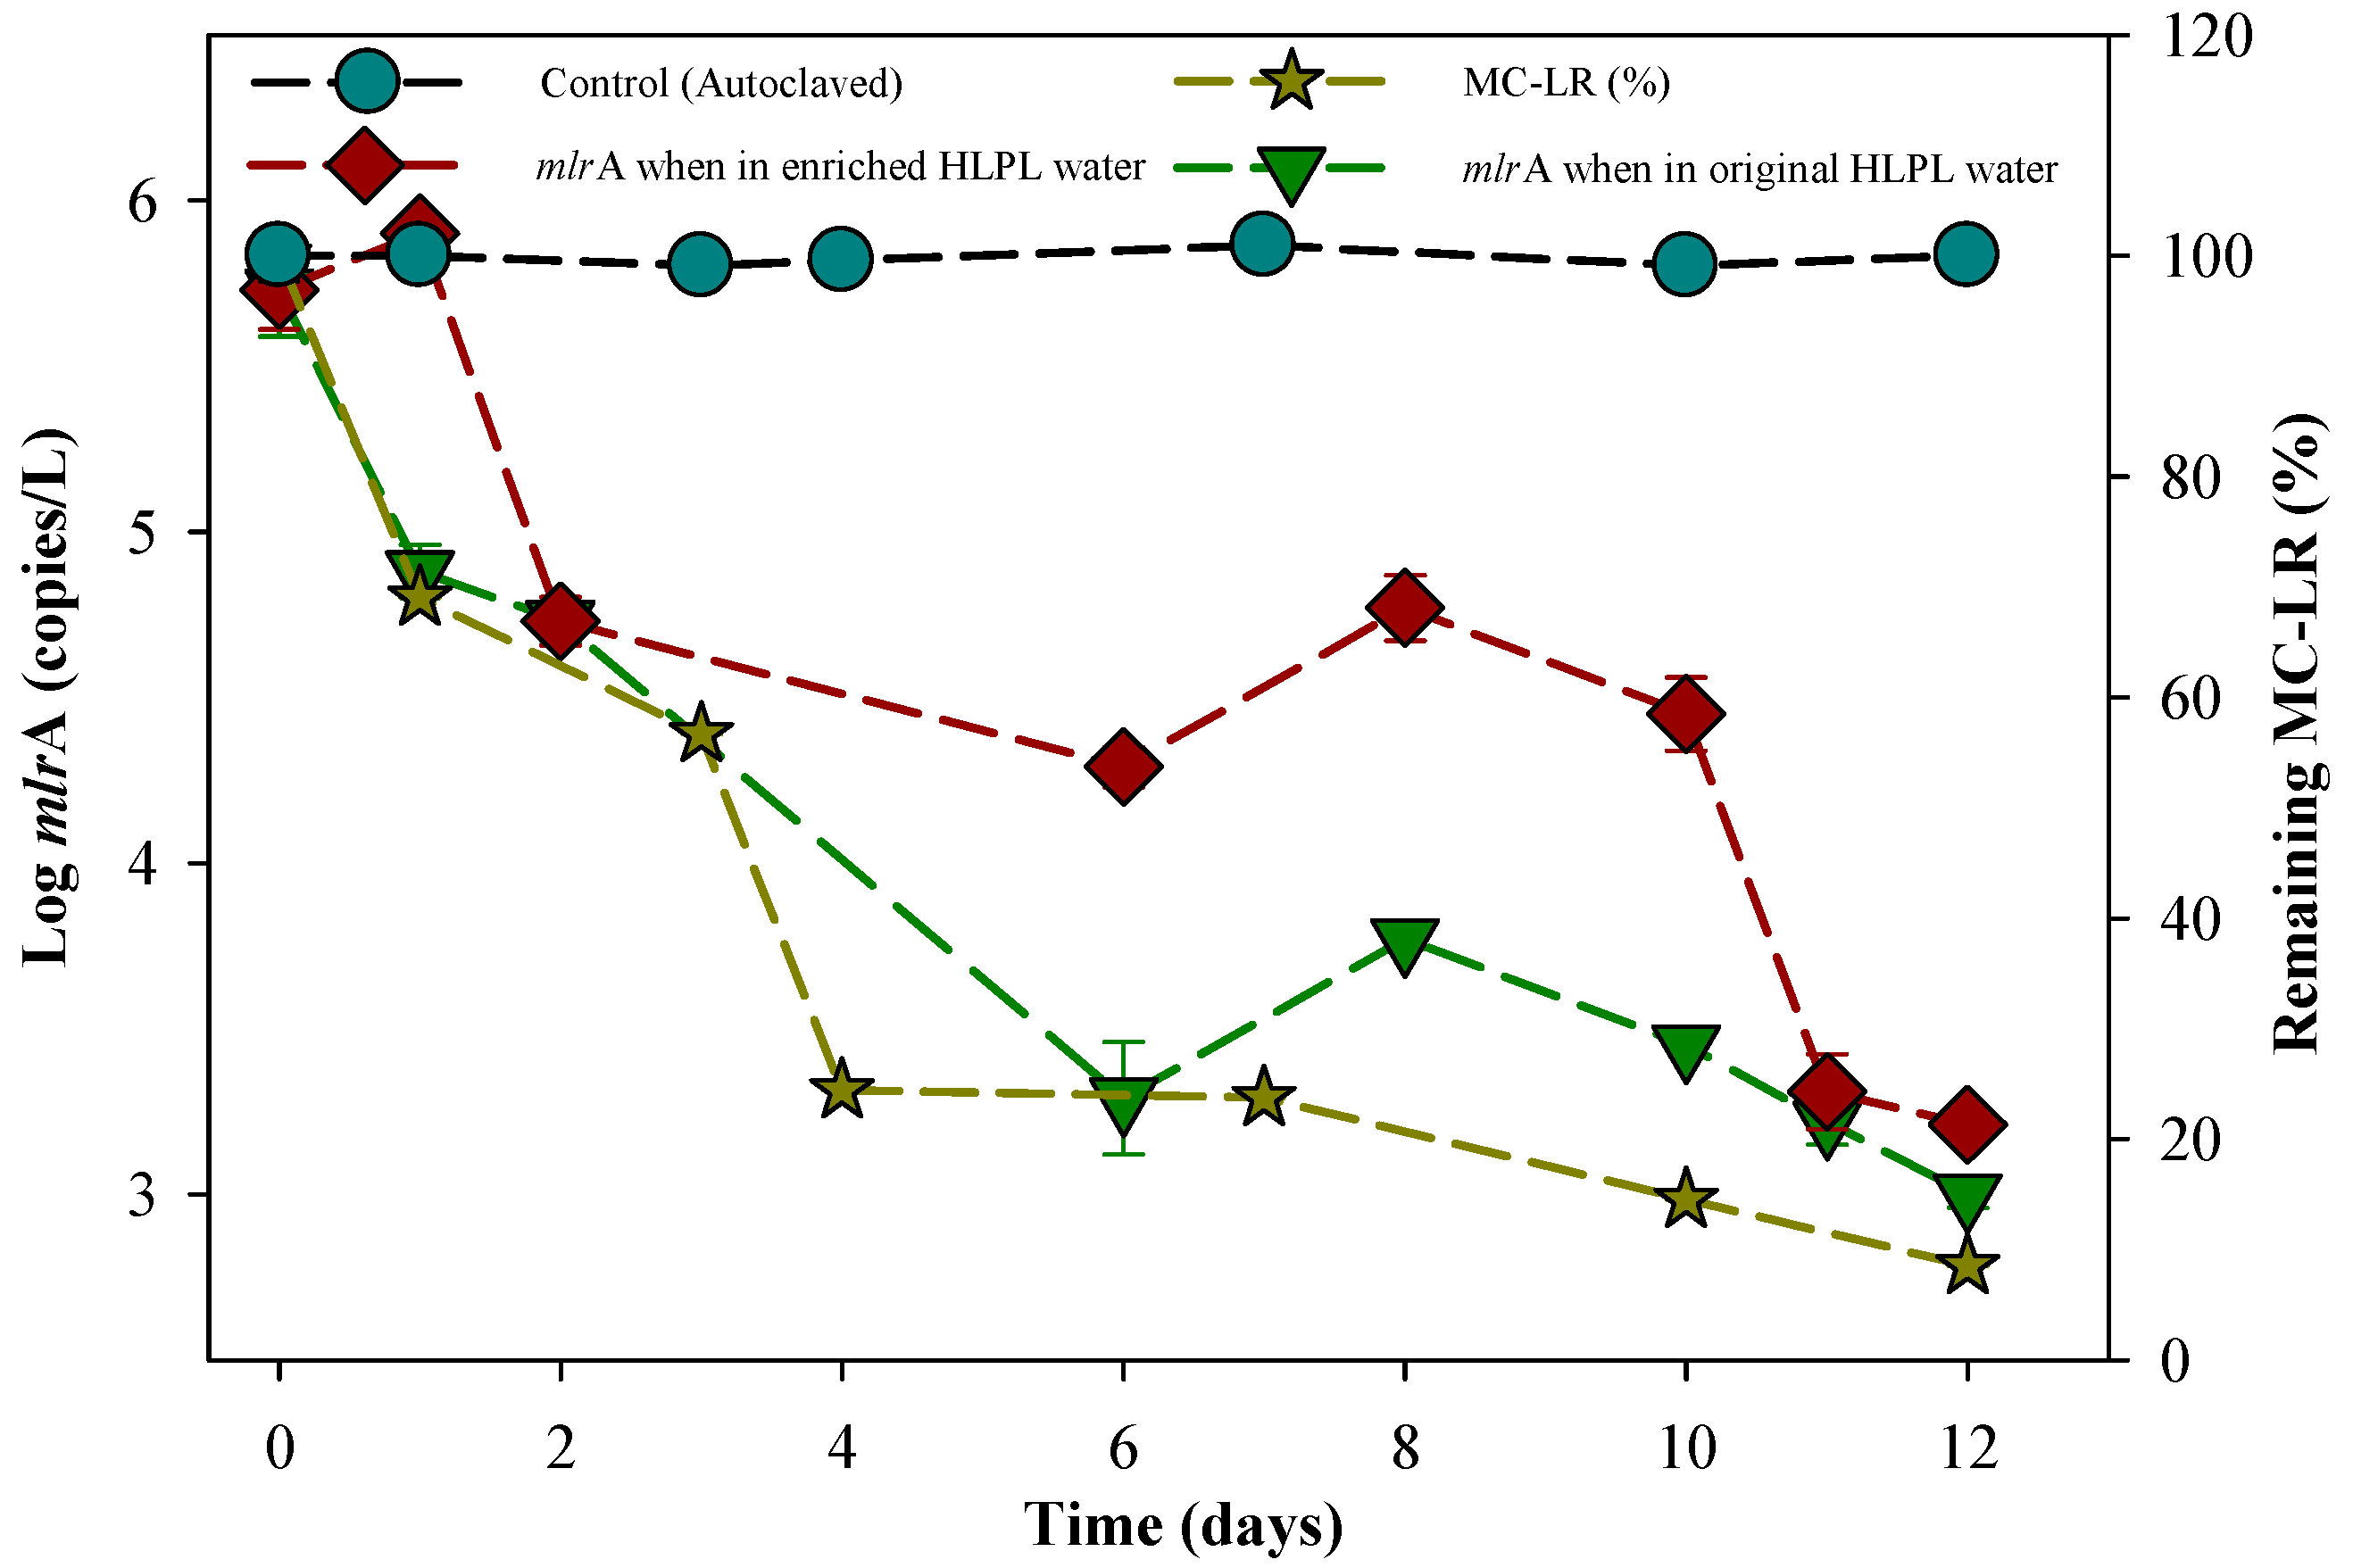
3.5. Biomolecular Aspect of MC-LR Degradation in HLPL Water

The mlrA gene is well known to be directly involved in the degradation of MC-LR [32] by cleaving the ring structure of the heptapeptide between (all-S, all-E)-3-Amino-9-methoxy-2,6,8-trimethyl-10-phenyldeca-4,6-dienoic acid (Adda) and Arginine amino acid, leading to a significant decrease of toxicity for MC-LR [27]. A decrease in mlrA gene concentration was observed during the batch experiments for MC-LR degradation, from 5.4 × 10⁵ copies/L at day 0 to 1.6 × 10³ copies/L at day 12 (Figure 7). Li et al. [66] monitored mlrA gene concentrations during MC-LR degradation in lake water samples spiked with 1000 mg·L−1 glucose for the enrichment of degradation bacteria for MCs. They observed a decrease in mlrA gene concentration during the degradation experiments, from 3.2 × 10⁶ copies/L initially to 3.9 × 10⁵ copies/L at day 7, which is similar to our observation of a decrease in mlrA gene concentrations in the degradation experiments (Figure 7). The decrease in mlrA gene concentrations observed by Li et al. [66] and in the current study might be due to the presence of bacteria with other degradation genes involved in the MCs’ degradation process [33,38]. In addition, there was no statistically significant difference (p = 0.290) in mlrA gene evolution with or without the cyanobacteria enrichment, with a normal distribution for p = 0.49 and p = 0.21, respectively with and without the enrichment in M. aeruginosa.
Although the isolated strain Bacillus sp. has the capability to degrade MC-LR, in the current study the PCR and q-PCR runs show that no mlrA gene was detected in the samples for the bacteria in the degradation experiments. The same observations were reported in Manage et al. [33], where the bacterial strains Arthrobacter spp., Brevibacterium sp., and Rhodococcus sp. were shown to have the ability to degrade MC-LR, although no mlr genes were detected. In another study, Stenotrophomonas acidaminiphila MC-LTH2 was reported to be able to degrade MC-LR with a degradation rate of 3.0 mg·L−1·day−1 at 30 °C, and no mlrA gene was detected in the bacterial strain [39].
To date, members of the mlr gene cluster, and particularly mlrA, are known to be highly involved in the MC-LR degradation process in microorganisms [27,32,67]. It has been proposed that the mlrA protein might be periplasmic [32] or found within the plasma membrane [24], however the emplacement of the mlrA gene is still unclear. Beside the mlr gene cluster, MC-LR degradation in the environment by bacteria has been reported to follow two other pathways, the Gluthathione-S-Tranferase (GST) found in many bacteria [68,69,70], and the CAAX type II amino-terminal protease found in Bacillus spp. [35,37,40]. Mou et al. [38] reported a xenobiotic metabolism in the MC-LR degradation pathway under a bacterioplankton microcosm with an important MC-LR removal of up to 75% within 24 h at room temperature. They observed an overrepresentation of GST and cytochrome P450 oxidase, which are proposed to catalyze the synthetic metabolism of MC-LR to cysteine (Cys) and glutathione (GSH) conjugates in animals [71]. The GST gene was not detected in HLPL water, and MC-LR degradation probably does not follow a GST xenobiotic pathway for its degradation. However, the assertion should be further confirmed since the primers utilized were more specific to Sphingomonas sp. [51]. The absence of the entire genomic sequence of the mlrA gene from a MC-LR degrading bacterial strain raises the issue of whether the microcystin’s degradation is encoded within a mobile gene [37,40]. A mlrA active site was thus proposed, with a probability of it being a zinc-binding motif (HEXXH) found in metalloproteases [37,72].
CAAX type II amino-terminal protease belongs to the CPBP (CAAX Proteases and Bacteriocin Processing enzymes) enzymes family, and might encode for a microcystinase function to that endoprotease [36,40,73]. CAAX type II amino-terminal protease enzymes are 27%–35% similar to mlrA [35,36,57].
The CAAX type II amino-terminal protease gene in the isolated bacterial strain was monitored via PCR reactions. The experimental results show that the isolated Bacillus sp. was found to contain only the CAAX type II amino-terminal protease gene with a 230 bp DNA band shown in Figure 8 of an electrophoresis gel.
Table 2 summarizes the results of the microcystin degradation genes and the degradation rates of MC-LR observed in this study and reported in the literature. MC-LR degradation in HLPL water shows a degradation rate constant k of 0.4 day−1 at 25 °C for an initial MC-LR concentration of 0.55 μg·L−1 (Figure 2). MlrA gene was quantified via q-PCR for an initial concentration of 5.4 × 10⁵ copies/L (Figure 7) measured at the time the water was sampled from HLPL. Sphingomonas sp. Y2 (AB084247) [65] and Sphingomonas isolate NV-3 [30] are also reported to have the mlrA gene with MC-LR degradation rate constants of 0.27 day−1 and 0.33 day−1, respectively, both at the incubation temperature of 30 °C. Although no mlrA gene was detected in the degrading bacteria Stenotrophomonas acidaminiphila MC-LTH2 [39] and a mixed culture of Arthrobacter spp., Brevibacterium sp., and Rhodococcus sp. [33], MC-LR degradation was clearly observed, with rate constants of 0.14 day−1 and 0.33 day−1, respectively. The results suggest that MC-LR may be degraded without the assistance of the mlrA gene. As shown in Table 1 for the microcosm study of Lake Erie water, MC-LR was observed to be degraded. At the same time, the GST gene was the only one among the three microcystin degradation genes to be detected. The presence of the GST gene in MC-LR laden water was also observed in the HLPL water sample, as reported in Table 1, further suggesting that the GST gene might be associated with MC-LR degradation. In the current study, besides mlrA and GST, another gene, CAAX type II amino-terminal protease, was also found in both HLPL water samples and the isolated Bacillus sp., with MC-LR degradation rate constants of 0.1 day−1 (Figure 2) and 0.22 day−1 (Figure 5), respectively. This is the first time that the CAAX type II amino-terminal protease gene was detected in a water system with MC-LR degradation, and provides evidence of the CAAX type II amino-terminal protease acting like a microcystinase, as proposed in previous studies [35,37]. More studies should thus be performed to deepen the overall knowledge on the genes involved in MC-LR degradation by bacteria in the natural environment.

4. Conclusions

In this study, we isolated a MC-LR degrading Bacillus sp. from HLPL water. The bacterium was demonstrated to have good capabilities in biodegrading MC-LR by up to 74% of its original concentration (0.22 mg·L−1) within only twelve days for a low bacterial concentration (8.3 × 10⁶ CFU/mL). The bacterium was tested for its biodegradability of MC-LR under different temperatures, cell densities, and initial MC-LR concentrations. The results show that the degradation rates increased with increasing temperature and cell densities but were not influenced by initial MC-LR concentrations. Neither mlrA nor GST genes were detected in the isolated bacterial strain. However, the isolated Bacillus sp. presented an mlrA gene homologue, the CAAX type II amino-terminal protease enzyme, which is less than 30% similar to the mlrA gene. To date, this is the first time that the CAAX type II amino-terminal protease gene has been monitored and qualitatively determined in a MC-LR degrading bacterial strain. However, the CAAX type II amino-terminal protease’s role is still not well known as a microcystinase. In the MC-LR degradation system, mlrA, GST, and CAAX type II amino-terminal protease genes may be detected, and thus have the potential to be used as indicators in MC-LR degradation pathways. Further studies should be conducted to elucidate the implications of these genes in MC-LR degradation in real water environments.

Supplementary Materials

The following are available online at www.mdpi.com/2073-4441/8/11/508/s1, Figure S1: Growth curve of M. aeruginosa and the change of MC-LR concentration, Figure S2: Correlation between MC-LR (mg·L−1) and M. aeruginosa PCC7820 cells/mL, Figure S3: MlrA gene standard curve, Figure S4: EUB gene standard curve for total bacteria, Figure S5: MC-LR measurement standard curve via ELISA, Figure S6: SEM images of the isolated bacteria Bacillus sp., and Figure S7: Bacillus sp. growth inoculated with and without MC-LR.

Acknowledgments

This study was supported in part by the Taiwan Ministry of Science and Technology (MOST 105-2622-E-006-012), National Cheng Kung University, Taiwan (the University Advancement Project sponsored by the Taiwan Ministry of Education), and the Government of Taiwan and the UNESCO/Keizo Obuchi fellowship 2015.

Author Contributions

Michelline M. R. Kansole conducted the research and prepared the manuscript; Tsair-Fuh Lin guided the entire research and contributed to preparing the manuscript. Both authors approved of the final article.

Conflicts of Interest

The authors have no conflict of interest to declare.

References

  1. Huo, X.; Chang, D.-W.; Tseng, J.-H.; Burch, M.D.; Lin, T.-F. Exposure of M. aeruginosa to hydrogen peroxide under light: Kinetic modeling of cell rupture and simultaneous microcystin degradation. Environ. Sci. Technol. 2015, 49, 5502–5510. [Google Scholar] [CrossRef] [PubMed]
  2. Antoniou, M.G.; De La Cruz, A.A.; Dionysiou, D.D. Cyanotoxins: New generation of water contaminants. J. Environ. Eng. 2005, 131, 1239–1243. [Google Scholar] [CrossRef]
  3. Tsao, H.-W.; Michinaka, A.; Yen, H.-K.; Giglio, S.; Hobson, P.; Monis, P.; Lin, T.-F. Monitoring of geosmin producing anabaena circinalis using quantitative PCR. Water Res. 2014, 49, 416–425. [Google Scholar] [CrossRef] [PubMed]
  4. Graham, J.L.; Loftin, K.A.; Meyer, M.T.; Ziegler, A.C. Cyanotoxin mixtures and taste-and-odor compounds in cyanobacterial blooms from the midwestern united states. Environ. Sci. Technol. 2010, 44, 7361–7368. [Google Scholar] [CrossRef] [PubMed]
  5. Chorus, I.; Bartram, J. Toxic cyanobacteria in water: A guide to public health significance. In Monitoring and Management; E&FN Spon: London, UK, 1999. [Google Scholar]
  6. Falconer, I.R.; Burch, M.D.; Steffensen, D.A.; Choice, M.; Coverdale, O.R. Toxicity of the blue-green alga (cyanobacterium) M. Aeruginosa in drinking water to growing pigs, as an animal model for human injury and risk assessment. Environ. Toxicol. Water Qual. 1994, 9, 131–139. [Google Scholar] [CrossRef]
  7. Falconer, I.R. Algal toxins and human health. In Quality and Treatment of Drinking Water II; Springer: Berlin, Germany, 1998; pp. 53–82. [Google Scholar]
  8. Kamp, L.; Church, J.L.; Carpino, J.; Faltin-Mara, E.; Rubio, F. The effects of water sample treatment, preparation, and storage prior to cyanotoxin analysis for cylindrospermopsin, microcystin and saxitoxin. Chem. Biol. Interact. 2016, 246, 45–51. [Google Scholar] [CrossRef] [PubMed]
  9. Imanishi, S.; Kato, H.; Mizuno, M.; Tsuji, K.; Harada, K.-I. Bacterial degradation of microcystins and nodularin. Chem. Res. Toxicol. 2005, 18, 591–598. [Google Scholar] [CrossRef] [PubMed]
  10. Dietrich, D.; Hoeger, S. Guidance values for microcystins in water and cyanobacterial supplement products (blue-green algal supplements): A reasonable or misguided approach? Toxicol. Appl. Pharmacol. 2005, 203, 273–289. [Google Scholar] [CrossRef] [PubMed]
  11. Falconer, I.R.; Humpage, A.R. Health risk assessment of cyanobacterial (blue-green algal) toxins in drinking water. Int. J. Environ. Res. Public Health 2005, 2, 43–50. [Google Scholar] [CrossRef] [PubMed]
  12. De Figueiredo, D.R.; Azeiteiro, U.M.; Esteves, S.M.; Gonçalves, F.J.; Pereira, M.J. Microcystin-producing blooms—A serious global public health issue. Ecotoxicol. Environ. Saf. 2004, 59, 151–163. [Google Scholar] [CrossRef] [PubMed]
  13. Shen, P.; Shi, Q.; Hua, Z.; Kong, F.; Wang, Z.; Zhuang, S.; Chen, D. Analysis of microcystins in cyanobacteria blooms and surface water samples from meiliang bay, taihu lake, china. Environ. Int. 2003, 29, 641–647. [Google Scholar] [CrossRef]
  14. Newcombe, G.; Chorus, I.; Falconer, I.; Lin, T.-F. Cyanobacteria: Impacts of climate change on occurrence, toxicity and water quality management. Water Res. 2012, 46, 1347–1348. [Google Scholar] [CrossRef] [PubMed]
  15. World Health Organization. Guidelines for Drinking-Water Quality. Vol. 2, Health Criteria and Other Supporting Information: Addendum; World Health Organization: Geneva, Switzerland, 1998. [Google Scholar]
  16. Jetoo, S.; Grover, V.I.; Krantzberg, G. The toledo drinking water advisory: Suggested application of the water safety planning approach. Sustainability 2015, 7, 9787–9808. [Google Scholar] [CrossRef]
  17. Carmichael, W.W. Health effects of toxin-producing cyanobacteria:“The cyanohabs”. Hum. Ecol. Risk Assess. Int. J. 2001, 7, 1393–1407. [Google Scholar] [CrossRef]
  18. Garcia, A.C.; Bargu, S.; Dash, P.; Rabalais, N.N.; Sutor, M.; Morrison, W.; Walker, N.D. Evaluating the potential risk of microcystins to blue crab (callinectes sapidus) fisheries and human health in a eutrophic estuary. Harmful Algae 2010, 9, 134–143. [Google Scholar] [CrossRef]
  19. Cousins, I.; Bealing, D.; James, H.; Sutton, A. Biodegradation of microcystin-lr by indigenous mixed bacterial populations. Water Res. 1996, 30, 481–485. [Google Scholar] [CrossRef]
  20. Chen, W.; Song, L.; Peng, L.; Wan, N.; Zhang, X.; Gan, N. Reduction in microcystin concentrations in large and shallow lakes: Water and sediment-interface contributions. Water Res. 2008, 42, 763–773. [Google Scholar] [CrossRef] [PubMed]
  21. Wang, X.; Utsumi, M.; Gao, Y.; Li, Q.; Tian, X.; Shimizu, K.; Sugiura, N. Influences of metal ions on microcystin-lr degradation capacity and dynamics in microbial distribution of biofilm collected from water treatment plant nearby kasumigaura lake. Chemosphere 2016, 147, 230–238. [Google Scholar] [CrossRef] [PubMed]
  22. Edwards, C.; Graham, D.; Fowler, N.; Lawton, L.A. Biodegradation of microcystins and nodularin in freshwaters. Chemosphere 2008, 73, 1315–1321. [Google Scholar] [CrossRef] [PubMed]
  23. Gągała, I.; Mankiewicz-Boczek, J. The natural degradation of microcystins (cyanobacterial hepatotoxins) in fresh water-the future of modern treatment systems and water quality improvement. Pol. J. Environ. Stud. 2012, 21, 1125–1139. [Google Scholar]
  24. Chen, J.; Hu, L.B.; Zhou, W.; Yan, S.H.; Yang, J.D.; Xue, Y.F.; Shi, Z.Q. Degradation of microcystin-LR and RR by a Stenotrophomonas sp. strain EMS isolated from lake taihu, china. Int. J. Mol. Sci. 2010, 11, 896–911. [Google Scholar] [CrossRef] [PubMed]
  25. Dziga, D.; Zielinska, G.; Wladyka, B.; Bochenska, O.; Maksylewicz, A.; Strzalka, W.; Meriluoto, J. Characterization of enzymatic activity of MlrB and MlrC proteins involved in bacterial degradation of cyanotoxins microcystins. Toxins 2016, 8, 76. [Google Scholar] [CrossRef] [PubMed]
  26. Sumaiya, I.; Pathmalal, M.; de Silva, B.; Welgamage, A.; Edwards, C.; Lawton, L.A. Isolation and characterization of microcystin-degrading bacteria from two water bodies in sri lanka. Appl. Environ. Microbiol. 2009, 75, 6924–6928. [Google Scholar]
  27. Bourne, D.G.; Jones, G.J.; Blakeley, R.L.; Jones, A.; Negri, A.P.; Riddles, P. Enzymatic pathway for the bacterial degradation of the cyanobacterial cyclic peptide toxin microcystin LR. Appl. Environ. Microbiol. 1996, 62, 4086–4094. [Google Scholar] [PubMed]
  28. Miao, H.-F.; Qin, F.; Tao, G.-J.; Tao, W.-Y.; Ruan, W.-Q. Detoxification and degradation of microcystin-LR and-RR by ozonation. Chemosphere 2010, 79, 355–361. [Google Scholar] [CrossRef] [PubMed]
  29. Okano, K.; Shimizu, K.; Maseda, H.; Kawauchi, Y.; Utsumi, M.; Itayama, T.; Zhang, Z.; Sugiura, N. Whole-genome sequence of the microcystin-degrading bacterium Sphingopyxis sp. Strain c-1. Genome Announc. 2015, 3. [Google Scholar] [CrossRef] [PubMed]
  30. Somdee, T.; Thunders, M.; Ruck, J.; Lys, I.; Allison, M.; Page, R. Degradation of [Dha7] MC-LR by a microcystin degrading bacterium isolated from lake rotoiti, new zealand. ISRN Microbiol. 2013, 2013, 596429. [Google Scholar] [CrossRef] [PubMed]
  31. Kormas, K.A.; Lymperopoulou, D.S. Cyanobacterial toxin degrading bacteria: Who are they? BioMed Res. Int. 2013, 2013, 877–881. [Google Scholar] [CrossRef] [PubMed]
  32. Bourne, D.G.; Riddles, P.; Jones, G.J.; Smith, W.; Blakeley, R.L. Characterisation of a gene cluster involved in bacterial degradation of the cyanobacterial toxin microcystin LR. Environ. Toxicol. 2001, 16, 523–534. [Google Scholar] [CrossRef] [PubMed]
  33. Manage, P.M.; Edwards, C.; Singh, B.K.; Lawton, L.A. Isolation and identification of novel microcystin-degrading bacteria. Appl. Environ. Microbiol. 2009, 75, 6924–6928. [Google Scholar] [CrossRef] [PubMed]
  34. Mankiewicz-Boczek, J.; Gagala, I.; Jurczak, T.; Jaskulska, A.; Pawelczyk, J.; Dziadek, J. Bacteria homologus to aeromonas. Capable of microcystin degradation. Open Life Sci 2015, 10, 119–129. [Google Scholar] [CrossRef]
  35. Saito, T.; Okano, K.; Park, H.-D.; Itayama, T.; Inamori, Y.; Neilan, B.A.; Burns, B.P.; Sugiura, N. Detection and sequencing of the microcystin lr-degrading gene, mlra, from new bacteria isolated from japanese lakes. FEMS Microbiol. Lett. 2003, 229, 271–276. [Google Scholar] [CrossRef]
  36. Pei, J.; Mitchell, D.A.; Dixon, J.E.; Grishin, N.V. Expansion of type ii caax proteases reveals evolutionary origin of γ-secretase subunit aph-1. J. Mol. Biol. 2011, 410, 18–26. [Google Scholar] [CrossRef] [PubMed]
  37. Barrett, A.J.; Woessner, J.F.; Rawlings, N.D. Handbook of Proteolytic Enzymes; Elsevier: Amsterdam, The Netherlands, 2012. [Google Scholar]
  38. Mou, X.; Lu, X.; Jacob, J.; Sun, S.; Heath, R. Metagenomic identification of bacterioplankton taxa and pathways involved in microcystin degradation in lake erie. PLoS ONE 2013, 8, e61890. [Google Scholar] [CrossRef] [PubMed]
  39. Yang, F.; Zhou, Y.; Yin, L.; Zhu, G.; Liang, G.; Pu, Y. Microcystin-degrading activity of an indigenous bacterial strain Stenotrophomonas acidaminiphila MC-LTH2 isolated from lake taihu. PLoS ONE 2014, 9, e86216. [Google Scholar] [CrossRef] [PubMed]
  40. Dziga, D.; Wasylewski, M.; Wladyka, B.; Nybom, S.; Meriluoto, J. Microbial degradation of microcystins. Chem. Res. Toxicol. 2013, 26, 841–852. [Google Scholar] [CrossRef] [PubMed]
  41. Sadler, T.; von Elert, E. Physiological interaction of daphnia and microcystis with regard to cyanobacterial secondary metabolites. Aquat. Toxicol. 2014, 156, 96–105. [Google Scholar] [CrossRef] [PubMed]
  42. Bury, N.; Flik, G.; Eddy, F.; Codd, G. The effects of cyanobacteria and the cyanobacterial toxin microcystin-LR on Ca2+ transport and Na+/K+-atpase in tilapia gills. J. Exp. Biol. 1996, 199, 1319–1326. [Google Scholar] [PubMed]
  43. Hu, L.B.; Yang, J.D.; Zhou, W.; Yin, Y.F.; Chen, J.; Shi, Z.Q. Isolation of a Methylobacillus sp. That degrades microcystin toxins associated with cyanobacteria. New Biotechnol. 2009, 26, 205–211. [Google Scholar] [CrossRef] [PubMed]
  44. Nhmrc, N. Australian Drinking Water Guidelines. 2004. Available online: https://www.nhmrc.gov.au/guidelines-publications/eh34 (accessed on 20 August 2016). [Google Scholar]
  45. Fischer, W.J.; Garthwaite, I.; Miles, C.O.; Ross, K.M.; Aggen, J.B.; Chamberlin, A.R.; Towers, N.R.; Dietrich, D.R. Congener-independent immunoassay for microcystins and nodularins. Environ. Sci. Technol. 2001, 35, 4849–4856. [Google Scholar] [CrossRef] [PubMed]
  46. Sepahi, A.A.; Golpasha, I.D.; Emami, M.; Nakhoda, A. Isolation and characterization of crude oil degrading bacillus spp. J. Environ. Health Sci. Eng. 2008, 5, 149–154. [Google Scholar]
  47. Bartram, J.; Cotruvo, J.; Exner, M.; Fricker, C.; Glasmacher, A. Heterotrophic Plate Counts and Drinking-Water Safety: The Significance of Hpcs for Water Quality and Human Health; IWA Publishing: London, UK, 2003. [Google Scholar]
  48. Bustin, S.A.; Benes, V.; Garson, J.A.; Hellemans, J.; Huggett, J.; Kubista, M.; Mueller, R.; Nolan, T.; Pfaffl, M.W.; Shipley, G.L. The MIQE guidelines: Minimum information for publication of quantitative real-time PCR experiments. Clin. Chem. 2009, 55, 611–622. [Google Scholar] [CrossRef] [PubMed]
  49. Hoefel, D.; Adriansen, C.M.; Bouyssou, M.A.; Saint, C.P.; Newcombe, G.; Ho, L. Development of an mlrA gene-directed TaqMan PCR assay for quantitative assessment of microcystin-degrading bacteria within water treatment plant sand filter biofilms. Appl. Environ. Microbiol. 2009, 75, 5167–5169. [Google Scholar] [CrossRef] [PubMed]
  50. Muyzer, G.; De Waal, E.C.; Uitterlinden, A.G. Profiling of complex microbial populations by denaturing gradient gel electrophoresis analysis of polymerase chain reaction-amplified genes coding for 16S rRNA. Appl. Environ. Microbiol. 1993, 59, 695–700. [Google Scholar] [PubMed]
  51. Lloyd-Jones, G.; Lau, P. Glutathione s-transferase-encoding gene as a potential probe for environmental bacterial isolates capable of degrading polycyclic aromatic hydrocarbons. Appl. Environ. Microbiol. 1997, 63, 3286–3290. [Google Scholar] [PubMed]
  52. Lloyd-Jones, G.; Laurie, A.D.; Hunter, D.W.; Fraser, R. Analysis of catabolic genes for naphthalene and phenanthrene degradation in contaminated new zealand soils. FEMS Microbiol. Ecol. 1999, 29, 69–79. [Google Scholar] [CrossRef]
  53. Engelbrektson, A.; Kunin, V.; Wrighton, K.C.; Zvenigorodsky, N.; Chen, F.; Ochman, H.; Hugenholtz, P. Experimental factors affecting pcr-based estimates of microbial species richness and evenness. ISME J. 2010, 4, 642–647. [Google Scholar] [CrossRef] [PubMed]
  54. Ahn, J.-H.; Kim, M.-C.; Shin, H.-C.; Choi, M.-K.; Yoon, S.-S.; Kim, T.; Song, H.-G.; Lee, G.H.; Ka, J.-O. Improvement of PCR amplification bias for community structure analysis of soil bacteria by denaturing gradient gel electrophoresis. J. Microbiol. Biotechnol. 2006, 16, 1561–1569. [Google Scholar]
  55. Schreier, P.H.; Cortese, R. A fast and simple method for sequencing DNA cloned in the single-stranded bacteriophage M13. J. Mol. Biol. 1979, 129, 169–172. [Google Scholar] [CrossRef]
  56. Knoche, K.; Kephart, D. Cloning blunt-end Pfu DNA polymerase-generated PCR fragments into pGEM®-T vector systems. Promega Notes 1999, 71, 10. [Google Scholar]
  57. Ncbi, R.C. Database resources of the national center for biotechnology information. Nucleic Acids Res. 2016, 44, D7. [Google Scholar]
  58. Tamura, K.; Stecher, G.; Peterson, D.; Filipski, A.; Kumar, S. MEGA6: Molecular evolutionary genetics analysis version 6.0. Mol. Biol. Evol. 2013, 30, 2725–2729. [Google Scholar] [CrossRef] [PubMed]
  59. Jordaan, K.; Bezuidenhout, C. Bacterial community composition of an urban river in the north west province, south africa, in relation to physico-chemical water quality. Environ. Sci. Pollut. Res. 2016, 23, 5868–5880. [Google Scholar] [CrossRef] [PubMed]
  60. Himberg, K.; Keijola, A.-M.; Hiisvirta, L.; Pyysalo, H.; Sivonen, K. The effect of water treatment processes on the removal of hepatotoxins frommicrocystis andoscillatoria cyanobacteria: A laboratory study. Water Res. 1989, 23, 979–984. [Google Scholar] [CrossRef]
  61. Harada, K.-I.; Tsuji, K.; Watanabe, M.F.; Kondo, F. Stability of microcystins from cyanobacteria-III.* Effect of pH and temperature. Phycologia 1996, 35, 83–88. [Google Scholar] [CrossRef]
  62. Jones, G.J.; Orr, P.T. Release and degradation of microcystin following algicide treatment of a M. Aeruginosa bloom in a recreational lake, as determined by hplc and protein phosphatase inhibition assay. Water Res. 1994, 28, 871–876. [Google Scholar] [CrossRef]
  63. Farhadkhani, M.; Nikaeen, M.; Adergani, B.A.; Hatamzadeh, M.; Nabavi, B.F.; Hassanzadeh, A. Assessment of drinking water quality from bottled water coolers. Iran. J. Public Health 2014, 43, 674. [Google Scholar] [PubMed]
  64. Cabeen, M.T.; Jacobs-Wagner, C. Bacterial cell shape. Nat. Rev. Microbiol. 2005, 3, 601–610. [Google Scholar] [CrossRef] [PubMed]
  65. Park, H.D.; Sasaki, Y.; Maruyama, T.; Yanagisawa, E.; Hiraishi, A.; Kato, K. Degradation of the cyanobacterial hepatotoxin microcystin by a new bacterium isolated from a hypertrophic lake. Environ. Toxicol. 2001, 16, 337–343. [Google Scholar] [CrossRef] [PubMed]
  66. Li, J.; Shimizu, K.; Utsumi, M.; Nakamoto, T.; Sakharkar, M.K.; Zhang, Z.; Sugiura, N. Dynamics of the functional gene copy number and overall bacterial community during microcystin-LR degradation by a biological treatment facility in a drinking water treatment plant. J. Biosci. Bioeng. 2011, 111, 695–701. [Google Scholar] [CrossRef] [PubMed]
  67. Ho, L.; Hoefel, D.; Palazot, S.; Sawade, E.; Newcombe, G.; Saint, C.P.; Brookes, J.D. Investigations into the biodegradation of microcystin-LR in wastewaters. J. Hazard. Mater. 2010, 180, 628–633. [Google Scholar] [CrossRef] [PubMed]
  68. Maatouk, I.; Bouaïcha, N.; Plessis, M.J.; Périn, F. Detection by 32P-postlabelling of 8-oxo-7, 8-dihydro-2′-deoxyguanosine in DNA as biomarker of microcystin-LR-and nodularin-induced DNA damage in vitro in primary cultured rat hepatocytes and in vivo in rat liver. Mutat. Res. Genet. Toxicol. Environ. Mutagen. 2004, 564, 9–20. [Google Scholar] [CrossRef] [PubMed]
  69. Ding, W.X.; Shen, H.M.; Ong, C.N. Critical role of reactive oxygen species and mitochondrial permeability transition in microcystin-induced rapid apoptosis in rat hepatocytes. Hepatology 2000, 32, 547–555. [Google Scholar] [CrossRef] [PubMed]
  70. Gehringer, M.M.; Shephard, E.G.; Downing, T.G.; Wiegand, C.; Neilan, B.A. An investigation into the detoxification of microcystin-LR by the glutathione pathway in balb/c mice. Int. J. Biochem. Cell Biol. 2004, 36, 931–941. [Google Scholar] [CrossRef] [PubMed]
  71. Campos, A.; Vasconcelos, V. Molecular mechanisms of microcystin toxicity in animal cells. Int. J. Mol. Sci. 2010, 11, 268–287. [Google Scholar] [CrossRef] [PubMed]
  72. Dziga, D.; Wladyka, B.; Zielińska, G.; Meriluoto, J.; Wasylewski, M. Heterologous expression and characterisation of microcystinase. Toxicon 2012, 59, 578–586. [Google Scholar] [CrossRef] [PubMed]
  73. Read, T.D.; Salzberg, S.L.; Pop, M.; Shumway, M.; Umayam, L.; Jiang, L.; Holtzapple, E.; Busch, J.D.; Smith, K.L.; Schupp, J.M. Comparative genome sequencing for discovery of novel polymorphisms in bacillus anthracis. Science 2002, 296, 2028–2033. [Google Scholar] [CrossRef] [PubMed]
Figure 1. Map of Taiwan with the location of Hulupi Lake (23°12′33.6′′ N 120°19′49.1′′ E) and the lake map. The two parts of the lake are separated by an asphalted road. The points are the sampling locations for the study.
Water 08 00508 g001
Figure 2. Change in MC-LR concentrations in Hulupi Lake water samples at 25 °C. The curves are modeled to fit the first-order reaction model. The error bars represent one standard deviation for three measurements.
Water 08 00508 g002
Figure 3. Evolution of the total bacteria gene abundance and total organic carbon (TOC) in HLPL water samples, with the initial MC-LR concentration = 0.55 μg·L−1. The error bars represent one standard deviation for three measurements.
Water 08 00508 g003
Figure 4. Neighbor-joining tree of the isolated bacteria. The unknown strain is the isolated bacteria with 93% similarity to Bacillus sp.
Water 08 00508 g004
Figure 5. Degradation of MC-LR by the isolated strain Bacillus sp. (8.4 × 10⁶ CFU/mL) under different temperatures. k is the first order degradation rate constant. The error bars represent one standard deviation for three measurements.
Water 08 00508 g005
Figure 6. (a) MC-LR degradation under Bacillus sp. 8.3 × 10⁶ CFU/mL at four different concentrations of MC-LR at 25 °C; (b) MC-LR degradation under Bacillus sp. 8.1 × 10¹⁰ CFU/mL at four different concentrations of MC-LR at 25 °C. The error bars represent one standard deviation for three measurements.
Water 08 00508 g006
Figure 7. Evolution in mlrA gene abundance and MC-LR degradation in enriched water within the batch culture. The enriched water had an initial MC-LR concentration of 0.014 mg·L−1 (The error bars represent one standard deviation for three measurements).
Water 08 00508 g007
Figure 8. Amplified region of the CAAX type II amino-terminal protease gene using the set of primers CAAX F2 (5′-TGGACTTTTTGGCATCTTCC-3′) and CAAX R2 (5′-GGGTTGGTGGAATGAGTTTG-3′) developed in this study.
Water 08 00508 g008
Table 1. List of primers and probe/dye used in the current study.
Target GenePrimersProbe/DyeUseReferences
mlrAqmlrAf (5′-AGCCCKGGCCCRCTGC-3′)qmlrA-tm (5′-FAM-TGCCSCAGCTSCTCAAGAAGTTTG-BHQ1-3′) TaqMan®q-PCR[49]
qmlrAr (5′-ATGCCARGCCCACCACAT-3′)-
EUB (Total bacteria)EUB338 5′-ACTCCTACGGGAGGCAGCAG-3′SYBR®Green Iq-PCR[50]
EUB518 5′-ATTACCGCGGCTGCTGG-3′-
GSTp3-24F (5′-ATGAAACTGTTCATCAGCC-3′)-PCR[51,52]
p3-24R (5′-CCAGCATCACGTACAGATAG-3′)-
DNA cloning (Isolated bacteria)1392R 5′-ACGGGCGGTGTGTRC-3′-PCR[53]
338F 5′-ACTCCTACGGGAGGCAGCAG-3′-[54]
Plasmid insert vector M13 (Isolated bacteria DNA sequencing)M13 Reverse (5′-CAGGAAACAGCTATGAC-3′)-PCR[55]
M13 Forward (5′-GTAAAACGACGGCCAG-3′)-
CAAX type II amino-protease geneCAAX F2 (5′-TGGACTTTTTGGCATCTTCC-3′)-PCRThis study
CAAX R2 (5′-GGGTTGGTGGAATGAGTTTG-3′)-
Table 2. Microorganisms involved in MC-LR degradation, with specifications of their degradation pathways via the mlrA, GST, or CAAX genes, and temperature conditions with specificity of their degradation rate and constant k.
MicroorganismsmlrAGSTCAAXTemp. (°C)Degradation Rate (mg·L−1·Day−1)k (Day−1)References
Bacterioplankton (Hulupi Lake)+/#-+256 × 10−50.1This study
Bacillus sp.--+375 × 10−20.22This study
Mixed Arthrobacter spp., Brevibacterium sp., and Rhodococcus sp-251.670.33 *[33]
Stenotrophomonas acidaminiphila MC-LTH2-303.00.14 *[39]
Bacterioplankton microcosm (Lake Erie)-+room temp.Qualitative degradationQualitative degradation[38]
Aeromonas sp.-25Qualitative degradationQualitative degradation[34]
Sphingomonas sp. Y2 (AB084247)+305.40.27 *[65]
Sphingomonas isolate NV-3+308.3 × 10−30.33 *[30]
Notes: +: Detected (PCR); -: Not detected (PCR); #: Quantified (q-PCR); ∞: Not studied; *: Calculated from data reported in the reference.

