
Using Water Footprints to Identify Alternatives for Conserving Local Water Resources in California


Abstract
:1. Introduction
2. Water Footprints
3. California Water
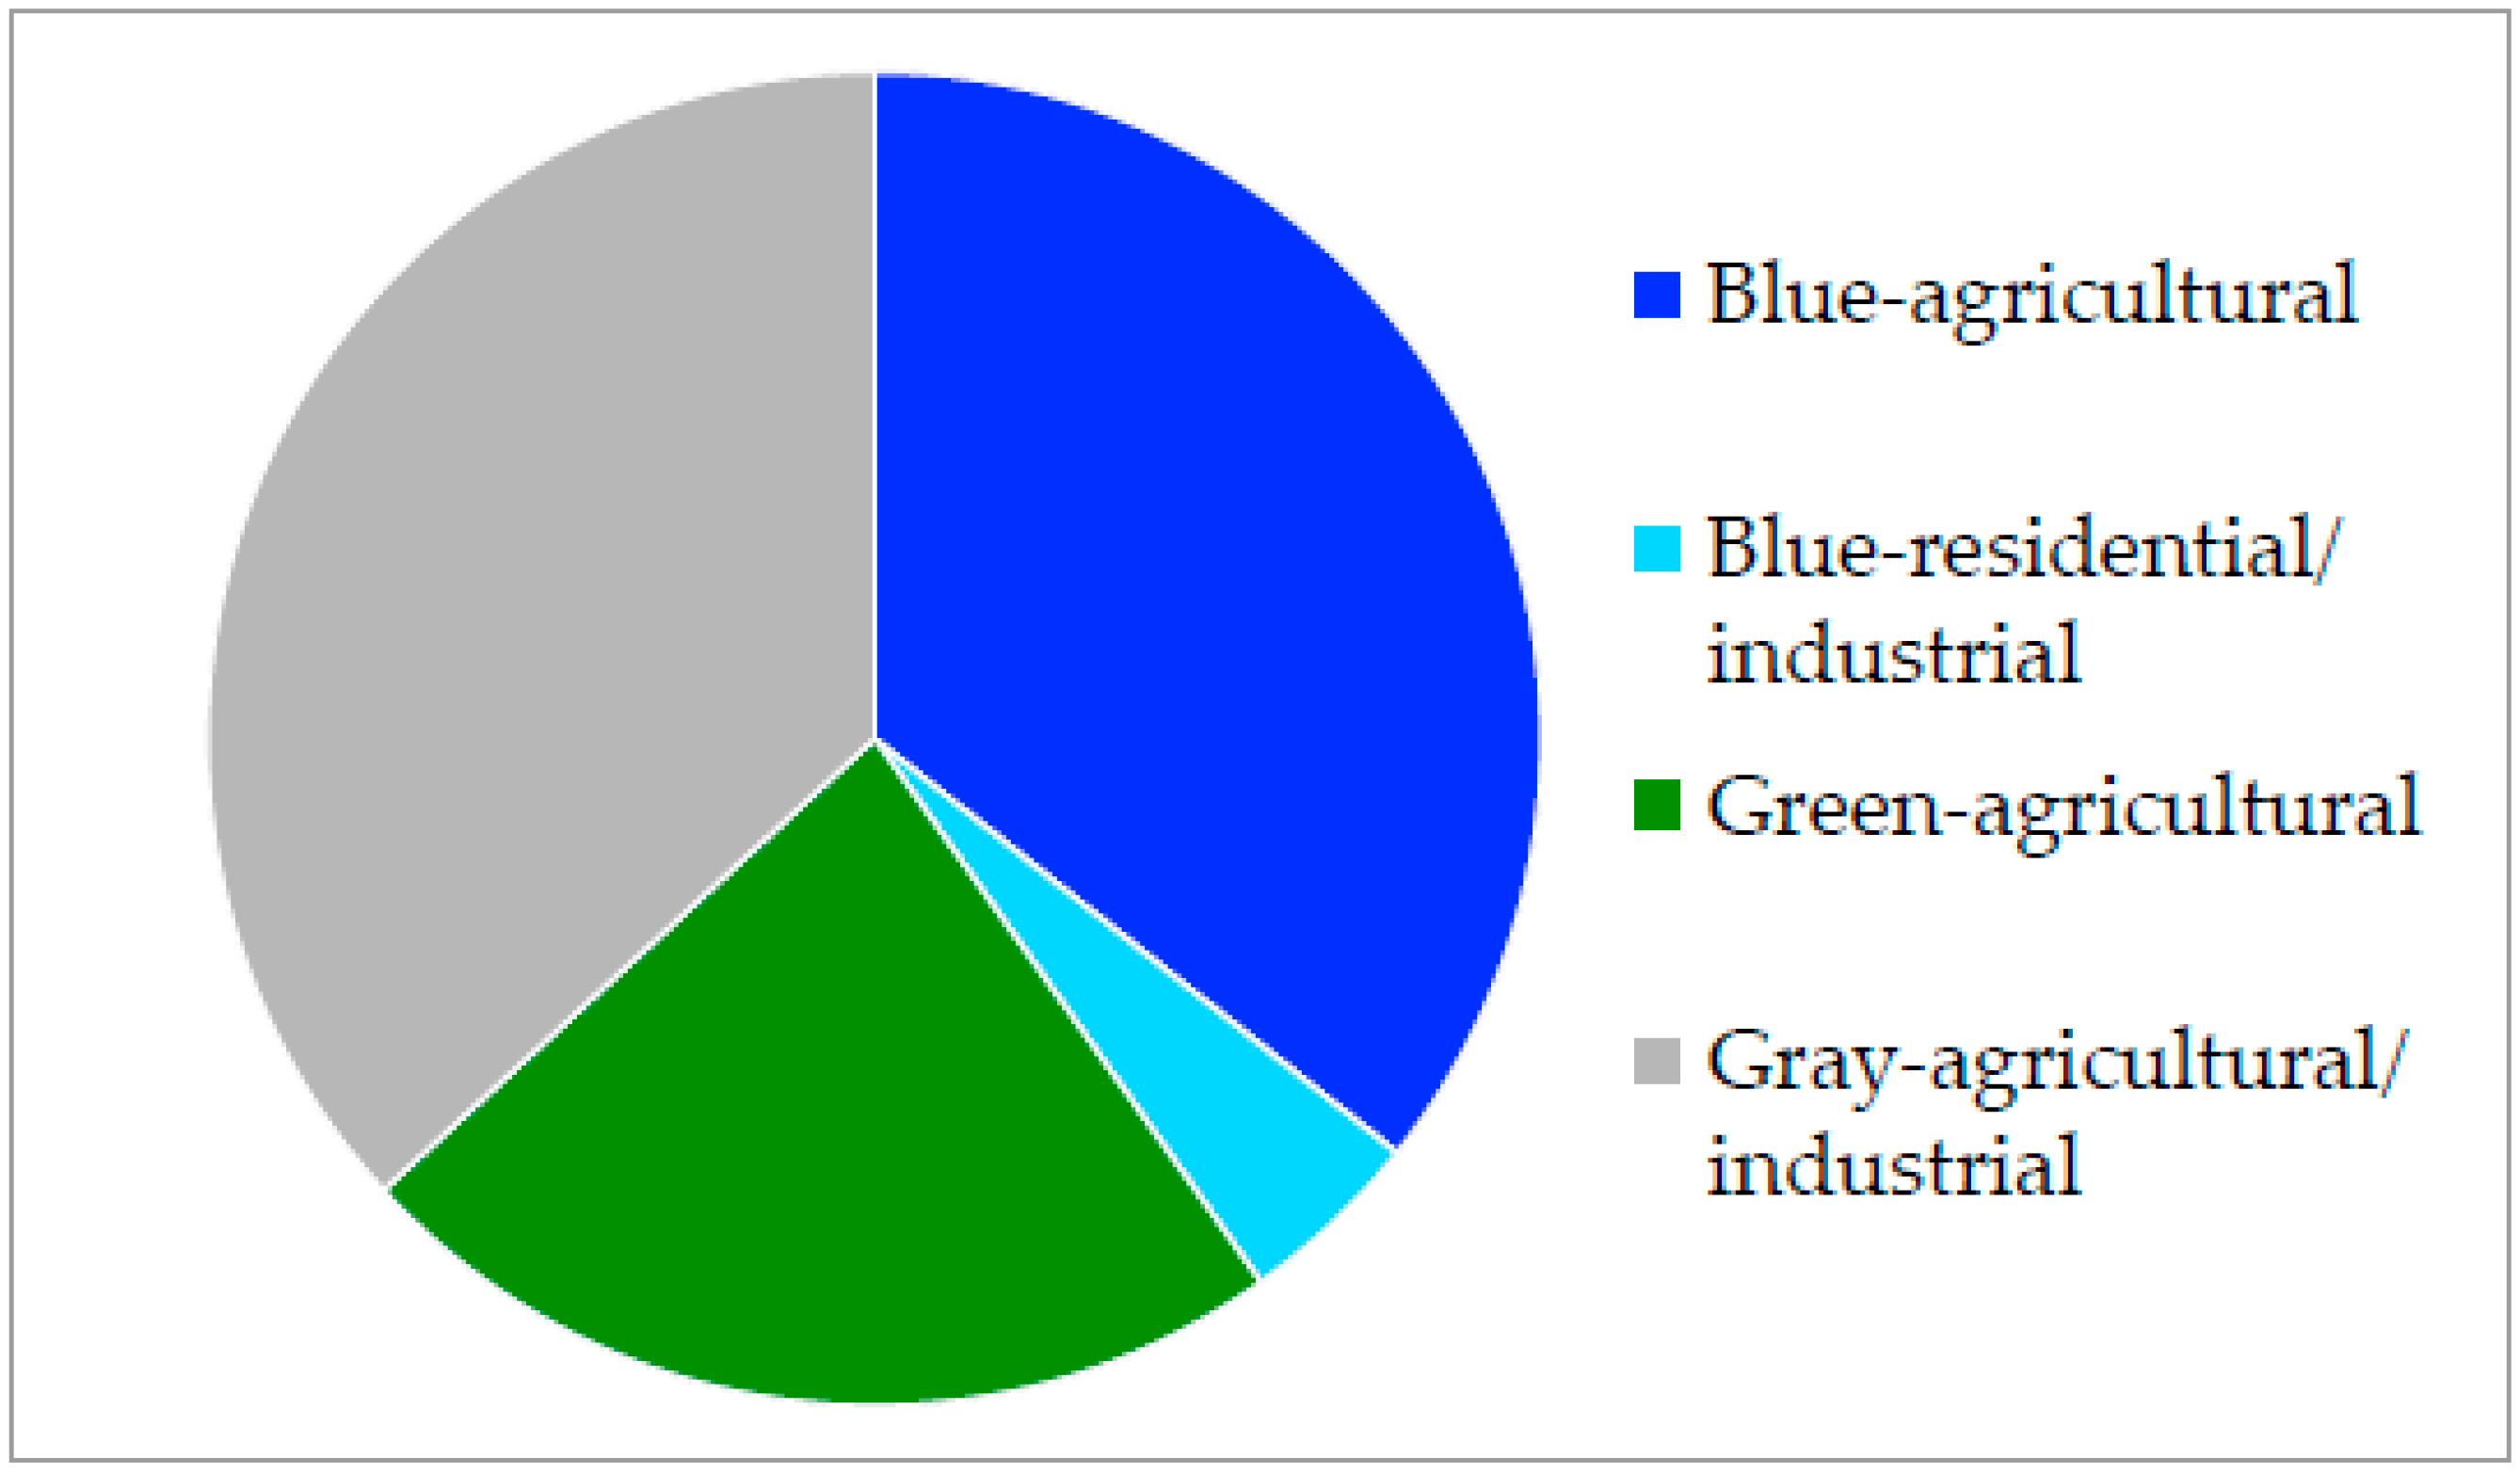
3.1. Use
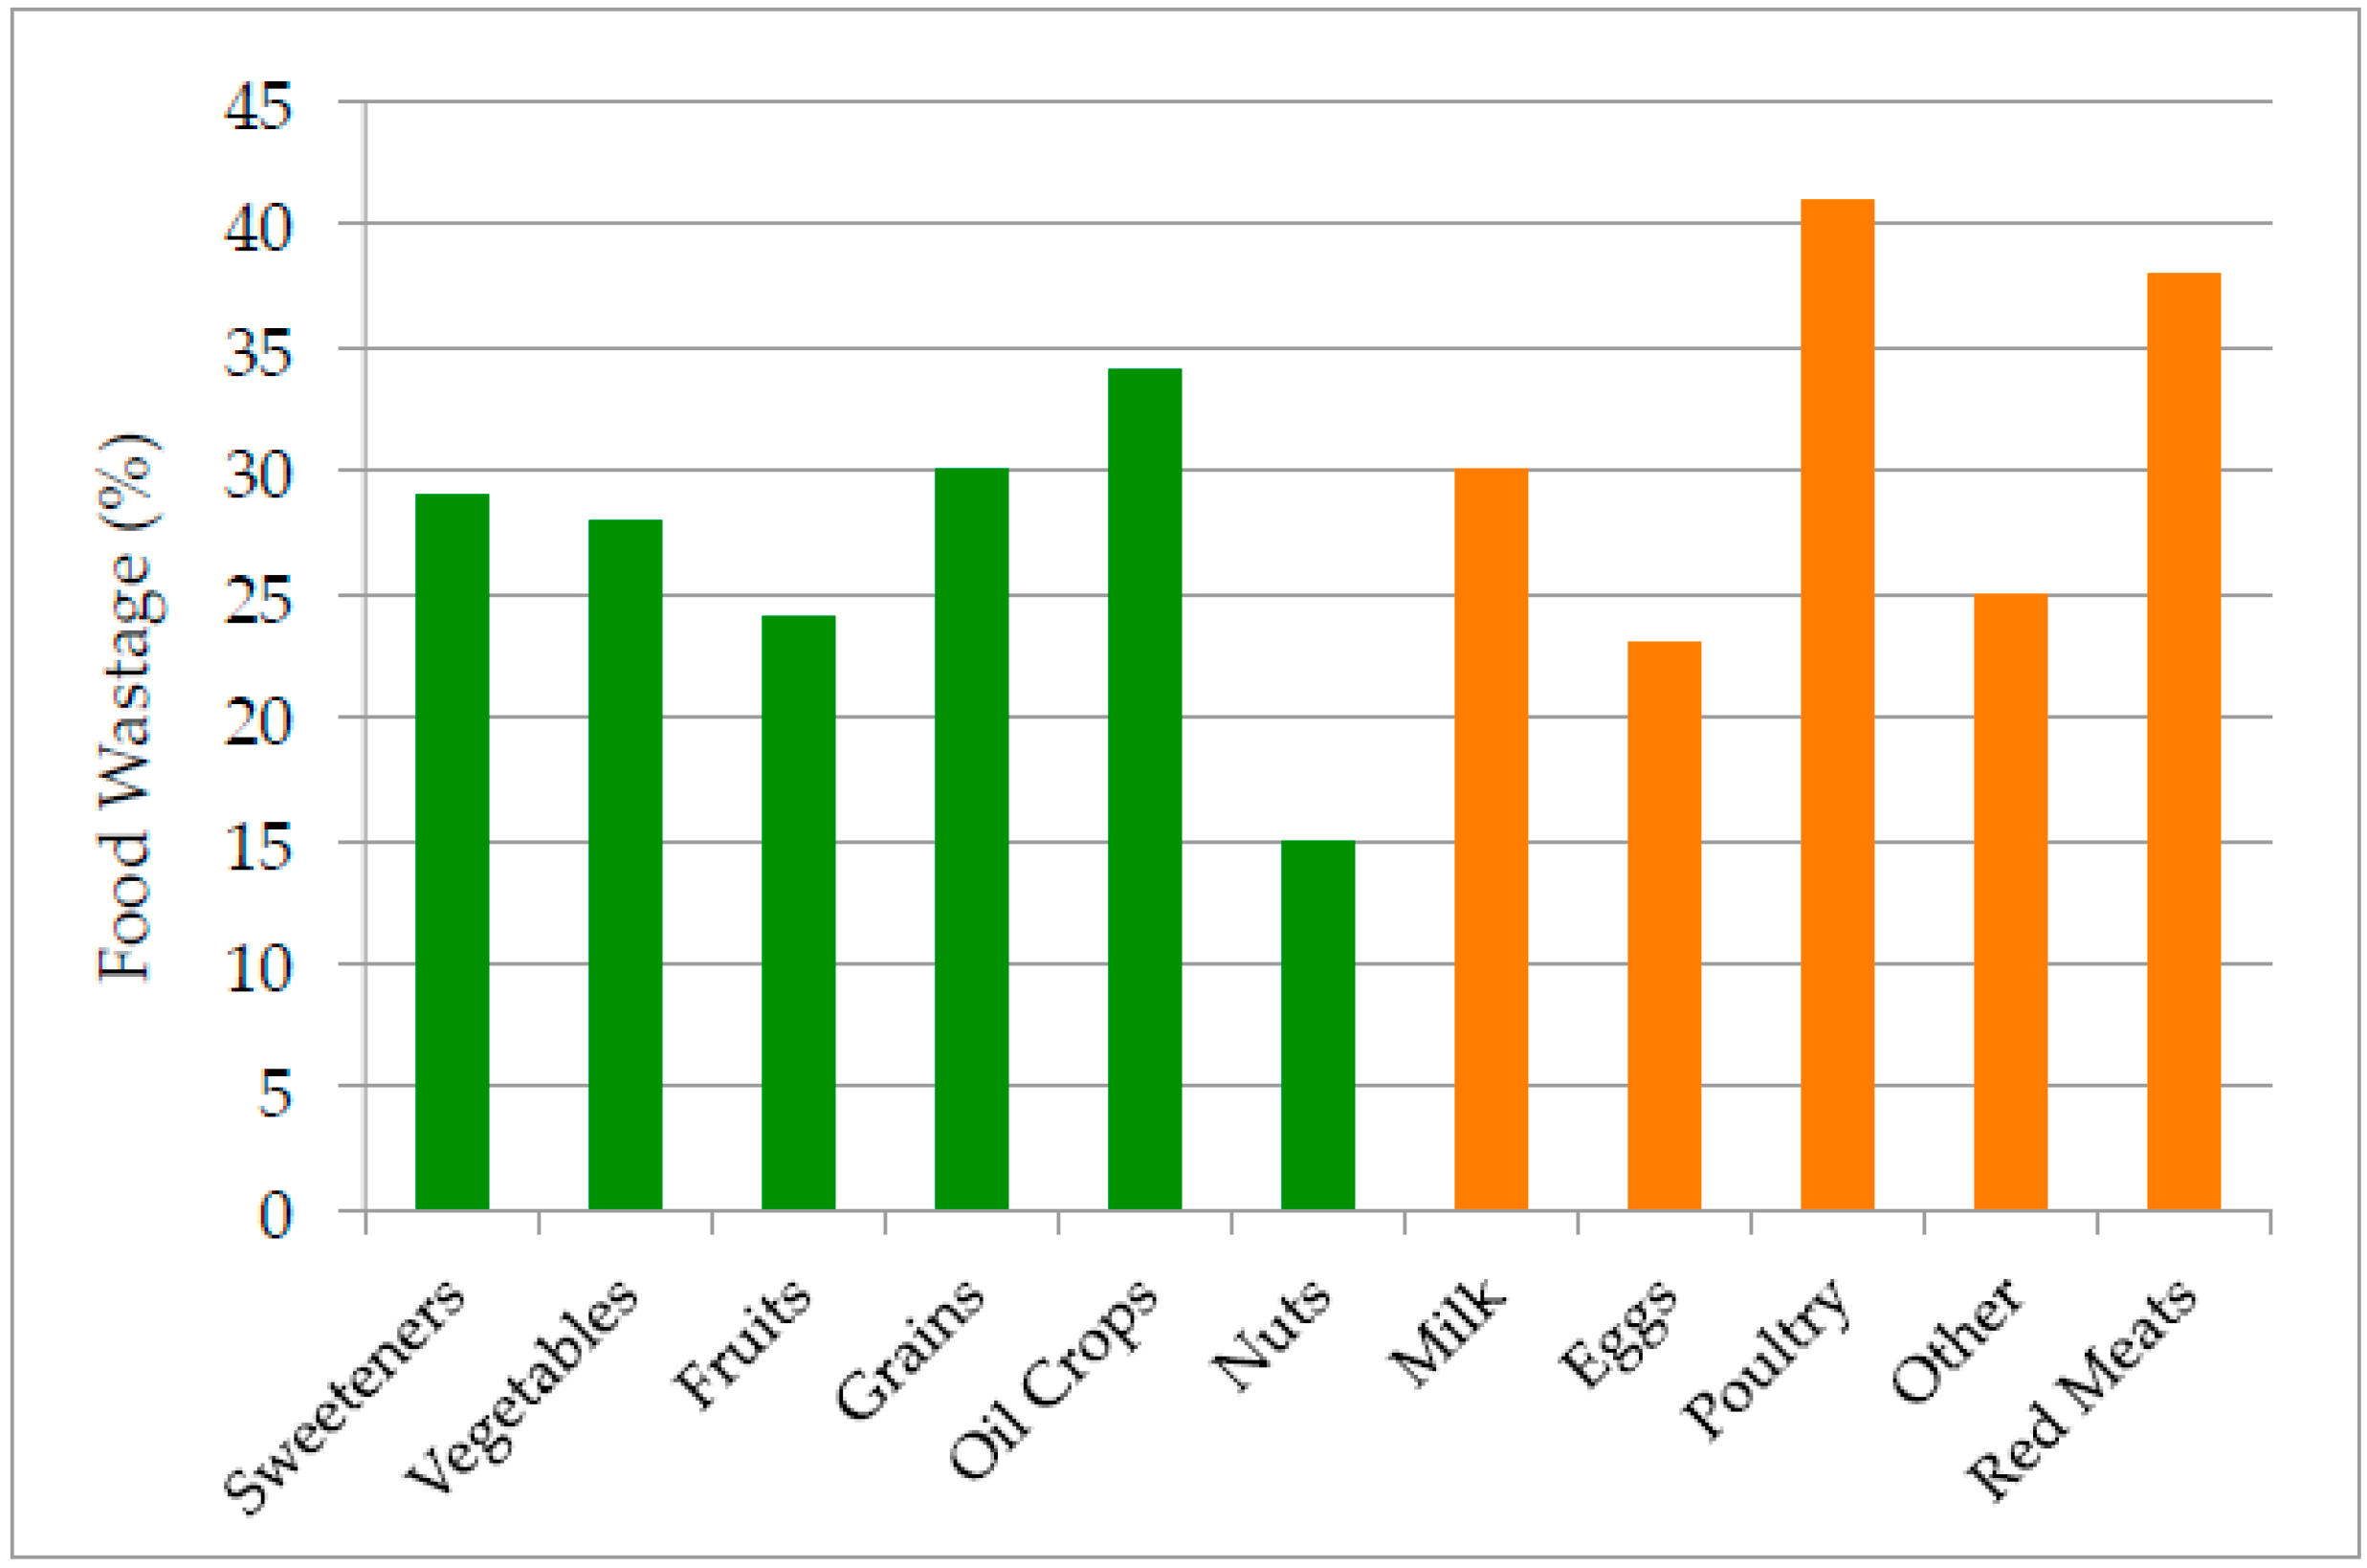
3.2. Waste
3.3. Conservation Alternatives
4. Discussion
4.1. California Comparisons
4.2. Policy Implications
Acknowledgments
Conflicts of Interest
References
- Middleton, K. Save water the delicious way. East Bay Express, 19 March 2014; Opinion page. [Google Scholar]
- World Watch Editors. Meat: Now it’s not personal! World Watch Institute Magazine, July/August 2004; 12–20. [Google Scholar]
- Weikel, M.C. What’s the water footprint of your diet? In Humanature; Conservation International: Arlington, VA, USA, 2012. [Google Scholar]
- Boyan, S. How Our Food Choices Can Help Save the Environment; EarthSave International: Chatsworth, CA, USA, 2005. [Google Scholar]
- Mekonnen, M.M.; Hoekstra, A.Y. A global assessment of the water footprint of farm animal products. Ecosystems 2012, 15, 401–415. [Google Scholar] [CrossRef]
- Renault, D.; Wallender, W.W. Nutritional water productivity and diets. Agric. Water Manag. 2000, 45, 275–296. [Google Scholar] [CrossRef]
- Jalava, M.; Kummu, M.; Porkka, M.; Sieber, S.; Varis, O. Diet change—A solution to reduce water use? Environ. Res. Lett. 2014, 9, 74016–74029. [Google Scholar] [CrossRef]
- Kang, Y.; Khan, S.; Ma, X. Climate change impact on crop yield, crop water productivity and food security—A review. Prog. Nat. Sci. 2009, 19, 1665–1674. [Google Scholar] [CrossRef]
- Attari, S.Z. Perceptions of water use. Proc. Natl. Acad. Sci. USA 2014, 111, 5129–5134. [Google Scholar] [CrossRef] [PubMed]
- Herrin, M. Is ignorance bliss when it comes to our water? In Rivers and Lakes (Web Format); The Nature Conservancy: Arlington, VA, USA, 2016. [Google Scholar]
- Sarni, W. Beyond the Energy-Water-Food Nexus: New Strategies for 21st Century Growth; Greenleaf Publ.: Shipley, UK, 2015; p. 73. [Google Scholar]
- Vanham, D.; Hoekstra, A.Y.; Bidoglio, G. Potential water saving through changes in European diets. Environ. Int. 2013, 61, 45–56. [Google Scholar] [CrossRef] [PubMed]
- Hoekstra, A.Y. The hidden water resource use behind meat and dairy. Anim. Front. 2012, 2, 3–8. [Google Scholar] [CrossRef]
- Fulton, J.; Cooley, H.; Cardenas, S.; Shilling, F. Trends and Variation in California’s Water Footprint; The Pacific Institute: Oakland, CA, USA, 2013; p. 42. [Google Scholar]
- Cohen, R.; Nelson, B.; Wolff, G. Energy down the Drain: The Hidden Costs of California’s Water Supply; The Pacific Institute and Natural Resources Defense Council: Oakland, CA, USA, 2004; p. 78. [Google Scholar]
- Fulton, J.; Cooley, H.; Gleick, P.H. California’s Water Footprint; The Pacific Institute: Oakland, CA, USA, 2012; p. 47. [Google Scholar]
- Hoekstra, A.Y. The water footprint of food. In Water for Food; Swedish Research Council for the Environment: Stockholm, Sweden, 2008; pp. 49–60. [Google Scholar]
- Hoekstra, A.Y.; Mekonnen, M.M. The water footprint of humanity. Proc. Natl. Acad. Sci. USA 2011, 109, 3232–3237. [Google Scholar] [CrossRef] [PubMed]
- Greco, F.; Antonelli, M. Not all drops are the same. In The Water We Eat: Combining Virtual Water and Water Footprints; Springer: Cham, Switzerland, 2015; pp. 3–16. [Google Scholar]
- Liu, J.; Savenije, H.H. Food consumption patterns and their effect on water requirement in China. Hydrol. Earth Syst. Sci. 2008, 12, 887–898. [Google Scholar] [CrossRef]
- U.S. Geological Survey (USGS). Water use data for California. In National Water Information System: Web Interface 2010 Data; USGS: Reston, VA, USA, 2016. [Google Scholar]
- California Energy Commission (CEC). Statistics and data on ethanol and E85 as transportation fuels. In The Energy Almanac; California Energy Commission: Sacramento, CA, USA, 2012. [Google Scholar]
- Fulton, J.; California State University, Sacramento, CA, USA. Personal communication, 2016.
- Buzby, J.C.; Hyman, J.; Stewart, H.; Wells, H.F. The value of retail- and consumer-level fruit and vegetable losses in the United States. J. Consum. Aff. 2011, 45, 492–515. [Google Scholar] [CrossRef]
- Parfitt, J.; Barthel, M.; Macnaughton, S. Food waste within food supply chains: Quantification and potential for change to 2050. Philos. Trans. R. Soc. B 2010, 365, 3065–3081. [Google Scholar] [CrossRef] [PubMed]
- Kantor, L.S.; Lipton, K.; Manchester, A.; Oliveira, V. Estimating and addressing America’s food losses. Food Rev. 1997, 20, 2–12. [Google Scholar]
- Buzby, J.C.; Wells, H.F.; Hyman, J. The Estimated Amount, Value, and Calories of Postharvest Food Losses at the Retail and Consumer Levels in the United States, EIB-121; U.S. Department of Agriculture: Washington, DC, USA, 2014; p. 33.
- Gustavsson, J.; Cederberg, C.; Sonesson, U.; Van Otterdijk, R.; Meybeck, A. Global Food Losses and Food Waste; United Nations Food and Agriculture Organization: Rome, Italy, 2011; p. 37. [Google Scholar]
- Khan, S.; Hanjra, M.A. Footprints of water and energy inputs in food production—Global perspectives. Food Policy 2009, 34, 130–140. [Google Scholar] [CrossRef]
- Gunders, D. Wasted: How America is Losing up to 40 Percent of Its Food from Farm to Fork to Landfill; Natural Resources Defense Council: Washington, DC, USA, 2012; p. 26. [Google Scholar]
- DeOreo, W.B.; Mayer, P.W.; Martien, L.; Hayden, M.; Funk, A.; Kramer-Duffield, M.; Davis, R.; Henderson, J.; Raucher, B.; Gleick, P.; et al. California Single-Family Water Use Efficiency Study; Aquacraft Inc.: Boulder, CO, USA, 2011; p. 391. [Google Scholar]
- Gleick, P.H.; Wolff, G.H.; Cushing, K.K. Waste Not, Want Not: The Potential for Urban Water Conservation in California; The Pacific Institute: Oakland, CA, USA, 2003; p. 164. [Google Scholar]
- Stevens, M.; Megerian, C.; Morin, M. Emergency 25% cut in California cities’ water use approved. The Los Angeles Times, 5 May 2015; Politics page. [Google Scholar]
- International Food Information Council Foundation (IFICF). Protein and Health Fact Sheet; International Food Information Council Foundation: Washington, DC, USA, 2011; p. 6. [Google Scholar]
- Robertson, A.; Tirado, C.; Lobstein, T.; Jermini, M.; Knai, C.; Jensen, J.H.; Ferro-Luzzi, A.; James, W.P. Food and Health in Europe: A New Basis for Action; World Health Organization: Geneva, Switzerland, 2004; p. 385. [Google Scholar]
- Walker, P.; Rhubart-Berg, P.; McKenzie, S.; Kelling, K.; Lawrence, R.S. Public health implications of meat production and consumption. Public Health Nutr. 2005, 8, 348–356. [Google Scholar] [CrossRef] [PubMed]
- Pan, A.; Sun, Q.; Bernstein, A.M.; Schulze, M.B.; Manson, J.E.; Stampfer, M.J.; Willett, W.C.; Hu, F.B. Red meat consumption and mortality. Arch. Int. Med. 2012, 172, 555–563. [Google Scholar]
- Craig, W.J.; Mangels, A.R. Position of the American Dietetic Association: Vegetarian diets. J. Am. Diet. Assoc. 2009, 109, 1266–1282. [Google Scholar] [PubMed]
- Bittman, M. Going vegan, if only for a day. The New York Times, 17 September 2013; Dining & Wine page. [Google Scholar]
- Rigg, A. The Meat Free Monday Cook Book; Kyle Books Limited: London, UK, 2011; p. 240. [Google Scholar]
- Chico, D.; Garrido, A. Overview of the extended water footprint in Spain: The importance of agricultural water consumption in the Spanish economy. In Water, Agriculture and the Environment in Spain; CRC Press/Balkema: Leiden, The Netherlands, 2013; pp. 75–85. [Google Scholar]
- Mekonnen, M.M.; Hoekstra, A.Y. National Water Footprint Accounts: The Green, Blue and Grey Water Footprint Production and Consumption; UNESCO-IHE Institute for Water Education: Delft, The Netherlands, 2011; Volume 2, p. 44. [Google Scholar]
- Capone, R.; Debs, P.; El Bilali, H.; Cardone, G.; Lamaddalena, N. Water footprint in the Mediterranean food chain: Implications of food consumption patterns and food wastage. Int. J. Nutr. Food Sci. 2014, 3, 26–36. [Google Scholar] [CrossRef]
- Loria, K. Here’s how eating habits vary around America. Business Insider, 9 April 2014; 3. [Google Scholar]
- Lazo, A.; Carlton, J. California’s plan to conserve water meets resistance. The Wall Street Journal, 16 April 2015; U.S. News page. [Google Scholar]
- Bruhn, C.M.; Wong, D.; Schutz, H.G. Californian’s eating habits differ from their dietary attitudes. Calif. Agric. 1996, 50, 22–26. [Google Scholar] [CrossRef]
- Weber, E. Experience-based and description-based perceptions of long-term risk: Why global warming does not scare us (yet). Clim. Chang. 2006, 77, 103–120. [Google Scholar] [CrossRef]
- Reisch, L. The role of sustainable consumption in fostering a fundamental transformation of agriculture. In Trade and Environment Review 2013, Proceedings of the United Nations Conference on Trade and Development, Geneva, Switzerland, 16–27 September 2013; pp. 95–101.
- Heid, M. Experts say lobbying skewed the U.S. dietary guidelines. Time Magazine, 8 January 2016; Health page. [Google Scholar]
- Ralston, K. How government policies and regulations can affect dietary choices. In America’s Eating Habits: Changes and Consequences-Bull; No. 750; U.S. Department of Agriculture: Washington, DC, USA, 1999; Chapter 17. [Google Scholar]
- Idel, A. Livestock production and food security in a context of climate change and environmental and health challenges. In Trade and Environment Review 2013, Proceedings of the United Nations Conference on Trade and Development, Geneva, Switzerland, 16–27 September 2013; pp. 138–153.
- World Health Organization (WHO). Antimicrobial Resistance Summary; World Health Organization: Geneva, Switzerland, 2014; p. 263. [Google Scholar]
- Marrin, D.L. Reducing water and energy footprints via dietary changes among consumers. Int. J. Nutr. Food Sci. 2014, 3, 361–369. [Google Scholar] [CrossRef]
- Gordinier, J. Making vegan a new normal. The New York Times, 24 September 2012; Dining page. [Google Scholar]


| Food Type | Water per kg (L) | Blue-to-Green Water Ratio | Blue-to-Gray Water Ratio | Water per Calorie (L) |
|---|---|---|---|---|
| Sugar Crops | 200 | 0.40 | 3.5 | 0.69 |
| Vegetables/Roots * | 350 | 0.14 | 0.44 | 0.91 |
| Fruits | 960 | 0.20 | 1.7 | 2.1 |
| Cereals (Grains) | 1600 | 0.19 | 1.2 | 0.51 |
| Oil Crops | 2400 | 0.11 | 1.8 | 0.81 |
| Pulses (Legumes) | 4100 | 0.04 | 0.19 | 1.2 |
| Nuts | 9100 | 0.19 | 2.0 | 3.6 |
| Milk | 1000 | 0.10 | 1.2 | 1.8 |
| Eggs | 3300 | 0.09 | 0.57 | 9.7 |
| Chicken (Poultry) | 4300 | 0.09 | 0.67 | 28 |
| Butter | 5600 | 0.10 | 1.2 | 0.72 |
| Pork | 6000 | 0.09 | 0.74 | 2.2 |
| Sheep/Goat | 8800 | 0.06 | 8.6 | 4.3 |
| Beef | 15,000 | 0.04 | 1.2 | 10 |
| Water Use Categories | Local Blue Water (Total) | Animal-Based Foods and Feed Crops ^ | Plant-Based Foods | Other Plant Products * | Resident’s Direct Water Use | Commercial and Industrial Use/Products |
|---|---|---|---|---|---|---|
| Produced | 29.7 | 11.5 (39%) | 13.7 (46%) | 1.2 (4%) | 2.2 (7%) | 1.1 (4%) |
| Exported | 16.4 | 4.5 (27%) | 10.6 (65%) | 1.2 (7%) | 0 (0%) | 0.1 (<1%) |
| Consumed | 13.3 | 7.0 (53%) | 3.1 (23%) | 0 (0%) | 2.2 (16.5%) | 1.0 (7.5%) |
© 2016 by the author; licensee MDPI, Basel, Switzerland. This article is an open access article distributed under the terms and conditions of the Creative Commons Attribution (CC-BY) license (http://creativecommons.org/licenses/by/4.0/).
Share and Cite
Marrin, D.L. Using Water Footprints to Identify Alternatives for Conserving Local Water Resources in California. Water 2016, 8, 497. https://doi.org/10.3390/w8110497
Marrin DL. Using Water Footprints to Identify Alternatives for Conserving Local Water Resources in California. Water. 2016; 8(11):497. https://doi.org/10.3390/w8110497
Chicago/Turabian StyleMarrin, D. L. 2016. "Using Water Footprints to Identify Alternatives for Conserving Local Water Resources in California" Water 8, no. 11: 497. https://doi.org/10.3390/w8110497