The authors would like to correct the published article [
1], following the detection of editorial mistakes by the main author, as explained below.
Table 3 has been replaced with a new Table to show the streamflow simulation results for Mpanga Catchment. A missing table has been inserted as
Table 5, showing the streamflow simulation results for Kiburubutu Catchment. The table previously labeled and referenced as
Table 5 should now be considered as
Table 6. All sentences that were referenced to
Table 5 refer to the new
Table 5, except for the sentence “Simulations based on QM bias corrected GPD products performances were in general worse compared to their non-bias corrected counterparts (
Table 5)”, which refers to
Table 6.
Table 3,
Table 5, and
Table 6 should read:
Table 3.
Performance scores for MC discharge simulations. Performance is shown as Reff,log, R2, Ve, and RMSE values for each bias correction technique considered.
Table 5.
Performance scores for KC discharge simulations. Performance is shown as Reff,log, R2, Volume Error (Vol. Err.), and RMSE values for each bias correction technique considered.
Table 6.
Performance scores for KC discharge simulations. Performance is shown as Reff,log values for each bias correction technique considered.
The authors apologize for any inconvenience this has caused to the readers. The changes do not affect the scientific results of this paper. The manuscript will be updated, and the original version will remain online on the article webpage, with a reference to this Correction.
Reference
- Koutsouris, A.J.; Seibert, J.; Lyon, S.W. Utilization of Global Precipitation Datasets in Data Limited Regions: A Case Study of Kilombero Valley, Tanzania. Atmosphere. 2017, 8, 246. [Google Scholar] [CrossRef]
Table 3.
Performance scores for MC discharge simulations. Performance is shown as Reff,log, R2, Ve, and RMSE values for each bias correction technique considered.
| Mpanga Catchment |
|---|
| GDP | | | Reff,log | R2 | Ve | RMSE | | | Reff,log | R2 | Ve | RMSE |
|---|
| CFSR | Non- | bias corrected | 0.33 | 0.23 | 0.96 | 0.28 | ModB | bias corrected | 0.43 | 0.40 | 1.00 | 0.26 |
| ERAi | 0.53 | 0.48 | 0.96 | 0.23 | 0.53 | 0.50 | 0.96 | 0.23 |
| MERRA | 0.38 | 0.44 | 0.94 | 0.29 | 0.61 | 0.58 | 0.99 | 0.22 |
| CMORPH | 0.41 | 0.32 | 0.95 | 0.27 | 0.41 | 0.33 | 0.95 | 0.27 |
| TRMMv7 | 0.45 | 0.36 | 1.00 | 0.27 | 0.51 | 0.42 | 0.99 | 0.24 |
| Ensemble | 0.55 | 0.49 | 0.97 | 0.23 | 0.56 | 0.53 | 0.99 | 0.23 |
| Rain gauge | 0.12 | 0.14 | 0.94 | 0.36 | 0.47 | 0.34 | 0.97 | 0.25 |
| CRU * | 0.27 | 0.17 | 0.98 | 0.30 | 0.30 | 0.20 | 0.96 | 0.29 |
| GPCC * | 0.29 | 0.23 | 0.99 | 0.30 | 0.32 | 0.24 | 0.97 | 0.29 |
| UDEL * | 0.35 | 0.25 | 0.99 | 0.28 | 0.45 | 0.37 | 0.99 | 0.25 |
| CFSR | QM | bias corrected | 0.22 | 0.18 | 0.96 | 0.33 | QM + ModB | bias corrected | 0.53 | 0.40 | 0.98 | 0.23 |
| ERAi | 0.18 | 0.16 | 0.91 | 0.35 | 0.54 | 0.41 | 0.98 | 0.23 |
| MERRA | 0.05 | 0.08 | 1.00 | 0.33 | 0.52 | 0.45 | 0.98 | 0.23 |
| CMORPH | 0.35 | 0.22 | 1.00 | 0.28 | 0.51 | 0.40 | 0.98 | 0.23 |
| TRMMv7 | 0.19 | 0.15 | 0.91 | 0.35 | 0.51 | 0.42 | 0.98 | 0.24 |
| Ensemble | 0.19 | 0.16 | 0.91 | 0.35 | 0.50 | 0.36 | 0.98 | 0.24 |
| GPCC * | DP | bias corrected | 0.34 | 0.19 | 0.99 | 0.29 | DP + ModB | bias corrected | 0.37 | 0.23 | 0.97 | 0.28 |
| CRU * | 0.36 | 0.24 | 0.97 | 0.28 | 0.38 | 0.27 | 0.95 | 0.28 |
| UDEL * | 0.46 | 0.32 | 0.96 | 0.27 | 0.52 | 0.44 | 1.00 | 0.24 |
Table 5.
Performance scores for KC discharge simulations. Performance is shown as Reff,log, R2, Volume Error (Vol. Err.), and RMSE values for each bias correction technique considered.
| Kiburubutu Catchment |
|---|
| GDP | | | Reff,log | R2 | Vol. Err. | RMSE | | | Reff,log | R2 | Vol. Err. | RMSE |
|---|
| CFSR | Non- | bias corrected | 0.38 | 0.01 | 0.78 | 0.26 | ModB | bias corrected | 0.41 | 0.01 | 0.74 | 0.25 |
| ERAi | 0.63 | 0.26 | 0.78 | 0.18 | 0.66 | 0.24 | 0.73 | 0.18 |
| MERRA | 0.47 | 0.25 | 0.86 | 0.20 | 0.68 | 0.24 | 0.72 | 0.18 |
| CMORPH | 0.56 | 0.08 | 0.79 | 0.23 | 0.62 | 0.10 | 0.68 | 0.20 |
| TRMMv7 | 0.55 | 0.07 | 0.87 | 0.23 | 0.59 | 0.11 | 0.70 | 0.20 |
| Ensemble | 0.63 | 0.19 | 0.80 | 0.19 | 0.67 | 0.22 | 0.73 | 0.19 |
| Rain gauge | 0.52 | 0.25 | 0.96 | 0.23 | 0.59 | 0.21 | 0.78 | 0.20 |
| CRU * | 0.42 | 0.09 | 0.97 | 0.29 | 0.57 | 0.12 | 0.70 | 0.21 |
| GPCC * | 0.38 | 0.14 | 0.79 | 0.24 | 0.59 | 0.14 | 0.69 | 0.21 |
| UDEL * | 0.47 | 0.12 | 0.86 | 0.23 | 0.64 | 0.16 | 0.71 | 0.19 |
| CFSR | QM | bias corrected | 0.41 | 0.07 | 0.92 | 0.27 | QM + ModB | bias corrected | 0.53 | 0.12 | 0.71 | 0.20 |
| ERAi | 0.49 | 0.14 | 0.91 | 0.27 | 0.59 | 0.20 | 0.79 | 0.20 |
| MERRA | 0.40 | 0.07 | 0.96 | 0.29 | 0.53 | 0.12 | 0.75 | 0.21 |
| CMORPH | 0.44 | 0.05 | 0.92 | 0.27 | 0.51 | 0.08 | 0.74 | 0.22 |
| TRMMv7 | 0.45 | 0.04 | 0.98 | 0.29 | 0.52 | 0.04 | 0.77 | 0.23 |
| Ensemble | 0.48 | 0.07 | 0.91 | 0.29 | 0.56 | 0.06 | 0.83 | 0.23 |
| GPCC * | DP | bias corrected | 0.51 | 0.20 | 0.96 | 0.24 | DP + ModB | bias corrected | 0.59 | 0.12 | 0.82 | 0.22 |
| CRU * | 0.51 | 0.13 | 0.99 | 0.26 | 0.57 | 0.18 | 0.83 | 0.21 |
| UDEL * | 0.56 | 0.24 | 0.99 | 0.23 | 0.63 | 0.23 | 0.82 | 0.19 |
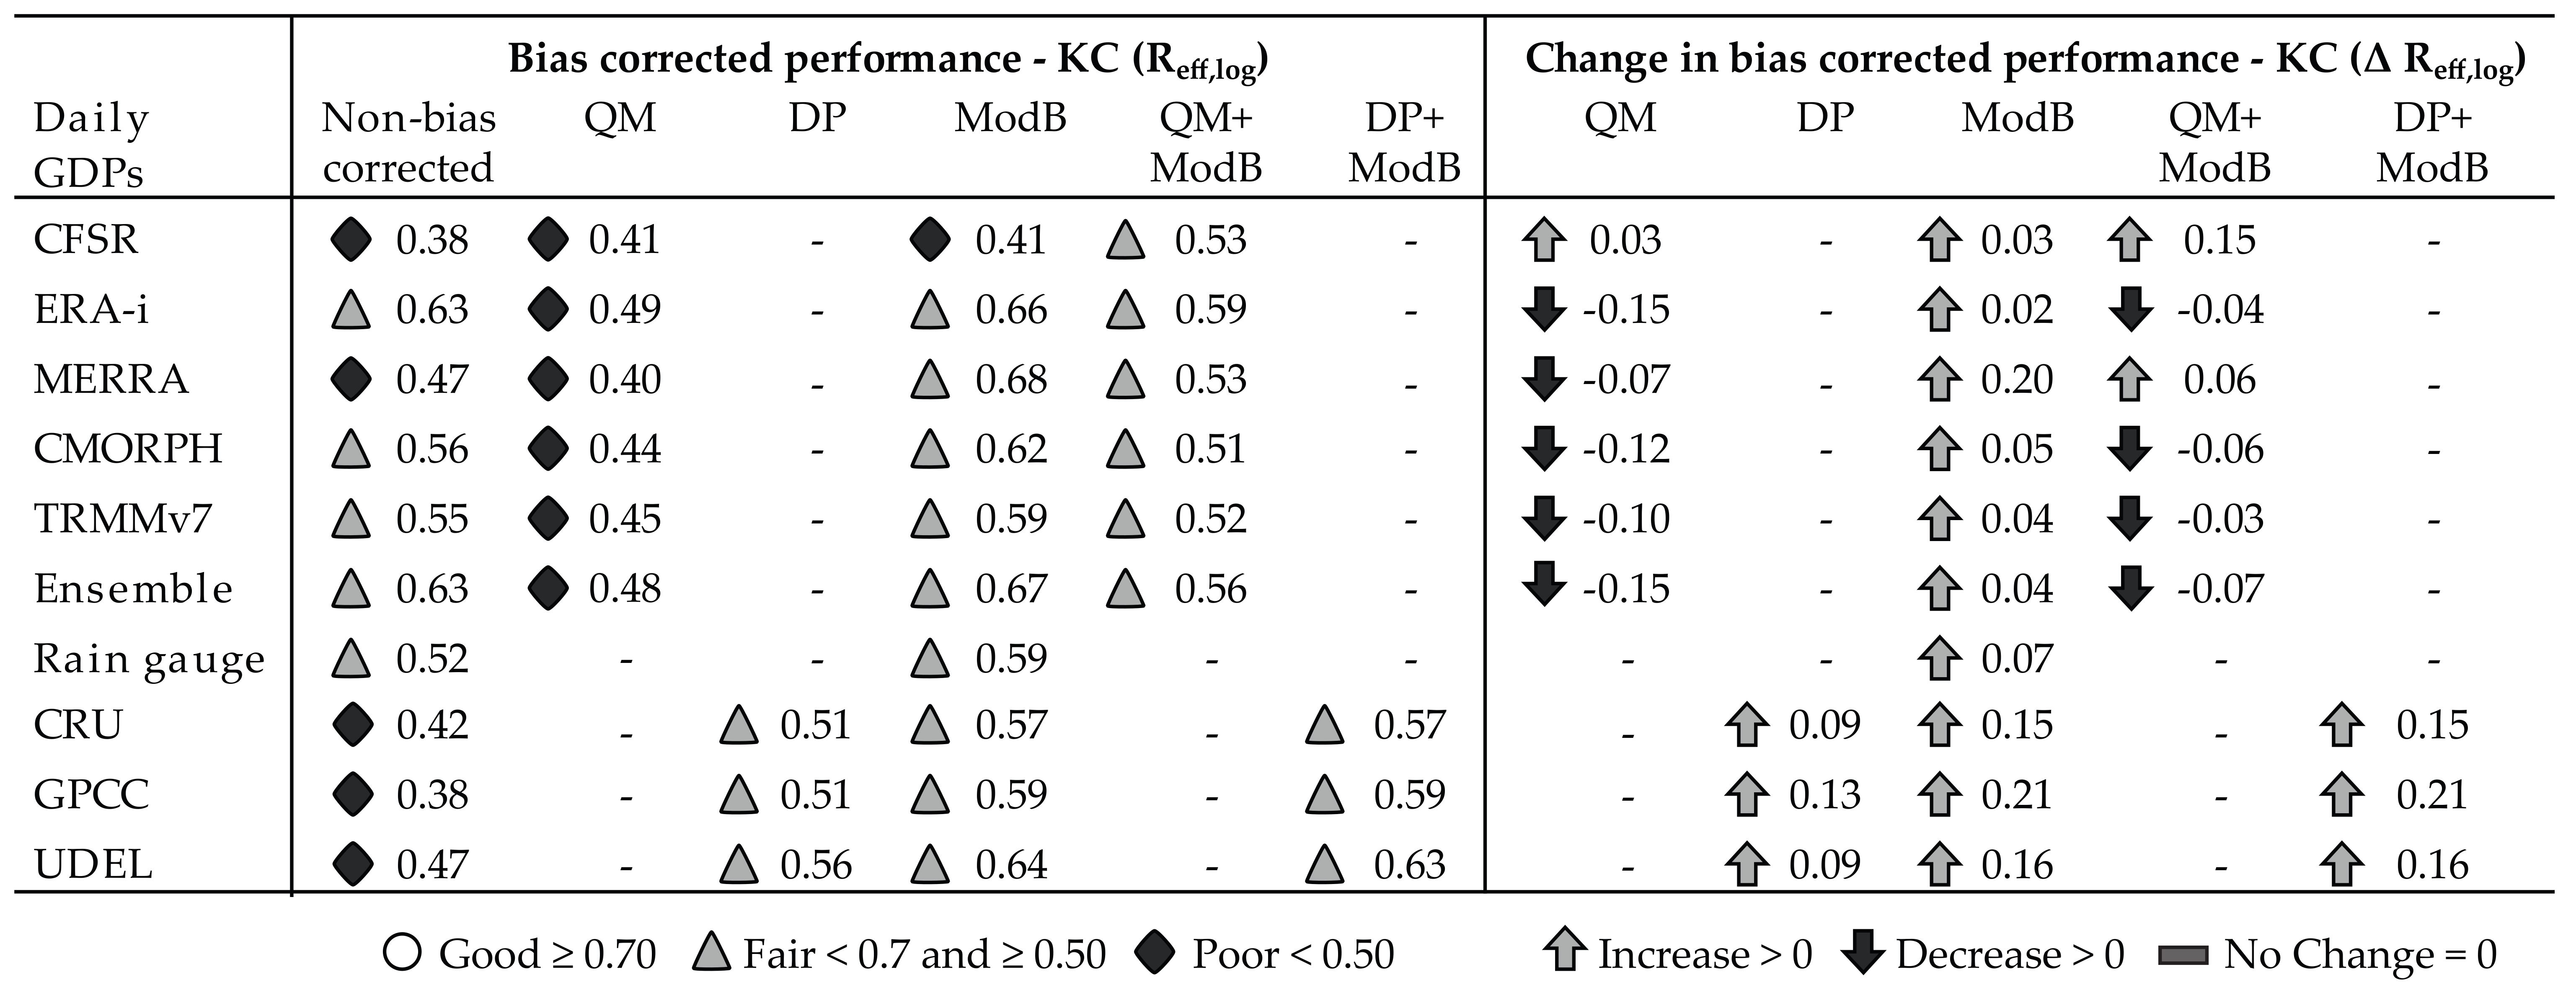
Table 6.
Performance scores for KC discharge simulations. Performance is shown as Reff,log values for each bias correction technique considered.
© 2018 by the authors. Licensee MDPI, Basel, Switzerland. This article is an open access article distributed under the terms and conditions of the Creative Commons Attribution (CC BY) license (http://creativecommons.org/licenses/by/4.0/).