Emission of Air Pollutants from Rice Residue Open Burning in Thailand, 2018
by
 ,
,
Agapol Junpen
1,2 ,
,
Jirataya Pansuk
3,*, 
Orachorn Kamnoet
1, 
Penwadee Cheewaphongphan
4 and
Savitri Garivait
1,2 1
The Joint Graduate School of Energy and Environment (JGSEE), King Mongkut’s University of Technology Thonburi (KMUTT), Bangkok 10140, Thailand
2
Center of Excellence on Energy Technology and Environment (CEE–PERDO), Ministry of Education, Bangkok 10140, Thailand
3
Faculty of Environment and Resource Studies, Mahidol University, Phutthamonthon, Nakhon Pathom 73170, Thailand
4
National Institute for Environmental Studies (NIES), 16–2 Onogawa, Tsukuba, Ibaraki 305-8506, Japan
*
Author to whom correspondence should be addressed.
Atmosphere 2018, 9(11), 449; https://doi.org/10.3390/atmos9110449
Submission received: 30 August 2018
/
Revised: 19 October 2018
/
Accepted: 12 November 2018
/
Published: 15 November 2018
(This article belongs to the Special Issue Air Quality in the Asia-Pacific Region)
Abstract
:Crop residue burning negatively impacts both the environment and human health, whether in the aspect of air pollution, regional and global climate change, or transboundary air pollution. Accordingly, this study aims to assess the level of air pollutant emissions caused by the rice residue open burning activities in 2018, by analyzing the remote sensing information and country specific data. This research also aims to analyze the trend of particulate matter 10 microns or less in diameter (PM10) concentration air quality sites in provinces with large paddy rice planting areas from 2010–2017. According to the results, 61.87 megaton (Mt) of rice residue were generated, comprising 21.35 Mt generated from the irrigated fields and 40.53 Mt generated from the rain-fed field. Only 23.0% of the total rice residue generated were subject to open burning—of which nearly 32% were actually burned in the fields. The emissions from such rice residue burning consisted of: 5.34 ± 2.33 megaton (Mt) of CO2, 44 ± 14 kiloton (kt) of CH4, 422 ± 179 kt of CO, 2 ± 2 kt of NOX, 2 ± 2 kt of SO2, 38 ± 22 kt of PM2.5, 43 ± 29 kt of PM10, 2 ± 1 kt of black carbon (BC), and 14 ± 5 kt of organic carbon (OC). According to the air quality trends, the results shows the higher level of PM10 concentration was due to the agricultural burning activities, as reflected in the higher monthly averages of the months with the agricultural burning, by around 1.9–2.1 times. The result also shows the effect of government’s policy for farmers on the crop burning activities and air quality trends.
1. Introduction
Thailand is an agricultural country with rice as the main economic crop that is planted spatially across the country, as illustrated in Figure A1a. Rice plantation covers a total area of approximately 9.73 million hectares (Mha), 15.1% of which are located in the central region, 60.9% in the northeastern region, 22.6% in the northern region, and 1.4% in the southern region [1]. The central region has the highest frequency of rice plantation at the rate of 2–3 rounds per year, as well as the highest yield due to the relatively high abundance of water resource and soil nutrients when compared to other regions [2]. The characteristics of rice cultivation are typical in the region where broadcasting plantation and machinery harvesting are widely used to reduce the cultivation time [3]. The major crop (in-season rice) is grown from May to October, except in the six southern provinces where the growing season is from mid-June to February of next year. The off-season rice typically grown in the dry season from November to April, and from March to mid-June in the southern provinces. The majority of off-season rice are produced in the central region, which is equipped with an irrigation system that is specifically designed for rice production [4]. According to the 2017 Agricultural Statistics of Thailand derived from the Office of Agricultural Economics (OAE) [5], the total rice production in Thailand in 2017 was 31.95 million tons (Mt), comprising 24.07 Mt of in-season rice products and 6.62 Mt of off-season rice products. The trends of planted area and rice production from in-season rice and off-season rice plantation in Thailand during 2010–2017, as shown in Table A1.
Concerning the fact that there is a very short period between harvesting and cultivation of rice or crop rotation, particularly in the central and lower northern regions of Thailand, rice residue burning is therefore a common residue management practice amongst Thai farmers. Many farmers believe that residue burning has beneficial effects on the yields and primarily adopt such practice in order to remove waste residue, control weeds, and release nutrients for the next crop cycle [6,7,8]. Nonetheless, agricultural residue burning has negative impacts on the environment, specifically air pollution and climate change. The incomplete combustion of biomass produces BC, which is the second largest contributor to global warming after carbon dioxide [9,10]. Furthermore, the emissions of BC and other types of aerosols also give rise to atmospheric brown clouds in Southeast Asia [11,12,13], especially in northern peninsular Southeast Asia [14,15,16,17]. In general, atmospheric brown clouds and their interactions with greenhouse gases can significantly affect the climate, hydrological cycle, glaciers, agriculture, and human health [16,18,19]. Indeed, rice straw burning is an important source of aerosol particles, such as coarse particles (PM10, aerodynamic diameters ≤ 10 microns (μm)) and fine particles (PM2.5, aerodynamic diameters ≤ 2.5 μm) [20].
According to the Pollution Control Department (PCD)–the authority in charge of air quality assessment in Thailand, in 2017 [21], the PM10 concentration was in the range of 3–268 micrograms per cubic meter (µg/m3), on average, for the 24 h period (daily standard 120 µg/m3) and 20–103 µg/m3 for the annual period, which brings the nationwide average to 41 µg/m3 (average standard 50 µg/m3). Since 2012, the PM10 level in all areas across Thailand has been on a declining trend. In addition, the PM2.5 concentration is reported to be in the range of 2–166 µg/m3, on average, for the 24 h period (daily standard 50 µg/m3) and in the range of 9–36 µg/m3, for annual average which brings the nationwide average to 22 µg/m3 (average standard 25 µg/m3). Furthermore, it is reported that in Chiang Mai, a province situated in the northern region of Thailand where during summer, a large number of biomass open burning activities could be found, that the number of days which the level of PM2.5 concentration exceeded the daily standard was reduced by 57 days to 29 days, compared to that in 2016. In 2017, the PM2.5 annual average was 30 µg/m3.
With respect to the foregoing environmental and health effects of rice straw burning, open-field straw burning is strictly regulated in Thailand and has been banned in some regions. In 2002, the Association of Southeast Asian Nations (ASEAN) Agreement on Transboundary Haze Pollution [22], a legally binding environmental agreement, was signed by the member states of the Association of Southeast Asian nations to reduce haze pollution in Southeast Asia. Accordingly, in 2012, the government of Thailand prescribed the Pollution Management Plan 2012–2016 [23] to serve as a guideline for open burning and to promote alternative methods of agricultural residue management. The Pollution Control Department (PCD) will be responsible for implementing this environmental quality management plan in collaboration with the local administrative organizations. Moreover, the government also provides subsidies to farmers in order to encourage the adoption of soil equipment and farming technology, with the aim to reduce crop residue burning. Similarly, the Department of Alternative Energy Development and Efficiency (DEDE) has implemented the renewable energy plan to promote the use of agricultural residues as a raw material for heat and electricity production [24].
On the contrary, during 2011–2014, the government had been implementing “the Rice Pledging Scheme” to provide subsidies for the rice farmers [25]. Under this scheme, the government pledged to purchase rice both in-season and off-season, at 15,000 baht per tonnage—double the market price at the time before the start of the program. Consequently, a large number of farmers had joined the program and the off-season rice output increased from 8.86 million tonnages in 2010 to 10.14 million tonnages and 12.22 million tonnages in 2011 and 2012, respectively [5]. After the end of the program in 2015–2017, the government had the policy to reduce the off-season rice planted area, and in turn, promote production of other crops by offering a subsidy of 12,500 baht per hectare to the farmers. This resulted in a staggering 40% drop of the rice price, in comparison with 2014 [26]. It is observable that the government’s measure implementation for farmers affects the rice growing area, rice residue amount, rice residue management, all of which cast direct impact on air quality in each region, especially the particulate matters which is one of many pollutants that contribute to reduced air quality. This research, therefore is carried out with the aim to analyze the trend of PM10 concentration air quality, based on the remote sensing information and air quality data collected from air quality monitoring stations in area with large rice production from 2010–2017. In addition, this research also aims to assess the level of air pollutant emissions (CO2, CH4, CO, NOX, SO2, PM2.5, PM10, BC, and OC) caused by the open-space rice straw burning activities in 2018, by analyzing the remote sensing information and country specific data, in order to present a result as accurate as possible.
2. Materials and Methods
2.1. Assessment of Emissions from Rice Residue Open Burning
The emissions from biomass open burning can be estimated using the equation developed by Seiler, W. and Crutzen, P. J. (1980) [27], which represents the relationship between the combustion process and its emission, as follows:
where Ei is the emission of the air pollutant i (kt); M is the mass of dry matter burned (t of dry matter); and EFi the emission factor of the air pollutant i (g/kg of dry matter burned).
The amount of biomass burned is determined using the modified version of the equation provided in the Revised 1996 Intergovernmental Panel on Climate Change (IPCC) Guidelines for National Greenhouse Gas Inventories [28] which was also used in the studies of Streets D. G. et al. (2003) [29], Gadde B. et al. (2009) [8], Cheewaphongphan, P. and Garivait, S. (2013) [2], and Kim Oanh, N. T. et al. (2018) [30], etc. The equation can be expressed as follows:
where RRB is the quantity of rice residue subject to open field burning (t of dry matter); and α is the fraction of the mass combusted by fire, also known as the combustion factor (unitless).
Recently, various studies reported the emission factors measured in laboratory or field measurements, often varied widely in different experiments, as summarized in Table 1. In brackets are the all emission factors values derived by Kim Oanh, N. T. et al. (2011) [31], except SO2 derived from Kim Oanh, N. T. et al. (2015) [32]. The field burning experiments were conducted in the Pathum thani province which is located in the central part of Thailand. Zhang, Y. et al. (2013) [33] measured the emission factors of CO2, CO, PM10, PM2.5, and OC for burning rice straw residues in flaming and smoldering combustion in the Pearl River Delta Region, China. Ni, H. et al. (2015) [34] used the laboratory burn tests which were conducted using a custom-made combustion chamber to estimate the emission factors of CO2, CO, PM2.5, and OC of rice straw residues burning in China. Hays M. D. et al. (2005) [35] suggested the value of emission factor of PM2.5 and OC from simulated agricultural fires of surface residuals of rice straw in the Sacramento Valley Region of California, USA. Andrea, M. O. and Merlet, P. (2001) [36] reported the value of emission factors of CO2, CH4, NOX, PM2.5, PM10, BC, and etc. for agricultural open burning by extrapolation from the best value. Akagi, S. K. et al. (2011) [37] used the overall averages of emission factors for mechanized agriculture from Yokelson, R. J. et al. (2011) [38] and manually piled agriculture from Christian, T. et al. (2003) [39]. Yokelson et al. (2011) [38] reported emission factors from airborne measurements of six crop residue fires related with mechanized agriculture in the Yucatan, Mexico. While, Christian, T et al. (2003) [39] measured the mostly smoldering emissions from three laboratory fires burning manually piled rice straw in Indonesian. The emission factors from the manual and mechanical farming are weighted to be 3:14 ratio of manual to mechanized harvesting from applying for the continental scale. Kanokkanjana, K. and Garivait, S. (2010) [40] developed the emission factor of CO2, CO, and PM2.5 for rice residue burning by field experiment in Thailand during 2007 to 2010. However, the emission factors from recent or local measurements were employed in this study derived from Kim Oanh, N. T. et al. (2011) [31] and Kim Oanh, N. T. et al. (2015) [32], concerning the fact that it represents the average emission factor of rice straw burning of Thailand for all emission species focused in this study. The emission factors were estimated to be 1177 ± 140 g/kg for CO2, 93 ± 10 g/kg for CO, 0.49 ± 0.21 g/kg for NOX, 0.51 ± 0.32 g/kg for SO2, 8.3 ± 2.2 g/kg for PM2.5, 9.4 ± 3.5 g/kg for PM10, 0.53 g/kg for BC, and 3.1 g/kg for OC.
2.2. Assessment of Rice Residue Subjected to Open Field Burning
This study assesses the quantity of rice residue that are subjected to open burning by using Equations (3) and (4), which following the generic methodology that the national greenhouse gas inventories (IPCC, 2006) [43] uses for estimating of greenhouse gas emissions from fire. The amount of fuel or agricultural residue that can be burned is given by the burned area and the density of agricultural residue present on that area. The burned area was estimated from the production between the rice harvested area and the fraction of the rice residue subjected to open burning [2]. The fuel density of rice residue can include the rice straw and stubble, which vary as a function of the rice varieties, paddy field location (this study used the provincial boundaries) and irrigation systems.
where:
- is the rice residue subjected to open burning in the field (t);
- are months, regions, provinces, and irrigation systems, respectively;
- is the amount of rice residues generated in the field (t);
- is the rice harvested area from January to December 2018 (ha);
- is the average amount of rice residue per unit area, also known as biomass load (t/ha);
- is the fraction of rice residue subjected to open burning (unitless).
There are three main information points about the assessment of rice residue subjected to open field burning, which comprise the rice harvested area, the amount of rice residue per unit area, and the fraction of rice residue subjected to open burning.
2.3. Assessment of Rice Harvested Area (HA)
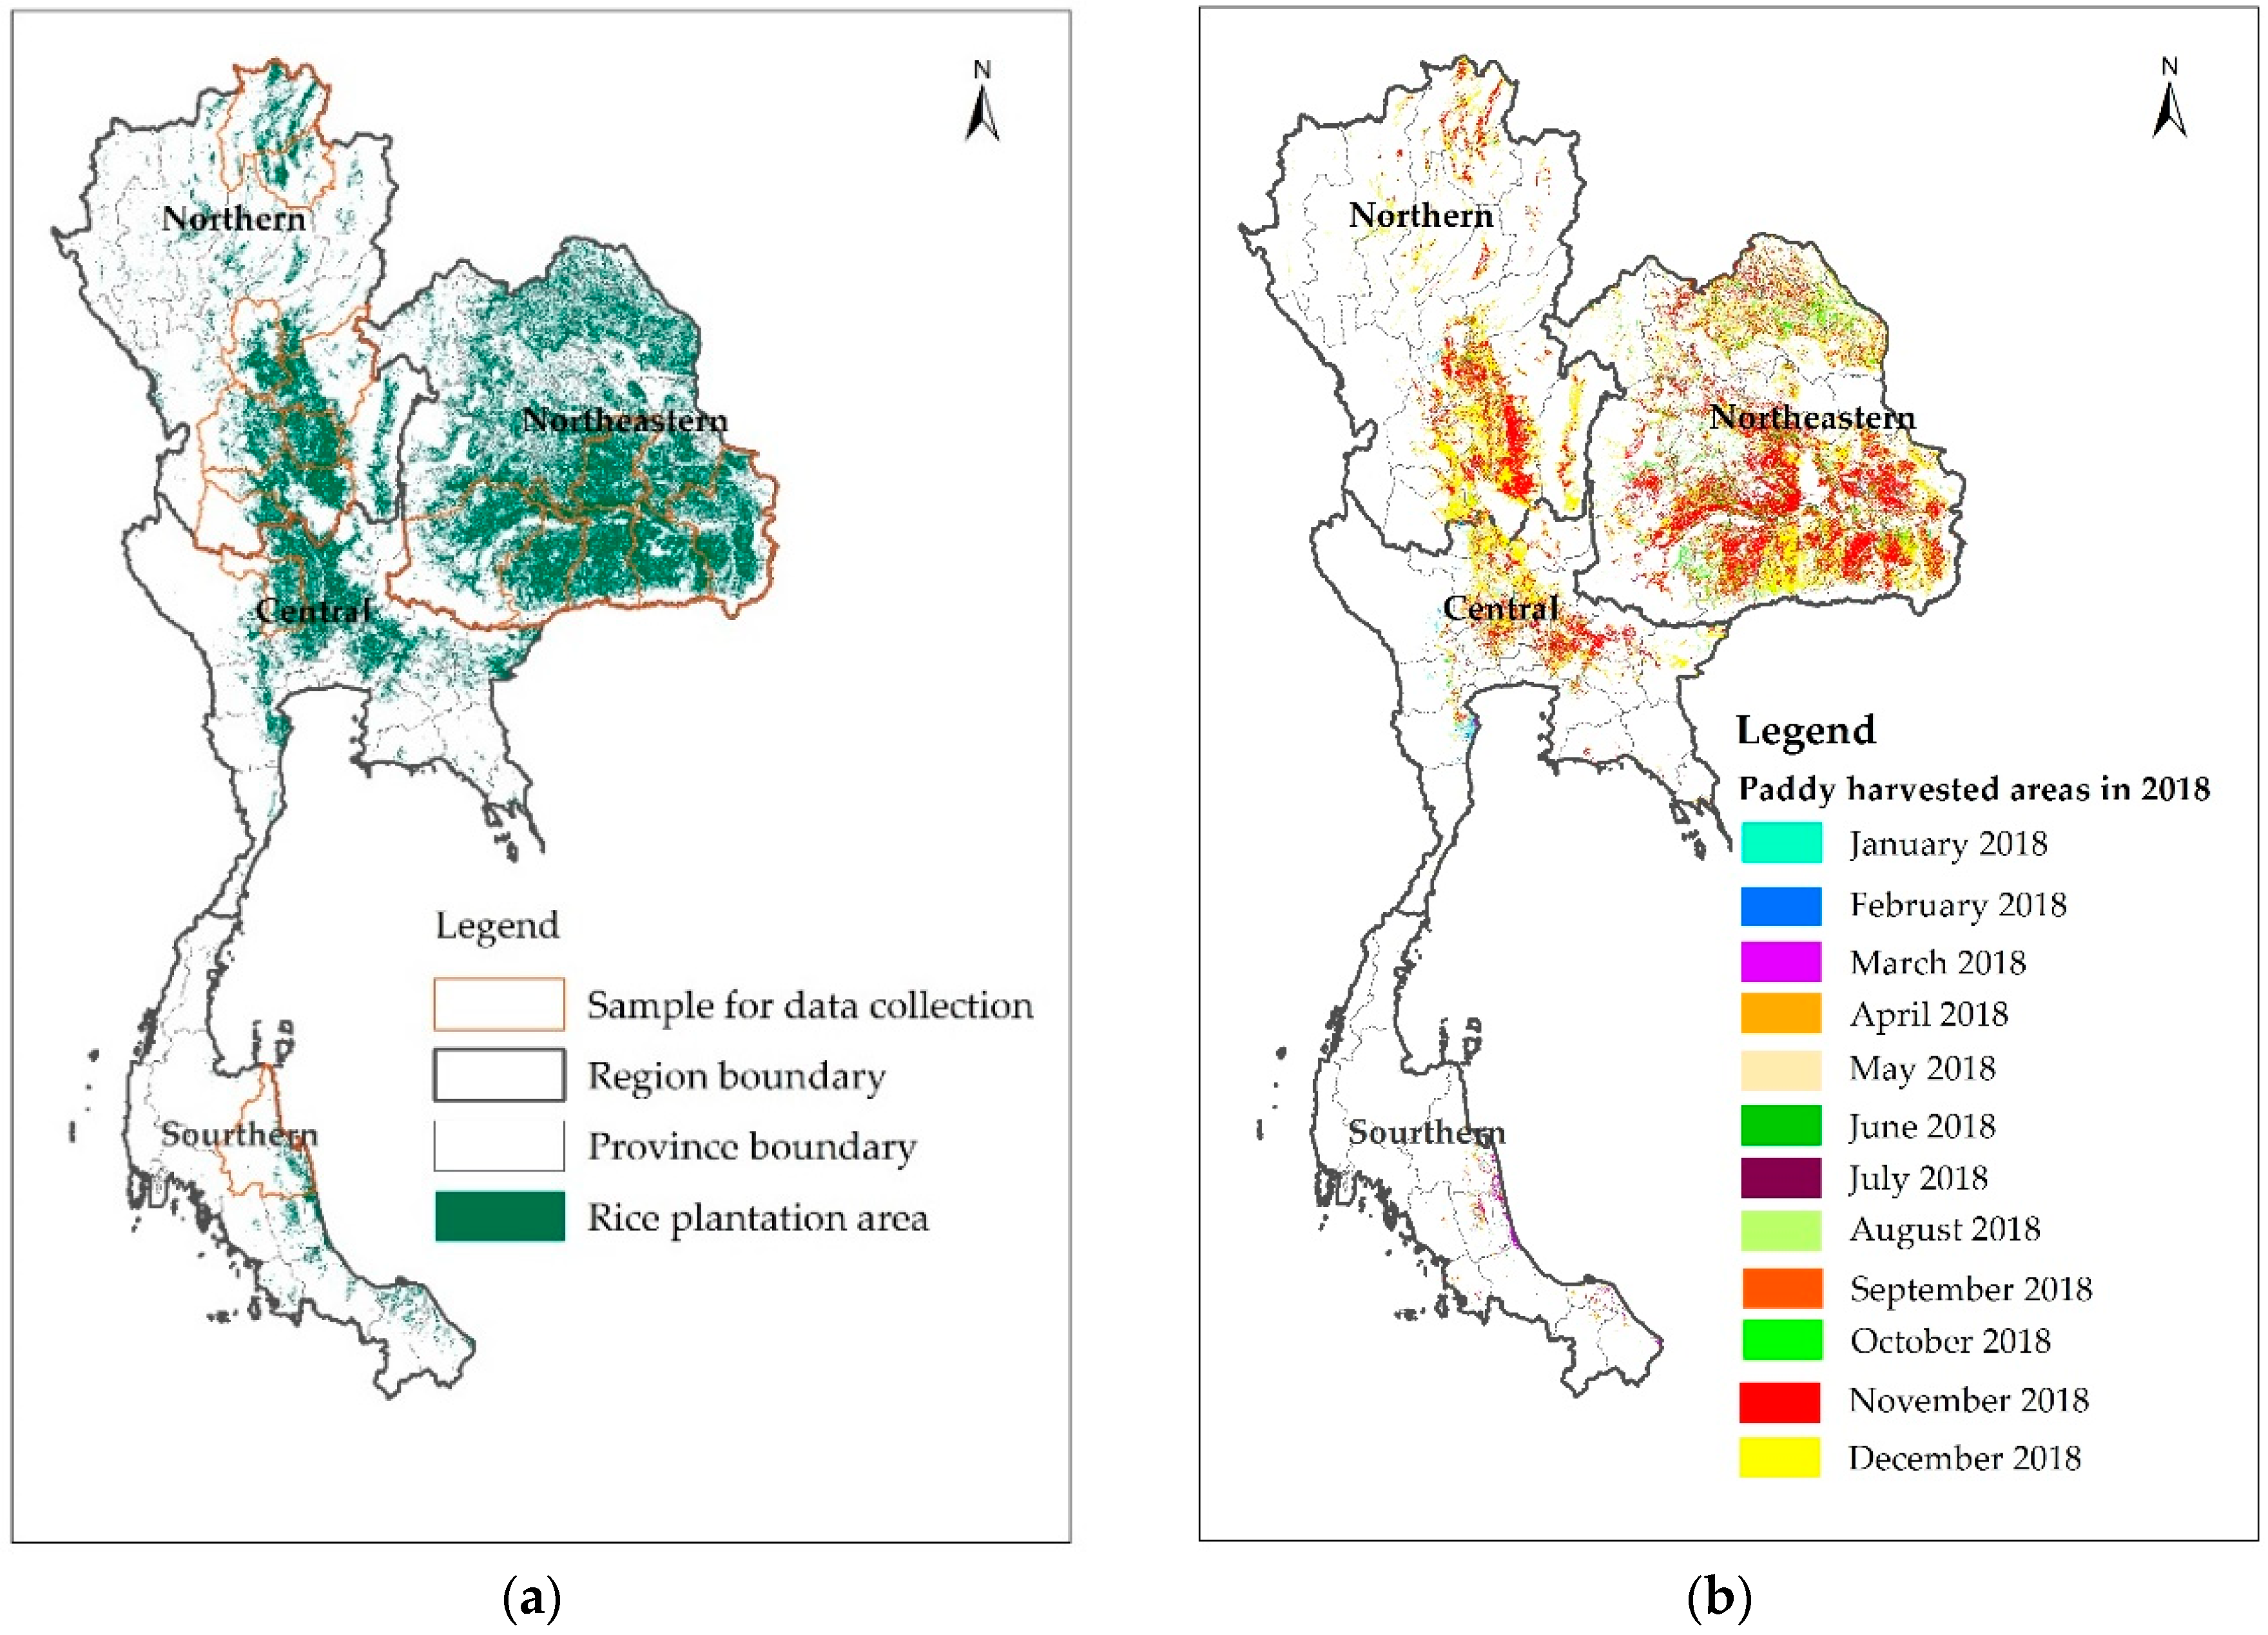
The Geo–Informatics and Space Technology Development Agency (GISTDA), Thailand [44] has developed a system to evaluate the rice plantation areas for forecasting the rice harvested areas and rice production every two weeks, with the objective to provide information pertaining to farming production management for the future. This study used this information to assess the spatial and temporal distribution of rice harvested areas in 2018, which was obtained from the sensor on board both the Terra and Aqua satellites, known as the Moderate Resolution Imaging Spectroradiometer (MODIS). The rice plantation areas from September 2017 to August 2018 and forecasted the harvesting areas from January 2018 to December 2018 was tracked, which corresponded to the mature rice age of about 4 months after planting. The study further evaluated the spatial and temporal allocation of the rice harvested areas, as shown in Figure A1b.
2.4. Rice Residue Density (RD)
This study used the results of Cheewaphongphan P. et al. (2018) [45] which estimated the rice residue density in each provinces and irrigation systems. Their research developed the average density of rice residue in 14 rice varieties which reported that the density of rice residue lay in the range of 4.18 ton per hectare (t/ha) to 8.02 t/ha (dried weight), with an average value of 5.81 t/ha. The results also reported the stubble residue density lay within the range of 1.72 t/ha to 3.41 t/ha, while the straw residue density was between 2.45 t/ha and 4.61 t/ha. Accordingly, it can be inferred from these results that the quantity of rice straw to the gross rice residue was approximately 60%.
According to their results, the average rice residue density in 14 rice varieties was used to categorize the average rice residue density by province (77 provinces) and irrigation systems (irrigated field and rain-fed field). The rice residue density of each variety was multiplied by the percentage share of the planting area for each rice variety in each province, which was obtained from the report of the OAE on “Rice plantation area, rice harvesting area, product, and yield of rice classified by rice varieties, regions, and provinces in 2015” [40]. The obtained value of each province was close to the range of 4.81 t/ha to 7.10 t/ha for irrigated fields, while for rain-fed fields lay within the range of 5.85 t/ha to 6.84 t/ha. The average rice residue density was due to the similarity of the rice varieties grown in each province which demonstrated the unique characteristics of rice cultivation in each area, as illustrated in Figure A2a,b.
2.5. The Fraction of Rice Residue Subjected to Open Burning (FB)
This study used the fraction of rice residue subjected to open burning from the result of Cheewaphongphan P. et al. (2018) [45]. Their study used the questionnaire survey as a tool to observe the farming behaviors in Thailand during 2015/2016. A survey was conducted with the objective to compute the fraction of rice residue subjected to open burning (FB), the fraction of unused residue left in the field, and the fraction of rice residue used for other purposes as fermentation, animal feed, mushroom plantation, sold rice straw to baler operator, and baling rice straw for own used. For sampling distribution of the sample, they collected the questionnaire from the top 16 provinces (5 provinces from central, 6 provinces from north eastern, 4 provinces from northern, and 1 province from southern) which ranked by the Office of Agricultural economics (OAE) [46] that encountered the number of farmers who planted the rice in rain-fed and irrigated area (see Figure A1a).
According to their report, for the rice residue management in irrigated plantation area, nearly one-half of the rice residue was used for utilization. Approximately, one-fourth of the rice residue was open burning in the field, and about one-fourth of the rice residue was left in the field. Meanwhile, the rain-fed plantation area, nearly 60% of the total rice residue was used for utilization, whereas one-fifth of the rice residue was managed both left in the field and open-burned in the field. Briefly, the fraction of rice residue subjected to open burning in the irrigated field for the central, northern, northeastern and southern regions of Thailand was about 0.36 ± 0.008, 0.20 ± 0.006, 0.01 ± 0.002, and 0.0, respectively. While, for the rain-fed field, the value was about 0.18 ± 0.006, 0.26 ± 0.007, 0.21 ± 0.007%, and 0.02 ± 0.002, respectively.
The value of fraction of rice residue subjected to open burning used in this study were compared with those from three research papers (Gadde, B. et al., (2009) [8], Cheewaphongphan, P. and Garivait, S. (2013) [2], and Kim Oanh, N. T. (2018) [30]), which examined the behaviors of farmers in Thailand by using a questionnaire survey. In the dry season, Kim Oanh, N. T. (2018) [30] reported the value of 0.90 for crops harvested in the central obtained from the Asian Institute of Technology (AIT) survey results by Tipayarom, D. and Kim Oanh, N. T. (2007) [47], while for crops harvested in the other regions, the value is typically 0.48 from the report of Department of Alternative Energy Development and Efficiency (DEDE), Thailand in 2003. In the wet season, the value is usually 0.25 for crops harvested in the whole country obtained from The Sustainable Mekong Research Network (SUMERNET) [48]. While, Gadde, B. et al. (2009) [8] reported that the fraction of rice residue subjected to open burning for the whole country was also equal to 0.48 obtained from the report of Department of Alternative Energy Development and Efficiency (DEDE), which was used to explain the farmers’ behaviors in 2003. In later years, Cheewaphongphan, P. and Garivait, S. (2013) [2] employed the random sampling method to study the farmers’ behaviors in Thailand. The fraction of rice residue subjected to open burning was lay in the range of 0.16 to 0.79 varied from a region (an average equal to 0.45). According to the results of Cheewaphongphan P. et al. (2018) [45], the fraction of rice residue subjected to open burning was presently in the range of 0–0.36 (an average of 0.25 for irrigated field, 0.22 for rain-fed field and 0.23 for whole country), which substantially decreases from the value of the previous studies. This information indicates that the changes in the farmers’ behaviors are as a result of the government policy that discourages the open burning of agricultural residues. Moreover, farmers now have various options to exploit the rice residue, such as selling them to baler operators and baling them for personal use. However, the addition of information for supporting the changes in the farmers’ behaviors was discussed in the topic of spatial and temporal distribution of rice residues open burning (Section 3.4).
2.6. The Combustion Factor (α)
The amount and species of emissions emitted from the open burning of rice residue depend on the quantity of rice residue combustion, which also varies by seasonality. During the dry season, the paddy fields and rice residue have a low level of moisture content, resulting in a higher fraction of residue consumed by fire and a more complete combustion when compared to the wet season. However, the fraction of rice residue combusted also depends on farmers’ burning behaviors. Concerning the fact that completely burned rice straws increase tillage efficiency and reduce the need for herbicides and pesticides in preventing diseases, weeds, and pests, the majority of farmers employ the foregoing burning technique for land preparation.
According to the study of Cheewaphongphan P. and Garivait S. (2013) [2], the survey results is used to estimate the fraction of the mass of rice residue combusted by fire (α). Their research developed the combustion factor which based on the field experiments related to rice residue burning characteristics classified by regions and type of residues (straw and stubble). The average combustion factor (α) in the central, northern, northeastern, and southern regions was calculated to be about 0.12, 0.25, 0.52, and 0.26, respectively (an average value of 0.34 for whole country).
2.7. Assessment of the Spatial and Temporal Distribution of Emissions
The spatial distribution of emissions from the rice residue open burning was assessed by using the satellite information resulting from Monthly Burned Area Product (MCD64A1). This product created on an automatic system using 500 m MODIS imagery and 1 km MODIS active fire observations which covered five layers as follow: the burn date, the burn date uncertainty, the quality assurance, and first day and last day. The data of MCD64A1 obtained from Land Processes Distributed Active Archive Center managed by the NASA Earth Science Data and Information System (ESDIS) project [49].
During 2010 to 2017, the burned area data from MCD64A1 was only focused on paddy field which obtained from the land use map of Thailand in 2014 [1] (Figure A3a). The annual fraction of burned area per grid was calculated from the total of burned area in each grid (12 km × 12 km) divided by the total of burned area for whole country. The emission of air pollutant maps from rice residue open burning are allocated to each grid cell on the basis of the fraction of burned area, which presented in the form of a yearly 12 km × 12 km gridded. Finally, the monthly temporal distribution of emissions was calculated by the amount of rice residue burned in each month, multiplied with the emission factors.
2.8. Air Quality Analysis
In this research, with the objective of PM10 concentration air quality data assessment from 2010–2017, four air quality monitoring station sites have been selected [50], based on the criteria that the sites are located in the provinces with large rice production area where there are in-season and off-season rice production. The in-season only sites are located in the north eastern region, namely the Khon Kaen Air Monitoring Station (46T) and Nakhon Ratchasima Air Monitoring Station (47T). The sites with both in-season and off-season rice production are Ayutthaya Air Monitoring Station (21T) in the central region and Nakhon Sawan Air Monitoring Station (41T) in the Lower part of Northern region, as shown in Figure A3a.
3. Results and Discussion
3.1. Amount of Rice Residue Generated in the Field (RRG)
According to the data from GISTDA project [44], the total rice harvested area (HA), planted from September 2017 to August 2018 and harvested from January 2018 to December 2018, was expected to be about 11.03 Mha, containing the irrigated area at 3.93 Mha or 36% of the total rice harvested areas and the rain-fed area at 7.11 Mha or 64%. The rice harvested areas in the central, northern, northeastern, and southern regions was about 2.37 Mha (21.5%), 3.03 Mha (27.5%), 5.48 Mha (49.7%), and 0.15 Mt (1.4%), respectively (Table A2).
From Equation (4), after harvesting a rice crop, the amount of rice residue generated in the field (RRG) was approximately 61.87 Mt, which comprised 21.35 Mt (34.5%) generated from the irrigated areas and 40.53 Mt (65.5%) generated from the rain-fed field. The amount of rice residue generated in the field (RRG) in the central, northern, northeastern, and southern regions was 13.04 Mt (21.1%), 16.86 Mt (27.3%), 31.14 Mt (50.3%), and 0.83 Mt (1.3%), respectively.
Considering the aspect of seasonality (Table A2), the peak period of rice residue generated was during September to December, which encompassed the value of 4.24 Mt, 11.84 Mt, 20.37 Mt, and 8.35 Mt, respectively, which corresponded to the harvesting season of in-season rice. While, the second peak period was during January to May, the amount of rice residue generated in the field (RRG) was about 1.91 Mt, 3.23 Mt, 1.11 Mt, 3.38 Mt, and 4.42 Mt, respectively, which corresponded to the harvesting time of off-season rice.
3.2. Rice Straw Residues Subjected to Open Burning (RRB) and Burned in the Field (M)
According to the Equation (3), the amount of rice residue subjected to open burning (RRB) was about 14.23 Mt (in the range of 12.82 and 14.63 Mt), consisting of 4.34 Mt (varied from 4.24 to 4.43 Mt), 4.07 Mt (varied from 2.95 to 4.19 Mt), 5.82 Mt (varied from 5.62 to 6.00 Mt), and 0.006 Mt (varied from 0.005 to 0.007 Mt) for the central, northern, northeastern, and southern regions, respectively. Based on this information, the average amount of rice residue subjected to open burning was only 23.0% of the total rice residue generated in the paddy field (in the range of 20.7% and 23.6%), which comprised 5.20 Mt (4.05–5.33 Mt) from the irrigated fields and 9.03 Mt (8.76–9.30 Mt) from the rain-fed field.
Considering the amount of rice residue burned in field (M), from Equation (2), it can be concluded that the amount of rice residue burned in field (M) was about 4.54 Mt (varied from 2.86 Mt to 5.79 Mt), consisting of 0.53 Mt, 1.00 Mt, 3.00 Mt, and 0.002 Mt for the central, northern, northeastern, and southern regions, respectively (Table A2.). The result was obviously lower than the values obtained from the previous studies at the range of 6.85–12.55 Mt/year [2,8,29,30].
3.3. Emissions from Rice Residue Open Burning (E)
In 2018, from Equation (1), the actual amount of emissions from rice residue open burning were approximately 5.34 ± 2.33 Mt of CO2, 44 ± 14 kt of CH4, 422 ± 179 kt of CO, 2 ± 2 kt of NOX, 2 ± 2 kt of SO2, 38 ± 22 kt of PM2.5, 43 ± 29 kt of PM10, 2 ± 1 kt of BC, and 14 ± 5 kt of OC. The percentage of emissions by region, it was found that the central, northern, northeastern, and southern regions of Thailand contributed to 11.70%, 22.06%, 66.21% and 0.03% of all emissions, respectively. The ranking of provinces in Thailand that encountered problems of emissions from rice residue open burning is illustrated in Table A3. According to the ranking, the top 10 provinces with critical problems of rice residue open burning were Nakhon Sawan, Roi Et, Khon Kaen, Nakhon Ratchasima, Sakon Nakhon, Suphan Buri, Phichit, Mahasarakham, Auttaradit, and Phitsanu Lok, sequentially. These provinces entail effective mitigation measures to reduce the amount of air pollutant emissions from rice residue open burning.
3.4. Spatial and Temporal Distribution of Rice Residues Open Burning
The fire data from remote sensing information is suitable for analyzing the trends and variability of fire emissions, especially the regional scale [51,52]. In this study, the MCD64A1 burned product during 2010 to 2017 was used to estimate the paddy field areas burned in Thailand. The annually temporal distribution of burned area occurred in the paddy field area in Thailand is presented in Figure 1. In late 2011, when the Thai government introduced the Rice Pledging Scheme for rice farmers, a significant number of farmers have joined the program [25]. This resulted in the 12% year over year growth (YoY) expansion of off-season rice production area (see the secondary axis of Figure 1) [5], as well as the number of crop-growing cycles in 2012. Instead of only one off-season cycle, the farmers planted an additional cycle, by immediately starting a new cycle after one another. In order to speed up the process and reduce time between cycles, the farmers chose to burn the rice straw in their own fields. Based on the data obtained from MODIS satellite, the size of the burned rice areas increased from 275 thousand ha (in 2010) and 284 thousand ha (in 2011) to 465 thousand ha in 2012 (64% YoY), there were significant increases in March (see Table A4). At the end of the Rice Pledging Scheme for the in-season crop in 2015, the government then turned to promote the production of other crops instead of the off-season rice production [24]. As a result, in 2016, the size of the off-season rice area dropped drastically by 66% YoY in comparison to 2014 [5]—prior to the start of the scheme, which also brought the total area with burning activities down to the similar level of that prior to the beginning of the rice pledging scheme (2010–2011).
Moreover, since 2012, the burned area tended to decrease continuously by the average reduction rate of 8.7% annually, which also resulted from the Pollution Control Plan 2012–2016 [23] was implemented by the Pollution Control Department (PCD) to mitigate emissions from agricultural residue open burning by imposing ban on crop residue burning and promoting the utilization of agricultural residues for various purposes, including agricultural and energy-related purposes [24]. The result shows the correlation between the government’s policy for farmers and the total rice production area with burning activities in each year.
The result of this section suggests that the data of the burned area obtained from remote sensing could be applied, in order to understand the farmer’s rice straw burning behavior. Given that data collection by surveying the farmers on their rice straw burning activities will require a large budget and a long time to gather the information, especially for large areas. This research has taken the approach to compare the result obtained from the satellite information and the result based on surveying. It is shown in the comparison that the results between the two methods are nearly similar, therefore if the government were to initiate any policy to support the farmers or to reduce the rice straw burning activities, it is suggested that the data obtained from the satellite could also be applied to initially determine the farmer’s pattern of burning activities.
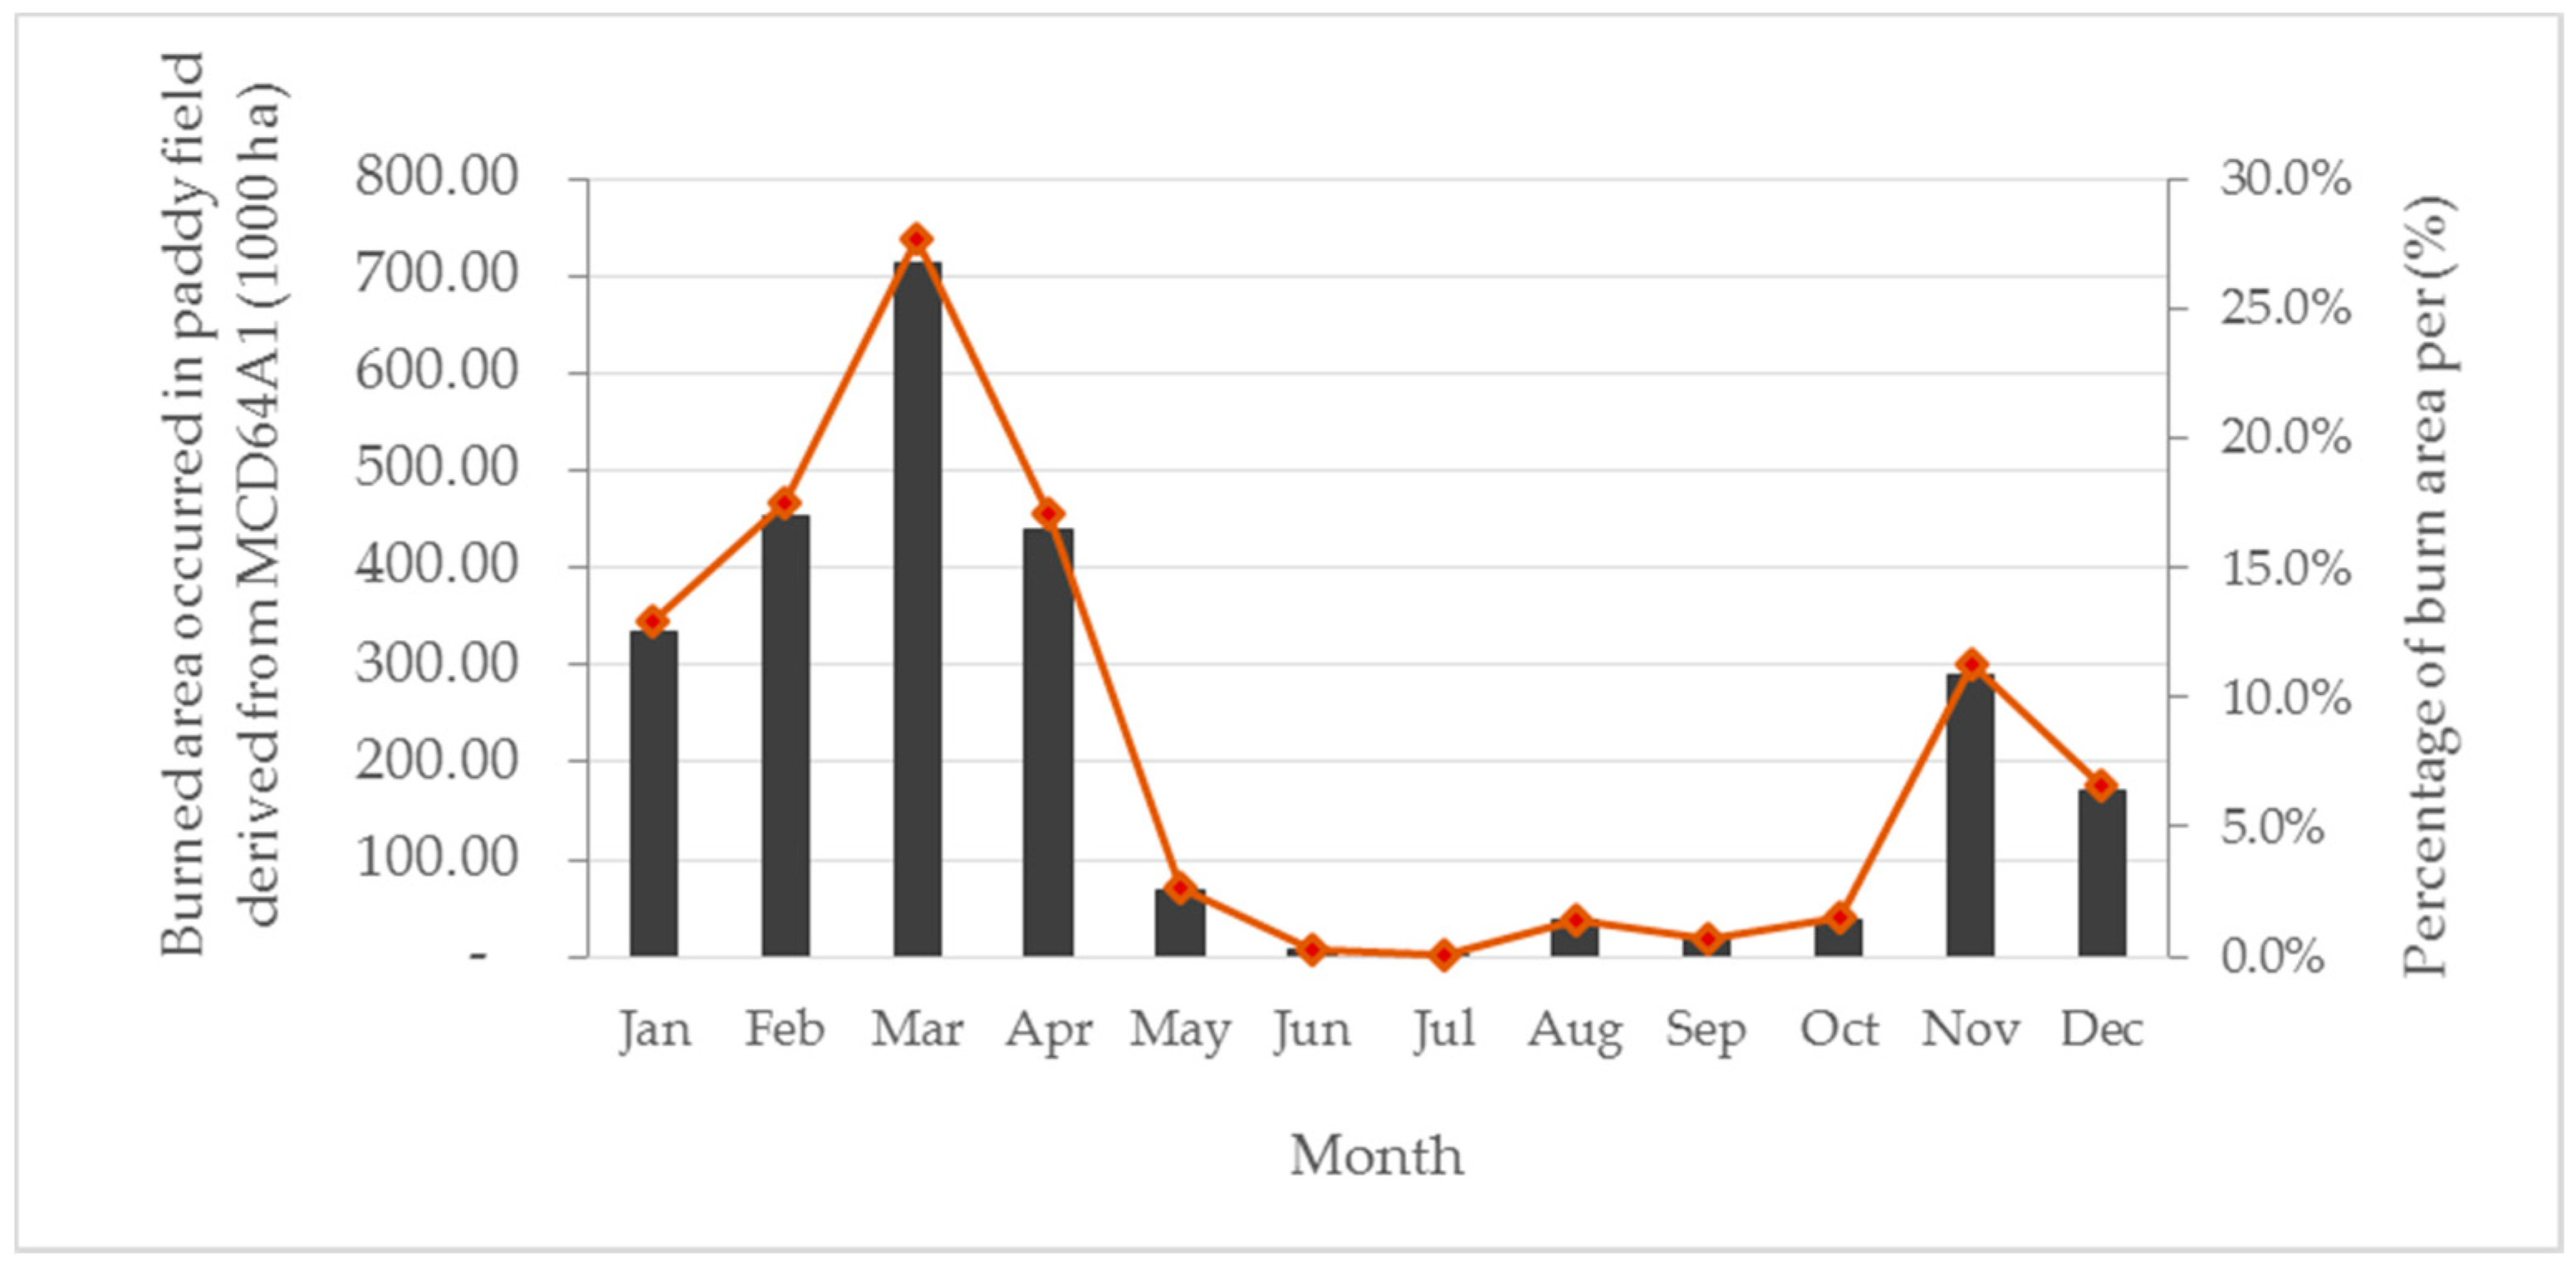
According to the MCD64A1 burned area product, the monthly cumulative of burned area occurred in paddy field during 2010 to 2017 is presented in Figure 2. The overall burned area occurred in paddy field was estimated at about 2.57 Mha with an annual average value of 0.32 Mha/year or 2.9% of total rice plantation area in 2018. There were two peaks for the largest part of burning. The first peak was during January to April, which corresponded to the harvesting time of off-season rice for the central and lower northern regions. The second peak was during November to December, which corresponded to the harvesting season of in-season rice for all regions. The largest expanse of cumulative burned area was observed on March, at about 715 thousand ha or 27.8% of total burned area.
The results of monthly temporal distribution of rice residues open burning obtained from MCD64A1 were compared with those from two farmer’s survey derived from Cheewaphongphan, P. et al. (2018) [45] in 2015/2016 and Cheewaphongphan, P. and Garivait, S. (2013) [2] in 2007/2008. The percentage of burning of rice residue by burning period is presented in Figure 3. From farmer’s survey in 2007/2008, the percentage of burning of rice residue was calculated from the total burned area which is approximately 4.4 Mha/year or 45% of the paddy fields area while the burned area from farmer’s survey in 2015/2016 is approximately 1.83 Mha/year or 23% of the paddy fields.
According to the result, the monthly distribution of rice residues open burning was quite similar which had two peaks for the largest part of burning. However, the percentage of burned area occurred from January to April (harvesting time of off-season rice) was quite higher than November to December (harvesting time of in-season rice). We suggest that the results of burned area from MCD64A1 need to be validated with the high-resolution satellite products and ground-truthing. Because the paddy fields are located close to the other crops (sugarcane and maize) and the deciduous forest which were burned by farmer and local people during the period from January to April.
Considering the percentage of burned area with the total rice plantation area, it can be seen that the percentage of burned area (≈3% of total rice plantation area) is rather low when compared with the fraction of rice residue subjected to open burning with the result from a questionnaire survey. It can be explained that the average of farmer’s land tenure per household is rather small of 7.6 ha per household [5], when the farmers burn their rice residues in the field, the small fire is poorly detected by remote sensing sensors (For 1 pixel of resolution from MCD64A1 ≈ 25 ha) [53]. Moreover, Zhu, C. et al. (2017) [54] reported that MCD64A1 burned areas comprised only 13% of the reference fire product (high resolution better than 30 m) in croplands because of inadequate detection of small fires (<100 ha). This is the reason why this study used the result from questionnaire survey to evaluate the rice residues combusted in the paddy fields.
Finally, the annual fraction of burned area per grid was calculated from the total of burned area in each grid (12 km × 12 km) divided by the total of burned area during 2010 to 2017 which is illustrated in Figure A3b. This fraction is used to create the spatial allocation of the emissions by multiplying with the total emissions (sum of fraction for whole country = 1.0).
3.5. Spatial and Temporal Distribution of Emissions
This study provides the 12 km × 12 km gridded map for the spatial allocation of the emissions, which is useful for the government officers in acquiring an explicit understanding of the agricultural burning behaviors in Thailand. Likewise, this information can be used as the input data in the air quality modeling in order to simulate air quality at the regional and national level.
From the results, the special allocation of annual PM2.5 emission in 2018 is illustrated in Figure 4. The regions with a high density of PM2.5 emission from rice residue open burning were central and lower northern regions. Some parts of the lower northeastern region were also found to have a high density of PM2.5 emission, but a moderate density of PM2.5 emission was prevalent across the region. For other compounds, the distribution of gridded emissions has the same pattern but difference in the range of amount emissions which depends on the total of emissions.
This study also provides the monthly distribution of PM2.5 emission which used the amount of rice residue burned in fields in each month (Table A2), multiplied with the emission factor of PM2.5. From the result, the period that generated the highest amount of PM2.5 emission was from October to December, which encompassed the value of 8.23 kt, 14.54 kt, and 5.9 kt, respectively, which accounted for 76.2% of the total PM2.5 emission (as shown in Figure 5). This information corresponded to the harvesting time of in-season rice for the central, lower northern and northeastern regions. An amount of PM2.5 emission was also found in January to May, which encompassed the range of 0.42 kt and 1.83 kt, which corresponded to the harvesting time of off-season rice for central and lower northern regions.
This information indicated that there is a large gap between the seasonal variation of burned area from MCD64A1 and the previous studies [2,45] (shown in Figure 3) and the PM2.5 emission or rice residue burned (shown in Figure 5). It can be explained that the rice residue burned was calculated from 4 parameters which included the harvested area (ha), biomass load (t/ha), fraction of rice residue subjected to open burning (unitless) and combustion factor (unitless). In this study, the fraction of rice residue subjected to open burning was obtained from the result of Cheewaphongphan P. et al. (2018) which only classified by regions and irrigation systems (Equation (3)). This means that if the amount of harvested area and rice residue generated in the fields were high in October to December which is the harvesting time of in-season rice, the rice residue burned would be high as well. So, the results show a large different in seasonal variation between the rice residue burned from the bottom-up approach and the burned area derived from MCD64A1.
In the future researches, the fraction of rice residue subjected to open burning should be considered with the monthly temporal of farmer’s burning. Because the rice residue generated located in rain-fed filed can be burned in the long period from the after harvesting to before tillage (October to April for next year) while the rice residue generated located in irrigated-fed filed was immediately burned after harvesting, in order to present a result as accurate as possible.
3.6. Air Quality Trends
Regarding the air quality analysis, based on the monthly average data of PM10 concentration collected from the four sites during 2010–2017, as illustrated in Figure 6, similar trends could be found every year. The PM10 concentration monthly averages are in the range of 20–35 µg/m3 in the off-season period (May–September), and start to increase to the range of 38–48 µg/m3 in October—the beginning of winter when rainfall volume declines. The increase then continues until it reaches the range of 57–82 µg/m3 in November and December which are the peak months for the in-season rice harvest. This level of PM10 concentration continues its peak until the end of April (January–April is the harvest period for the off-season rice production), as illustrated in Figure 7. Moreover, it is found that December to April is the annual period for sugar factory to procure fresh sugar cane, making it the pre-harvest burning period for the farmer, when they regularly burn the sugar cane leaves and tops. According to Report on the Performance of Sugarcane and Sugar Production of Sugar Factories in Thailand reported by Office of the Cane and Sugar Board [55], the sugar cane burnt in the pre-harvest burning process amounts to approximately 40–50% of the total amount of sugar cane sold to the factory during 2010–2017. The higher level of PM10 concentration was due to the biomass burning activities of both crops, as reflected in the higher monthly averages of the months with biomass burning, by around 1.9–2.1 times (November to April PM10 concentration average divided by May to October average). In future researches, biomass burning activities of other crops should also be taken into consideration, especially sugarcane.
3.7. Comparison with Other Studies
Based on the comparison of emissions between this study and previous studies [2,8,30], as presented in Table 2, it can be observed that the results of this study are slightly lower than those of the previous studies, the difference is varying by a range of 0.7 to 4.0 times, with the exception of PM2.5 which the large difference is in the range between 1.8 and 9.2 times lower. The comparison of parameters and emission factors between this study and previous studies, as presented in Table 3. There are four main parameters that influence the differences in these results, which include: (1) quantity of rice residue generated; (2) percentage of rice residue subjected to open burning; (3) combustion factor; and (4) emission factor.
Regarding the aspect of the quantity of rice residue generated, the differences in the amount of rice residue generated are accounted for by the methodology, the source of information, and the estimation scale. This study quantified the amount of rice residue generated in the field on the basis of the biomass load unit, which correlated with the harvested areas. On the other hand, the previous studies quantified the amount of rice residue generated (by combining both stubble and straw together) on the basis of the residue to product ratio (RPR), which correlated with the rice production derived from the Food and Agriculture Organization (FAO), FAOSTAT Agricultural Database [56] or Agricultural Statistic of Thailand from Office of Agricultural Economics (OAE), Thailand. In addition, this study and Cheewaphongphan, P. and Garivait, S. (2013) [2] employed the bottom-up approach (provincial scale) to obtain the total value, while the both previous studies used the top-down approach with a default value, which Kim Oanh, N. T. et al. (2018) [30] used the value of RPR to be 1.75 based on a study in North Sulawesi, Indonesia and Gadde B. et al. (2009) [8] used the value of RPR to be 0.75 based on a study in Philippines. The amount of rice residues generated in the field were 54.25 Mt and 21.86 Mt, respectively, while for the approximate of Cheewaphongphan, P. and Garivait, S. (2013) [2], the value is typically 117.7 Mt. The information shows the difference of method between the bottom-up approach and the top-down approach which depend on the objective of their work.
Considering the fraction of rice residue subjected to open burning, the differences thereof are due to the year of the study. Farmer’s survey is a common method that is used to assess the share of rice residue subjected to open burning, which encompasses questionnaire and interview. All studies employed this method (whether to obtain primary data or secondary data) to study the rice residue management and to assess the share of unused residue subjected to open burning. The differences of values are discussed in the Section 2.5.
With respect to the combustion factor, this study used the results obtained from Cheewaphongphan, P. and Garivait, S. (2013) [2] which assessed this coefficient solely on the basis of region and type of residue; Kim Oanh, N. T. (2018) [30] used the combustion factor from the results of the field measurements conducted in Thailand by Kim Oanh, N. T. et al. (2011) [31] which represented the rice straw quite completely burned (0.93); Gadde B. et al. (2009) [8] used the default value of the 2006 IPCC Guidelines for National Greenhouse Gas [43] as the coefficient (0.80), which was representative of the post-harvest field burning of agricultural residues (same value for maize, sugarcane, and rice residues).
Regarding the emission factor, the differences owe to the use of different sources of information. This study used the set of emission factor from the study of Kim Oanh, N. T. et al. (2011) [31], except SO2 derived from Kim Oanh, N. T. et al. (2015) [32], which is similar to the study of Kim Oanh, N. T. (2018) [30]. The set of emission factors obtained from the rice straw spread field burning measurements in Thailand which were used for the places with mechanical harvesting. The other studies used secondary information that were derived from different sources. On the other hand, Cheewaphongphan, P. and Garivait, S. (2013) [2] used the emission factor from various sources that were specific to rice residue open burning in Thailand obtained from field experiment during 2007 to 2010 in Ratchaburi, Nakhonsawan, Samutsakhon, and Petchaburi provinces, Thailand, experimented by Kanokkanjana, K. and Garivait, S. (2010) [40]. However, the emission factor of PM2.5 is quite higher than the other studies (as shown in Table 3.). Gadde, B. et al. (2009) [8] also adopted the emission factor from various sources that were specific to open burning of rice straw which verified in foreign countries. Noticeably, in the both of their studies [2,8], the emission factor of PM10 was much less than the emission factor of PM2.5 because they combined the set of emission factor from the different sources. However, the literature review (as shown in Table 1) shows the emission factor of PM2.5 and PM10 which measured in the fixed of field burning or laboratory experiment that the emission factor of PM10 are higher than the emission factor of PM2.5 [31,32,33,36]. Hence, regardless of the sources of information used, the selection of the emission factor that is most appropriate to the fuel, fire, and field characteristics will reduce the uncertainty of the establishment of emission inventory.
4. Conclusions
This study found that the amount of rice residue generated was approximately 61.87 Mt, nearly half of which were removed from the field to be used for other purposes, such as mushroom plantation, animal feed, fermentation, and sales to baling operators. One-fourth of the rice residue remained in the field and were usually returned to the soil by tillage. Nearly one-fourth of the total rice residue generated were subjected to open burning. The results indicated that the actual amount of rice residue burned in the field was about 4.54 Mt, which was nearly 7% of the total rice straw residue generated. The emission of air pollutants from rice residue open burning comprised 5.34 ± 2.33 Mt of CO2, 44 ± 14 kt of CH4, 422 ± 179 kt of CO, 2 ± 2 kt of NOX, 2 ± 2 kt of SO2, 38 ± 22 kt of PM2.5, 43 ± 29 kt of PM10, 2 ± 1 kt of BC, and 14 ± 5 kt of OC. The emission from rice residue open burning was concentrated in the central, lower northern, and northeastern regions of Thailand. It is observable that the government’s measure implementation for farmers affects the farmer’s rice straw burning behavior and rice residue management, all of which cast direct impact on air quality in each province, especially the provinces that are located in the regions with large rice cultivation area. Hence, these regions entail effective mitigation measures to reduce the amount of smoke and smog pollution, such as extending the no-burning period by local authorities and promoting alternative uses of straw. In future researches, we suggest that the agricultural burning activities of other crops should be taken into consideration.
Author Contributions
A.J. devised the project, the main conceptual ideas and proof outline. A.J. worked out almost all of the technical details and performed the numerical calculations. A.J. and O.K. worked on the spatial and temporal distribution of emissions from rice residue open burning in Thailand by using Geographic Information System (GIS) program. A.J. and J.P. proposed the result in discussions with P.C. and S.G. All authors discussed the results and contributed to the final manuscript.
Funding
This research was funded by the Thailand Research Fund (TRG6080012) and the Mahidol University (MU).
Acknowledgments
This study was supported by King Mongkut’s University of Technology Thonburi (KMUTT) through the “KMUTT 55th Anniversary Commemorative Found” and the Mahidol University (MU). The author would like to thank research fund supported from The Thailand Research Fund (TRG6080012) for research activities.
Conflicts of Interest
The authors declare no conflict of interest.
Appendix A

Table A1.
The planted area and rice production from in-season rice and off-season rice plantation in Thailand during 2010–2017.
Table A1.
The planted area and rice production from in-season rice and off-season rice plantation in Thailand during 2010–2017.
| Year | In-Season Rice | Off-Season Rice | ||
|---|---|---|---|---|
| Planted Area (Mha) | Production (Mt) | Planted Area (Mha) | Production (Mt) | |
| 2010 | 10.33 | 25.44 | 2.44 | 8.86 |
| 2011 | 10.45 | 25.87 | 2.58 | 10.14 |
| 2012 | 10.39 | 27.23 | 2.88 | 12.22 |
| 2013 | 9.93 | 27.09 | 2.57 | 10.77 |
| 2014 | 9.73 | 26.27 | 2.41 | 9.67 |
| 2015 | 9.29 | 24.31 | 1.35 | 5.35 |
| 2016 | 9.38 | 25.24 | 0.82 | 3.11 |
| 2017 | 9.43 | 24.07 | 1.67 | 6.62 |
Table A2.
Paddy harvested area, rice straws generated in the field, and the amount of rice residue burned in field categorized by regions in 2018.
Table A2.
Paddy harvested area, rice straws generated in the field, and the amount of rice residue burned in field categorized by regions in 2018.
| Regions | Paddy Harvested Area in 2018 (Mha) | ||||||||||||
|---|---|---|---|---|---|---|---|---|---|---|---|---|---|
| Jan | Feb | Mar | Apr | May | Jun | Jul | Aug | Sep | Oct | Nov | Dec | Total | |
| Central | 0.13 | 0.28 | 0.15 | 0.23 | 0.23 | 0.06 | 0.14 | 0.08 | 0.33 | 0.28 | 0.27 | 0.18 | 2.37 |
| Northern | 0.18 | 0.29 | 0.04 | 0.32 | 0.33 | 0.09 | 0.01 | 0.11 | 0.34 | 0.31 | 0.75 | 0.26 | 3.03 |
| Northeastern | 0.02 | - | 0.00 | 0.07 | 0.20 | 0.03 | 0.00 | 0.00 | 0.10 | 1.50 | 2.56 | 1.01 | 5.48 |
| Southern | 0.02 | 0.01 | 0.01 | 0.00 | 0.03 | 0.01 | 0.00 | 0.00 | 0.01 | 0.01 | 0.01 | 0.03 | 0.15 |
| Total | 0.34 | 0.59 | 0.21 | 0.62 | 0.80 | 0.19 | 0.15 | 0.20 | 0.78 | 2.10 | 3.59 | 1.48 | 11.03 |
| Rice straws generated in the field in 2018 (Mt) | |||||||||||||
| Central | 0.72 | 1.56 | 0.78 | 1.23 | 1.28 | 0.32 | 0.79 | 0.45 | 1.80 | 1.54 | 1.52 | 1.05 | 13.04 |
| Northern | 0.98 | 1.62 | 0.24 | 1.73 | 1.83 | 0.54 | 0.04 | 0.60 | 1.88 | 1.69 | 4.23 | 1.49 | 16.86 |
| Northeastern | 0.12 | - | 0.00 | 0.41 | 1.14 | 0.15 | 0.02 | 0.00 | 0.53 | 8.55 | 14.56 | 5.68 | 31.14 |
| Southern | 0.09 | 0.05 | 0.08 | 0.01 | 0.18 | 0.06 | 0.02 | 0.03 | 0.04 | 0.06 | 0.06 | 0.14 | 0.83 |
| Total | 1.91 | 3.23 | 1.11 | 3.38 | 4.42 | 1.07 | 0.86 | 1.08 | 4.24 | 11.84 | 20.37 | 8.35 | 61.87 |
| The amount of rice residue burned in field in 2018 (Mt) | |||||||||||||
| Central | 0.03 | 0.06 | 0.03 | 0.05 | 0.06 | 0.01 | 0.03 | 0.02 | 0.08 | 0.06 | 0.05 | 0.04 | 0.53 |
| Northern | 0.06 | 0.10 | 0.01 | 0.10 | 0.10 | 0.03 | 0.00 | 0.03 | 0.11 | 0.10 | 0.26 | 0.09 | 1.00 |
| Northeastern | 0.01 | - | 0.00 | 0.03 | 0.06 | 0.01 | 0.00 | 0.00 | 0.05 | 0.83 | 1.44 | 0.58 | 3.00 |
| Southern | 0.00 | 0.00 | 0.00 | 0.00 | 0.00 | 0.00 | 0.00 | 0.00 | 0.00 | 0.00 | 0.00 | 0.00 | 0.00 |
| Total | 0.10 | 0.16 | 0.05 | 0.18 | 0.22 | 0.05 | 0.04 | 0.05 | 0.23 | 0.99 | 1.75 | 0.71 | 4.54 |
Table A3.
The ranking of provinces in Thailand that encountered problems of emission from rice residue open burning in 2018.
Table A3.
The ranking of provinces in Thailand that encountered problems of emission from rice residue open burning in 2018.
| Rank | Province | The Amount of Emissions from Rice Residue Open Burning | |||||
|---|---|---|---|---|---|---|---|
| PM2.5 (kt) | PM10 (kt) | NOX (t) | CO (kt) | CO2 (kt) | CH4 (kt) | ||
| 1 | Nakhon Sawan | 3.21 | 3.63 | 189 | 35.93 | 455 | 3.71 |
| 2 | Roi Et | 3.17 | 3.59 | 187 | 35.53 | 450 | 3.67 |
| 3 | Khon Kaen | 2.82 | 3.19 | 166 | 31.60 | 400 | 3.26 |
| 4 | Nakhon Ratchasima | 2.37 | 2.68 | 140 | 26.51 | 336 | 2.74 |
| 5 | Sakon Nakhon | 2.13 | 2.41 | 126 | 23.83 | 302 | 2.46 |
| 6 | Suphan Buri | 1.91 | 2.17 | 113 | 21.43 | 271 | 2.21 |
| 7 | Phichit | 1.65 | 1.87 | 97 | 18.47 | 234 | 1.91 |
| 8 | Mahasarakham | 1.64 | 1.86 | 97 | 18.42 | 233 | 1.90 |
| 9 | Auttaradit | 1.59 | 1.80 | 94 | 17.84 | 226 | 1.84 |
| 10 | Phitsanu Lok | 1.23 | 1.39 | 72 | 13.73 | 174 | 1.42 |
| 11 | Nakhon Nayok | 1.11 | 1.26 | 66 | 12.46 | 158 | 1.29 |
| 12 | Burirum | 1.05 | 1.19 | 62 | 11.77 | 149 | 1.22 |
| 13 | Chiangrai | 1.05 | 1.19 | 62 | 11.74 | 149 | 1.21 |
| 14 | Phetchabun | 1.04 | 1.18 | 62 | 11.68 | 148 | 1.21 |
| 15 | Kalasin | 1.01 | 1.15 | 60 | 11.32 | 143 | 1.17 |
| 16 | Sukhothai | 0.89 | 1.01 | 52 | 9.96 | 126 | 1.03 |
| 17 | Yasothon | 0.89 | 1.01 | 52 | 9.94 | 126 | 1.03 |
| 18 | Ayudhya | 0.88 | 1.00 | 52 | 9.87 | 125 | 1.02 |
| 19 | Chaiyaphum | 0.88 | 0.99 | 52 | 9.83 | 124 | 1.02 |
| 20 | Chainat | 0.64 | 0.73 | 38 | 7.20 | 91 | 0.74 |
| 21 | Lopburi | 0.59 | 0.67 | 35 | 6.61 | 84 | 0.68 |
| 22 | Udon Thani | 0.57 | 0.64 | 33 | 6.35 | 80 | 0.66 |
| 23 | Surin | 0.56 | 0.63 | 33 | 6.26 | 79 | 0.65 |
| 24 | Prachinburi | 0.55 | 0.62 | 32 | 6.16 | 78 | 0.64 |
| 25 | Kampaeng Phet | 0.54 | 0.61 | 32 | 6.02 | 76 | 0.62 |
| 26 | Srakaeo | 0.51 | 0.58 | 30 | 5.74 | 73 | 0.59 |
| 27 | Nong Bua Lamphu | 0.47 | 0.54 | 28 | 5.29 | 67 | 0.55 |
| 28 | Tak | 0.36 | 0.41 | 22 | 4.08 | 52 | 0.42 |
| 29 | Ubon Ratchathani | 0.31 | 0.35 | 18 | 3.45 | 44 | 0.36 |
| 30 | Nakhon Phanom | 0.29 | 0.33 | 17 | 3.28 | 41 | 0.34 |
| 31 | Kanchanaburi | 0.20 | 0.23 | 12 | 2.23 | 28 | 0.23 |
| 32 | Chachoengsao | 0.19 | 0.22 | 11 | 2.18 | 28 | 0.23 |
| 33 | Amnaj Charoen | 0.17 | 0.19 | 10 | 1.89 | 24 | 0.20 |
| 34 | Mae Hong Son | 0.15 | 0.17 | 9 | 1.69 | 21 | 0.17 |
| 35 | Nong Khai | 0.13 | 0.15 | 8 | 1.44 | 18 | 0.15 |
| 36 | Chiang Mai | 0.12 | 0.13 | 7 | 1.32 | 17 | 0.14 |
| 37 | Sisaket | 0.11 | 0.13 | 7 | 1.24 | 16 | 0.13 |
| 38 | Uthai Thani | 0.11 | 0.12 | 6 | 1.22 | 15 | 0.13 |
| 39 | Singburi | 0.10 | 0.11 | 6 | 1.12 | 14 | 0.12 |
| 40 | Lampang | 0.09 | 0.10 | 5 | 1.00 | 13 | 0.10 |
| 41 | Saraburi | 0.06 | 0.07 | 4 | 0.71 | 9 | 0.07 |
| 42 | Nakhon Prathom | 0.06 | 0.07 | 4 | 0.71 | 9 | 0.07 |
| 43 | Ang Thong | 0.04 | 0.05 | 3 | 0.49 | 6 | 0.05 |
| 44 | Mukdahan | 0.04 | 0.05 | 2 | 0.46 | 6 | 0.05 |
| 45 | Chonburi | 0.03 | 0.04 | 2 | 0.37 | 5 | 0.04 |
| 46 | Pathum Thani | 0.03 | 0.03 | 2 | 0.33 | 4 | 0.03 |
| 47 | Phetchaburi | 0.03 | 0.03 | 2 | 0.29 | 4 | 0.03 |
| 48 | Loei | 0.02 | 0.03 | 1 | 0.27 | 3 | 0.03 |
| 49 | Nan | 0.014 | 0.02 | 1 | 0.16 | 2 | 0.02 |
| 50 | Phayao | 0.014 | 0.02 | 1 | 0.16 | 2 | 0.02 |
| 51 | Bangkok | 0.008 | 0.01 | 0.4 | 0.09 | 1 | 0.01 |
| 52 | Phrae | 0.007 | 0.01 | 0.4 | 0.08 | 1 | 0.01 |
| 53 | Chanwat Bueng Kan | 0.006 | 0.01 | 0.3 | 0.07 | 1 | 0.01 |
| 54 | Chanthaburi | 0.002 | 0.003 | 0.1 | 0.03 | 0 | 0.00 |
| 55 | Pattani | 0.002 | 0.002 | 0.1 | 0.02 | 0 | 0.00 |
| 56 | Lamphun | 0.001 | 0.001 | - | 0.01 | 0 | 0.00 |
| Whole country | 37.65 | 42.64 | 2223 | 421.85 | 5339 | 43.55 | |
Table A4.
The monthly temporal distribution of burned area occurred in the paddy field in Thailand derived from MCD64A1 product during 2010–2017.
Table A4.
The monthly temporal distribution of burned area occurred in the paddy field in Thailand derived from MCD64A1 product during 2010–2017.
| Year | Monthly Temporal Distribution of Burned Area Occurred in the Paddy Field Area (1000 ha) | Total | |||||||||||
|---|---|---|---|---|---|---|---|---|---|---|---|---|---|
| Jan | Feb | Mar | Apr | May | Jun | Jul | Aug | Sep | Oct | Nov | Dec | ||
| 2010 | 31.22 | 45.26 | 98.98 | 34.09 | 7.54 | 5.14 | 2.78 | - | - | 0.66 | 29.66 | 19.22 | 274.54 |
| 2011 | 15.33 | 44.60 | 60.67 | 100.67 | 16.72 | - | - | - | - | 2.54 | 33.34 | 10.49 | 284.36 |
| 2012 | 22.48 | 34.74 | 257.92 | 98.72 | 11.16 | 0.53 | - | 0.07 | 0.07 | 2.33 | 17.14 | 20.14 | 465.30 |
| 2013 | 51.35 | 106.01 | 108.52 | 50.13 | 3.95 | - | - | - | 1.60 | 19.10 | 40.68 | 12.89 | 394.24 |
| 2014 | 57.95 | 22.33 | 103.83 | 53.90 | 5.70 | 2.42 | 0.00 | 11.40 | 3.38 | 5.86 | 38.38 | 30.84 | 335.99 |
| 2015 | 57.95 | 104.30 | 25.34 | 15.38 | 10.83 | 0.12 | - | 15.32 | 5.28 | 1.32 | 33.39 | 29.56 | 298.79 |
| 2016 | 45.74 | 53.02 | 24.89 | 45.51 | 12.79 | - | - | - | 0.00 | 5.12 | 56.27 | 16.65 | 259.98 |
| 2017 | 52.01 | 41.99 | 34.60 | 41.18 | 0.53 | - | - | 10.52 | 8.42 | 2.02 | 40.80 | 29.72 | 261.79 |
| Total | 334.02 | 452.23 | 714.75 | 439.58 | 69.23 | 8.21 | 2.78 | 37.31 | 18.76 | 38.94 | 289.66 | 169.52 | 2574.99 |
| Ave. | 41.75 | 56.53 | 89.34 | 54.95 | 8.65 | 1.03 | 0.35 | 4.66 | 2.34 | 4.87 | 36.21 | 21.19 | 321.87 |
| % | 13.0% | 17.6% | 27.8% | 17.1% | 2.7% | 0.3% | 0.1% | 1.4% | 0.7% | 1.5% | 11.2% | 6.6% | 100.0% |
Remark: Ave. is the annual average of burned area in the unit 1000 ha/year during 2010 to 2017; % is the percentage of monthly burned area to the total burned area during 2010 to 2017.
Figure A1.
Spatial allocation of (a) paddy fields obtained from land use information (2014) of Land Development Department (LDD), Thailand [1] and 16 provinces employed as a sample for data collection through the use of questionnaires and (b) paddy harvested areas in 2018 derived from the Moderate Resolution Imaging Spectroradiometer (MODIS).

Figure A2.
Rice residue density (BL) in each province, classified by water regime: (a) irrigated fields; (b) rain-fed fields obtained the result from Cheewaphongphan P. et al. (2018) [30].
Figure A2.
Rice residue density (BL) in each province, classified by water regime: (a) irrigated fields; (b) rain-fed fields obtained the result from Cheewaphongphan P. et al. (2018) [30].

Figure A3.
(a) Spatial distribution of the MCD64A1 monthly gridded 500-m product occurred in paddy field area during 2010 to 2017 and the location of four monitoring station sites selected for this study, (b) the fraction of emissions from rice residue open burning distribution on a yearly scale.
Figure A3.
(a) Spatial distribution of the MCD64A1 monthly gridded 500-m product occurred in paddy field area during 2010 to 2017 and the location of four monitoring station sites selected for this study, (b) the fraction of emissions from rice residue open burning distribution on a yearly scale.

References
- Land Development Department (LDD). Geographic Information System Soil and Land Use of Thailand; Land Development Department: Bangkok, Thailand, 2014. Available online: http://www.go.th/gisweb/ (accessed on 1 September 2017).
- Cheewaphongphan, P.; Garivait, S. Bottom up approach to estimate air pollution of rice residue open burning in Thailand. Asia-Pac. J. Atmos. Sci. 2013, 49, 139–149. [Google Scholar] [CrossRef]
- Poungchompu, S.; Chantanop, S. Economic Aspects of Rice Combine Harvesting Service for Farmer in Northeast Thailand. Asian Soc. Sci. 2016, 12, 201–211. [Google Scholar] [CrossRef]
- Titapiwatanakun, B. The Rice Situation in Thailand; Asian Development Bank: Manila, Philippines, 2012; pp. 1–6. Available online: https://www.adb.org/sites/default/files/project-document/73082/43430-012-reg-tacr-03.pdf (accessed on 15 March 2018).
- Office of Agricultural Economics (OAE). Agricultural Statistics of Thailand 2016; OAE: Bangkok, Thailand, 2016; pp. 1–8. Available online: http://organic.dit.go.th/FILE/CONTENT_FILE/256010251137581209704.pdf (accessed on 10 August 2018).
- Chiaranaikun, K. Research and Development on the Use of Rice Transplanter for Seed Production Field. Available online: http://agris.fao.org/agris-search/search.do?recordID=TH2015000335 (accessed on 15 November 2017).
- Garivait, S. Monitoring and Assessment of Biomass Open Burning in Agricultural Areas/Lands in Thailand; Pollution Control Department: Bangkok, Thailand, 2005; p. 60.
- Gadde, B.; Bonnet, S.; Menke, C.; Garivait, S. Air pollutant emissions from rice straw open field burning in India, Thailand, and the Philipines. Environ. Pollut. 2009, 157, 1554–1558. [Google Scholar] [CrossRef] [PubMed]
- Chung, C.E.; Ramanathan, V.; Kim, D.; Podgorny, I.A. Global anthropogenic aerosol direct forcing derived from satellite and ground-based observations. J. Geophys. Res. 2005, 110, 24207. [Google Scholar] [CrossRef]
- Bond, T.C.; Doherty, S.J.; Fahey, D.W.; Forster, P.M.; Berntsen, T.; DeAngelo, B.J.; Flanner, M.G.; Ghan, S.; Kärcher, B.; Koch, D.; et al. Bounding the role of black carbon in the climate system: A scientific assessment. J. Geophys. Res. 2013, 118, 5380–5552. [Google Scholar] [CrossRef] [Green Version]
- Tanvir, A.; Bashir, A. Why Do Farmers Burn Rice Residue? Examining Farmers’ Choices in Punjab; South Asian Network for Development and Environmental Economics (SANDEE): Kathmandu, Pakistan, 2013; pp. 1–2. Available online: http://www.sandeeonline.org/uploads/documents/publication/1006_PUB_Working_Paper_76_Tanvir.pdf (accessed on 30 April 2018).
- Ramanathan, V.; Crutzen, P.J. New directions: Atmospheric brown clouds. Atmos. Environ. 2003, 37, 4033–4035. [Google Scholar] [CrossRef]
- Lin, N.H.; Sayer, A.M.; Wang, S.H.; Loftus, A.M.; Hsiao, T.C.; Sheu, G.R.; Hsu, N.C.; Tsay, S.C.; Chantara, S. Interactions between biomass-burning aerosols and clouds over Southeast Asia: Current status, challenges, and perspectives. Environ. Pollut. 2014, 195, 292–307. [Google Scholar] [CrossRef] [PubMed]
- Gautam, R.; Hsu, N.C.; Eck, T.F.; Holben, B.N.; Janjai, S.; Jantarach, T.; Tsay, S.C.; Lau, K.M. Characterization of aerosols over the Indochina peninsula from satellite-surface observations during biomass burning pre-monsoon season. Atmos. Environ. 2013, 78, 51–59. [Google Scholar] [CrossRef]
- Jian, Y.; Fu, T.M. Injection heights of springtime biomass-burning plumes over peninsular Southeast Asia and their impacts on long-range pollutant transport. Atmos. Chem. Phys. 2014, 14, 3977–3989. [Google Scholar] [CrossRef] [Green Version]
- Pani, S.K.; Lin, N.H.; Chantara, S.; Wang, S.H.; Khamkaew, C.; Prapamontol, T.; Janjai, S. Radiative response of biomass-burning aerosols over an urban atmosphere in northern peninsular Southeast Asia. Sci. Total Environ. 2018, 633, 892–911. [Google Scholar] [CrossRef] [PubMed]
- Tsay, S.C.; Maring, H.B.; Lin, N.H.; Buntoung, S.; Chantara, S.; Chuang, H.C.; Gabriel, P.M.; Goodloe, C.S.; Holben, B.N.; Hsiao, T.C.; et al. Satellite-surface perspectives of air quality and aerosol-cloud effects on the environment: An overview of 7-SEAS/BASELInE. Aerosol Air Qual. Res. 2016, 16, 2581–2602. [Google Scholar] [CrossRef]
- Phairuang, W.; Hata, M.; Furuuchi, M. Influence of agricultural activities, forest fires and agro-industries on air quality in Thailand. J. Environ. Sci. 2017, 52, 85–97. [Google Scholar] [CrossRef] [PubMed]
- Vichitvadakan, N.; Vajanapoom, N. Health Impact from Air Pollution in Thailand: Current and Future Challenges. Environ. Health Perspect. 2011, 119, 197–198. [Google Scholar]
- Chang, C.H.; Liu, C.C.; Tseng, P.Y. Emissions inventory for rice straw open burning in Taiwan based on burned area classification and mapping using Formosat-2 satellite imagery. Aerosol Air Qual. Res. 2013, 13, 474–487. [Google Scholar] [CrossRef]
- Pollution Control Department (PCD). Thailand State of Pollution Report 2017; Pollution Control Department: Bangkok, Thailand, 2017. Available online: http://www.pcd.go.th/file/AW-Pollution-Report2017.pdf (accessed on 20 August 2018).
- AATHP−ASEAN Agreement on Transboundary Haze Pollution; The ASEAN Secretariat Community Relations Division: Jakarta, Indonesia, 2002; Available online: file:///H:/Paper%20rice%20straw%20burning/Ref%20used/AATHP-reprint.pdf (accessed on 30 September 2017).
- Pollution Control Department (PCD). Pollution Control Plan 2012–2016; Pollution Control Department: Bangkok, Thailand, 2012; p. 38. Available online: http://infofile.pcd.go.th/mgt/Pcd_plan55to59.pdf (accessed on 30 September 2017).
- Department of Alternative Energy Development and Efficiency (DEDE). Alternative Energy Development Plan: AEDP2015; Bangkok, DEDE: Thailand, 2015; pp. 1–20. Available online: http://www.eppo.go.th/images/POLICY/ENG/AEDP2015ENG.pdf (accessed on 30 September 2017).
- Sahapattana, P. Rice Pledging Scheme: A High-Stakes Risk for the Big Players. NIDA Case Res. J. 2015, 7, 60–83. [Google Scholar]
- Prasertsri, P. Thailand Grain and Feed Update—January 2017; Global Agricultural Information Network USDA Agricultural Service: Washington, DC, USA, 2017. Available online: https://gain.fas.usda.gov/Recent%20GAIN%20Publications/Grain%20and%20Feed%20Update%20-%20January%202017_Bangkok_Thailand_1-18-2017.pdf (accessed on 1 October 2018).
- Seiler, W.; Crutzen, P.J. Estimates of gross and net fluxes of carbon between the biosphere and the atmosphere from biomass burning. Clim. Chang. 1980, 2, 207–247. [Google Scholar] [CrossRef]
- Intergovernmental Panel on Climate Change (IPCC). Revised 1996 IPCC Guidelines for National Greenhouse Gas Inventories; Greenhouse Gas Inventory Reference Manual; Houghton, J.T., Filho, L.G.M., Lim, B., Tranton, K., Mamaty, I., Bonduki, Y., Griggs, D.J., Callander, B.A., Eds.; Meteorological Office: Bracknell, UK, 1997; Volume 3, p. 482. [Google Scholar]
- Streets, D.G.; Yarber, K.F.; Woo, J.H.; Carmichael, G.R. Biomass burning in Asia: Annual and seasonal estimates and atmospheric emissions. Glob. Biogeochem. Cycles 2003, 17, 1099. [Google Scholar] [CrossRef]
- Kim Oanh, N.T.; Permadi, D.A.; Hopke, P.K.; Smith, K.R.; Dong, N.P.; Dang, A.N. Annual emissions of air toxics emitted from crop residue open burning in Southeast Asia over the period of 2010–2015. Atmos. Environ. 2018, 187, 163–183. [Google Scholar] [CrossRef]
- Kim Oanh, N.T.; Bich, T.L.; Tipayarom, D.; Manandhar, B.R.; Prapat, P.; Simpson, C. Characterization of particulate emission from open burning of rice straw. Atmos. Environ. 2011, 45, 493–502. [Google Scholar] [CrossRef] [PubMed]
- Kim Oanh, N.T.; Tipayarom, A.; Ly Bich, T.; Tipayarom, D.; Simpson, C.D.; Hardie, D.; Liu, L.J.S. Characterization of gaseous and semi-volatile organic compounds emitted from field burning of rice straw. Atmos. Environ. 2015, 119, 182–191. [Google Scholar] [CrossRef]
- Zhang, Y.; Shao, M.; Lin, Y.; Luan, S.; Mao, N.; Chen, W.; Wang, M. Emission inventory of carbonaceous pollutants from biomass burning in the Pearl River Delta Region, China. Atmos. Environ. 2013, 76, 189–199. [Google Scholar] [CrossRef]
- Ni, H.; Han, Y.; Cao, J.; Antony Chen, L.W.; Tian, J.; Wang, X.; Chow, J.C.; Watson, J.G.; Wang, Q.; Wang, P.; et al. Emission characteristics of carbonaceous particles and trace gases from open burning of crop residues in China. Atmos. Environ. 2015, 123, 399–406. [Google Scholar] [CrossRef]
- Hays, M.D.; Fine, P.M.; Geron, C.D.; Kleeman, M.J.; Gullett, B.K. Open burning of agricultural biomass: Physical and chemical properties of particle-phase emissions. Atmos. Environ. 2005, 39, 6747–6764. [Google Scholar] [CrossRef]
- Andreae, M.O.; Merlet, P. Emissions of trace gases and aerosols from biomass burning. Glob. Biogeochem. Cycles 2001, 15, 955–966. [Google Scholar] [CrossRef]
- Akagi, S.K.; Yokelson, R.J.; Wiedinmyer, C.; Alvarado, M.J.; Reid, J.S.; Karl, T.; Crounse, J.D.; Wennberg, P.O. Emission factors for open and domestic biomass burning for use in atmospheric models. Atmos. Chem. Phys. 2011, 11, 4039–4072. [Google Scholar] [CrossRef]
- Yokelson, R.J.; Crounse, J.D.; DeCarlo, P.F.; Karl, T.; Urbanski, S.; Atlas, E.; Campos, T.; Shinozuka, Y.; Kapustin, V.; Clarke, A.D. Emissions from biomass burning in the Yucatan. Atmos. Chem. Phys. 2009, 9, 5785–5812. [Google Scholar] [CrossRef] [Green Version]
- Christian, T.; Kleiss, B.; Yokelson, R.J.; Holzinger, R.; Crutzen, P.J.; Hao, W.M.; Saharjo, B.H.; Ward, D.E. Comprehensive laboratory measurements of biomass-burning emissions: 1. Emissions from Indonesian, African, and other fuels. J. Geophys. Res. 2003, 108, 4719. [Google Scholar] [CrossRef]
- Kanokkanjana, K.; Garivait, S. Emission Factors of Particulate Matter Emission from Rice Field Residues Open Burning in Thailand. In Proceedings of the Climate Thailand Conference, Nonthaburi, Thailand, 19–21 August 2010; pp. 512–527. [Google Scholar]
- Jenkins, B.M.; Bhatnagar, A.P. On the electric power potential from paddy straw in the Punjab and the optimal size of the power generation station. Bioresour. Technol. 1991, 37, 35–41. [Google Scholar] [CrossRef]
- Kadam, K.L.; Forrest, L.H.; Jacobson, W.A. Rice straw as a lignocellulosic resource: Collection, processing, transportation, and environmental aspects. Biomass Bioenergy 2000, 18, 369–389. [Google Scholar] [CrossRef]
- Intergovernmental Panel on Climate Change (IPCC). Agriculture, Forestry and Other Land Use. In 2006 IPCC Guidelines for National Greenhouse Gas Inventories; Eggleston, H.S., Buendia, L., Miwa, K., Ngara, T., Tanabe, K., Eds.; Intergovernmental Panel on Climate Change: Hayama, Japan, 2006; Volume 4. [Google Scholar]
- Geo-Informatics and Space Technology Development Agency (GISTDA). The Use of Satellite Data to Monitor Cultivated Areas of the Country’s Economic Crops; Geo-Informatics and Space Technology Development Agency: Bangkok, Thailand, 2018; Available online: http://rice.gistda.or.th/ (accessed on 20 August 2018).
- Cheewaphongphan, P.; Junpen, A.; Kamnoet, O.; Garivait, S. Study on the Potential of Rice Straws as a Supplementary Fuel in Very Small Power Plants in Thailand. Energies 2018, 11, 270. [Google Scholar] [CrossRef]
- Office of Agricultural Economics (OAE). Rice Plantation Area, Rice Harvesting Area, Product, and Yield of Second Rice Classified by Rice Varieties, Regions, and Provinces in Crop Season 2015/2016; Office of Agricultural Economics: Bangkok, Thailand, 2015; pp. 47–72. Available online: http://www.oae.go.th/download/prcai/DryCrop/secondrice58/6.pdf (accessed on 30 September 2017).
- Tipayarom, D.; Kim Oanh, N.T. Effects from open rice straw burning emission on air quality in Bangkok Metropolitan Region. Sci. Asia 2007, 33, 339–345. [Google Scholar] [CrossRef]
- The Sustainable Mekong Research Network (SUMERNET). Final Report on the Project of “Turning Rice Straw into Cooking Fuel for Air Quality and Climate Co-Benefit in Selected GMS Countries (RS Co-Benefits)”; SUMERNET: Bangkok, Thailand, 2017. [Google Scholar]
- Land Processes Distributed Active Archive Center (LPDAAC). MCD64A1: MODIS/Terra and Aqua Burned Area Monthly L3 Global 500 m SIN Grid V006; USGS/Earth Resources Observation and Science (EROS) Center: Sioux Falls, South Dakota, 2015. Available online: https://lpdaac.usgs.gov/dataset_discovery/modis/modis_products_table/mcd64a1_v006 (accessed on 15 November 2017).
- Pollution Control Department (PCD). Thailand’s Air Quality and Situation Reports; Pollution Control Department: Bangkok, Thailand, 2018. Available online: http://air4thai.pcd.go.th/webV2/download.php (accessed on 1 October 2018).
- Zhuang, Y.; Li, R.; Yang, H.; Chen, D.; Chen, Z.; Gao, B.; He, B. Understanding Temporal and Spatial Distribution of Crop Residue Burning in China from 2003 to 2017 Using MODIS Data. Remote Sens. 2018, 10, 390. [Google Scholar] [CrossRef]
- Sun, J.; Peng, H.; Chen, J.; Wang, X.; Wei, M.; Li, W.; Yang, L.; Zhang, Q.; Wang, W.; Mellouki, A. An estimation of CO2 emission via agricultural crop residue open field burning in China from 1996 to 2013. J. Clean. Prod. 2016, 112, 2625–2631. [Google Scholar] [CrossRef]
- Fornacca, D.; Ren, G.; Xiao, W. Performance of Three MODIS Fire Products (MCD45A1, MCD64A1, MCD14ML), and ESA Fire_CCI in a Mountainous Area of Northwest Yunnan, China, Characterized by Frequent Small Fires. Remote Sens. 2017, 9, 1131. [Google Scholar] [CrossRef]
- Zhu, C.; Kobayashi, H.; Kanaya, Y.; Saito, M. Size-dependent validation of MODIS MCD64A1 burned area over six vegetation types in boreal Eurasia: Large underestimation in croplands. Sci. Rep. 2017, 7, 4181. [Google Scholar] [CrossRef] [PubMed]
- Office of the Cane and Sugar Board. Report on the Performance of Sugarcane and Sugar Production of Sugar Factories in Thailand; Ministry of Industry: Bangkok, Thailand, 2018. Available online: http://www.sugarzone.in.th/ (accessed on 1 October 2018).
- Food and Agriculture Organization (FAO). FAOSTAT Agricultural Database; Food and Agriculture Organization: Rome, Italy, 2001; Available online: http://faostat.fao.org/static/syb/syb_216.pdf (accessed on 30 September 2017).
Figure 1.
Annually temporal distribution of burned area occurred in the paddy field area derived by MCD64A1 product and planted area of off-season rice in Thailand during 2010–2017.
Figure 1.
Annually temporal distribution of burned area occurred in the paddy field area derived by MCD64A1 product and planted area of off-season rice in Thailand during 2010–2017.

Figure 2.
The monthly distribution of cumulative burned area occurred in the paddy field in Thailand derived from MCD64A1 during 2010–2017.
Figure 2.
The monthly distribution of cumulative burned area occurred in the paddy field in Thailand derived from MCD64A1 during 2010–2017.

Figure 3.
Comparison of temporal variation of rice residue open burning between the result from MCD64A1 and farmer’s survey from previous studies [2,45].

Figure 4.
Spatial distribution of annual PM2.5 emission from rice residue open burning in Thailand, 2018.
Figure 4.
Spatial distribution of annual PM2.5 emission from rice residue open burning in Thailand, 2018.

Figure 5.
Monthly temporal distribution of PM2.5 emission from rice residue open burning in Thailand, 2018.
Figure 5.
Monthly temporal distribution of PM2.5 emission from rice residue open burning in Thailand, 2018.

Figure 6.
Monthly variation of monthly average PM10 concentration at four air quality monitoring station sites during the period 2010–2017.
Figure 6.
Monthly variation of monthly average PM10 concentration at four air quality monitoring station sites during the period 2010–2017.

Figure 7.
Monthly temporal distribution of average PM10 concentration during the period 2010–2017.

Table 1.
Value of emission factors in each trace gas.
| Trace Gases | Emission Factor, EF (G of Trace Gases Per Kg Dry Matter Burned) |
|---|---|
| CO2 | (1177 a), 1105.2 c1, 1024 c2, 1393 d, 1515 f, 1585 g, 1185 h, 1160 i |
| CH4 | 9.6 a, 2.7 f, 5.2 f |
| CO | (93 a), 53.2 c1, 110.6 c2, 57.2 d, 92 f, 102 g, 132.2 h, 34.7 j |
| NOX | (0.49 a), 3.83 c1, 2.62 c2, 2.5 f, 3.11 g |
| SO2 | (0.51 b) |
| PM2.5 | (8.3 a), 12.1 c1, 18.3 c2, 8.5 d 12.95 e, 3.9 f, 6.26 g, 27.63 h |
| PM10 | (9.4 a), 14.0 c1, 20.6 c2, 13.0 f, 3.7 j |
| BC | (0.53 a), 0.69 f |
| OC | (3.1 a), 10.53 c1, 8.77 c2, 3.3 d, 8.94 e |
Note: in brackets are the all emission factors values used for this study derived by a Kim Oanh, N. T. et al. (2011) [31], except SO2 derived from b Kim Oanh, N. T. et al. (2015) [32]; c Zhang, Y. et al. (2013) [33] measured the emission factors in c1 flaming and c2 smoldering combustion; d Ni, H. et al. (2015) [34]; e Hays M. D. et al. (2005) [35]; f Andrea, M. O. and Merlet, P. (2001) [36]; g Akagi S. K. et al. (2011) [37]; h Kanokkanjana, K. and Garivait, S. (2010) [40]; i Jenkins, B.M. and Bhatnagar, A.P. (1991) [41]; j Kadam, K.L. et al. (2000) [42].
Table 2.
Comparison of mass of dry matter burned and emissions between this study and other studies.
Table 2.
Comparison of mass of dry matter burned and emissions between this study and other studies.
| Reference a | Year | RRGb | RRBc | Md | Emissions (kt of Species) | |||
|---|---|---|---|---|---|---|---|---|
| (Mt) | (Mt) | (Mt) | CO2 (Mt) | CO | PM2.5 | PM10 | ||
| This study | 2018 | 61.87 | 14.23 | 4.54 | 5.34 | 422 | 38 | 43 |
| Reference [1] | 2010 | 54.25 | 8.50 | 7.57 | 10.29 | 787 | 70 | 80 |
| Reference [2] | 2008 | 117.7 | 18.19 | 12.55 | 14.87 | 1670 | 350 | 120 |
| Reference [3] | Ave. from 2002 to 2006 | 21.86 | 10.45 | 8.36 | 12.21 | 290 | 108 | 30.9 |
Remark: a From the previous studies as Reference [1] derived by Kim Oanh, N.T. et al. (2018) [30], Reference [2] derived by Cheewaphongphan, P. and Garivait, S. (2013) [2], Reference [3] derived by Gadde, B. et al. (2009) [8]; b RRG is the amount of rice residues generated in the field; c RRB is the rice residue subjected to open burning in the field; d M is the total mass of crop residues burned in the field.
Table 3.
Comparison of parameters and emission factors between this study and other studies.
| Reference a | Related Parameters | Emission Factor (g/kg Dry Matter Burned) | ||||
|---|---|---|---|---|---|---|
| FB b | CO2 | CO | PM2.5 | PM10 | ||
| This study | 0.0–0.36 (0.23) | 0.12–0.52 (0.34) | 1177 | 93.0 | 8.30 | 9.4 |
| Reference [1] | 0.25–0.90 (0.51) | 0.93 | 1177 | 93.0 | 8.30 | 9.4 |
| Reference [2] | 0.45 | 0.23–0.86 | 1185 | 133.2 | 27.63 | 9.4 |
| Reference [3] | 0.48 | 0.80 | 1460 | 34.7 | 12.95 | 3.9 |
Remark: in brackets are the average of parameter values. a From the previous studies as Reference [1] derived by Kim Oanh, N.T. et al. (2018) [30], Reference [2] derived by Cheewaphongphan, P. and Garivait, S. (2013) [2], Reference [3] derived by Gadde, B. et al. (2009) [8]. b FB is the fraction of rice residue subjected to open burning; c is the combustion factor.
© 2018 by the authors. Licensee MDPI, Basel, Switzerland. This article is an open access article distributed under the terms and conditions of the Creative Commons Attribution (CC BY) license (http://creativecommons.org/licenses/by/4.0/).
Share and Cite
MDPI and ACS Style
Junpen, A.; Pansuk, J.; Kamnoet, O.; Cheewaphongphan, P.; Garivait, S. Emission of Air Pollutants from Rice Residue Open Burning in Thailand, 2018. Atmosphere 2018, 9, 449. https://doi.org/10.3390/atmos9110449
AMA Style
Junpen A, Pansuk J, Kamnoet O, Cheewaphongphan P, Garivait S. Emission of Air Pollutants from Rice Residue Open Burning in Thailand, 2018. Atmosphere. 2018; 9(11):449. https://doi.org/10.3390/atmos9110449
Chicago/Turabian StyleJunpen, Agapol, Jirataya Pansuk, Orachorn Kamnoet, Penwadee Cheewaphongphan, and Savitri Garivait. 2018. "Emission of Air Pollutants from Rice Residue Open Burning in Thailand, 2018" Atmosphere 9, no. 11: 449. https://doi.org/10.3390/atmos9110449
Note that from the first issue of 2016, this journal uses article numbers instead of page numbers. See further details here.