A Comprehensive Approach to Assess the Hydrological Drought of Inland River Basin in Northwest China


1
Key Laboratory of Geographic Information Science (Ministry of Education), East China Normal University, Shanghai 200241, China
2
Research Center for East-West Cooperation in China, East China Normal University, Shanghai 200241, China
3
State Key Laboratory of Desert and Oasis Ecology, Xinjiang Institute of Ecology and Geography, Chinese Academy of Sciences, Urumqi 830011, China
4
School of Urban and Geography, Lanzhou City College, Lanzhou 730070, China
5
Faculty of Tourism Management, Shanxi University of Finance & Economics, Shanxi 030006, China
*
Author to whom correspondence should be addressed.
Atmosphere 2018, 9(10), 370; https://doi.org/10.3390/atmos9100370
Submission received: 28 July 2018
/
Revised: 19 September 2018
/
Accepted: 21 September 2018
/
Published: 22 September 2018
(This article belongs to the Special Issue Impacts of Climate Change on Water Resources)
Abstract
:How to measure and quantitatively assess hydrological drought (HD) in the inland river basins of Northwest China is a difficult problem because of the complicated geographical environment and climatic processes. To address this problem, we conducted a comprehensive approach and selected the Aksu River Basin (ARB) as a typical inland river basin to quantitatively assess the hydrological drought based on the observed data and reanalysis data during the period of 1980–2010. We used two mutual complementing indicators, i.e., the standardized runoff index (SRI) and standardized terrestrial water storage index (SWSI), to quantitatively measure the spatio-temporal pattern of HD, where the SRI calculated from the observed runoff data indicate the time trend of HD of the whole basin, while SWSI extracted from the reanalysis data indicate the spatial pattern of HD. We also used the auto-regressive distribution lag model (ARDL) to show the autocorrelation of HD and its dependence on precipitation, potential evapotranspiration (PET), and soil moisture. The main conclusions are as follows: (a) the western and eastern regions of the ARB were prone to drought, whereas the frequency of drought in the middle of the ARB is relatively lower; (b) HD presents significant autocorrelation with two months’ lag, and soil moisture is correlated with SWSI with two months’ lag, whereas PET and precipitation are correlated with SWSI with 1 month’ lag; (c) the thresholds of HD for annual PET, annual precipitation, and annual average soil moisture are greater than 844.05 mm, less than 134.52 mm, and less than 411.07 kg/m2, respectively. A drought early warning system that is based on the thresholds was designed.
1. Introduction
“Drought” is widely used by the academia community, but there are different meanings in different disciplines. It is often grouped into four basic types: (1) meteorological or climatological, (2) agricultural, (3) hydrological, and (4) socioeconomic [1]. Even in the same professional field, people have different understandings for drought. In hydrology, it refers to the abnormal hydrological phenomenon in which the runoff is lower than its normal value (mean value) or the water level of the aquifer is significantly reduced. The main feature is the shortage of water that is available in a basin during a certain period of time (month, season, or year) [2,3,4]. Linsley et al. [5] defined hydrological drought as a period during which streamflow cannot meet the water supply demand under a given water management plan. Previous studies had mostly assessed the hydrological drought (HD) from the perspective of drought indicators. Some of them believed that single-factor indicator can be well used to assess HD, such as Standardized Water Level Index (SWI), which was based on groundwater levels [6], Standardized Streamflow Index (SSI), which focused on streamflow [7], Standardized Runoff Index (SRI) that only considered runoff [8], and so on. Many studies had proved the applicability of these indicators in certain regions or time scales [9,10]. Others believed that single-factor indicators were comparatively one-sided, and they could not accurately reflect the drought if only used a single-factor indicator [11], thus constructing multi-factor indicators to assess HD. Currently, the comprehensive hydrological drought indicators that consider multi-factors are mainly the surface water supply index (SWSI) and the Palmer hydrological drought index (PHDI). SWSI was proposed by Shafer and Dezman in 1982, taking into account reservoir storage, runoff, precipitation, and snow accumulation [12]; PHDI was proposed by Karl in 1986 based on PDSI, which considered precipitation, evapotranspiration, runoff, and soil moisture, and other factors [13]. However, how to define whether hydrological drought occurs or not and what indicators are used to quantitatively assess hydrological droughts, which has not yet formed a unified understanding in different countries and regions [14,15].
Global warming profoundly affects the hydrological process, in particular, droughts and floods [16]. The northwestern arid region in the interior of China is one of the most sensitive regions for responding to global changes. It is the dry climate with scarce precipitation, strong evaporation, and scarce water resources; the geographical environment of mountains, basins, oasis, and deserts creates complex climatic, hydrological and ecosystem conditions [17]. Because of the difficulty in generating runoff in the plain of the desert basin, rivers entering the plains of the desert basin from the mountains become the main water resources. Due to the global warming, the water resources problem in this region will become more severe, and the resulting drought will become even more prominent. Therefore, a quantitative assessment of occurrence and development of HD in inland river basins has a great significance on the rational utilization of water resources in the region. In addition, due to the large area of this region and the scarcity of meteorological and hydrological stations [18], how to measure and quantitatively assess its HD and to make early warning is a difficult problem. Previous studies mainly used a small amount of observed data or reanalysis data to analyze the spatio-temporal variances of HD, while using multiple linear regression to analyze the effects of various variables on drought [19,20,21]. In the study of correlated variables of HD, scholars studied the correlation between correlated variables and HD, and they did not consider the impact of the lag of correlated variables on HD. For drought warning, mainly using the drought index calculated by runoff, land water reserve, base flow, and others to monitor, and rarely considered early warning from the perspective of correlated variables.
If the runoff is used to describe hydrological droughts in a basin, it means that the runoff continues to fall below a certain threshold for one or several periods. The threshold can be chosen based on the change of runoff or the water demand. Due to its simple calculation and data availability [4,22], we use SRI to assess the HD. The physical meaning is clear while using SRI to describe HD. However, in this study, the SRI time series is calculated based on the observation data of a specific basin control station of a river, it describes the water surplus-deficit of a specific basin in a specific period as a whole. The Northwest China is located in mountainous areas where hydrological stations are sparse and hydrological observation data is scarce [18], so it lacks spatial resolution and cannot portray water surplus-deficit on smaller spatial units. For an inland river basin in the vast northwestern region of China, it is not objective to describe its drought conditions as a whole while using only one indicator of SRI. In order to overcome this shortcoming of SRI, we also introduce an index that has spatial resolution, SWSI, which can complement each other and describes the hydrology of the inland river basin in northwestern China from the perspective of time and space.
It was for the above reasons that we selected the Aksu River Basin (ARB) as a typical inland river basin, based on observed data and reanalyzed data from 1980–2010, we first used two mutual complementing indicators of SRI and SWSI to describe the spatio-temporal pattern; then, we constructed the ARDL model to quantitatively evaluate the autocorrelation of HD and its dependence on correlated variables; finally, we used the piecewise regression model to analyze the thresholds of correlated variables to HD, and built a drought warning system from a new perspective (the perspective of correlated variables).
2. Materials and Methods
2.1. Study Area and Data
2.1.1. Study Area
The interphase geomorphic characteristics of mountains and basins form a unique water circulation system in the arid regions of northwestern China—inland river systems without hydraulic connections [16]. Water resources are formed and transformed during the water cycle of river basins, and rivers act as a link between mountainous regions, basin plains, oasis, and desertification systems. We select the ARB as a typical basin because it is the only tributary that supplies water to the Tarim River throughout the year, and the ARB also is a data-scarce mountain basin [23,24].
The Aksu River is a cross-border river, most of which is situated at Xinjiang and the other part is situated at Kyrgyzstan. The river has two major tributaries, Kumarak river (also known as the Kun Marek River) and Toshkent rivers, and it is supplied by precipitation and the melting of ice and snow [25]. The ARB is enclosed within latitudes 40°17′–42°27′ N and longitudes 75°35′–78°59′ E (Figure 1). The total area of ARB is 52,000 square kilometers, of which urban area is 33,000 square kilometers and Kyrgyzstan is 19,000 square kilometers. The ARB is away from the ocean and it belongs to the arid and semi-arid continental desert climate zone. The main climate features are: dryness, large evaporation, low precipitation, low temperature, long sunshine duration, and high total solar radiation [26]. In recent years, the temperature and precipitation all increased [27], so the drought also changed. The land use types in the ARB are mainly agricultural land (including cultivated land, woodland, and pasture) and unused land (unutilized land and other land), which account for 51% and 47% of the total land area, respectively [28]. In the past 10 years, the area of cultivated land and construction land has increased by about 1724.4 km2 and 129.4 km2, respectively. While the forest land, grassland, sandy land, saline-alkali land, and marshland are reduced [29]. Increasing cultivated land and construction land area will lead to an increase in water consumption. So, in order to meet the demand for water, some dams have been built in the ARB. In addition, it is mainly brown desert soil in this region with a lack of soil moisture, which is conducive to water evaporation. These natural conditions can easily cause HD.
2.1.2. Data
To assess the HD, we used the monthly runoff time series data and terrestrial water storage (TWS) spatial data from 1980 to 2010. Runoff data were provided by the Xinjiang Tarim River Basin Authority. There are three hydrological stations (Xiehela, Shaliguilanke, and Xidaqiao) in Aksu River basin, of which Xiehela and Shaliguilanke are the hydrological stations of the upstream tributaries, and Xidaqiao is the mountain exit hydrological station. The runoff in Xiehela and Shaliguilanke is aggregated into Xidaqiao. So, the runoff in Xidaqiao is used to represent the runoff of the entire basin. The two stations of Xiehela and Shaliguilanke are located in the mountainous area (the source area of the river) where human activities are relatively rare. Therefore, it was assumed that the observed data can reflect natural conditions [27]. Based on the research, the sum of soil moisture storage (0–10 cm, 10–40 cm, 40–100 cm, and 100–200 cm), snow water equivalent, canopy water storage, and surface runoff is considered as the terrestrial water storage to compute the SWSI [30,31,32]. The data of soil moisture storage, snow water equivalent, canopy water storage, and surface runoff are from GLDAS (Global Land Data Assimilation System) provided by NASA (National Aeronautics and Space Administration) (https://disc.gsfc.nasa.gov/datasets?keywords=Hydrology), which are stored at the monthly scale. The spatial resolution of soil moisture, snow water equivalent and canopy water storage is 0.25° × 0.25°, and the spatial resolution of surface runoff data is 1° × 1° and the data is resampled while using ArcGIS 10.5 software. Data extraction of soil moisture storage, snow water equivalent, canopy water storage, and surface runoff was undertaken using R software programming. To analyze the relationship between SWSI and its correlated variables, the data of daily precipitation (mm/day), daily maximum temperature (°C), daily minimum temperature (°C), daily relative humidity (%), daily sunshine duration (SD) (h/day), and daily average wind velocity (AWE) (m/s) in the same period at nine meteorological stations (Wuqia, Kashi, Tuergart, Aheqi, Baicheng, Kuche, Aksu, Keping, and Alaer) were used. They are collected from China Meteorological Administration (http://www.cma.gov.cn/). The stations in the study area are sparse and unevenly distributed. In order to better reflect the spatial characteristics of HD in the region, we select the above nine meteorological stations [33]. Runoff and meteorological data are observed data, which are reliable; for GLDAS data, most scholars had confirmed the applicability of it in the inland arid region of Northwest China [34,35].
2.2. Methods
To measure and quantitatively assess HD in the ARB, we first used two mutual complementing indicators of SRI and SWSI to measure the spatio-temporal pattern of HD. Because SRI is one of the indicators that is commonly used by academia to describe HD, but it can only assess HD from time and it cannot assess HD from space in this study. Because SRI is calculated using observed data, and there are only limited hydrological stations in the ARB, SRI cannot be used to assess HD from space. Therefore, while using SRI for time series analysis, SWSI is used to assess HD from space. Then the ARDL model was used to show the autocorrelation of HD and its dependence on precipitation, potential evapotranspiration (PET), and soil moisture. Finally, we also identified the thresholds of the correlated variables to HD and give an early warning for HD (Figure 2).
2.2.1. Drought Indices
To compensate for the deficiencies of a single indicator, we use two mutual complementing hydrological drought indicators, namely SRI and SWSI, to analyze HD from a temporal and spatial perspective, respectively.
Standardized Runoff Index (SRI)
The SRI is a widely used index to assess the HD due to its simplicity and data availability [36]. The calculation method is as follows:
Assuming that the runoff x in a certain time period satisfies the Γ distribution probability density function f(x):
where and are the shape and scale parameters, respectively. x > 0, and can be calculated using the maximum likelihood method. is the Gamma function. The cumulative probability of runoff x at a given time scale is as follows:
Normalizing the probability of Γ distribution and obtained the following equation.
where F is the runoff distribution probability that is associated with the Γ function; and, S is the probability density coefficient. When F > 0.5, S = 1; when F ≤ 0.5, S = −1, = 2.515517, = 0.802853, = 0.010328, = 1.432788, = 0.189269, = 0.001308 [4].
Standardized Terrestrial Water Storage Index (SWSI)
SRI is calculated by the observed data in this paper, but there are three hydrological stations in the ARB, which can only show the temporal variation and cannot describe the spatial pattern. So, we use SWSI to show the spatial pattern based on the reanalysis data. The standardized terrestrial water storage index (SWSI) is an indicator of hydrological drought, which can be used to describe terrestrial water storage deficits. First, it should evaluate the degree of deviation of the actual distribution and standard normal distribution of terrestrial water storage data that is simulated by GLDAS while using a normal Q-Q plot [39]. As can be seen from Figure 3, terrestrial water storages are close to a normal distribution, so SWSI can be expressed as:
where represents the terrestrial water storage (terrestrial water storage is the sum of soil moisture storage, snow water equivalent, canopy water storage and surface runoff here) of year i and month j; is the mean value of terrestrial water storage for the jth month; and, is the standard deviation of terrestrial water storage for the jth month [39]. The drought classification standard is the same as SRI.
2.2.2. Auto-Regressive Distribution Lag Model (ARDL)
ARDL is a quantitative analysis method for long-term stable relationship between variables, which is widely used in the field of economics. ARDL model is linear time series models in which both the dependent and independent variables are related not only contemporaneously, but across historical (lagged) values as well [40]. ARDL model is especially advantageous in their ability to handle cointegration with inherent robustness to the misspecification of integration orders of relevant variables [41]. Drought is a continuous process, and it is not only affected by current correlated variables, but also by historical drought and historically correlated variables. We use the ADRL model to assess the autocorrelation of HD and its dependence on precipitation, PET, and soil moisture. The ADRL model was proposed by Jorgenson in 1966 [42]. The model is a distributed lag model that uses one or more lagged terms of the explained variable as explanatory variables. The general expression is as follows:
where is the explanatory variables, is the explained variable, and m and n is the maximum lag period of and , respectively, the optimal lag orders m and n (possibly different across regressors) can be obtained by minimizing a model selection criterion, e.g., the Akaike information criterion (AIC) or the Bayesian information criterion (BIC); p is the number of explanatory variables; is the constant; and are regression coefficients; and, is a white noise.
The sequence {} is a white-noise process if for each period t,
If the values of are treated as given and is not associated with , the method of least square (OLS, its essence is to find the best function match of the data by minimizing the sum of the squares of the errors) would be used to estimate the parameters. However, if is simultaneously determined with and E() ≠ 0, OLS would be inaccurate. As long as it can be assumed that the error term is a white noise process, or more generally, it is stationary and independent of ,,⋯and ,,⋯, the ARDL models can be estimated consistently by ordinary least squares [42].
ARDL models are de facto the standard of estimation when one chooses to remain agnostic about the orders of integration of the underlying variables. It is precisely in this regard where the ARDL methodology shines [43].
2.2.3. Threshold Analysis
When an explanatory variable of the ARDL model reaches a certain threshold, the drought may occur in the region. In order to identify the thresholds of the correlated variables to HD and prepare for drought early warning, the piecewise regression is used to analyze this problem. Piecewise regression is a method of studying the relationships between two or more random variables at different stages. It is a “broken-stick” model, where two or more lines are joined at unknown point(s), called “breakpoint(s),” representing the threshold(s) [44]. It means that the explained variable Y and the explanatory variable X obey a certain relation within a certain range, and they follow another relation in another range. The general form of the piecewise regression model is as follows:
where represents the ith observed value (i.e., the explained variable); represents the value associated with the explained variable (ie, the explanatory variable); represents a breakpoint; represents a random disturbance term; and, and β1 + β2 represents the slope of the line. It can be seen that β2 can be expressed as the difference in the slope of the two straight lines [45]. The breakpoint is estimated by non-parametric method and its 95% confidence intervals represents the threshold range [44]. The commonly used method is the Bootstrap method that is a nonparametric resampling method. Model (7) is the simplest piecewise regression model, and it had different forms of improvement after the exploration by scholars [46,47].
3. Results
3.1. The Spatio-Temporal Pattern of HD
We first use SRI to assess the time trend of HD based on observed data of runoff. There are different time scales for SRI, such as one month, three months, six months, and 12 months. We use a three months’ scale SRI to assess the HD in the ARB because of its widespread use and better description of drought conditions [4,48]. Figure 4 reveals the fluctuations of time series of SRI in the ARB during 1980–2010. It is clear that the SRI shows a nonlinear and nonstationary variation. However, it shows a significant upward trend (F = 67.03 and its P-value shows that it passes the 1% significance test) as a whole, which means that the ARB was getting wetter during the study periods. Zhang et al. [49] also pointed out that the number of HD in ARB had gradually decreased.
Table 2 shows the drought year evaluated by SRI. There are 17 drought years during the study periods. The 1980s is a concentrated period of drought, and after the 1980s, it was a wet concentration period. This also show that the ARB was getting wetter during the study periods.
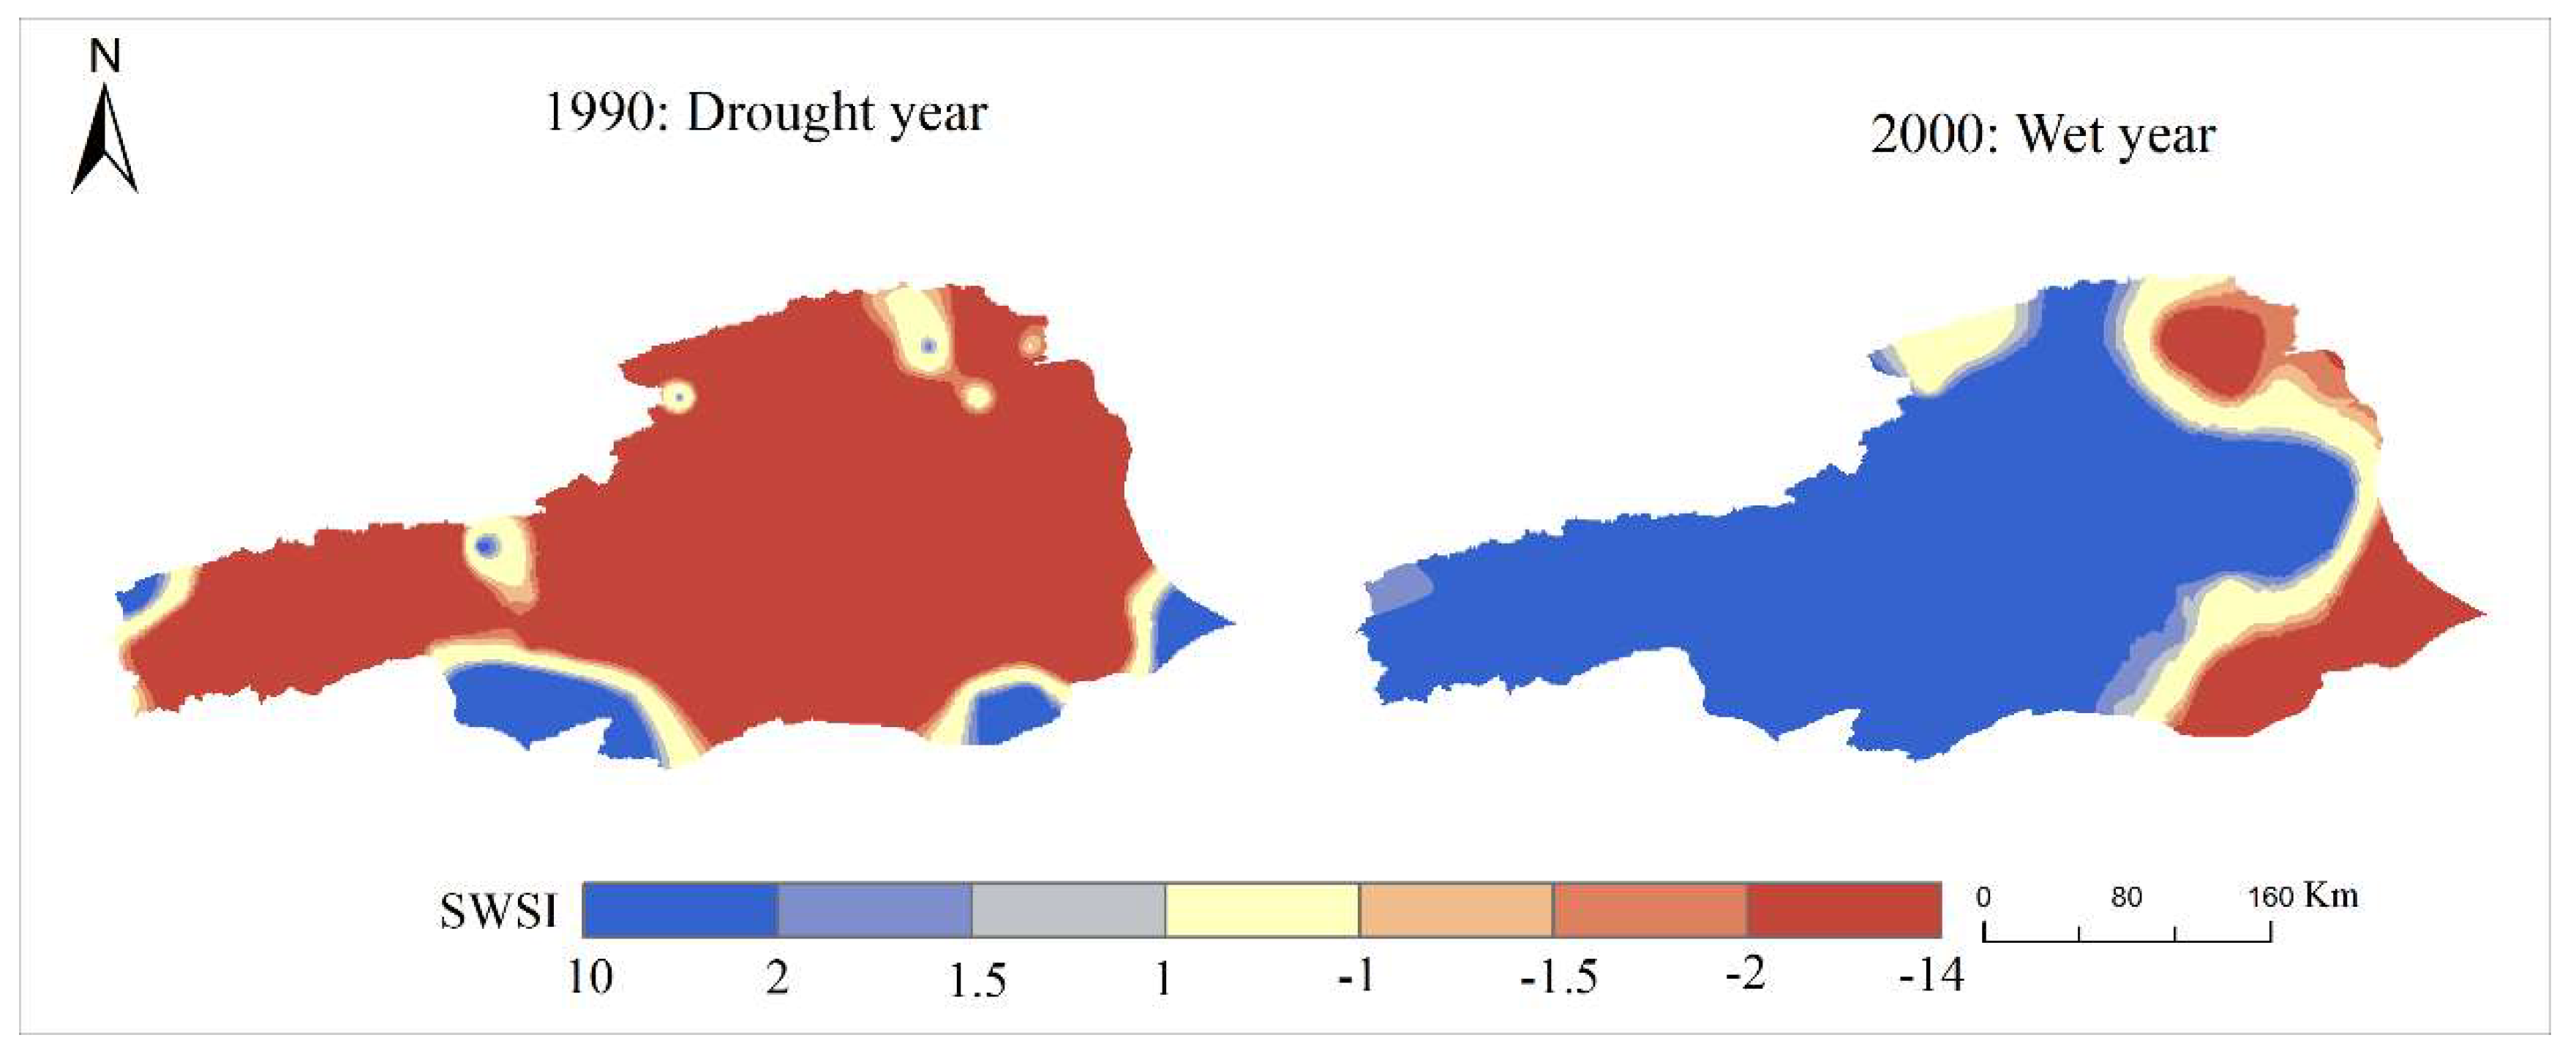
The SRI can only show the time trend of HD because of sparse stations. The large area of the ARB and the complex geography environment make the HD complex in space. We use the SWSI to evaluate the spatial pattern of HD. First, we use a spatially average value for the entire ARB basin to evaluate the drought years using the SWSI and use the same temporal series applied to compute the SRI. There are 15 drought years evaluated by SWSI and the results are similar to the results of SRI. It means that SWSI can also well reflect the HD of the ARB. Figure 5 shows the spatial pattern of HD in a drought year and a wet year. As can be seen from the figure, drought year does not mean that HD occurs in the entire basin, but drought occurs in most of the areas, and some areas are still wet; in non-drought year, not all areas are wet, and HD still occurs in some areas.
The frequency and the trend of HD are different in space. Figure 6 indicates that the western and the eastern regions of the ARB are prone to drought, whereas the number of droughts in the middle of the ARB are relatively lower. There are many people and farmland in the eastern region, and they need a large amount of water for irrigation and living, which easily leads to HD. The precipitation is relatively small in the western region [50], so the HD often occurs. Figure 7a indicates that the eastern region is becoming wet, while the western region is becoming dry during the study periods. The p-value shows that they all passed the significant test (1% significance level, 5% significance level, or 10% significance level) (Figure 7b). Wang et al. [50] found that the temperature in the eastern region was higher than the temperature in the western region, and there was a large amount of glaciers in the east. The melting of ice and snow will increase the runoff in the eastern region, and the study also found that precipitation in the east also increased [50]. So, there is a tendency to get wet in the eastern region. However, in the western region, due to less glaciers and precipitation, it gradually become drought in the context of global warming.
3.2. The Autocorrelation of HD and Its Dependence on Precipitation, PET and Soil Moisture
Drought results from a combination of natural and human activities, and there are many correlated variables affect drought, such as temperature, precipitation, soil moisture, and so on. Many scholars have studied the relationship between drought and correlated variables [46,51,52], but the role of correlated variables in different regions are not the same, which requires specific analysis in different regions. So, we select average temperature, average pressure, relative humidity, maximum temperature, daily maximum wind velocity, soil moisture, PET, and precipitation as the correlated variables of the HD in the ARB. We think these correlated variables directly or indirectly affect the terrestrial water storage (or runoff) in this region, which in turn, will have an impact on hydrological drought. In addition, the HD is a continuous process. It is not only affected by contemporaneous correlated variables, but also affected by historical HD and historically correlated variables, which means that the correlated variables have a delay effect on HD. Previous studies only focused on the contemporaneous correlation between correlated variables and drought, and did not consider the delay effect of correlated variables on HD [46,51]. So, we use the ADRL model to analyze the autocorrelation of HD and its dependence on precipitation, PET and soil moisture, which can re-recognize the relationship between HD and correlated variables from the perspective of the delay effect of correlated variables on HD. There is a large area and the complex geographical environment in the ARB, so we use SWSI for regression analysis because SWSI covers most of the region.
Previous studies only selected some correlated variables that are theoretically considered to be significantly relevant to HD to study the relationship between HD and correlated variables, which may result in the inaccurate or incomplete selection of correlated variables [51,52]. In order to solve this problem, we use a stepwise regression model to filter the above eight variables, removing collinear variables and those that have no significant effect on HD. Finally, we obtain three optimal variables, namely precipitation, PET, and soil moisture. In addition, we also tested the Variance Inflation Factor (VIF) on these three variables. VIF is used to detect whether there is collinearity between variables. If VIF < 5, it means that the variable does not have collinearity, otherwise, there is collinearity. The results showed that the VIF values of the three variables were less than 5 (VIFPET = 1.74; VIFprecipitation = 1.61; VIFsoil moisture = 1.35), indicating that there was no collinearity between them, that is, they are independent of each other. The ARDL model requires that each time series is stationary. The ADF is used to detect if the time series is stable. If the ADF passes the significance test, it is a stationary sequence, otherwise, it is a non-stationary sequence. Table 3 shows the ADF test for four time series, and the results of each time series all pass the significance test, which indicates that all of the sequences are stable. According to the principle of minimum AIC, the optimal result of the ARDL model is obtained (Table 4).
From Table 4 we can see that F-statistic is 936.4129 and it passes the significant test, indicating that the model is significant. The value of Durbin-Watson stats indicates that the ARDL model possesses good description ability. SWSI presents significant autocorrelation with two months’ lag, indicating that the occurrence of a HD is affected by the HD in the first two months. The coefficients of SWSI (−1) and SWSI (−2) are positive, which means that historical drought will induce the HD in this month or increase the level of drought in this month. PET and precipitation is correlated with SWSI with one month’s lag, and the coefficients of PET and PET (−1) are negative and they all pass the significant test. The greater the PET or PET (−1), the more conducive to the occurrence of HD. However, the coefficient of contemporaneous precipitation does not pass the significance test. SWSI is a comprehensive reflection of precipitation, snow water, soil moisture storage, and so on. The precipitation here does not pass the significance test, which may be caused by the effects of snow water and soil moisture storage. However, there is a significant correlation between precipitation (−1) and SWSI. The more precipitation in the last month, the less prone to HD this month. Soil moisture is correlated with SWSI with two months’ lag. There is a positive correlation between contemporaneous soil moisture and soil moisture (−2) and SWSI, but the negative correlation between soil moisture (−1) and SWSI. In general, the higher the soil moisture, the less likely the HD is. However, there is the opposite result here, that is, the higher the soil moisture last month, will promote the HD this month, might be due to the interaction of various correlated variables. The specific reasons have yet to be further studied. In summary, the effect of correlated variables on HD is complex. The atmospheric circulation and human activities also affect HD, which will be our future research goal.
3.3. The Thresholds of the Correlated Variables to HD
Drought will cause huge economic losses, so drought early warning is crucial. Although the occurrence of HD is unavoidable, we can give early warning of HD to reduce the damage that is caused by drought. Many scholars have studied the early warning from the perspective of various drought indices [53,54,55]. However, we conduct drought monitoring and early warning from the perspective of the thresholds of correlated variables of HD. We think that as long as one correlated variable exceeds a certain critical value, HD may occur and early warning should be issued. Based on this, piecewise regression model is used to study the thresholds of correlated variables to HD and explore the drought early warning. The relationship between different correlated variables and SWSI will change after the breakpoint. This model has been widely used in meteorology and hydrology, but it only explores the threshold of relevant variables, and it does not use this as a basis for drought early warning [56,57,58]. Table 5 gives the result of piecewise regression.
The table shows the estimates of breakpoint and approximate 95% confidence intervals. The breakpoints of PET, Precipitation, and soil moisture are 891.242 mm, 113.037 mm, and 397.98 kg/m2, respectively. It means that, on both sides of the breakpoint, PET, precipitation, and soil moisture have different effects on HD. In order to prepare for early warning, we set the boundary value of 95% confidence interval set as the threshold as the upper or lower limit of the early warning. From Table 6, it can be seen that the thresholds for annual PET, annual precipitation, and annual average soil moisture are greater than 844.05 mm, less than 134.52 mm, and less than 411.07 kg/m2, respectively. It means that when these correlated variables in their corresponding threshold, drought may occur.
In order to verify the rationality of the thresholds derived from the piecewise regression, we calculated the actual values of PET, precipitation, and soil moisture in the historical drought years of the ARB, and compared them with the thresholds that we obtained. According to “China Meteorological Disaster Code (Xinjiang Volume)” and “Xinjiang Statistical Yearbook”, the drought years in the history of the ARB were 1980, 1981, 1985, 1989, 1991, 1993, 2008, and 2010 during the period of 1980–2010. First, we separately calculated the actual values of annual PET, annual precipitation, and annual average soil moisture in historical drought years, and gave the average values for many years, they are 824.00 mm, 157.61 mm, and 385.30 kg/m2, respectively. Then, we made the t-test on the above actual values of the correlated variables and the thresholds calculated by the model, and the p-value is 0.67, indicating that there is no significant difference between the actual values and the thresholds, that is, the thresholds that we obtained are reasonable.
Based on this, we conduct drought warning and classify the warning levels according to the thresholds range of the correlated variables (Table 7). If annual PET > 844.05 mm and annual Precipitation < 134.52 mm and annual average Soil Moisture < 411.07 kg/m2, we would perform a one-level early warning; If (annual PET > 844.05 mm and annual Precipitation < 134.52 mm) or (annual Precipitation < 134.52 mm and annual average Soil Moisture < 411.07 kg/m2) or (annual PET > 844.05 mm and annual average Soil Moisture < 411.07 kg/m2), we would perform a two-level early warning; If annual PET > 844.05 mm or annual Precipitation < 134.52 mm or annual average Soil Moisture < 411.07 kg/m2, we would perform a three-level early warning.
4. Discussion
This study first assessed the spatio-temporal variation of HD in the ARB using two complementary indices. Then we showed the autocorrelation of HD and its dependence on precipitation, PET and soil moisture. We found that it showed a trend of getting wet in the entire basin, but there was a difference in space. In addition, HD presents significant autocorrelation with two months’ lag, and soil moisture is correlated with SWSI with two months’ lag, whereas PET and precipitation are correlated with SWSI with 1 month’ lag. Then, we developed a HD warning system according to the threshold of correlated variables to HD.
We used two indices to assess the HD in order to make up for the insufficient and unreliable of an index. We can understand the HD in the ARB from the perspective of time and space. Under the global warming, precipitation in the northwest China had suddenly increased since 1990s, and glacial meltwater was also in the process of intense ablation [59], so the ARB became wet during the period of 1980–2010. Our result was consistent with the previous studies [49,60,61]. After 1990s, the fluctuation of SRI is large, mainly because the impact of human activities was intensified in addition to the effects of climate change. A continuous wet year appeared after 2000, which is mainly due to the increase in precipitation and snow meltwater [49,50]. How the future HD in the region changes remains to be further explored. The spatial pattern of HD is different. The high frequency of HD occurred in the east and west, while the low frequency of HD occurred in the middle. There are small precipitation and glaciers in the west [18,50], so there was frequent drought. Although there are many precipitations and glaciers in the upper reaches of the eastern region [18,50], when the runoff flows through the middle and lower reaches, it is affected by a large number of human activities, making it a high-risk area for drought. It shows that human activities are the main cause of HD. Water is the source of life in the arid regions of the northwest China, so that people should pay attention to it and use it reasonably.
Due to lack of data, we only analyzed the natural variables affecting HD. Although previous studies have also explored the relationship between natural variables and HD [46,51,52], the correlated variables may vary from region to region due to regional differences. We selected precipitation, PET, and soil moisture through stepwise regression analysis, which is statistically significant and ensures that the variables are independent of each other. Unlike previous studies, they simply select variables from a theoretical perspective. In addition, we found that HD presents significant autocorrelation with two months’ lag, and soil moisture is correlated with SWSI with two months’ lag, whereas PET and precipitation are correlated with SWSI with one month’s lag. Previous studies have explored the contemporaneous correlation between HD and correlated variables, without considering the lag effect of correlated variables. Our results improve our understanding to the correlated variables of HD.
HD results from a combination of factors. The occurrence of HD will have a serious influence on the society economy. The earlier the drought warning is available, the more effective and successful the drought planning will be. There were a large number of drought early warning studies in the past [62,63,64]. Paulo et al. [55] used Markov and Loglinear models for drought early warning that is based on Standardized precipitation index (SPI); Huang and Yuan [65] developed an early warning system with recursive procedure that processes observations to renew the evaluation; Kogan [66] analyzed the effect of remote sensing on drought early warning based on Palmer Drought Severity Index (PDSI); and, Boken [67] thought the soil-moisture index and other variables derived from the rainfall data could be potential candidates for developing drought early warning models for arid regions. They can be divided into two types: one is to provide early warning through the drought index, and the other is to provide early warning through simulation. They all have their advantages. In order to expand the method of drought early warning, we propose a new perspective to study it, that is, to warn according to the threshold range of the correlated variables to HD. We find that the values of these correlated variables in the historical drought years are close to the threshold range we calculated, which shows that the proposed method is rational. However, in future research, we need do a more in-depth discussion.
5. Conclusions
We measured and quantitatively assessed the HD in the inland river basins of Northwest China from a new perspective. First, we use two mutually complementing indicators to explore the spatio-temporal pattern. Then, we not only analyzed the correlation between HD and correlated variables and its dependence on precipitation, PET and soil moisture, but also analyzed the autocorrelation of HD. Previous studies only considered the contemporaneous correlation between HD and correlated variables without considered its dependence on precipitation, PET and soil moisture. Our results raise awareness of the effects of correlated variables on drought. In addition, we use a piecewise regression model to conduct drought early warning from the threshold of correlated variables, which differs from previous studies in preparing drought early warning from the perspective of drought indicators. The main conclusions are as follows:
- The spatio-temporal pattern of HD was complex in the ARB. There was a tendency to become wet in the entire basin during the study periods. The high frequency of drought occurred in the east and west, whereas the low frequency of drought occurred in the middle. In addition, the drought year did not mean that drought would occur in the entire basin, and vice versa.
- The autocorrelation of HD and its dependence on precipitation, PET, and soil moisture were found. The occurrence of a drought was not only related to the contemporaneous correlated variables, but also related to historical drought and historically correlated variables. Among them, HD presents significant autocorrelation with two months’ lag, and soil moisture is correlated with SWSI with two months’ lag, whereas PET and precipitation are correlated with SWSI with one month’s lag.
- We developed a new early warning system according to the threshold range of the correlated variables to HD. One of the correlated variables achieve the corresponding threshold range to perform a three-level early warning, two correlated variables achieve the corresponding threshold range at the same time to perform a two-level early warning, and three correlated variables achieve the corresponding threshold range at the same time to perform a one-level early warning.
Although the ARB was selected as a representative of inland river basin, the approach that is presented in this study can also be applied to assess the hydrological drought of inland River Basin in Northwest China.
Author Contributions
N.Z. designed, carried out the analysis and wrote the manuscript. J.X. revised the paper and refined the results, conclusion and abstract. W.L. and K.L. discussed the results. C.Z. edited the English. All authors have approved the manuscript.
Funding
This research received no external funding.
Acknowledgments
This work was supported by the National Natural Science Foundation of China (Grant No. 41871025, 41661014); the Strategic Priority Research Program of the Chinese Academy of Sciences (Grant No. XDA19030204); and the Open Foundation of State Key Laboratory, Desert and Oasis Ecology, Xinjiang Institute of Ecology and Geography, Chinese Academy of Sciences (Grant No. G2014-02-07).
Conflicts of Interest
The authors declare no conflict of interest.
References
- Council, A.M.S. AMS statement on meteorological drought. Bull. Am. Meteorol. Soc. 2004, 85, 6. [Google Scholar]
- Keyantash, J.; Dracup, J.A. The quantification of drought: An evaluation of drought indices. Bull. Am. Meteorol. Soc. 2002, 83, 1167–1180. [Google Scholar] [CrossRef]
- Tallaksen, L.M.; Van Lanen, H.A. (Eds.) Hydrological Drought: Processes and Estimation Methods for Streamflow and Groundwater; Elsevier: Amsterdam, The Netherlands, 2004. [Google Scholar]
- Shukla, S.; Wood, A.W. Use of a standardized runoff index for characterizing hydrologic drought. Geophys. Res. Lett. 2008, 35, 1–7. [Google Scholar] [CrossRef]
- Linsley, R.K., Jr.; Kohler, M.A.; Paulhus, J.C.H. Hydrology for Engineers, 2nd ed.; McGraw-Hill: New York, NY, USA, 1975. [Google Scholar]
- Bhuiyan, C.; Singh, R.P.; Kogan, F.N. Monitoring drought dynamics in the Aravalli region (India) using different indices based on ground and remote sensing data. Int. J. Appl. Earth Obs. 2006, 8, 289–302. [Google Scholar] [CrossRef]
- Vicente-Serrano, S.M.; López-Moreno, J.I.; Beguería, S.; Lorenzo-lacruz, J.; Azorin-Molina, C.; Morán-Tejeta, E. Accurate computation of a streamflow drought index. J. Hydrol. Eng. 2011, 17, 318–332. [Google Scholar] [CrossRef]
- Morid, S.; Smakhtin, V.; Moghaddasi, M. Comparison of seven meteorological indices for drought monitoring in Iran. Int. J. Climatol. 2006, 26, 971–985. [Google Scholar] [CrossRef] [Green Version]
- Mo, K.C. Model-based drought indices over the United States. J. Hydrometeorol. 2008, 9, 1212–1230. [Google Scholar] [CrossRef]
- Deo, R.C.; Şahin, M. Application of the extreme learning machine algorithm for the prediction of monthly Effective Drought Index in eastern Australia. Atmos. Res. 2015, 153, 512–525. [Google Scholar] [CrossRef] [Green Version]
- Zhu, J.W.; Zhou, L.N.; Huang, S.Z. A hybrid drought index combining meteorological, hydrological, and agricultural information based on the entropy weight theory. Arab. J. Geosci. 2018, 11, 91. [Google Scholar] [CrossRef]
- Van Rooy, M.P. A rainfall anomaly index independent of time and space. Notos 1965, 14, 6. [Google Scholar]
- Karl, T.R. The sensitivity of the Palmer drought severity index and Palmer’s Z-index to their calibration coefficients including potential evapotranspiration. J. Clim. Appl. Meteorol. 1986, 25, 77–86. [Google Scholar] [CrossRef]
- Hisdal, H.; Tallaksen, L.M. Estimation of regional meteorological and hydrological drought characteristics: A case study for Denmark. J. Hydrol. 2003, 281, 230–247. [Google Scholar] [CrossRef]
- Fleig, A.K.; Tallaksen, L.M.; Hisdal, H.; Hannah, D.M. Regional hydrological drought in north-western Europe: Linking a new Regional Drought Area Index with weather types. Hydrol. Process. 2011, 25, 1163–1179. [Google Scholar] [CrossRef]
- Xu, J.H.; Chen, Y.N.; Bai, L.; Xu, Y.W. A hybrid model to simulate the annual runoff of the Kaidu River in northwest China. Hydrol. Earth Syst. Sci. 2016, 20, 1447–1457. [Google Scholar] [CrossRef] [Green Version]
- Xu, J.H.; Chen, Y.N.; Li, W.H.; Nie, Q.; Song, C.N.; Wei, C.M. Integrating wavelet analysis and BPANN to simulate the annual runoff with regional climate change: A case study of Yarkand River, Northwest China. Water Resour. Manag. 2014, 28, 2523–2537. [Google Scholar] [CrossRef]
- Xu, J.H.; Wang, C.; Li, W.H.; Zuo, J.P. Multi-temporal scale modeling on climatic-hydrological processes in data-scarce mountain basins of Northwest China. Arab. J. Geosci. 2018, 11, 423. [Google Scholar] [CrossRef]
- Li, J.B.; Gou, X.H.; Cook, E.R.; Chen, F.H. Tree-ring based drought reconstruction for the central Tien Shan area in northwest China. Geophys. Res. Lett. 2006, 33, 1–5. [Google Scholar] [CrossRef]
- Fang, K.Y.; Gou, X.H.; Chen, F.H.; Yang, M.X.; Li, J.B.; He, M.S.; Zhang, Y.; Tian, Q.H.; Peng, J.F. Drought variations in the eastern part of northwest China over the past two centuries: Evidence from tree rings. Clim. Res. 2009, 38, 129–135. [Google Scholar] [CrossRef]
- Zhai, L.X.; Feng, Q. Spatial and temporal pattern of precipitation and drought in Gansu Province, Northwest China. Nat. Hazards 2009, 49, 1–24. [Google Scholar] [CrossRef]
- Wang, D.; Hejazi, M.; Cai, X.; Volocchi, A.J. Climate change impact on meteorological, agricultural, and hydrological drought in central Illinois. Water. Resour. Res. 2011, 47. [Google Scholar] [CrossRef] [Green Version]
- Xu, J.H.; Chen, Y.N.; Li, W.H.; Ji, M.H.; Dong, S. The complex nonlinear systems with fractal as well as chaotic dynamics of annual runoff processes in the three headwaters of the Tarim River. J. Geogr. Sci. 2009, 19, 25–35. [Google Scholar] [CrossRef]
- Li, S.N.; Weng, B.S.; Yan, C.M.; Wang, J.W. Applicability analysis of SPI and SPEI in Aksu River basin. J. Water Resour. Water Eng. 2016, 27, 101–107. [Google Scholar]
- Xu, J.H.; Chen, Y.N.; Lu, F.; Li, W.H.; Zhang, L.J.; Hong, Y.L. The nonlinear trend of runoff and its response to climate change in the Aksu River, western China. Int. J. Climatol. 2011, 31, 687–695. [Google Scholar] [CrossRef]
- Hu, X.X.; Zhang, Y.H.; Liu, X. The Characteristics of Meteorological Drought in Aksu in Xinjiang. J. Anhui Agric. Sci. 2015, 43, 96–100. (In Chinese) [Google Scholar]
- Chen, Y.N.; Xu, C.; Chen, Y.P.; You, Y.B.; Li, W.H. Progress, challenges and prospects of eco-hydrological studies in the Tarim River Basin of Xinjiang, China. Envirom. Manag. 2013, 51, 138–153. [Google Scholar] [CrossRef] [PubMed]
- Shen, Y.P.; Wang, G.Y.; Zhan, J.G. Human activity impacts on local climate and water environments of the Aksu River oasis, South Xinjiang. Arid Land Geogr. 2008, 31, 524–534. (In Chinese) [Google Scholar]
- Zhou, D.C.; Luo, G.P.; Yin, C.Y.; Xu, W.Q.; Feng, Y.X. Land Use/Cover Change of the Aksu River Watershed in the Period of 1960–2008. J. Glaciol. Geocryol. 2010, 32, 275–284. [Google Scholar]
- Chen, X.; Luo, G.; Xia, J.; Zhou, K.; Lou, S.; Ye, M. Ecological response to the climate change on the northern slope of the Tianshan Mountains in Xinjiang. Sci. China Ser. D 2005, 48, 765–777. [Google Scholar] [CrossRef]
- Swenson, S.; Wahr, J. Post-processing removal of correlated errors in GRACE data. Geophys. Res. Lett. 2006, 33, 1–4. [Google Scholar] [CrossRef]
- Syed, T.H.; Famiglietti, J.S.; Rodell, M.; Chen, J.L.; Wilson, C.R. Analysis of terrestrial water storage changes from GRACE and GLDAS. Water Resour. Res. 2008, 44, 1–15. [Google Scholar] [CrossRef]
- Zhang, S.H.; Liu, S.X.; Mo, X.G.; Shu, C.; Sun, Y.; Zhang, C. Assessing the impact of climate change on potential evapotranspiration in Aksu River Basin. J. Geogr. Sci. 2011, 21, 609–620. [Google Scholar] [CrossRef]
- Chen, Y.N.; Yang, K.; He, J.; Qin, J.; Shi, J.C.; Du, J.Y.; He, Q. Improving land surface temperature modeling for dry land of China. J. Geophys. Res. Atmos. 2011, 116, 1–15. [Google Scholar] [CrossRef]
- Yang, K.; Zhang, J.Y. Evaluation of reanalysis datasets against observational soil temperature data over China. Clim. Dyn. 2018, 50, 317–337. [Google Scholar] [CrossRef]
- Madadgar, S.; Moradkhani, H. Spatio-temporal drought forecasting within Bayesian networks. J. Hydrol. 2014, 512, 134–146. [Google Scholar] [CrossRef]
- Tao, H.; Borth, H.; Fraedrich, K.; Su, B.; Zhu, X.H. Drought and wetness variability in the Tarim River Basin and connection to large-scale atmospheric circulation. Int. J. Climatol. 2014, 34, 2678–2684. [Google Scholar] [CrossRef]
- Wang, Y.X.; Li, J.Z.; Feng, P.; Chen, F.L. Effects of large-scale climate patterns and human activities on hydrological drought: A case study in the Luanhe River basin, China. Nat. Hazards 2015, 76, 1687–1710. [Google Scholar] [CrossRef]
- Wang, W.; Wang, P.; Cui, W. A comparison of terrestrial water storage data and multiple hydrological data in the Yangtze River basin. Adv. Water Sci. 2015, 26, 759–768. (In Chinese) [Google Scholar]
- Nkoro, E.; Uko, A.K. Autoregressive Distributed Lag (ARDL) cointegration technique: Application and interpretation. J. Stat. Econom. Methods 2016, 5, 63–91. [Google Scholar]
- Hassler, U.; Wolters, J. Autoregressive distributed lag models and cointegration. In Modern Econometric Analysis; Springer: Berlin/Heidelberg, Germany, 2006; pp. 57–72. [Google Scholar]
- Shahbaz, M.; Loganathan, N.; Zeshan, M.; Zaman, K. Does renewable energy consumption add in economic growth? An application of auto-regressive distributed lag model in Pakistan. Renew. Sustain. Energy Rev. 2015, 44, 576–585. [Google Scholar] [CrossRef]
- Kiviet, J.F.; Dufour, J.M. Exact tests in single equation autoregressive distributed lag models. J. Econ. 1997, 80, 325–353. [Google Scholar] [CrossRef]
- Toms, J.D.; Lesperance, M.L. Piecewise regression: A tool for identifying ecological thresholds. Ecology 2003, 84, 2034–2041. [Google Scholar] [CrossRef]
- Hawkins, D.M. Point estimation of the parameters of piecewise regression models. Appl. Stat. 1976, 25, 51–57. [Google Scholar] [CrossRef]
- Seber, G.A.F.; Wild, C.J. Nonlinear Regression: Wiley Series in Probability and Mathematical Statistics; Wiley: New York, NY, USA, 1989. [Google Scholar]
- Barrowman, N.; Myers, R. Still more spawner-recruitment curves: The hockey stick and its generalizations. Can. J. Fish. Aquat. Sci. 2000, 57, 665–676. [Google Scholar] [CrossRef]
- Dracup, J.A.; Lee, K.S.; Paulson, E.G., Jr. On the definition of droughts. Water Resour. Res. 1980, 16, 297–302. [Google Scholar] [CrossRef]
- Zhang, Y.H.; Cai, W.Y.; Chen, Q.H.; Yao, Y.J.; Liu, K.L. Analysis of changes in precipitation and drought in Aksu River Basin, Northwest China. Adv. Meteorol. 2015, 2015, 215840. [Google Scholar] [CrossRef]
- Wang, C.; Xu, J.H.; Chen, Y.N.; Bai, L.; Chen, Z.S. A hybrid model to assess the impact of climate variability on streamflow for an ungauged mountainous basin. Clim. Dyn. 2017, 50, 1–16. [Google Scholar] [CrossRef]
- Hanson, R.L. Evapotranspiration and droughts. US Geol. Surv. Water-Supply Pap. 1991, 2375, 99–104. [Google Scholar]
- Dai, A.G.; Trenberth, K.E.; Qian, T.T. A global dataset of Palmer Drought Severity Index for 1870–2002: Relationship with soil moisture and effects of surface warming. J. Hydrometeorol. 2004, 5, 1117–1130. [Google Scholar] [CrossRef]
- Hutchinson, C.F. Uses of satellite data for famine early warning in sub-Saharan Africa. Int. J. Remote Sens. 1991, 12, 1405–1421. [Google Scholar] [CrossRef]
- Lohani, V.K.; Loganathan, G.V. An early warning system for drought management using the Palmer drought index. J. Am. Water Resour. Assoc. 1997, 33, 1375–1386. [Google Scholar] [CrossRef]
- Paulo, A.A.; Ferreira, E.; Coelho, C. Drought class transition analysis through Markov and Loglinear models, an approach to early warning. Agric. Water Manag. 2005, 77, 59–81. [Google Scholar] [CrossRef]
- Tomé, A.R.; Miranda, P.M.A. Piecewise linear fitting and trend changing points of climate parameters. Geophys. Res. Lett. 2004, 31. [Google Scholar] [CrossRef] [Green Version]
- Zhang, L.; Wylie, B.K.; Ji, L.; Gilmanov, T.G.; Tieszen, L.L. Climate-driven interannual variability in net ecosystem exchange in the northern Great Plains grasslands. Rangel. Ecol. Manag. 2010, 63, 40–50. [Google Scholar] [CrossRef]
- Greenville, A.C.; Wardle, G.M.; Dickman, C.R. Extreme climatic events drive mammal irruptions: Regression analysis of 100-year trends in desert rainfall and temperature. Ecol. Evol. 2012, 2, 2645–2658. [Google Scholar] [CrossRef] [PubMed]
- Chen, Y.N.; Li, Z.; Fan, Y.T.; Wang, H.J.; Fang, G.H. Research progress on the impact of climate change on water resources in the arid region of Northwest China. Acta Geogr. Sin. 2014, 69, 1295–1304. (In Chinese) [Google Scholar]
- Qian, W.; Lin, X. Regional trends in recent precipitation indices in China. Meteorol. Atmos. Phys. 2005, 90, 193–207. [Google Scholar] [CrossRef]
- Shi, Y.F.; Shen, Y.P.; Kang, E.; Li, D.L.; Ding, Y.J.; Zhang, G.W.; Hu, R.J. Recent and future climate change in northwest China. Clim. Chang. 2007, 80, 379–393. [Google Scholar] [CrossRef]
- Biatwright, G.O.; Whitehead, V.S. Early warning and crop condition assessment research. IEEE. Trans. Geosci. Remote Sens. 1986, 1, 54–64. [Google Scholar] [CrossRef]
- Kumar, V. An early warning system for agricultural drought in an arid region using limited data. J. Arid. Environ. 1998, 40, 199–209. [Google Scholar] [CrossRef]
- Morgan, R. The development and applications of a drought early warning system in Botswana. Disasters 1985, 9, 44–50. [Google Scholar] [CrossRef] [PubMed]
- Huang, W.C.; Yuan, L.C. A drought early warning system on real-time multireservoir operations. Water Resour. Res. 2004, 40. [Google Scholar] [CrossRef] [Green Version]
- Kogan, F.N. Contribution of remote sensing to drought early warning. In Early Warning Systems for Drought Preparedness and Drought Management; World Meteorological Organization: Geneva, Switzerland, 2000; pp. 75–87. [Google Scholar]
- Boken, V.K. Improving a drought early warning model for an arid region using a soil-moisture index. Appl. Geogr. 2009, 29, 402–408. [Google Scholar] [CrossRef]
Figure 1.
Location of the Aksu River Basin (ARB), northwest China.

Figure 2.
The framework of this study.

Figure 3.
The normal distribution Q-Q plot of terrestrial water storage.

Figure 4.
The time series of SRI in the ARB during 1980–2010.

Figure 5.
The spatial pattern of hydrological drought (HD) in drought year (1990) and wet year (2000).
Figure 5.
The spatial pattern of hydrological drought (HD) in drought year (1990) and wet year (2000).

Figure 6.
The number of drought years during the period of 1980–2010.

Figure 7.
(a) The slope (rate of change) of annual surface water supply index (SWSI) during the period of 1980–2010 and (b) the significant test of SWSI slope.
Figure 7.
(a) The slope (rate of change) of annual surface water supply index (SWSI) during the period of 1980–2010 and (b) the significant test of SWSI slope.


Table 1.
Standardized Runoff Index (SRI) classification and corresponding cumulative probabilities of occurrence.
Table 1.
Standardized Runoff Index (SRI) classification and corresponding cumulative probabilities of occurrence.
| Category | SRI Value | Cumulative Probability (%) |
|---|---|---|
| Extremely wet | SRI ≥ 2 | 2.28 |
| Moderately wet | 1.5 ≤ SRI< 2 | 6.68 |
| Slightly wet | 1 ≤ SRI< 1.5 | 15.87 |
| Near normal | −1 < SRI < 1 | 50.00 |
| Mild drought | −1.5 < SRI ≤ −1 | 84.13 |
| Moderate drought | −2 < SRI ≤ −1.5 | 93.32 |
| Extremely drought | SRI ≤ −2 | 97.72 |
Table 2.
The drought conditions for each year.
| Year | Drought/Non-Drought Year | Year | Drought/Non-Drought Year |
|---|---|---|---|
| 1980 | Y | 1996 | Y |
| 1981 | Y | 1997 | N |
| 1982 | Y | 1998 | N |
| 1983 | Y | 1999 | N |
| 1984 | Y | 2000 | N |
| 1985 | Y | 2001 | N |
| 1986 | Y | 2002 | N |
| 1987 | Y | 2003 | N |
| 1988 | Y | 2004 | N |
| 1989 | Y | 2005 | N |
| 1990 | Y | 2006 | N |
| 1991 | Y | 2007 | N |
| 1992 | Y | 2008 | Y |
| 1993 | Y | 2009 | Y |
| 1994 | N | 2010 | N |
| 1995 | N | Sum of drought years | 17 |
Notes: Y represent the drought year; N represent the non-drought year. If the sum of 12 month’s SRI for each year is less than −1, it is considered to be a drought year, otherwise it is a wet year.
Table 3.
The ADF test.
| ADF | p-Value | ADF | P-Value | ||
|---|---|---|---|---|---|
| SWSI | −2.5443 ** | 0.0108 | Precipitation | −4.8042 *** | 0.0005 |
| PET | −6.6351 *** | 0.0000 | Soil moisture | −2.6259 * | 0.0887 |
Note: *, ** and *** indicate significant correlation with 0.1 levels, 0.05 level and 0.01 level respectively.
Table 4.
The autocorrelation of HD and its dependence on precipitation, potential evapotranspiration (PET), and soil moisture.
Table 4.
The autocorrelation of HD and its dependence on precipitation, potential evapotranspiration (PET), and soil moisture.
| Variable | Coefficient | Prob. |
|---|---|---|
| SWSI (−1) | 0.9476 *** | 0.0000 |
| SWSI (−2) | 0.3192 *** | 0.0000 |
| PET | −0.0016 ** | 0.0184 |
| PET (−1) | −0.0021 *** | 0.0065 |
| Precipitation | −0.0009 | 0.4726 |
| Precipitation (−1) | 0.0027 ** | 0.0338 |
| Soil Moisture | 0.0898 *** | 0.0000 |
| Soil Moisture (−1) | -0.0959 *** | 0.0000 |
| Soil Moisture (−2) | 0.0595 *** | 0.0000 |
| Constant | −20.7678 | 0.0000 |
| R-squared | 0.9592 | |
| Akaike info criterion | −0.3402 | |
| Durbin-Watson stat | 1.9313 | |
| F-statistic | 936.4129 *** | 0.0000 |
Note: ** and *** indicate significant correlation with 0.05 level and 0.01 level, respectively. SWSI (−1) represents significant autocorrelation with 1 month’s lag, SWSI (−2) represents significant autocorrelation with 2 month’s lag. PET (−1) represents the lag with 1 month for PET; Precipitation and soil moisture are the same.
Table 5.
Estimates of the breakpoint and approximate 95% confidence intervals.
| Breakpoint | 95% Confidence Intervals | |
|---|---|---|
| Annual PET (mm) | 891.242 | (844.048, 938.435) |
| Annual Precipitation (mm) | 113.037 | (91.5564, 134.518) |
| Annual average Soil moisture (kg/m2) | 397.98 | (384.89, 411.071) |
Table 6.
The thresholds of the correlated variables to hydrological drought and actual value.
| Correlated Variable | Threshold Range (95% Confidence Interval) | Actual Value |
|---|---|---|
| Annual PET (mm) | >844.05 | 824.00 |
| Annual Precipitation (mm) | <134.52 | 157.61 |
| Annual average Soil Moisture (kg/m2) | <411.07 | 385.30 |
Table 7.
The hydrological drought early warning levels.
| Early Warning Level | Annual PET > 844.05 mm | Annual Precipitation < 134.52 mm | Annual Average Soil Moisture < 411.07 kg/m2 |
|---|---|---|---|
| 1 | √ | √ | √ |
| 2 | √ | √ | × |
| × | √ | √ | |
| √ | × | √ | |
| 3 | √ | × | × |
| × | √ | × | |
| × | × | √ |
Note: “√” represent that it satisfies this condition; “×” represent that it does not satisfies this condition.
© 2018 by the authors. Licensee MDPI, Basel, Switzerland. This article is an open access article distributed under the terms and conditions of the Creative Commons Attribution (CC BY) license (http://creativecommons.org/licenses/by/4.0/).
Share and Cite
MDPI and ACS Style
Zhu, N.; Xu, J.; Li, W.; Li, K.; Zhou, C. A Comprehensive Approach to Assess the Hydrological Drought of Inland River Basin in Northwest China. Atmosphere 2018, 9, 370. https://doi.org/10.3390/atmos9100370
AMA Style
Zhu N, Xu J, Li W, Li K, Zhou C. A Comprehensive Approach to Assess the Hydrological Drought of Inland River Basin in Northwest China. Atmosphere. 2018; 9(10):370. https://doi.org/10.3390/atmos9100370
Chicago/Turabian StyleZhu, Nina, Jianhua Xu, Weihong Li, Kaiming Li, and Cheng Zhou. 2018. "A Comprehensive Approach to Assess the Hydrological Drought of Inland River Basin in Northwest China" Atmosphere 9, no. 10: 370. https://doi.org/10.3390/atmos9100370
Note that from the first issue of 2016, this journal uses article numbers instead of page numbers. See further details here.