Article

Characterization of In Situ Aerosol Optical Properties at Three Observatories in the Central Mediterranean

1
Istituto di Scienze dell’Atmosfera e del Clima, ISAC-CNR, 73100 Lecce, Italy
2
Istituto di Scienze dell’Atmosfera e del Clima, ISAC-CNR, 88046 Lamezia Terme, Italy
3
Istituto di Scienze dell’Atmosfera e del Clima, ISAC-CNR, 40129 Bologna, Italy
*
Author to whom correspondence should be addressed.
Atmosphere 2018, 9(10), 369; https://doi.org/10.3390/atmos9100369
Submission received: 25 July 2018 / Revised: 17 September 2018 / Accepted: 19 September 2018 / Published: 21 September 2018
(This article belongs to the Section Aerosols)

Abstract

:
In this work, results of scattering and backscattering coefficients, scattering Ångström exponent (SAE), single scattering albedo (SSA), and asymmetry parameter (g) of atmospheric aerosols are presented. All these parameters were measured during the month of April 2016 in Southern Italy on three different Global Atmosphere Watch observatories in the Central Mediterranean. This is the first time, to our knowledge, that optical aerosol properties were studied at the same time, even if in a brief intensive measurement campaign, at three sites in the South of Italy. In order to obtain a characteristic value for aerosol optical properties, different kinds of particle sources (i.e., dust, marine, and anthropic) have been identified and studied. In the measurement period, one event of a long-range transport of Saharan dust from Northern Africa was observed at all observatories. During the Saharan dust transport event, a minimum value of the SAE (0.69 ± 0.34) and a relatively higher values of SSA were observed. During the dust event, g increased up to 0.69. Marine aerosol contribution and anthropic/urban aerosol intrusion were analysed. From this analysis, SAE average values were 0.70, 0.84, and 1.22, respectively, for dust, marine, and anthropic particles. On the other hand, the SSA minimum value was 0.86 for anthropic particles, and it increased for dust (0.88) and marine (0.93) aerosols. The asymmetry parameter had a limited variability for the three types of aerosol from 0.62 to 0.58, as reported also in literature.

Graphical Abstract

1. Introduction

Atmospheric aerosols can strongly affect the radiative balance of Earth, both directly by changing scattering and absorption of the solar radiation (long and short-wave), and indirectly by influencing cloud albedo and precipitation [1,2,3]. However, there are still large uncertainties in global climate forcing assessment [4,5,6,7]. Aerosols influence the atmospheric radiation balance depending on their chemical composition, and microphysical and optical properties, which are characterized by a significantly large scale spatial and temporal variability [5]. Thus, in order to improve the forcing effect knowledge of aerosols on climate change, it is very important to study aerosol’s optical properties (e.g., extinction and absorption coefficients, single scattering albedo, and asymmetry parameter) and their temporal and spatial variability. On the other hand, the wavelength dependency of scattering and absorption of radiation by aerosols has been recognized as a powerful tool to distinguish aerosol types [8,9,10,11].
Due to the large number and great diversity of sources, the spatial distribution (at regional and global scales) of atmospheric particles, the monitoring in different sites around the world of aerosols’ quantitative information is necessary, especially for densely populated and/or climatically sensitive regions. The Mediterranean basin is characterized by elevated aerosol burdens with a complex chemical composition [12,13,14,15] and different kinds of aerosol sources [16], both natural and anthropogenic, and it is one of the most climatically relevant areas [17]. The main particles types characterizing the Mediterranean region are: (1) coarse dust mineral particles originating mainly from the Sahara Desert, (2) marine aerosol, (3) fine pollution aerosol originating from industrial emissions in countries around the Mediterranean Sea, and (4) biomass burning aerosols produced in Africa and Europe. Furthermore, in the Mediterranean basin, a growing emission burden is due to the maritime transport sector [18], contributing especially to gaseous pollutants (e.g., NOX, SO2) and ultrafine particles (e.g., [19,20,21,22,23]). Mount Etna with its continuous degassing and episodic explosive eruptions are important sources of particles and gases for the Mediterranean Sea [24,25]. As for stratospheric eruptions, most of the radiative effects of moderate eruptions are associated with changes in the aerosol size distribution, composition, and shape. A great fraction of the dust load from African sources is transported by atmospheric circulation above the Mediterranean Sea and Europe [26,27,28,29]. Desert dust aerosol may affect regional climates, the biogeochemical cycle, and eventually human environments [30,31]. Levels of particulate matter concentration in the Mediterranean are determined, basically, by regional or long-range transport [16,32,33,34]. Anthropogenic aerosols are transported from Europe and the Middle East towards the Mediterranean Sea, whereas mineral dust is transported from Northern Africa towards the Mediterranean Sea and Southern Europe with favourable meteorological conditions [35].
In this work, results on several properties of atmospheric aerosols are presented. In particular, the scattering and backscattering coefficients, the scattering Ångström exponent (SAE), single scattering Albedo (SSA), and asymmetry parameter (g) were measured during an intensive campaign in the month of April 2016. Measurements took place at three different observatories [36], all part of the GAW (Global Atmosphere Watch-World Meteorological Organization) network in South Italy in the Central Mediterranean area. This is the first time, to our knowledge, that optical aerosol properties were studied at the same time, even if in a brief intensive measurement campaign, at three sites in the South of Italy, in the Central Mediterranean. The optical properties of the aerosol and its size distribution have been studied and characterized for a Saharan dust event in Section 4.1. In the same way, the optical properties of the marine (Section 4.2) and anthropic (Section 4.3) aerosols have been characterized for the period at all observatories.

2. Experiments

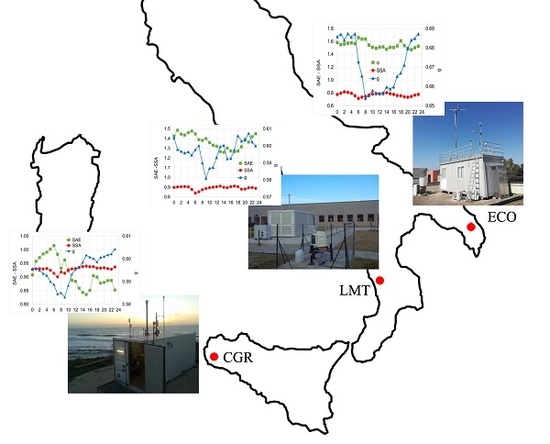
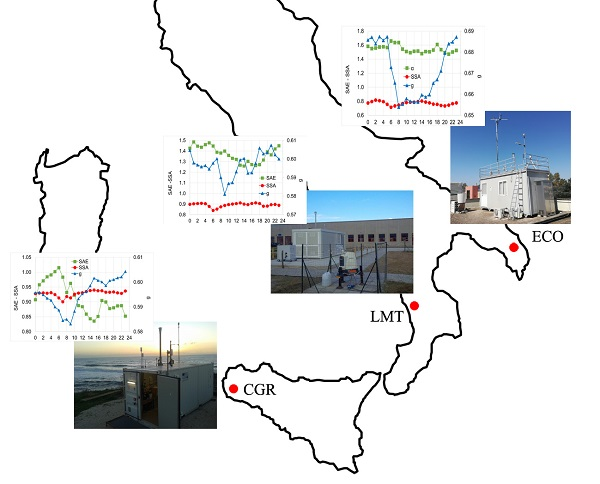
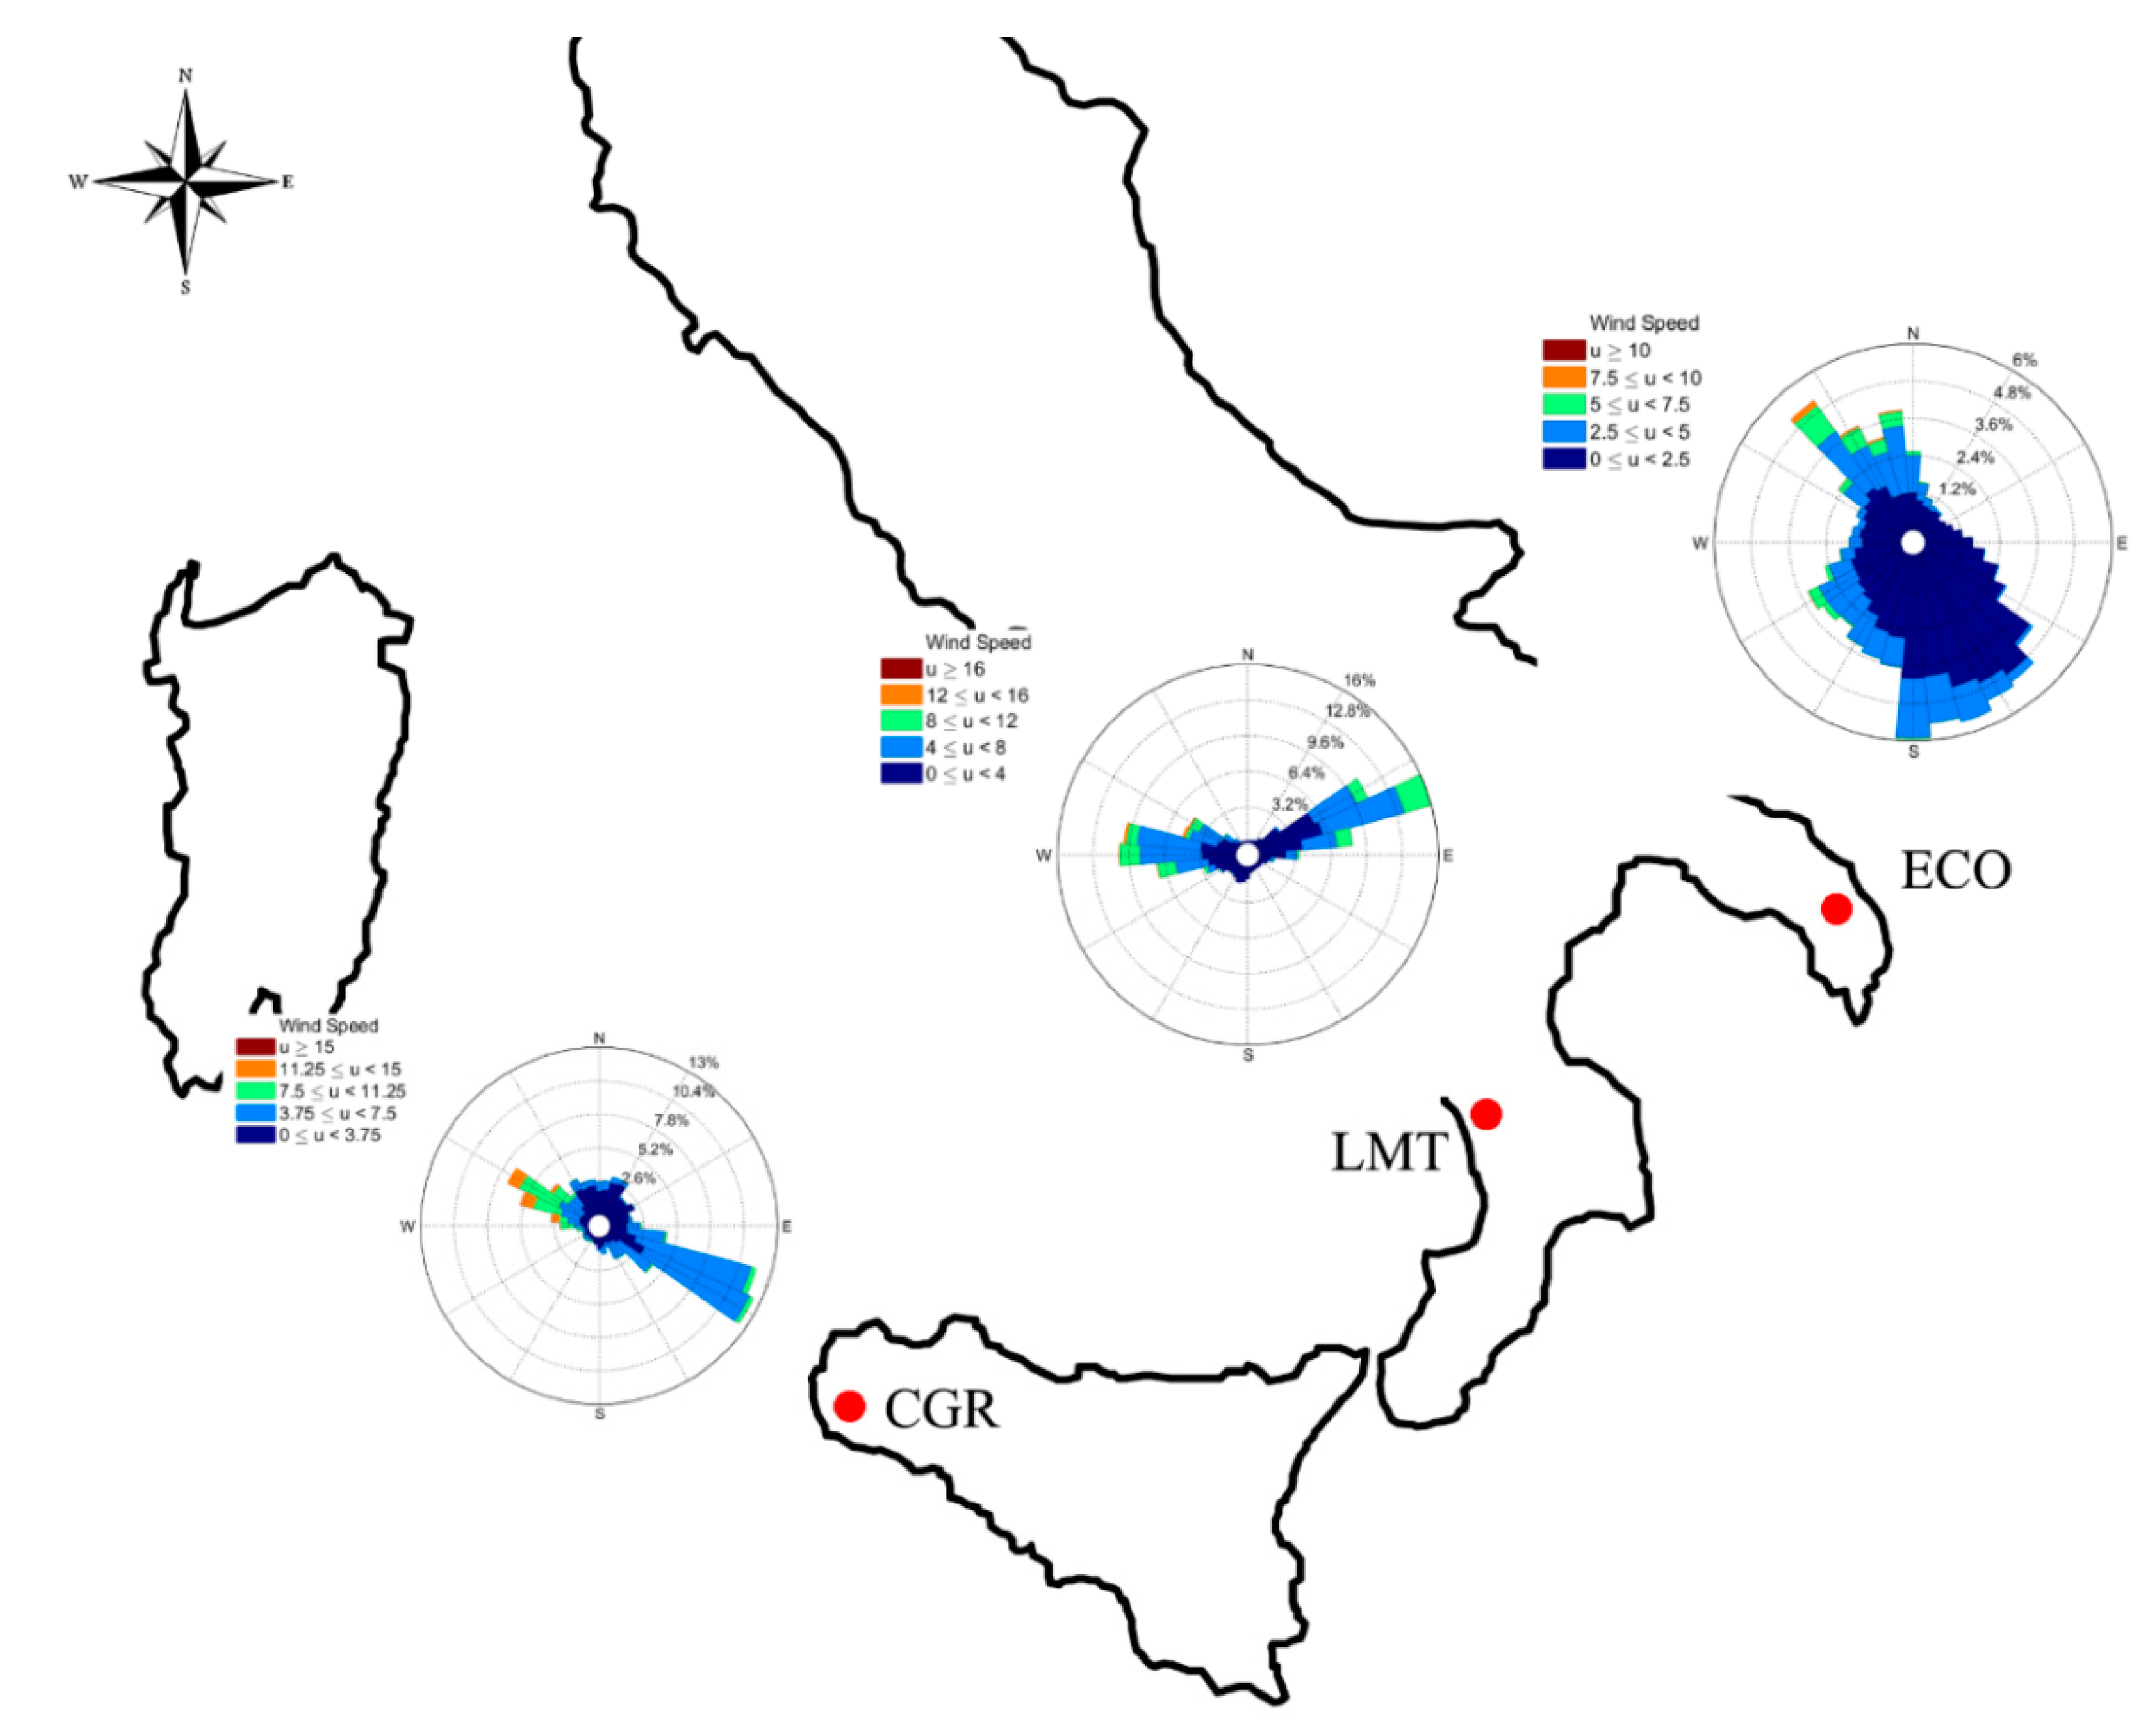
2.1. Sites Description

The GAW Regional Coastal Observatory of Capo Granitola (CGR, 37.67° N 12.65° E; 5 m a.s.l.) is located directly on the coastline of the Sicily Strait, at the Torretta Granitola coastal site, 12 km from Mazara del Vallo. The station at CGR is a remote coastal site with a contribution from vessel emissions deriving from the near little harbour. The GAW Regional Observatory at Lamezia Terme (LMT, 38.88° N 16.23° E; 6 m a.s.l.) is located at the Institute of Atmospheric Science and Climate (ISAC) of the National Research Council (CNR) on the west coast of Calabria region, at about 600 m from the coastline. LMT is a coastal site located about 600 m inland from the Tyrrhenian coastline [37]. This area is characterized by anthropogenic pollution emissions related to transportation and agriculture, in particular, Lamezia Terme International Airport (14,699 flights in 2015) and the city of S. Eufemia. The A13 motorway runs around the observatory location clockwise from N to S, and is located 7 km (northward) to 3.5 km (southward) from the observatory [38]. Environmental-Climate Observatory (ECO) is located on the roof of the Lecce unit of ISAC-CNR Institute in Apulia region (40.34° N 18.12° E; 36 m a.s.l.) at about 12 m above the ground level and about 3.5 km SW outside of the town of Lecce. The station could be characterised as urban background because it is not strongly affected by traffic or industrial emissions [39]. The observatory site is influenced by the activities (included traffic) inside the university campus, and by the diffused emissions from Lecce town and the surrounding area.
It is worth noting that the results of this work refer to an intensive measurement campaign in the month of April 2016, as mentioned previously; however, the three stations began operating in 2014 and continue to do so to this day.
The CGR location is affected by the sea-land breeze regime, with prevailing gentle wind breezes (on average 3 ± 1 m/s) from inland (NW–NE) during the night and prevailing winds from the sea (W–SE) (Figure 1b) during daytime [36]. The average temperature ranged, through the daily cycle, between 8.8 °C and 26.6 °C, while relative humidity between 24% and 91% during the investigation period. At the LMT observatory, moderate wind breezes (Figure 1c) from the sea (NW–SW) were mainly observed during daytime, while NE gentle wind breezes from land mainly affected the night-time period [38]. Average wind speed, for the period in consideration, is 4.4 ± 2.6 m/s. Temperature ranged between 6.6 °C and 30.2 °C, while relative humidity showed values ranging between 19.2% and 87.6%. As reported in Reference [40], meteorological conditions in the measurement site of ECO revealed two prevalent wind directions: winds from the sector S–SE were mainly observed during the cold periods; while winds from the sector NW–N sector were mainly observed during the spring and summer. In the period of investigation, both directions were observed with comparable weight (Figure 1d). The wind velocities were relatively low (on average 2 ± 1 m/s) and did not show any significant trend. Temperature ranged between 6.8 °C and 28.4 °C, while relative humidity showed values ranging between 20.7% and 91.0%.

2.2. Instrumental Setup

In the three stations, the radiation scattering ( σ s c ) and backscattering ( σ b s c ) coefficients were measured using a nephelometer (model 3563, TSI Inc., St. Paul, MN, USA), operating at three wavelengths (450 nm, 550 nm, and 700 nm) with a temporal resolution of 1 min [41]. A pump was used to maintain a flow rate of 200 L/min in the main inlet tube equipped with a PM10 inlet head (50% transmission efficiency at 10 μm aerodynamic diameter) at all sites. The aerosol stream was split isokinetically into several aerosol flows and particles were directed to the instruments. The nephelometer drew from the main inlet splitter at a flow rate of 20 L/min by a blower. The nephelometer had a humidity sensor located near the sample outlet. The outlet humidity sensor was positioned as close as possible to the sample volume to provide an accurate reading of the air sample’s relative humidity. Raw data corresponding to relative humidity greater than 50% were rejected. Scattering coefficients were not corrected for standard temperature and pressure (STP) in this work. A full nephelometer calibration was conducted before the starting of the measurement campaign using CO2 as span gas. Zero calibration was performed once an hour using internally filtered particle free air.
The aerosol absorption (short-wave radiation) coefficient ( σ a ) was measured with Thermo Scientific™ (Franklin, MA, USA) 5012 Multi-Angle Absorption Photometer (MAAP) at 637 nm, a precision instrument that measures black carbon and aerosol short-wave radiation absorption properties. The MAAP determines aerosol absorption by illuminating a particle-loaded filter and measuring simultaneously the radiation passing through the filter and the back-scattered light at three different angles [42]. Air was sampled through the main inlet system of the nephelometer. The sample flow provided by the internal pump was set to 16.7 L/min. The MAAP performs continuous measurements of equivalent black carbon concentrations at 637 nm wavelength, with a time resolution of 1 min. A mass closure for the black carbon mass concentration measured by MAAP was verified imposing that the BC mass concentration was lower than the 50% of the PM2.5 mass concentration.
In addition, an Optical Particle Counter (OPC Multichannel Monitor, FAI Instruments, Rome, Italy) was used at the three stations to measure the number size distribution of particles in 22 size bins with diameters in the 0.28–10 μm range. The OPCs operated with a 1 L/min flow rate. The instrument was operated at 1 min temporal resolution. The OPCs’ relative humidity of air samples entering the instruments was kept lower than 50% using dilution (1:2) with clean dried air and a smart heater placed in the diluter along the mixing chamber that was automatically operated only when needed. It ensured a proper conditioning of the aerosol and it permitted to minimize the effects of the water vapour. PM10 and PM2.5 mass concentration measurements were performed by b-ray attenuation method using a low volume (2.3 m3/h) FAI SWAM 5a-Dual Channel Monitor. An automatic weather station (Vaisala WXT520, Vantaa, Finland) was used at the three sites to monitor meteorological variables: temperature, relative humidity, wind velocity and direction, pressure, and rain.

2.3. Optical Properties

The total scattering, backscattering, and absorption coefficients data were analysed for the month of April 2016. Raw scattering data were corrected for non-Lambertian and truncation errors using the method described in References [43,44]. According to References [45,46], a scattering error for truncation of about 2–3% was estimated. Non-Lambertian error is the slightly non-cosine-weighted intensity distribution of illumination light provided by the opal glass diffusor of the nephelometer. Truncation error is the geometrical blockage of near-forward-scattered light for angles below 7° [44,47]. The raw data associated with abnormal peaks, calibrations or visits at the station were rejected, as well as the cases when the zero mode was activated. At low particle concentrations or short sampling times, the dominant source of uncertainties is random noise. For 5-min averages applied here, the detection limits (signal to noise ratio of 2) for scattering coefficients were 0.44, 0.17, and 0.26 Mm−1 at 450, 550, and 700 nm, respectively. For backscattering, the detection limits were 0.29, 0.11, and 0.21 Mm−1 at 450, 550, and 700 nm, respectively [41]. Values below these detection limits were excluded, however the percentage of data excluded for this reason was very low (0.03%). Based on σ s c and σ b s c coefficients, three intensive (independent of the amount of particles and dimensionless) properties were calculated: the hemispheric backscattering fraction ( b λ ), SAE, and SSA. Using Equation (1), b λ was calculated at the wavelength of λ1 = 450 nm, λ2 = 550 nm, and λ3 = 700 nm for the whole period:
b λ = σ b s c , λ σ s c , λ ,
In particular, b λ is weakly dependent on concentration and it could be very useful for describing the aerosol-scattered radiation reaching the ground and it is very useful in radiative transfer models [48]. SAE was calculated for each pairs of wavelengths: SAE450,700, SAE550,700, and SAE450,550 by using the Equation (2) from corrected nephelometer scattering data.
SAE λ 1 , λ 2 = log ( σ s c , λ 1 σ s c , λ 2 ) log ( λ 1 λ 2 ) ,
Small values of SAE (SAE450,700 < 0.5) suggest a predominance of coarse particles, such as sea salt or dust, while SAE450,700 > 1.5 indicates a predominance of small particles such as secondary sulphates, nitrate aerosols and biomass burning particles [49]. For instance, [50] reported that the effect of large sea-salt particles led to decrease of SAE. However, this interpretation could be ambiguous if different type of aerosol or a mixture of fine and coarse mode is present in the sampled air [51,52]. In this work SAE450,700 will be used.
Single Scattering Albedo is the ratio between the radiation scattering and the radiation scattering and absorption processes [53]. It was calculated at 637 nm from
SSA = σ s c , 637 σ a , 637 + σ s c , 637 ,
where σ a , 637 is the absorption coefficient at 637 nm from MAAP measurements according to Equation (4).
σ a , 637 = B C × M A C ,
where BC is the black carbon mass (μg/m3) measured by MAAP and MAC = 6.6 m2/g is the mass absorption coefficient.
Theoretically, the asymmetry parameter ranges from −1 for entirely backscattered light to 1 for entirely forward-scattered light [48]. In particular, g is equal to zero for symmetric (e.g., Rayleigh) scattering light. It is higher for large particles (e.g., marine/dust aerosol) when compared to fine particles (e.g., anthropic/urban aerosol) in most of the shortwave region [54,55]. An approximate relationship by Reference [56] is adopted in this manuscript (Equation (5)) to calculate g using b λ .
g = 7.143889 b λ 3 + 7.464439 b λ 2 3.96356 b λ + 0.9893 ,
The asymmetry parameter is one of the optical properties required to estimate aerosol forcing of climate. In fact, for most radiative transfer calculations, such as atmospheric correction in remote sensing, it is an essential parameter [57]. In this work g at λ = 550 will be discussed.

2.4. Back Trajectories

A back-trajectories analysis has been performed using Hybrid Single Particle Lagrangian Integrated Trajectory (HYSPLIT) model version 4.0 [58,59] to determine the local and long-range sources of air mass and dust tracks. The model is run interactively through the website (http://ready.arl.noaa.gov/hypub-bin/trajtype.pl?runtype=archive) of NOAA (National Oceanic and Atmospheric Administration, USA) ARL (Air Resources Laboratory) by using the Global NOAA-NCEP (National Centers for Environmental Predictions, USA)/NCAR (National Center for Atmospheric Research, USA) Reanalysis meteorological data (0.5 degree grid). The HYSPLIT parameters were set on a day-by-day basis, at starting heights of 500 m, 1500 m, and 3000 m a.s.l for the three measurement sites. In particular, the 500 m level can be considered a maximum height for a boundary layer inside which the great part of the aerosol particles are present. A second level (1500 m), was chosen in the transition zone between the boundary layer and the free troposphere with the presence of dust layers. A third height was chosen at 3000 m in the free troposphere.

3. Results

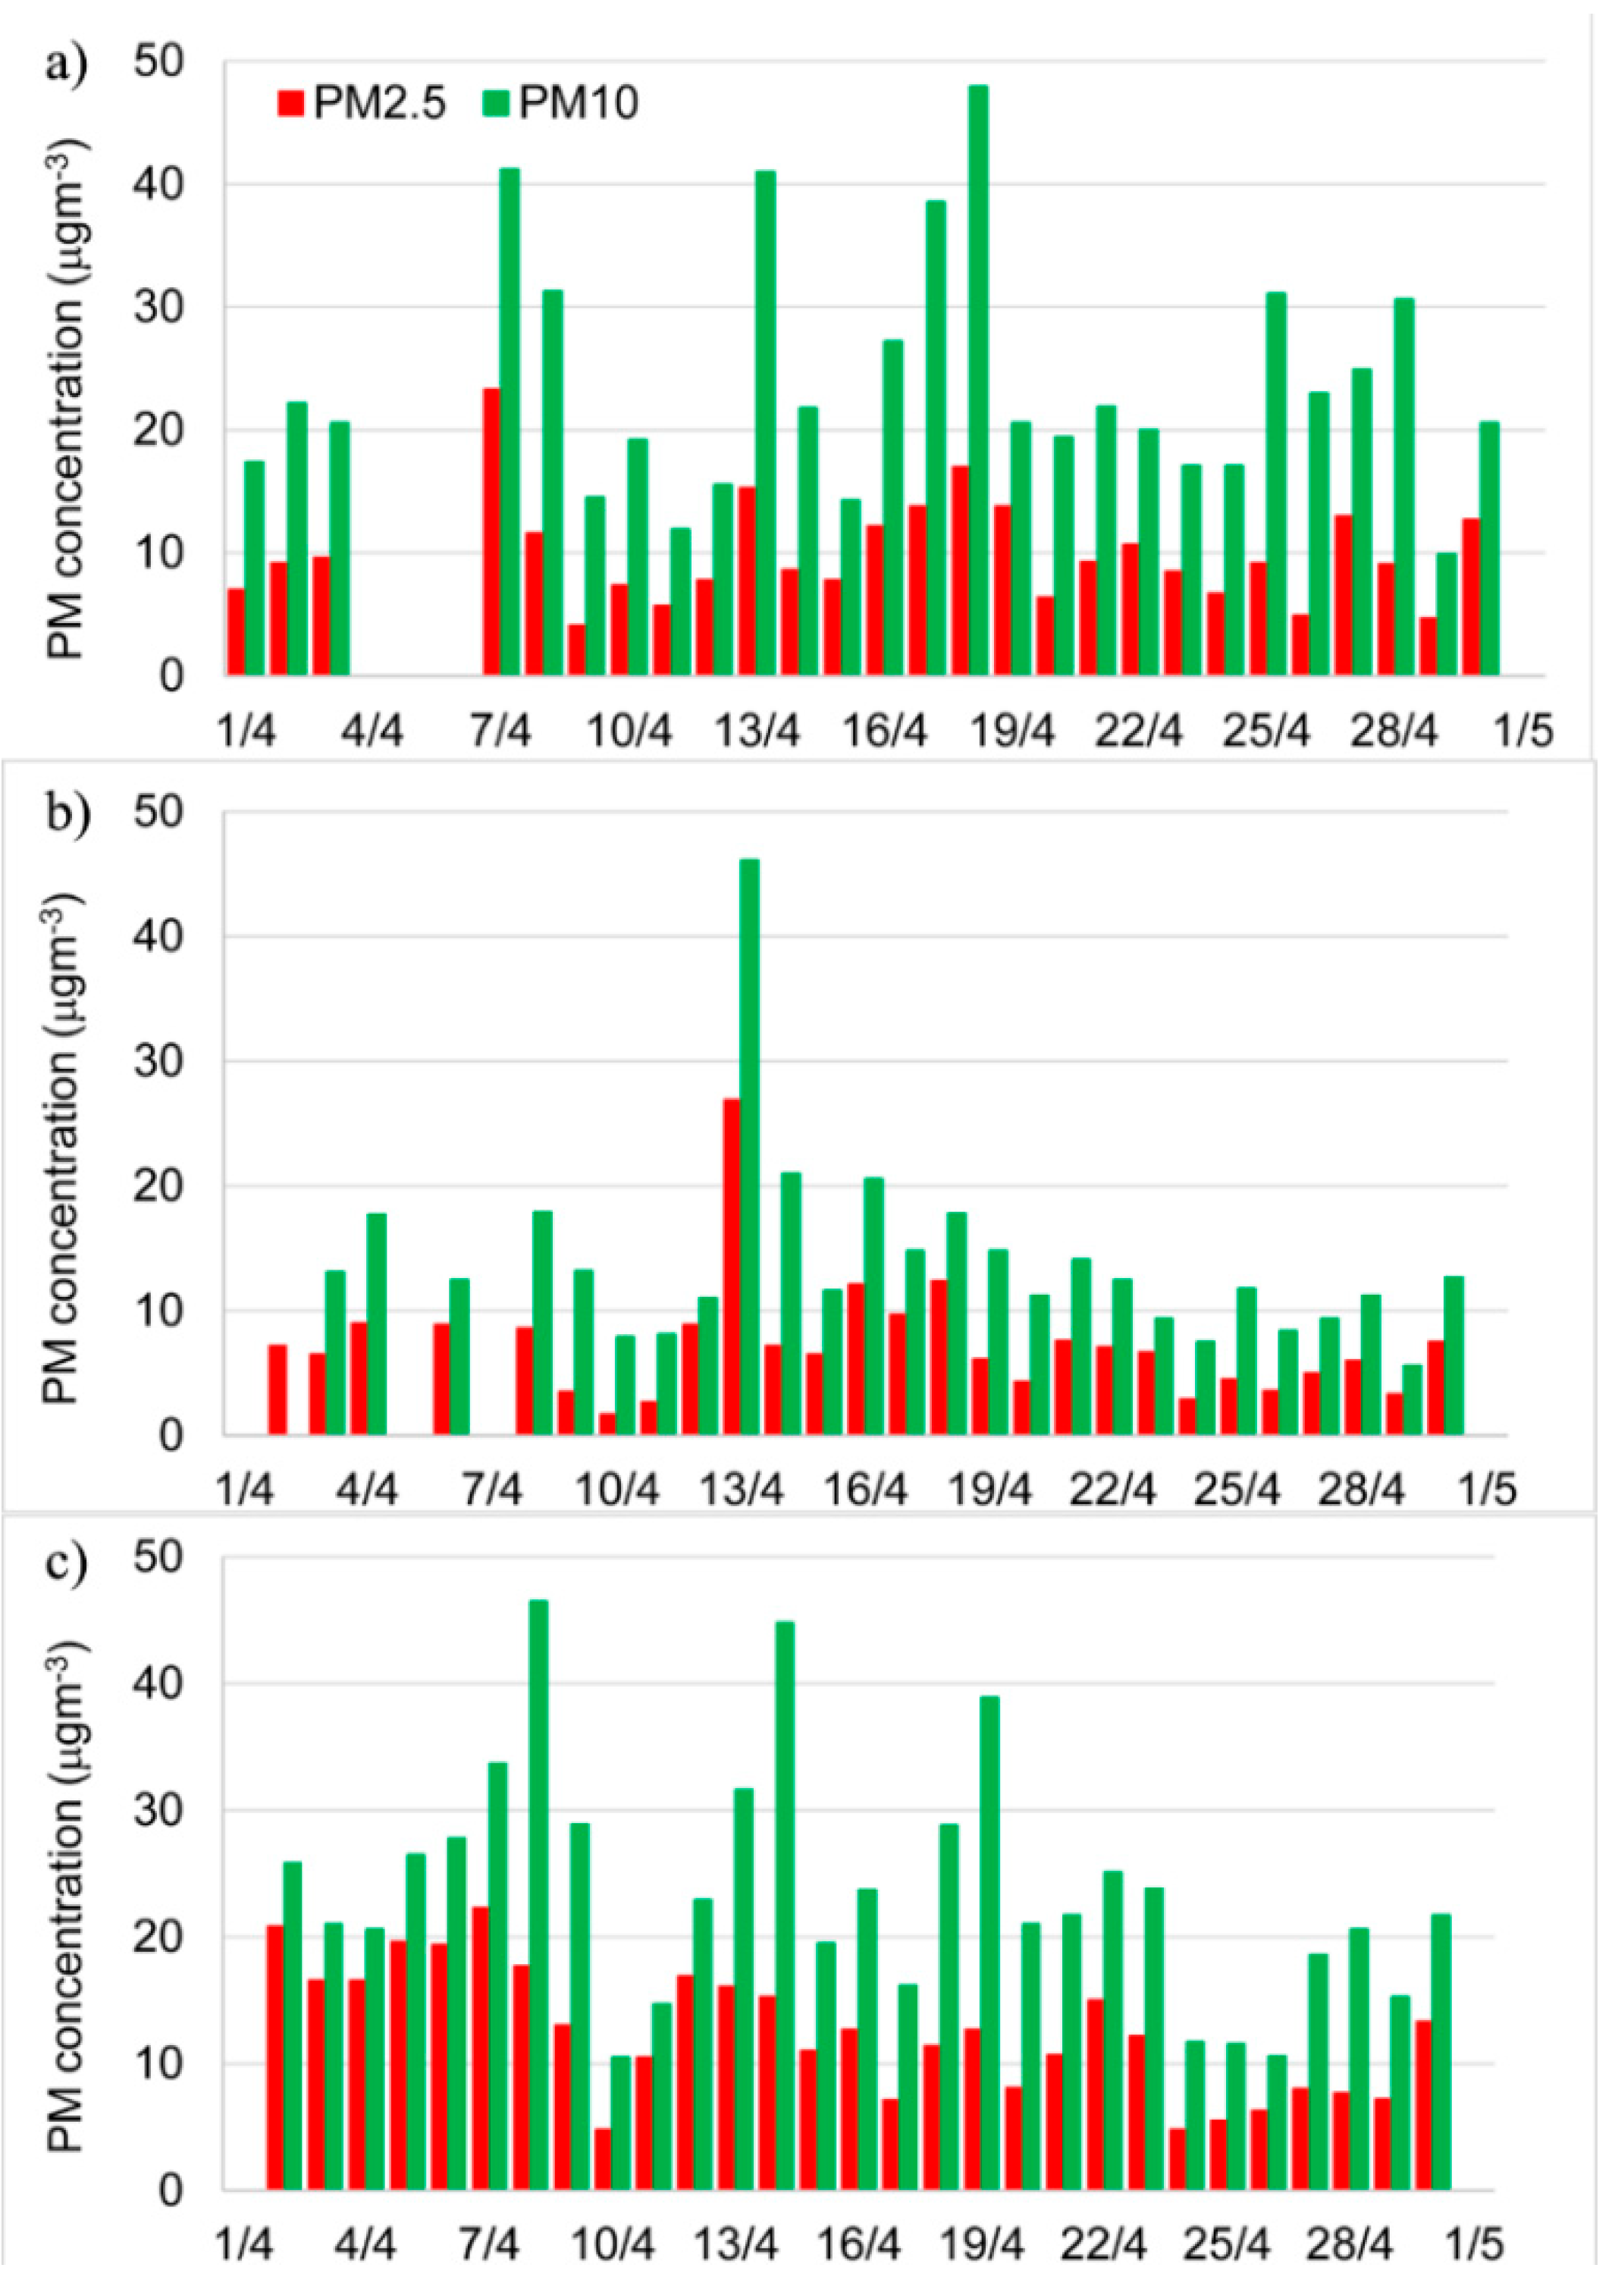
3.1. PM10 and PM2.5 Measurement

The CGR had an average concentration for PM10 during the measurement campaign of 23.7 ± 9.5 μg/m3. At LMT and ECO a PM10 concentration of 13.9 ± 7.7 μg/m3 and 23.6 ± 9.2 μg/m3 were measured, respectively. The average concentration of PM10 and its standard deviation for CGR and ECO were very similar, even if the correlation was very low (Pearson coefficient −0.064). PM10 concentration at LMT was lower than the other sites. The PM2.5 average concentrations were 10.0 ± 4.2 μg/m3, 7.3 ± 4.8 μg/m3, 12.5 ± 5.0 μg/m3, respectively for CGR, LMT, and ECO observatory.
In Figure 2, a time series of PM10 and PM2.5 concentrations are shown for the measurement period at three investigation sites. At CGR on 7th, 13th, and 18th April (Figure 2a), PM10 concentrations were greater than 40 μg/m3. At the LMT station on 13th April a PM10 concentration very high was registered (Figure 2b). At the ECO station, three days registered with high PM10 concentrations (greater than 40 μg/m3): 8th, 14th, and 19th April (Figure 2c).

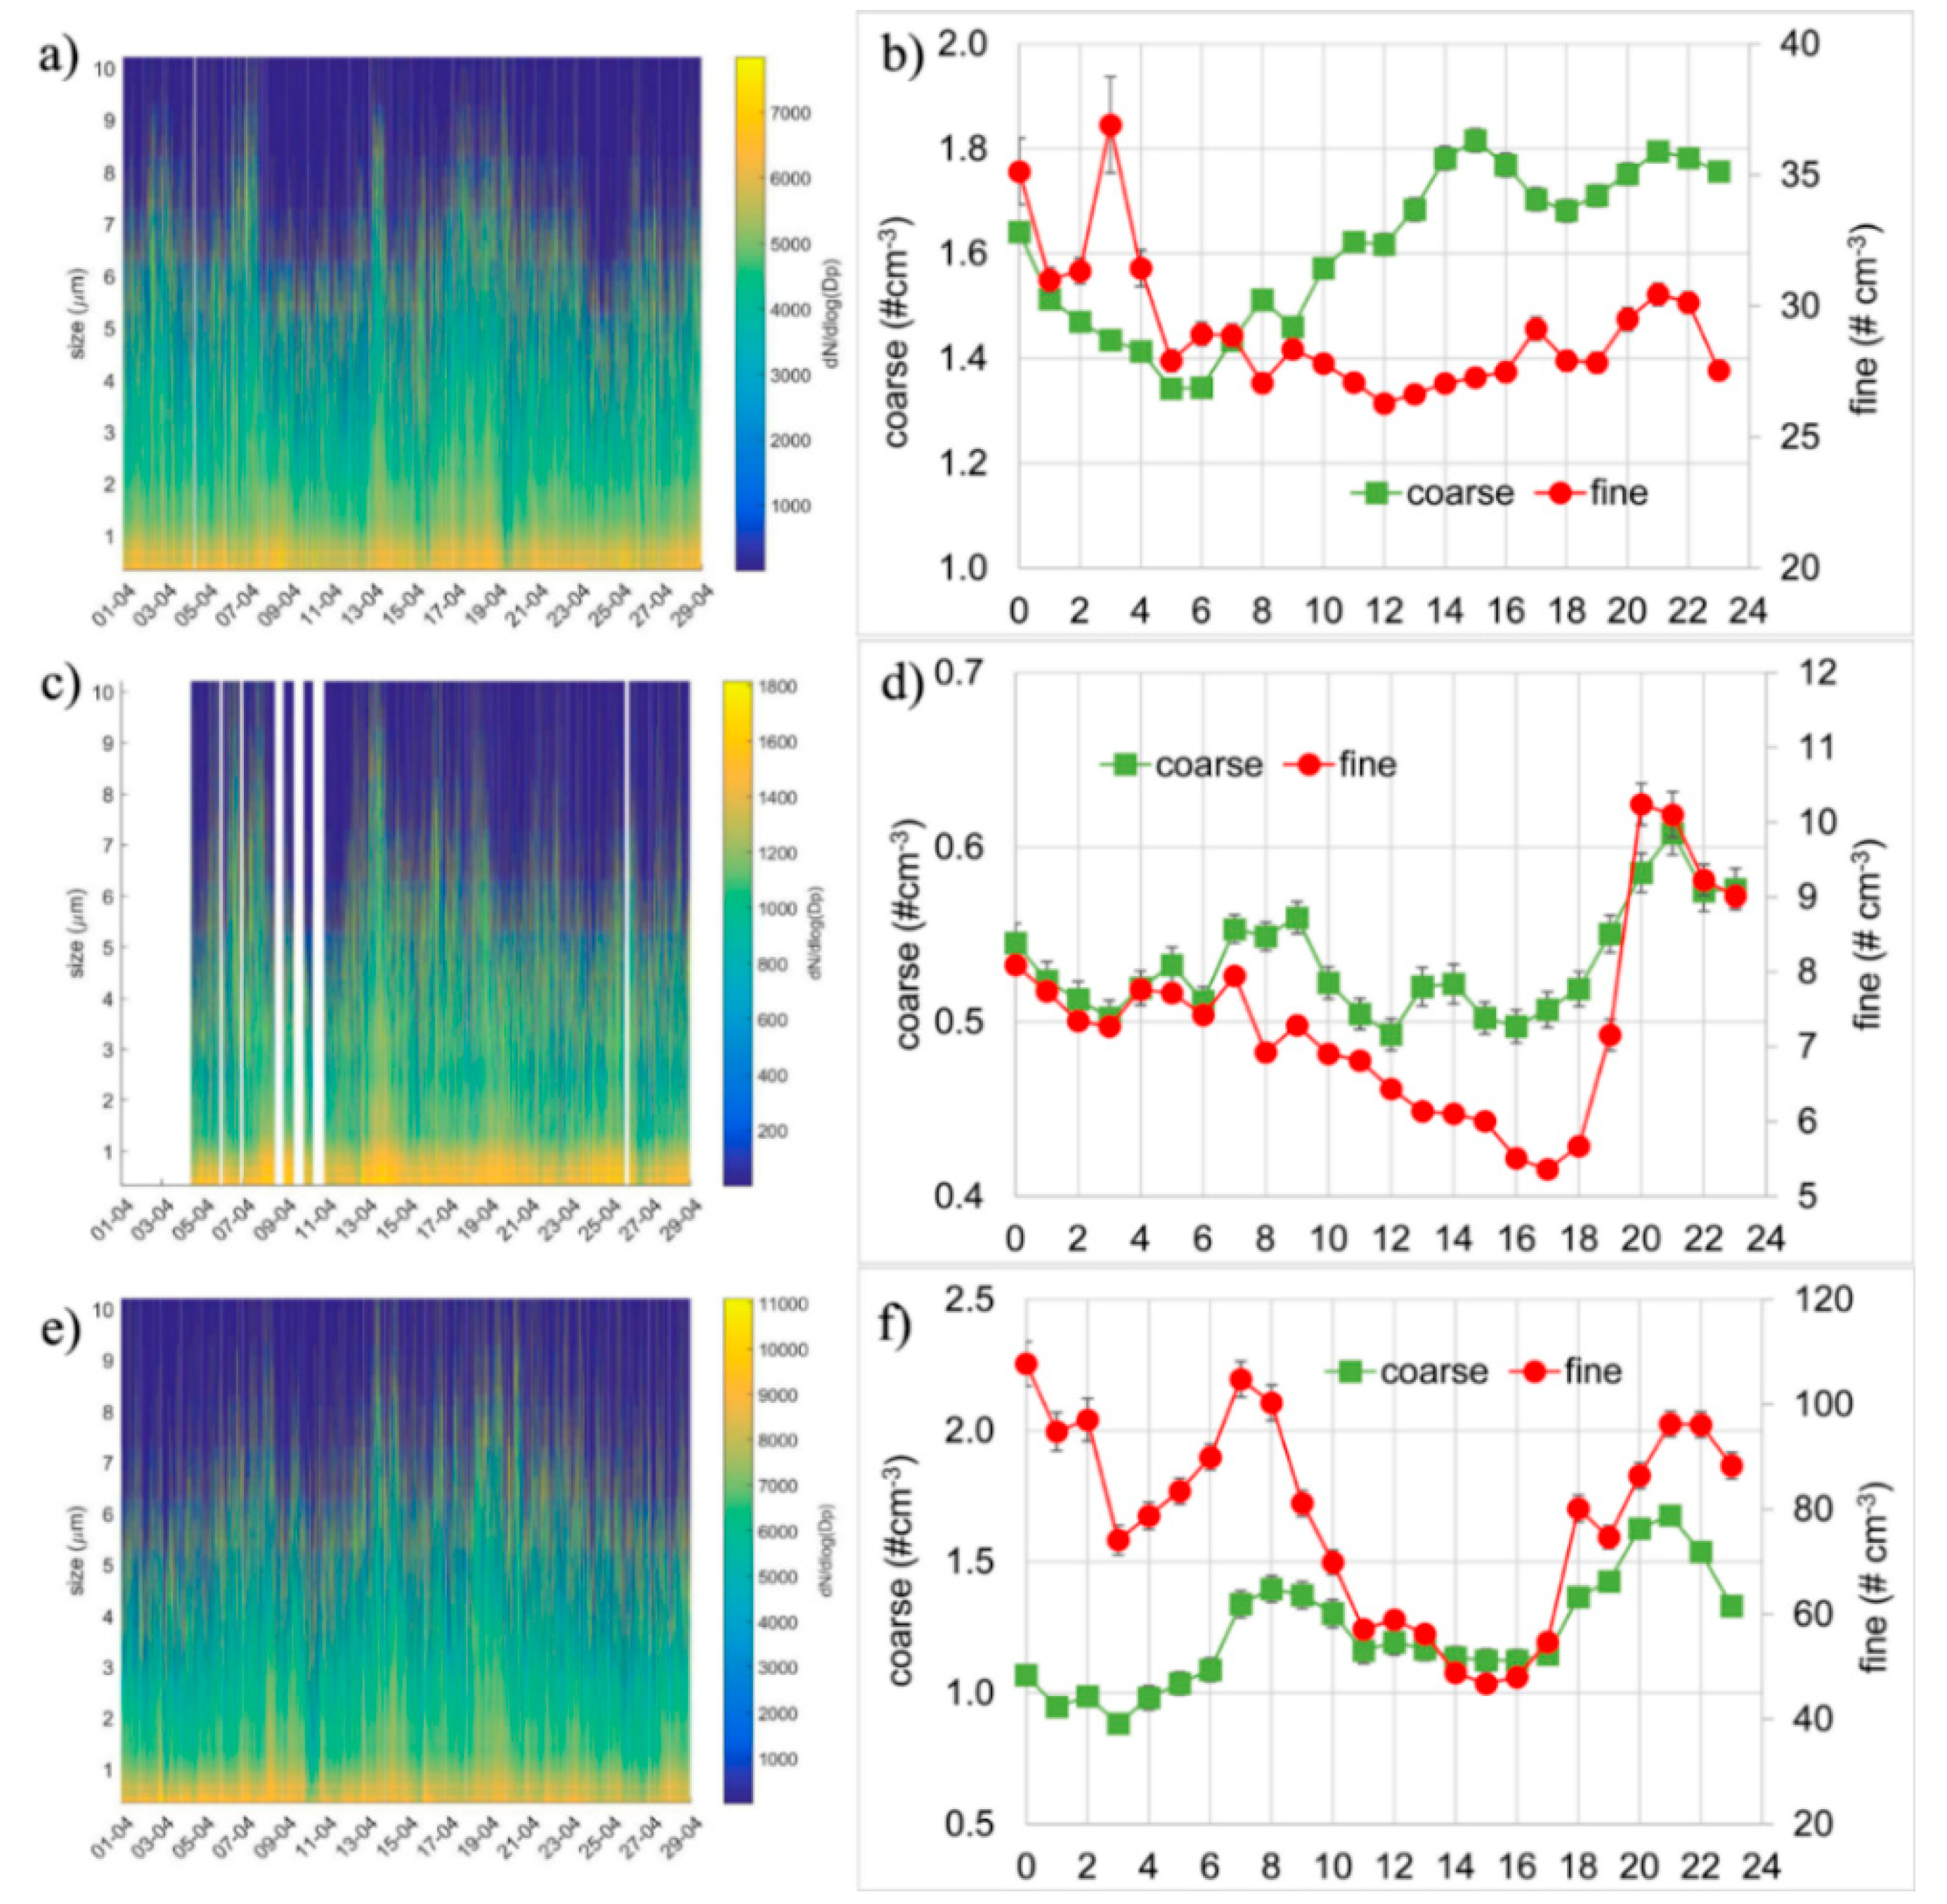
3.2. Aerosol Size Distribution

Size distribution measured with the OPC was divided into two groups based on particle diameter (Dp): fine mode (0.28 < Dp < 1.1 μm) and coarse mode (1.6 < Dp < 10 μm). In order to obtain clear information about the predominance of fine or coarse mode in specific periods, the relative coarse/fine ratio (%) was also used in this work. In the CGR observatory (Figure 3a), the average fine mode number concentration was 29.2 ± 20.8 particles (#) cm−3, while coarse particle number concentration was 1.6 ± 0.8 # cm−3 with a mean relative ratio 5.5%. This ratio is representative of a rural environment with sporadic intrusion of anthropic pollution [37]. At the LMT site (Figure 3b), the mean fine and coarse mode number concentration were, respectively, 7.3 ± 4.8 # cm−3 and 0.5 ± 0.4 # cm−3 with an average relative ratio of 7.2%. At the LMT site, the average relative ratio was greater with respect to CGR. As matter of fact, the CGR site should be considered the anthropic contribution to air pollution due to vessel emission (in the fine mode) from the nearby harbour. In the ECO area, the results (Figure 3c) showed an average relative ratio of 2.1% with a mean concentration for fine mode of 56.3 ± 50.1 # cm−3 and for coarse mode of 1.2 ± 0.9 # cm−3.
Diurnal variations in fine and coarse mode concentration were calculated and they are shown in Figure 3 (right panels) for the whole measurement period. Results showed a different behaviour for the three sites, as expected. In CGR (Figure 3b), results showed a particle concentration peak in the early hours of night (between 01:00 and 04:00) and a smoother evening peak (between 19:00 and 23:00) for fine particles (with a maximum of 36.9 # cm−3). On the other hand, coarse mode increases from the morning until 15:00 with a peak in concentration of 1.82 # cm−3, with a second peak at 21:00 (max 1.38 # cm−3). This behaviour could be related to the typical contribution of anthropic/marine sources in the measurement site controlled by the land/sea breeze. Also at the LMT observatory (Figure 3d), results showed a decrease in the morning, from about 6:00 until 17:00 (min 5.36 # cm−3), and a very evident peak (until 10.2 # cm−3) in the evening (about 20:00) for fine mode; once again this behaviour could be associated with the land/breeze cycle in the coastline. At LMT, coarse mode daily pattern showed a peak in the morning from 7:00 to 9:00 and a second maximum at 21:00 (0.60 # cm−3). At ECO station (Figure 3f), results show a particle concentration peak early in the morning (between 06:00 and 08:00) and an evening broad peak (between 18:00 and 21:00) visible, essentially, on fine mode particles. This behaviour could be related to the typical contribution of road traffic (rush hours) around the measurement site [60]. In the evening, coarse mode also shows a peak (from 18:00 to 21:00); this is due probably to traffic activity and in general to activities in urban areas. It is not excluded as it is a contribution of domestic heating in rural areas starting late in the afternoon during the spring season.

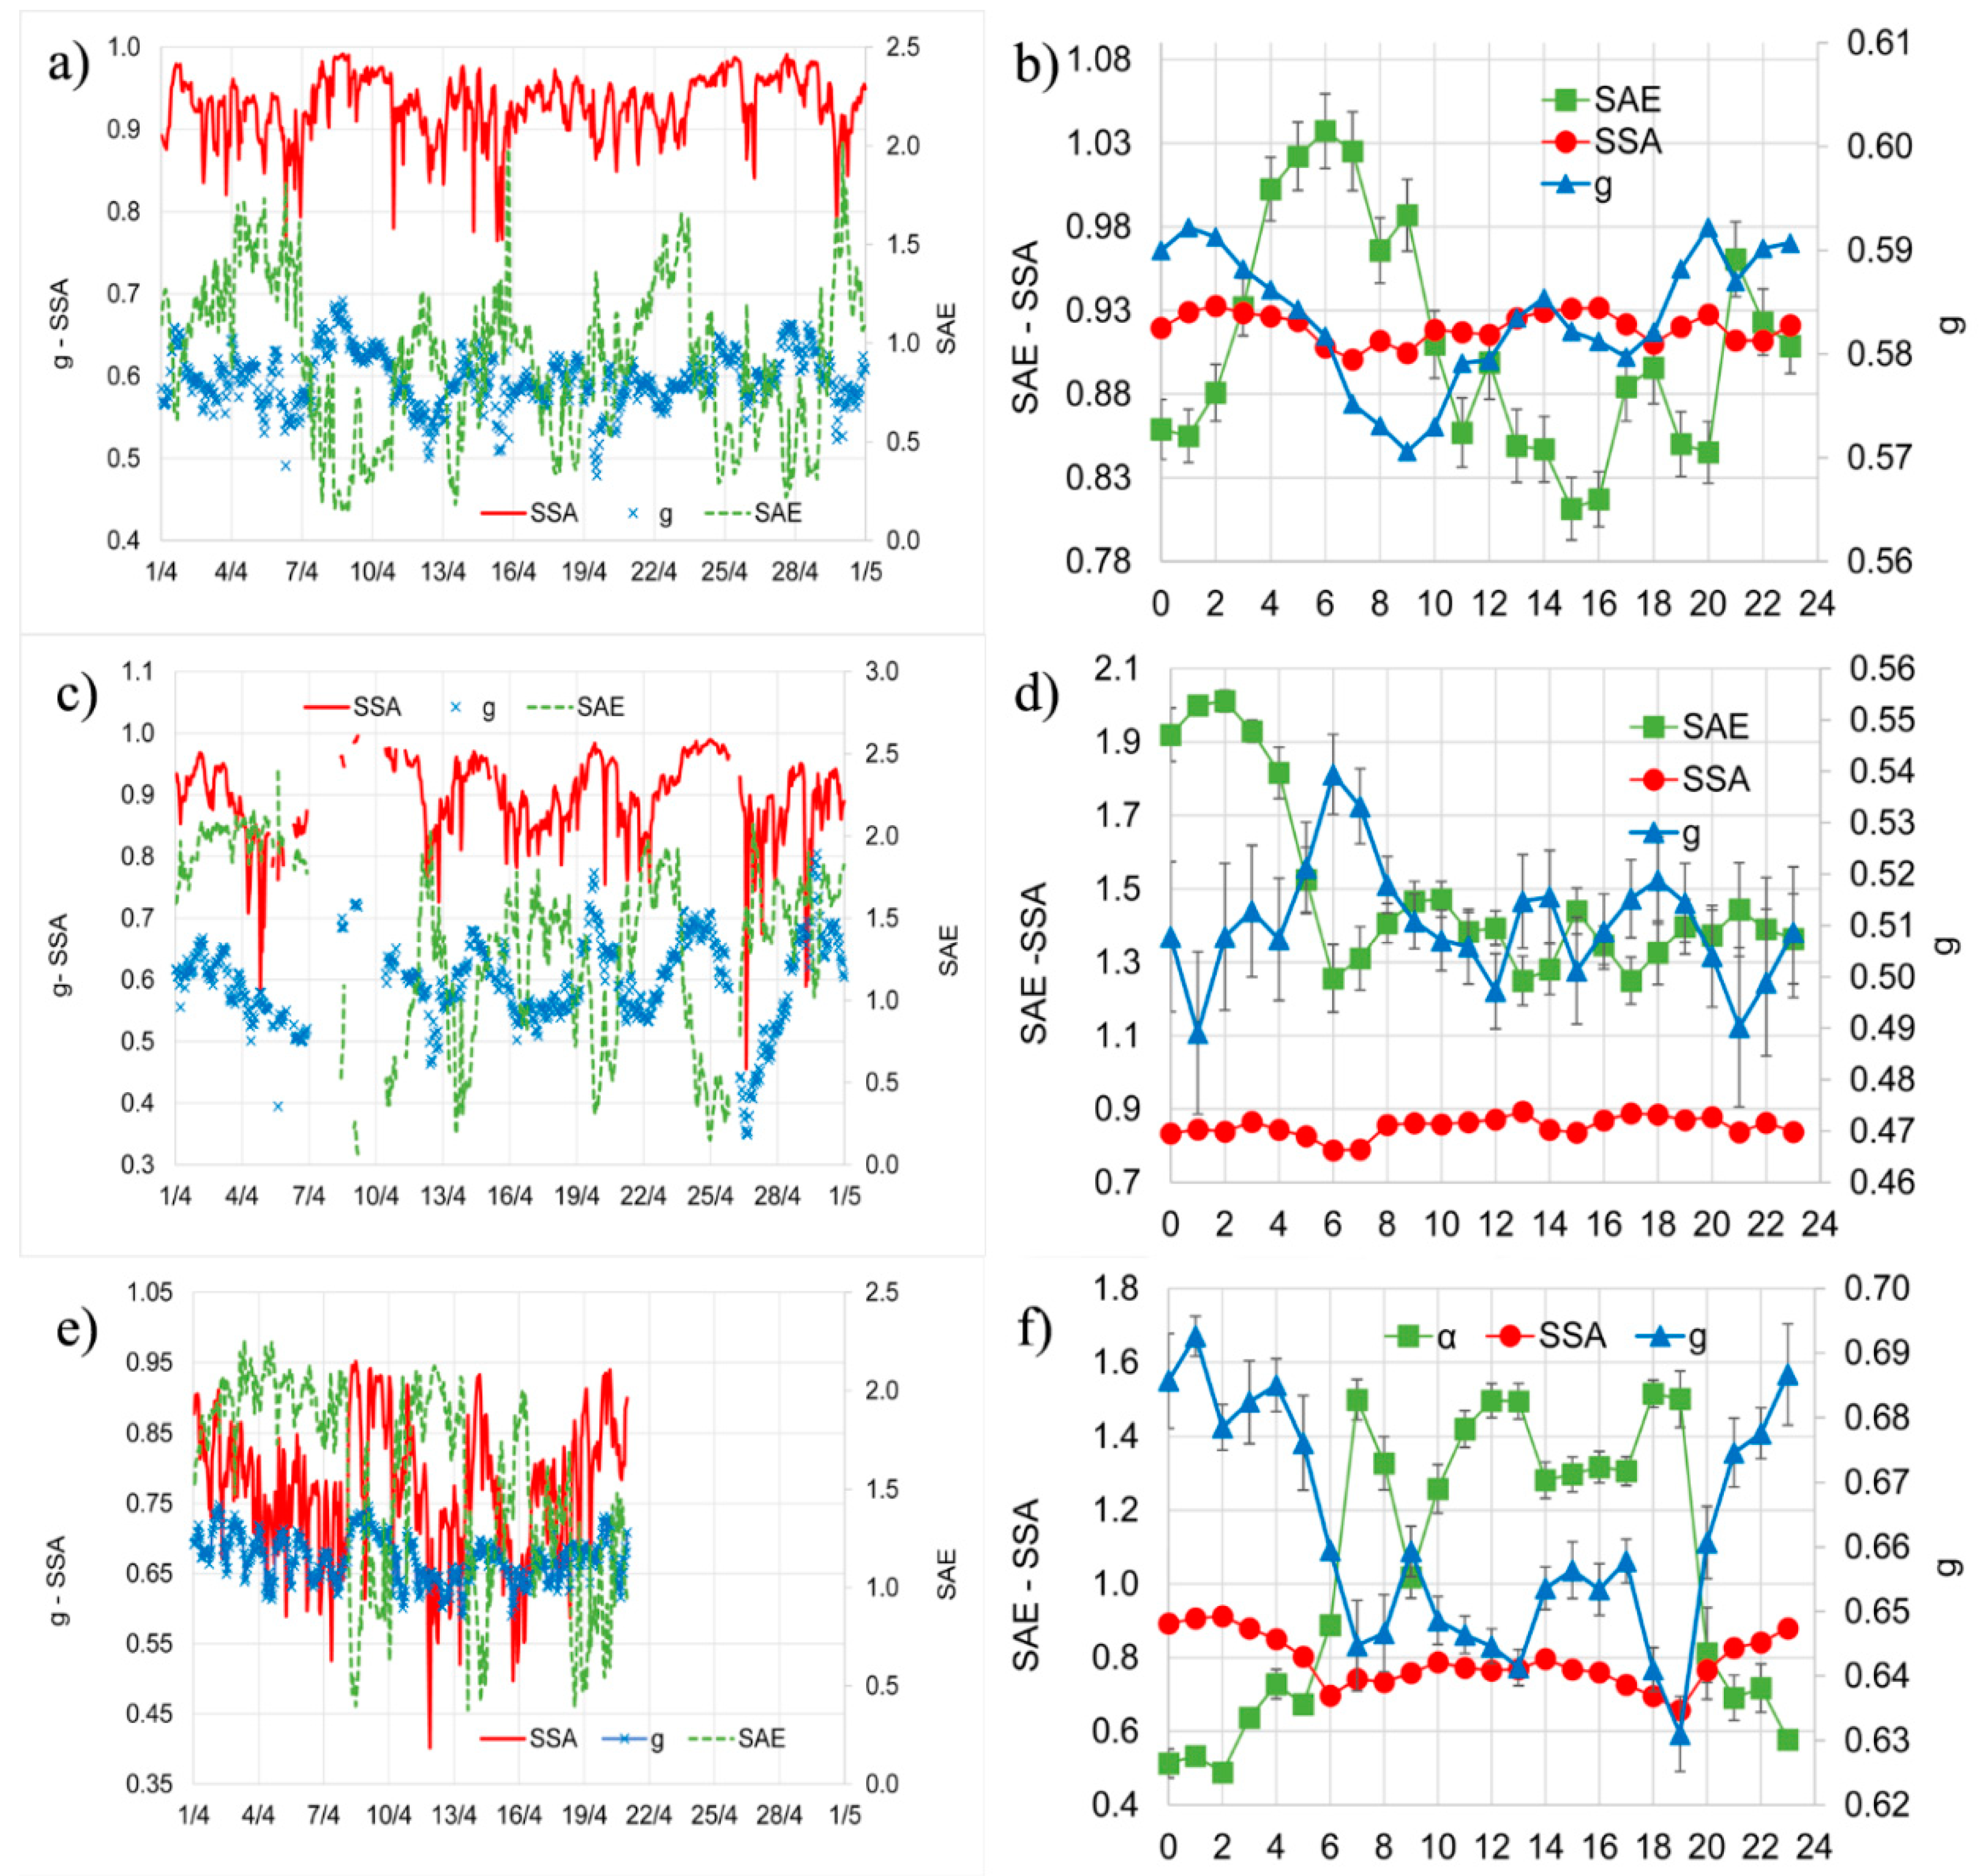
3.3. Aerosol Optical Properties

Statistical analyses of aerosol optical properties over the whole measurement period are presented in Table 1, Table 2 and Table 3 for CGR, LMT, and ECO observatory, respectively. In LMT observatory the nephelometer was working correctly all the month except from 5th to 10th April, when it worked occasionally due to technical issues. In the ECO observatory, the nephelometer dataset is complete until 20th April, because the instrument was inactive in the following remaining period.
The observed values for scattering coefficients in the three measurement sites were in good agreement with other authors: in Reference [61] for the same month (April 2002 and 2008) the hourly mean of about 33.8 ± 26.5 Mm−1 and 34.7 ± 27.1 Mm−1, was observed, respectively in Evora (Portugal). In the warm season, in the site of Finokalia in Crete (Greece), a mean value for scattering coefficients of 44.2 ± 17.5 Mm−1 was found [48]. In Lecce (Italy), in a suburban area (not very distant from ECO site), scattering coefficients (at 450 nm) of 100 ± 50 Mm−1 were observed on a yearly average [62].
In Figure 4, time series (hourly mean) are shown for SAE, SSA, and g throughout the entire campaign at CGR, LMT, and ECO, respectively. SAE mean value for the period was (1.28 ± 0.51) at ECO station and 1.49 ± 0.54 at LMT. At CGR, SAE was lower than the other two stations, with a value of 0.92 ± 0.38, indicating clearly that ECO and LMT sites were more influenced by anthropic emissions. The lowest mean SSA value (0.77 ± 0.09) was found at ECO observatory and it can be related to the increased contribution of absorbing particles from local anthropogenic activities (domestic heating based on fuel oil combustion and vehicular/industrial emissions) typical for this suburban station [63]. At the CGR station g hourly values ranged from 0.44 to 0.67, at LMT it ranged from 0.37 to 0.71, and at ECO station from 0.51 to 0.76. In these three sites, a different diurnal variation in all coefficients was observed, as shown in Figure 4. In CGR and LMT, both coastal sites, diurnal pattern (Figure 4b,d) of the scattering data may be the result of the effect of sea-land breeze circulation. In the period from 6:00 to 16:00, a transport of greater sea salt particles was observed, with a corresponding decrease of SAE and a corresponding increase of SSA. While, at the ECO station, a typical urban daily variation was observed, with a bell shape beginning at about 6:00 and decreasing at about 19:00. This particular shape was probably due to urban traffic emission and in general anthropic activities in the surroundings of the site. In the measurement period at all three observatories, g showed a diurnal variation counter-correlated with SAE, and in particular, a decrease with the intrusion of fine particles (pollution aerosols) in the sites.

4. Discussion

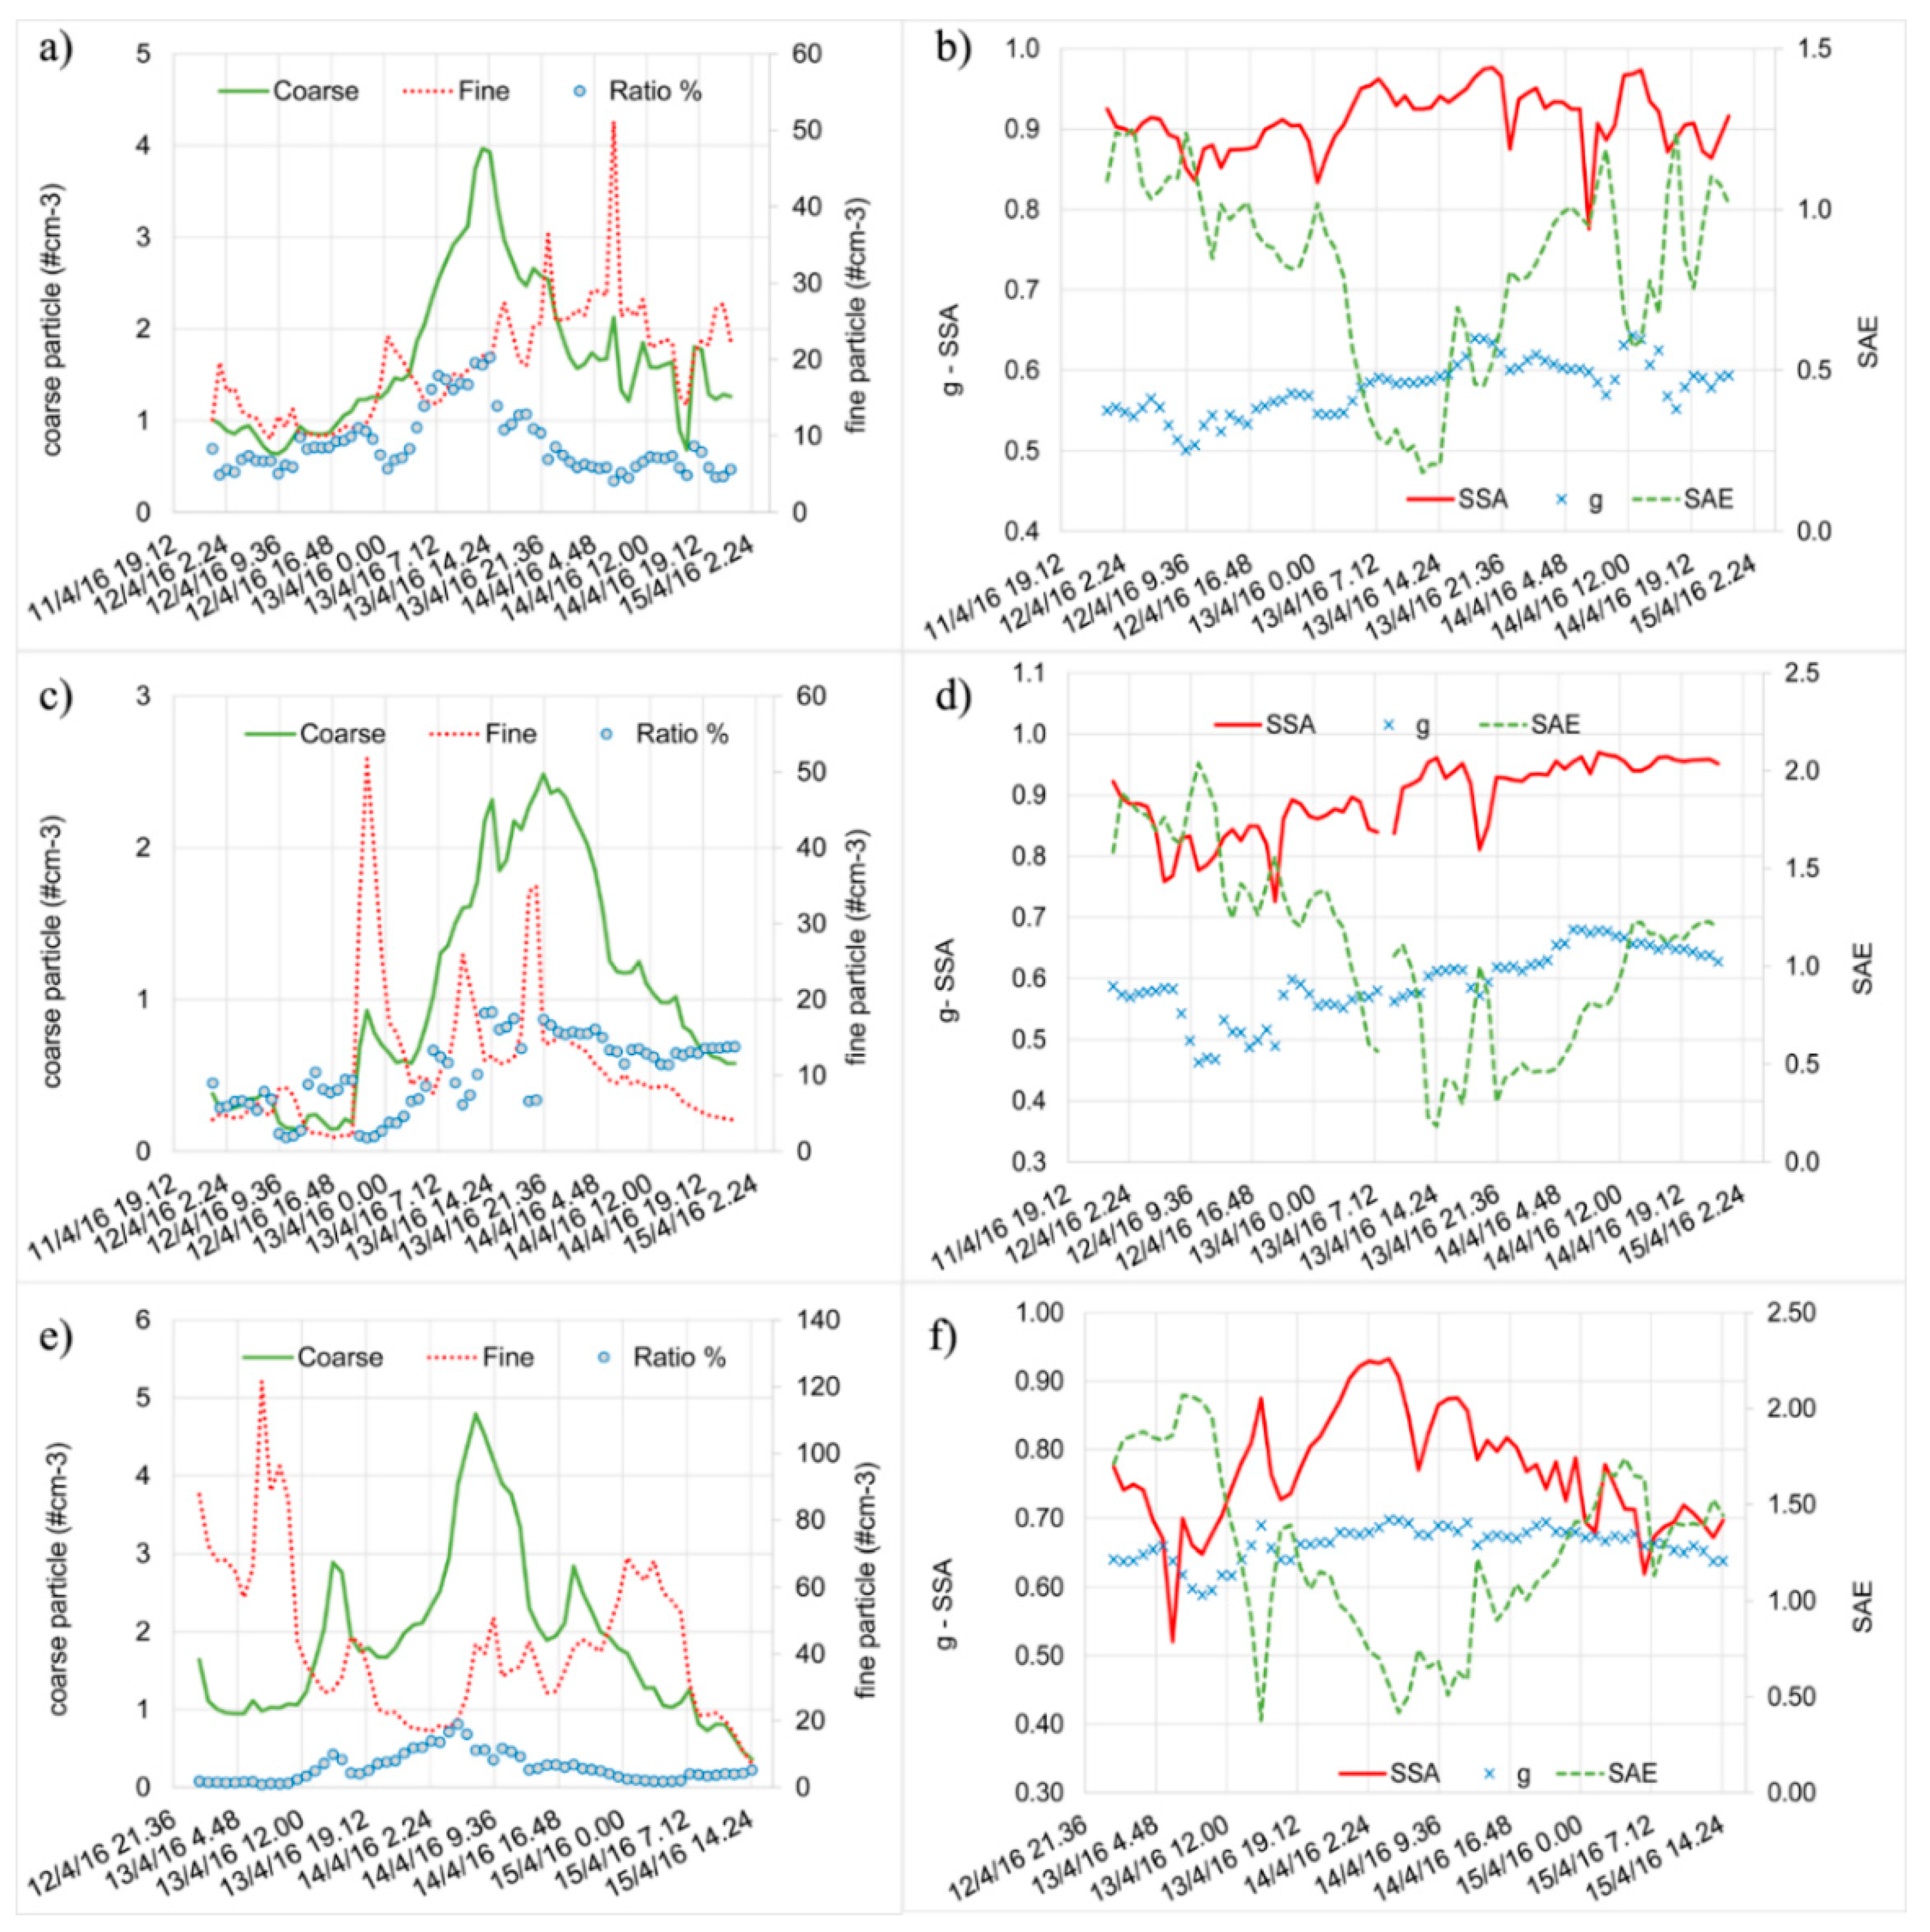
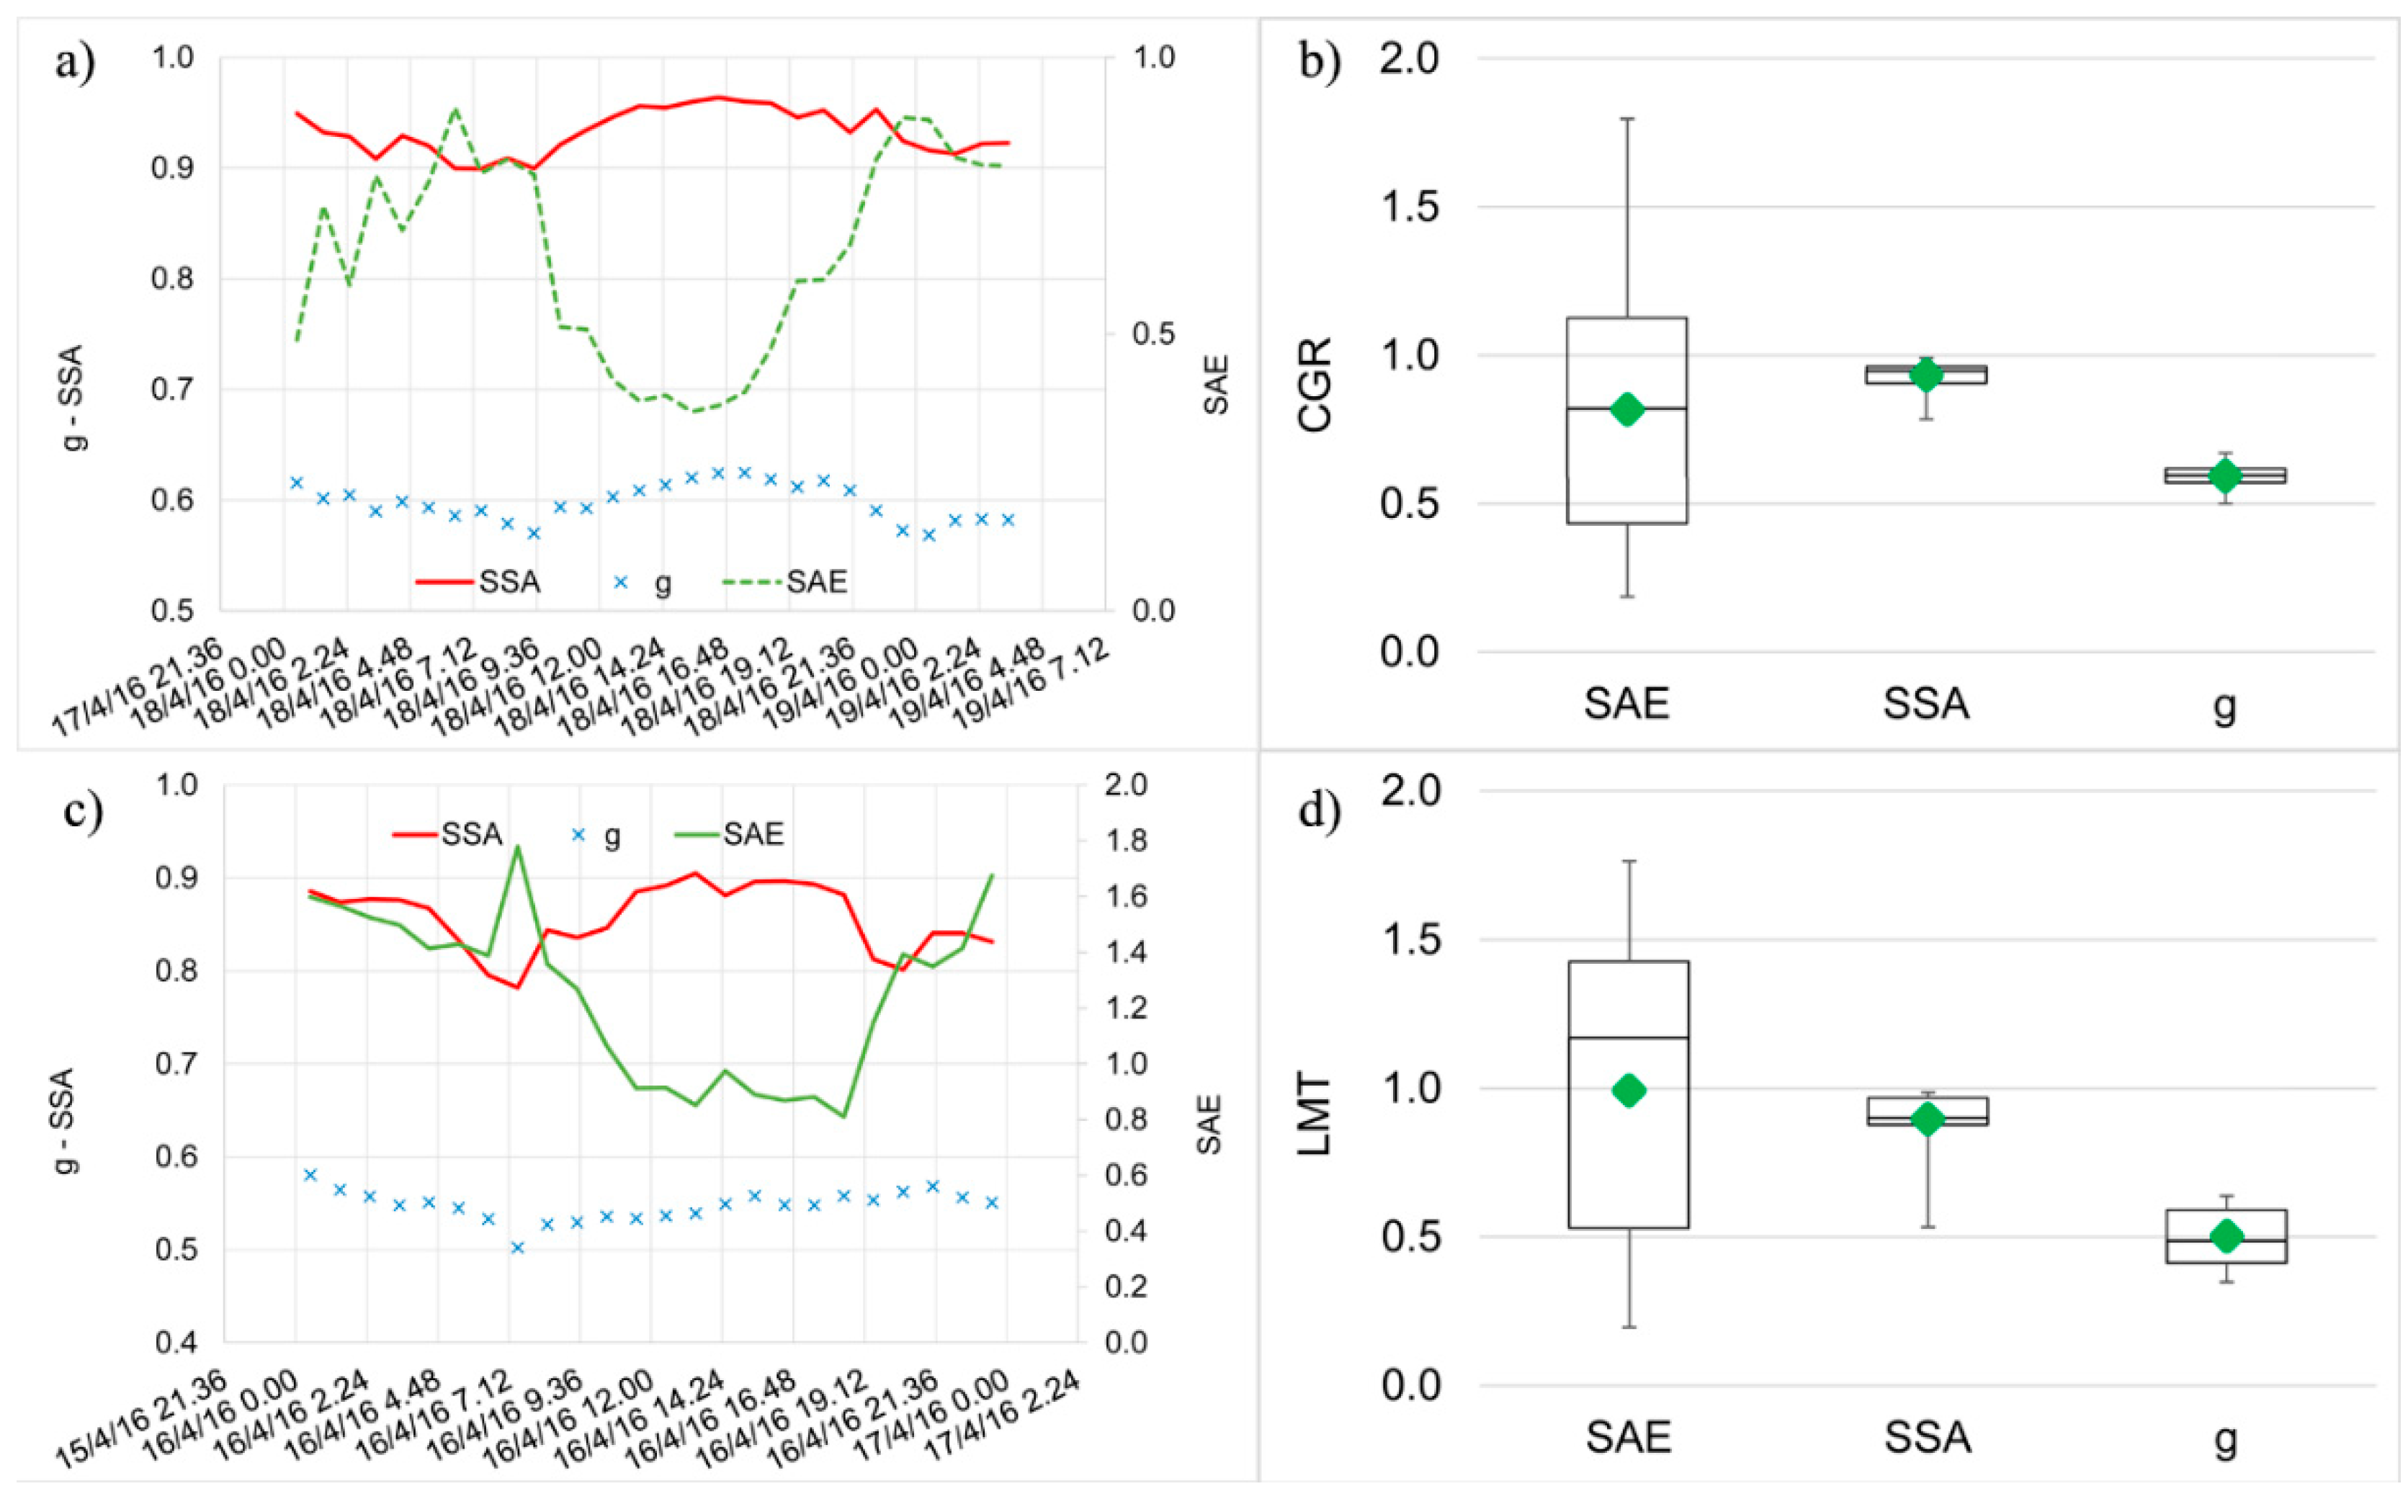
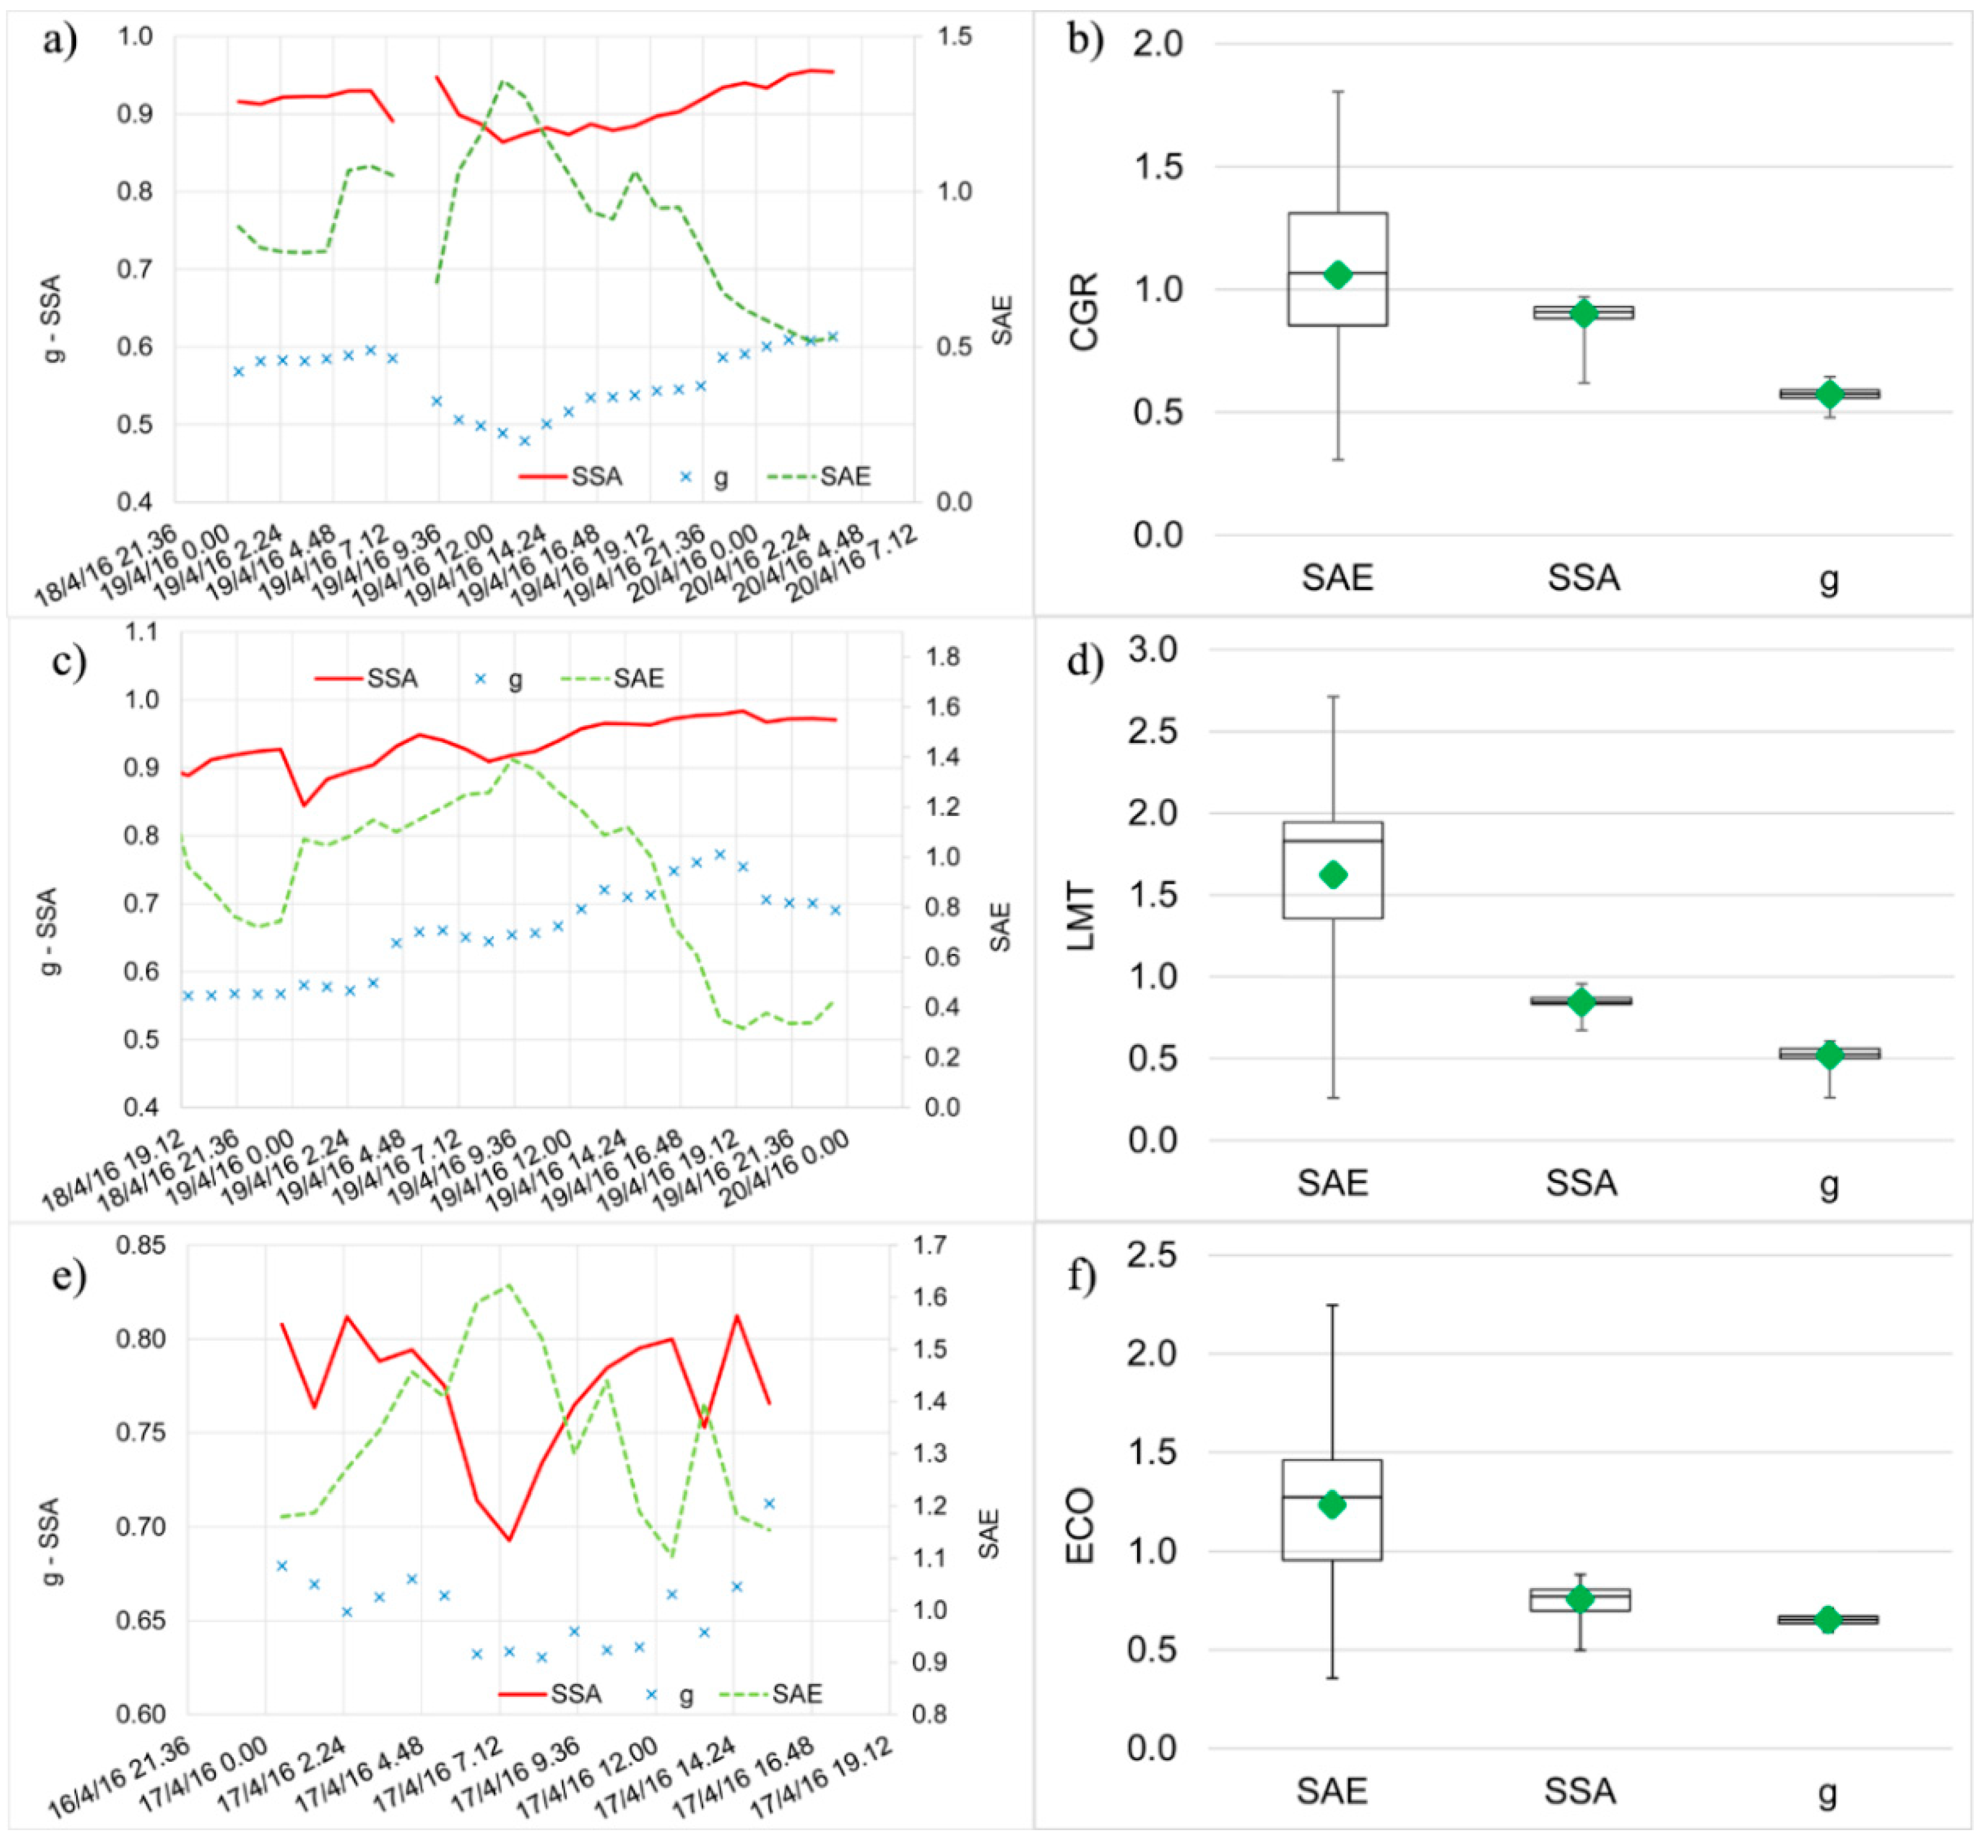
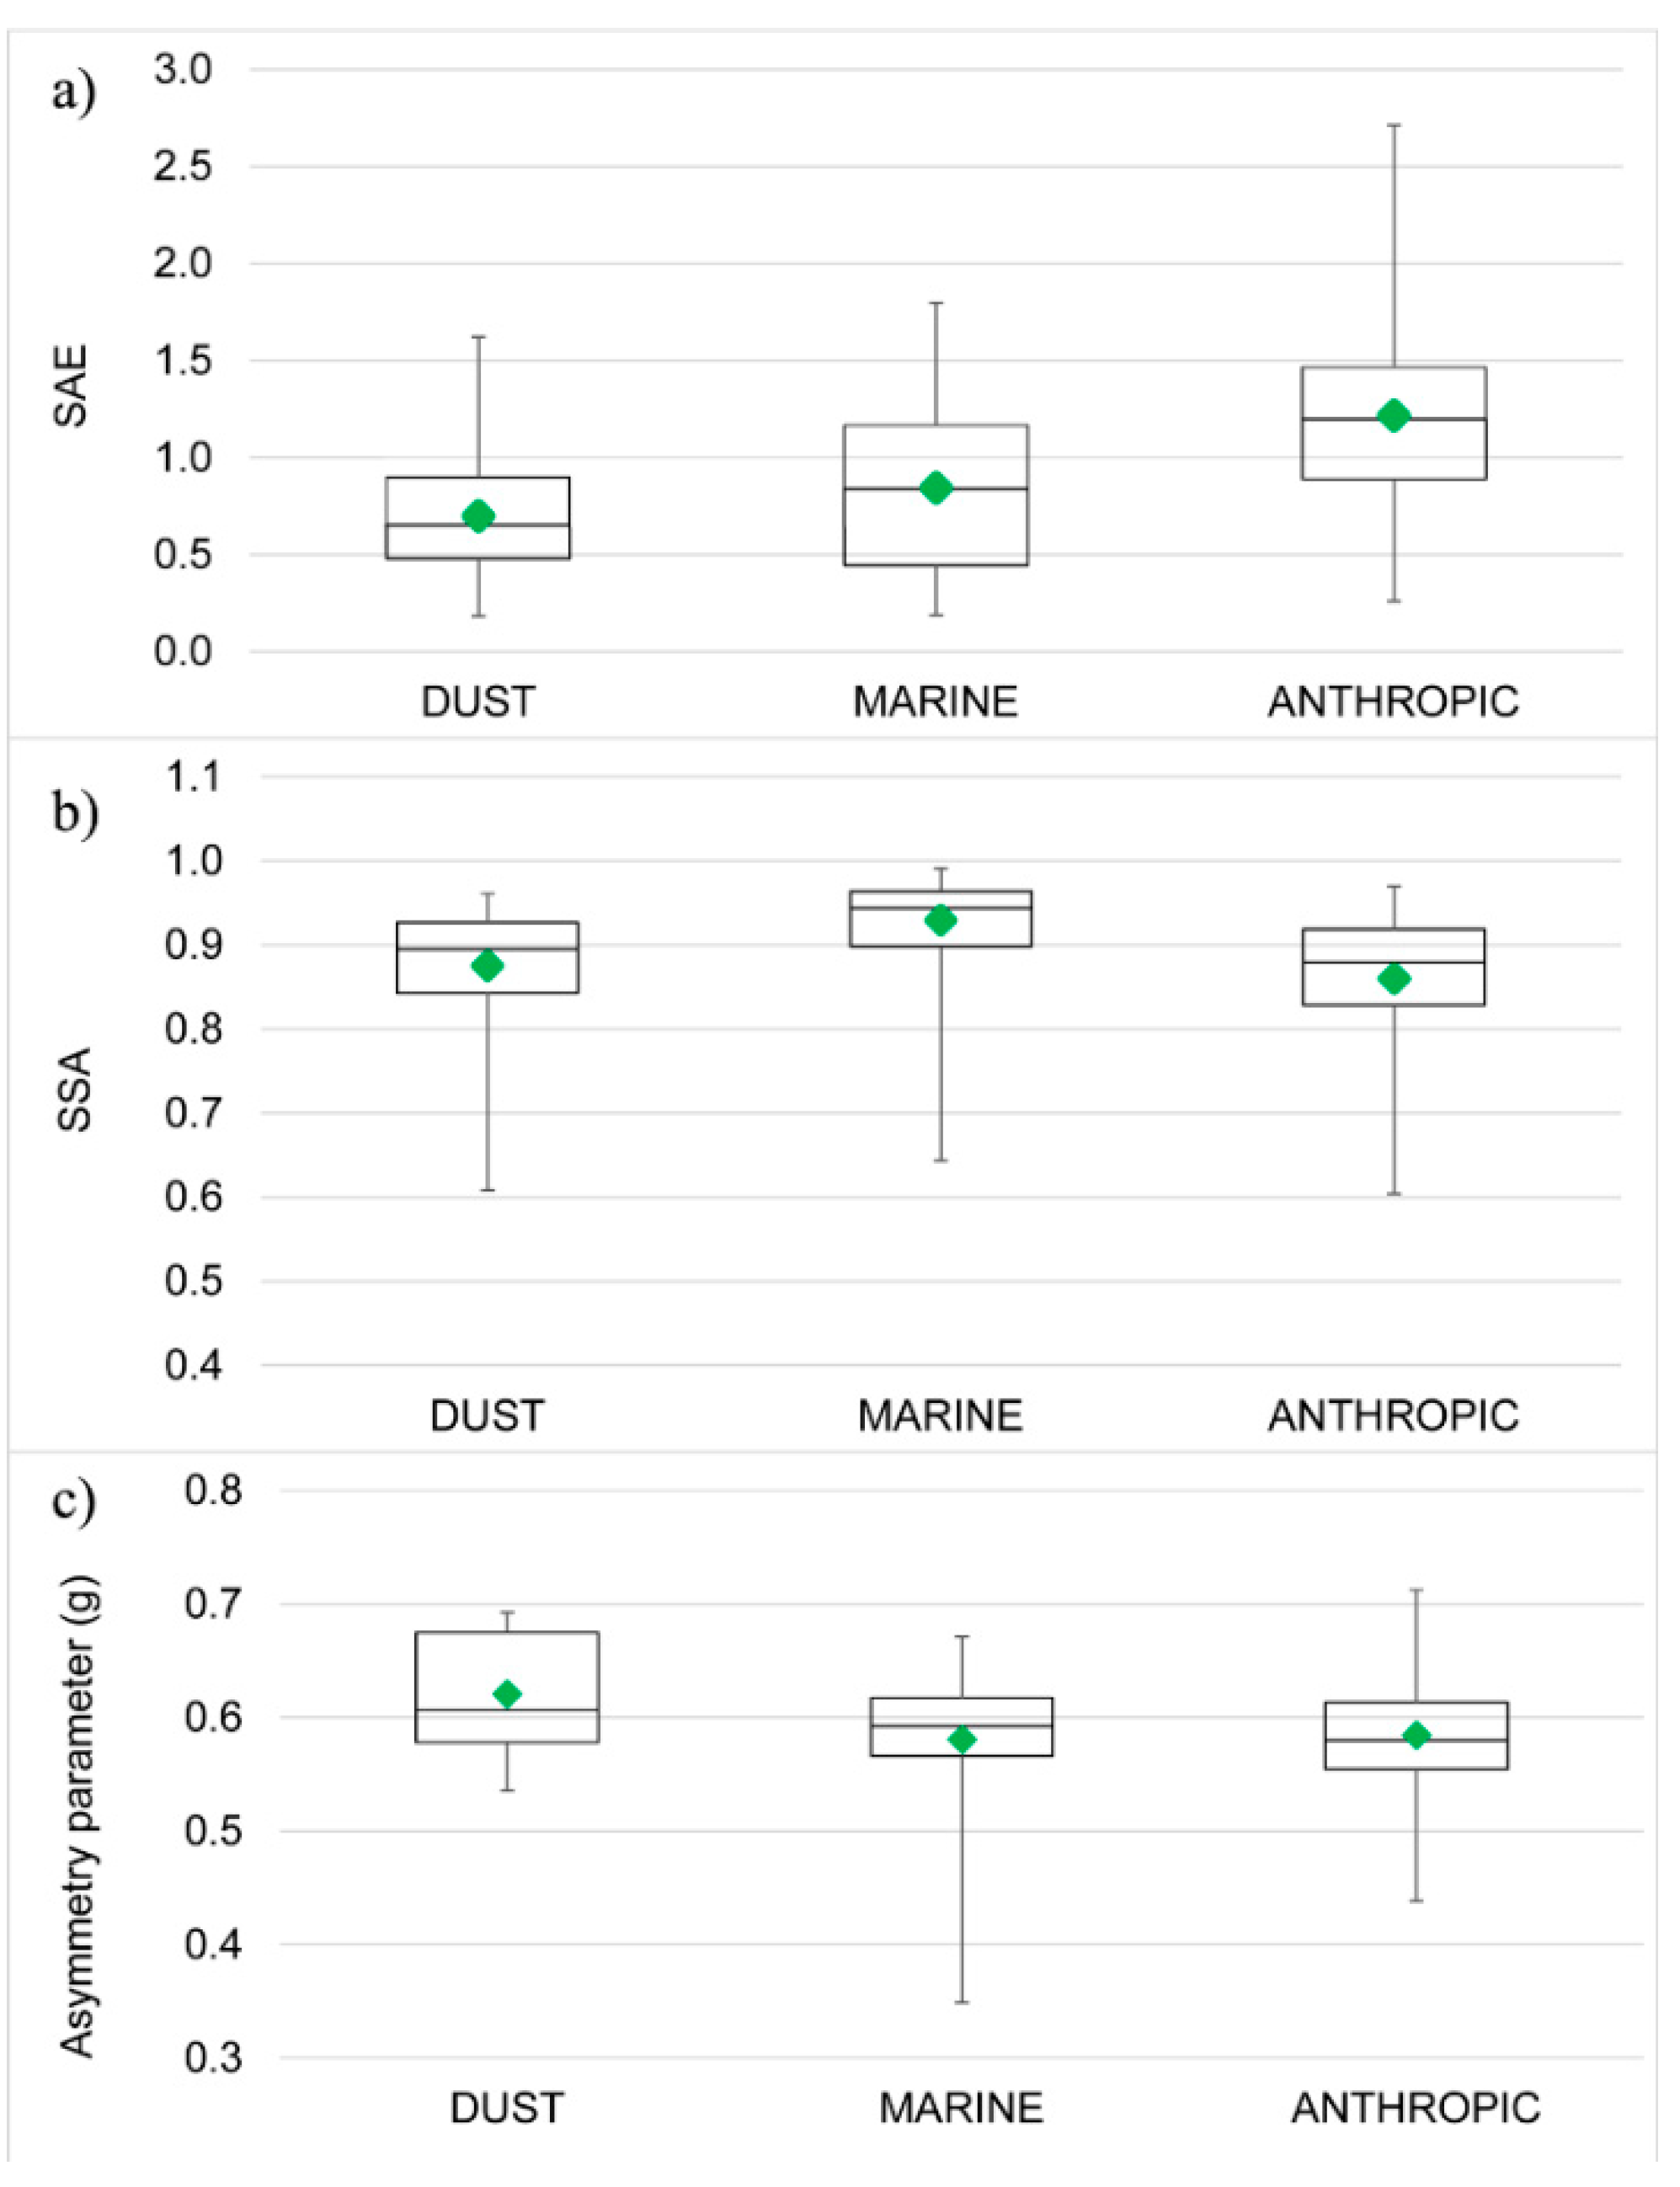
4.1. Desert Dust Event

A case study of a Saharan dust event, with a long-range transport from Northern Africa, is analysed in this section. The event lasted from 12th April (12:00 UTC) to the early afternoon (15:00 UTC) of 14th April 2016. During this Saharan event, a low ratio PM2.5/PM10 was observed, with a predominant presence of coarse particles (in the fraction PM10). Over these days, a maximum PM10 concentration of 41 μg/m3 (ratio 0.37), 46.1 μg/m3 (ratio 0.58), and 44.8 μg/m3 (ratio 0.34) was observed, respectively, in CGR, LMT, and ECO stations (Figure 2). A synoptic analysis was conducted to study the meteorological conditions during this dust event (not shown here). At 12:00 UTC on 12th April an intense ridge was well evident over the central Mediterranean. This structure separated two depression areas over Western Europe and Turkey respectively; the former minimum was accompanied by high altitude cooler air. Because of this configuration, intense southwesterly currents from Africa affected Central and Southern Italy. This synoptic configuration remained fairly stationary over the following hours, with a gradual movement of the bridge towards the southeastern area of the Mediterranean. After 36 h, the central Mediterranean was characterized by a wide depression, resulting in the shifting and unification of the two lows. At the surface, there were two local predominant baric structures that determined the wind conditions for the case study: a low-pressure over northwest Africa and a high-pressure over Libya. The synergistic action of these baric structures determined the presence of intense southern currents (>10 m/s) from North Africa to Southern Italy. In the subsequent hours, there was a gradual decrease in sea level pressure on Southern Italy, with the consequent weakening of the winds coming from North Africa.
An extensive number of studies [64,65,66] described the way in which desert dust from North Africa is transported over the Mediterranean. Spring months were, generally, characterized by the formation of the so-called Sahara cyclones along North Africa from its western to eastern boundaries. In order to examine about the origin of aerosol particles, the HYSPLIT model was used to calculate back-trajectories for the period in investigation. From the study of back-trajectories, air masses can be observed arriving at 500 m height over CGR observatory on late 12th April (Figure 5a), and then approaching LMT station on 13th April in the morning (Figure 5b). After a few hours, the same air masses crossed over ECO on 14th April, between 6:00 and 12:00 (Figure 5c). Aerosol dust load maps and dry dust deposition simulated with the Dust Regional Atmospheric Model (DREAM) at Barcelona Supercomputing Center (BSC) were also used (Figure 5d–f) to analyse the Sahara event described.
At the measurement sites (surface level), the fast passage of the air masses was due to the strong meridional flows with maximum wind velocity of 6.1 m/s (13th April) and a westerly wind velocity at 8.1 m/s (14th April) in LMT and CGR, respectively. At the ECO observatory, wind velocity ranged from 6 m/s to 8 m/s. From surface size distribution measurements, strong peaks of dust activity in the three observatories appeared during the events with the coarse to fine ratio maximum values of 20.3%, 18.3%, 18.9% at CGR, LMT, and ECO, respectively (Figure 6—left panels). Figure 6 shows the time series of SAE, SSA, and g for the period 12th–14th April 2016 at the three observatories. As can be observed, SAE had very low values during the period 13th–14th April, evidencing a predominance of coarse particles. It measured 0.69 ± 0.34, 0.58 ± 0.33, and 0.75 ± 0.28, respectively at CGR, LMT, and ECO observatories. During this period, σsc (450 nm), σsc (550 nm), and σsc (700 nm) parameters (not shown in figure) increased for each station in respect to monthly mean reported in Table 1; in particular σsc (450 nm) increased considerably reaching values up to 288.1 Mm−1 at LMT, 97.2 Mm−1 at CGR, and 74.7 Mm−1 at ECO station. Relatively higher values of the SSA and g were measured, at the time as the Sahara dust event at the three observatories, as shown in Figure 6b,d,f. In particular SSA measured 0.92 ± 0.04, 0.91 ± 0.04, and 0.81 ± 0.08 at CGR, LMT, and ECO, respectively. They were consistent with other values cited in the literature for desert dust [50,67,68,69]. Regarding asymmetric parameters during the dust event, it increased reaching values up to 0.62, 0.61, and 0.69 at the CGR, LMT, and ECO sites, respectively. These values are very close to that found by References [70,71] on the island of Lampedusa in the Central Mediterranean.

4.2. Marine Contribution

Selecting data according to wind direction from the sea side (sector 110°–330° for CGR and 210°–330° for LMT), marine aerosol has been analysed. In this process, also, the high velocity (>4 m/s) wind values were taken in consideration for the data selection. In the two coastal stations an intrusion of sea salt can be argued [72]. In the case of the ECO measurements, which is farther from the coastline, the direct influence of sea salt is probably lower and the air masses that reach the site are affected by urban pollution, and more in general, anthropic pollution. Thus the ECO observatory was excluded from the analysis of marine aerosol contributions. Mean asymmetry parameter at the LMT station was 0.50 ± 0.10, reaching its maximum (0.64) in correspondence of the well-developed sea breeze in the central hour of the day. SAE was on average 0.99 ± 0.49, whereas the SSA mean value was 0.90 ± 0.09 [47]. A similar behaviour can be found at CGR (Figure 7a) with g in the range between 0.50 and 0.67 [70]. SAE was 0.82 ± 0.40, while SSA measured 0.93 ± 0.04 for data selected according to marine contribution. At the LMT site, the relative ratio coarse/fine approached a maximum value of 15.6% in the central part of day. This behaviour put in evidence how the relative ratio was influenced by the breeze regime: in the central hour of the day, the coarse fraction increases constantly. At the end of the day when the land breeze starts, the fine fraction increases and the relative ratio showed minimum values (2.5%). A similar behaviour was found at CGR where the mean relative ratio was 7.2 ± 3.5%.

4.3. Anthropic Contribution

Selecting data according to a wind direction from the land side (sector from 330°–110° at CGR and from 330 to 210° at LMT), anthropic/urban aerosol was analysed. At the ECO station, all data coming from the wind sector in N–NW and S–SE was considered. For anthropic contribution no wind velocity selection was operated. For the LMT site, the effects of regional sources on the aerosol optical and chemical properties were highlighted with easterly winds, characterized by land breeze system. In particular, when wind blows from sectors between 30° and 90° the main contribution was due to anthropic pollutants from urban city emissions. While wind directions in the sectors between 120°–180° were associated with pollutant emissions from agriculture activities. Asymmetry parameter mean values were 0.52 ± 0.05, while SAE was 1.62 ± 0.49. SSA coefficient ranged from 0.67 to 0.96, as shown in Figure 8d, according for example to what was reported by Reference [73] for an urban site in Southern Spain. Relative ratio coarse to fine decreased until 1.13% with an increase of the fine fraction at the central hours of the day. At the CGR station, SAE was 1.06 ± 0.33, while g ranged from 0.48 to 0.64. SSA was greater than 0.62 for whole measurement period with an average value of 0.90 ± 0.04 (Figure 8b).
In early morning, an increase of the fine fraction was evident with a relative ratio decreasing until 0.54%. These values are typical of a principal contribution by anthropic polluted air masses due to long-range transport from continental region and/or short-range transport from local urban areas. At the ECO observatory, the most polluted air transport was associated with N–NW and S–SE wind directions, and the highest values of SAE (up to 2.25) were due to the prevailing contribution of the fine mode particles. In addition, SSA reached the lowest value down to 0.50, and this supports the last comment. An asymmetry parameter from 0.61 to 0.72 for continental air masses coming from Europe is reported in [71]. Relative ratio coarse to fine mode put in evidence the different situation in respect to the other stations, with the lowest values of the ratio (2.84 ± 3.11%).

5. Conclusions

In this work, observations of several properties of atmospheric aerosols at three observatories in Southern Italy are presented. In particular, the scattering and backscattering coefficients, SAE, SSA, and asymmetry parameters were measured during an intensive campaign in the month of April 2016. The SAE mean value for the period was (1.28 ± 0.51) at the ECO station and 1.49 ± 0.54 at LMT. At CGR, the SAE was lower than the other two stations, with a value of 0.92 ± 0.38, indicating clearly that ECO and LMT sites are more influenced by anthropic emissions. The lowest mean SSA value (0.77 ± 0.09) was found at the ECO observatory, and it can be related to the increased contribution of absorbing particles from local anthropogenic activities. In the measurement period, one event of long-range transport of Saharan dust from Northern Africa was observed at all observatories. The duration of this event can be estimated to be about three days long (12th–14th April). During the Saharan dust transport event, a minimum value of SAE was observed at the CGR site (0.69 ± 0.34) with a predominance of coarse particles. Relatively higher values of the SSA and asymmetric parameter were measured at the same time. In particular, the SSA measured up to 0.92 ± 0.04 at the CGR. The asymmetric parameter during the dust event increased reaching values up to 0.69 at the ECO observatory. Selecting data according to wind direction from sea side and great wind velocity, marine aerosol contribution was analysed at CGR and LMT. Maximum asymmetry parameter (0.64) was reached at LMT station in correspondence of the well-developed sea breeze in the central hour of the day. At the same time, ever at the LMT station, the greater value for SAE was measured (0.99 ± 0.49), whereas the SSA mean value was very similar at two sites (between 0.90 and 0.93). Selecting data according to a wind direction from the land side, anthropic/urban aerosol was analysed. At the ECO observatory, the highest values of SAE (up to 2.25) were observed, due to the prevailing contribution of the fine mode particles. In addition, SSA reached the lowest value down to 0.50 and this supports the last comment.
In order to obtain a characteristic value for aerosol optical properties studied in this work, different kinds of particles (i.e., dust, marine, and anthropic) have been identified and studied in an aggregate way for the three observatories, collecting together relative data. From this analysis, SAE average values were 0.70, 0.84, and 1.22, increasing from dust particles to marine and anthropic aerosol (Figure 9a). While the SSA minimum value was 0.86 for anthropic particles, it increased for dust (0.88) and marine (0.93) aerosol (Figure 9b). The asymmetry parameter had a limited variability for three types of aerosol from 0.62 to 0.58, with a standard deviation of 0.05, as shown in Figure 9c.

Author Contributions

Conceptualization, A.D. (Antonio Donateo) and T.L.F.; Data curation, A.D. (Antonio Donateo), T.L.F., A.M., A.D. (Adelaide Dinoi) and E.M.; Formal analysis, A.D. (Antonio Donateo), T.L.F. and A.M.; Funding acquisition, C.R.C., D.C. and P.B.; Methodology, A.D. (Antonio Donateo) and T.L.F.; Supervision, A.D. (Antonio Donateo); Visualization, A.D. (Antonio Donateo); Writing—original draft, A.D. (Antonio Donateo), T.L.F. and E.A.; Writing—review & editing, A.D. (Antonio Donateo), T.L.F., E.A., E.M. and D.C.

Funding

This research was funded by I-AMICA Project (Italian National Operation Program “Ricerca e Competitività” (Research and Competitiveness) 2007–2013 (PON “R&C”). The work was further supported by the Consiglio Nazionale delle Ricerche—CNR (Italy) under AirSEaLab: Progetto Laboratori Congiunti.

Acknowledgments

Authors gratefully acknowledge the NOAA Air Resources Laboratory (ARL) for the provision of the HYSPLIT transport and dispersion model and/or READY website (http://www.ready.noaa.gov) used in the present study. Authors wish to thank Ivano Ammoscato and Fabio M. Grasso for their precious technical contribution in this work.

Conflicts of Interest

The authors declare no conflict of interest. The funders had no role in the design of the study; in the collection, analyses, or interpretation of data; in the writing of the manuscript, and in the decision to publish the results.

References

  1. Wurzler, S.; Reisin, T.G.; Levin, Z. Modification of mineral dust particles by cloud processing and subsequent effects on drop size distributions. J. Geophys. Res. 2000, 105, 4501–4512. [Google Scholar] [CrossRef] [Green Version]
  2. Rosenfeld, D.; Rudich, Y.; Lahav, R. Desert dust suppressing precipitation: A possible desertification feedback loop. Proc. Natl. Acad. Sci. USA 2001, 98, 5975–5980. [Google Scholar] [CrossRef] [PubMed] [Green Version]
  3. Yin, Y.; Wurzler, S.; Levin, Z.; Reisin, T. Interactions of mineral dust particles and clouds: Effects on precipitation and cloud optical properties. J. Geophys. Res. 2002, 107, 4724. [Google Scholar] [CrossRef]
  4. Myhre, G.; Myhre, C.E.L.; Samset, B.H.; Storelvmo, T. Aerosols and their Relation to Global Climate and Climate Sensitivity. Nat. Educ. Knowl. 2013, 4, 7. [Google Scholar]
  5. The Intergovernmental Panel on Climate Change (IPCC). Climate Change 2013: The Physical Science Basis. Contribution of Working Group I to the Fifth Assessment Report of the Intergovernmental Panel on Climate Change; Stocker, T.F., Qin, D., Plattner, G.-K., Tignor, M., Allen, S.K., Boschung, J., Nauels, A., Xia, Y., Bex, V., Midgley, P.M., Eds.; Cambridge University Press: Cambridge, UK, 2013; ISBN 78-1-107-05799-1. [Google Scholar]
  6. Lee, L.A.; Reddington, C.L.; Carslaw, K.S. On the relationship between aerosol model uncertainty and radiative forcing uncertainty. Proc. Natl. Acad. Sci. USA 2016, 113, 5820–5827. [Google Scholar] [CrossRef] [PubMed] [Green Version]
  7. Seinfeld, J.H.; Bretherton, C.; Carslaw, K.S.; Coe, H.; DeMott, P.J.; Dunlea, E.J.; Feingold, G.; Ghan, S.; Guenther, A.B.; Kahn, R.; et al. Improving our fundamental understanding of the role of aerosol−cloud interactions in the climate system. Proc. Natl. Acad. Sci. USA 2016, 113, 5781–5790. [Google Scholar] [CrossRef] [PubMed] [Green Version]
  8. Russell, P.; Bergstrom, R.; Shinozuka, Y.; Clarke, A.; Decarlo, P.; Jimenez, J.; Livingston, J.; Redemann, J.; Dubovik, O.; Strawa, A. Absorption Angstrom Exponent in AERONET and related data as an indicator of aerosol composition. Atmos. Chem. Phys. 2010, 10, 1155–1169. [Google Scholar] [CrossRef] [Green Version]
  9. Moosmüller, H.; Chakrabarty, R.K. Technical Note: Simple analytical relationships between Ångström coefficients of aerosol extinction, scattering, absorption, and single scattering albedo. Atmos. Chem. Phys. 2011, 11, 10677–10680. [Google Scholar] [CrossRef] [Green Version]
  10. Devi, J.J.; Bergin, M.; McKenzie, M.; Schauer, J.J.; Weber, R. Contribution of particulate brown carbon to light absorption in the rural and urban Southeast US. Atmos. Environ. 2016, 136, 95–104. [Google Scholar] [CrossRef] [Green Version]
  11. Bernardoni, V.; Pileci, R.E.; Caponi, L.; Massabò, D. The Multi-Wavelength Absorption Analyzer (MWAA) Model as a Tool for Source and Component Apportionment Based on Aerosol Absorption Properties: Application to Samples Collected in Different Environments. Atmosphere 2017, 8, 218. [Google Scholar] [CrossRef]
  12. Koçak, M.; Mihalopoulos, N.; Kubilay, N. Origin and source regions of PM10 in the eastern Mediterranean atmosphere. Atmos. Res. 2009, 92, 464–474. [Google Scholar] [CrossRef]
  13. Querol, X.; Alastuey, A.; Pey, J.; Cusack, M.; Pérez, N.; Mihalopoulos, N.; Theodosi, C.; Gerasopoulos, E.; Kubilay, N.; Koçak, M. Variability in regional background aerosols within the Mediterranean. Atmos. Chem. Phys. 2009, 9, 4575–4591. [Google Scholar] [CrossRef]
  14. Querol, X.; Pey, J.; Pandolfi, M.; Alastuey, A.; Cusack, M.; Pérez, N.; Moreno, T.; Viana, M.; Mihalopoulos, N.; Kallos, G.; et al. African dust contributions to mean ambient PM10 mass-levels across the Mediterranean basin. Atmos. Environ. 2009, 43, 4266–4277. [Google Scholar] [CrossRef]
  15. Sciare, J.; Bardouki, H.; Moulin, C.; Mihalopoulos, N. Aerosol sources and their contribution to the chemical composition of aerosols in the eastern Mediterranean Sea during summertime. Atmos. Chem. Phys. 2003, 3, 291–302. [Google Scholar] [CrossRef]
  16. Lelieveld, J.; Berresheim, H.; Borrmann, S.; Crutzen, P.J.; Dentener, F.J.; Fischer, H.; Feichter, J.; Flatau, P.J.; Heland, J.; Holzinger, R.; et al. Global air pollution crossroads over the Mediterranean. Science 2002, 298, 794–799. [Google Scholar] [CrossRef] [PubMed]
  17. Giorgi, F. Climate change hot-spots. Geophys. Res. Lett. 2006, 33, L08707. [Google Scholar] [CrossRef]
  18. Becagli, S.; Anello, F.; Bommarito, C.; Cassola, F.; Calzolai, G.; Di Iorio, T.; di Sarra, A.; Gómez-Amo, J.L.; Lucarelli, F.; Marconi, M.; et al. Constraining the ship contribution to the aerosol of the central Mediterranean. Atmos. Chem. Phys. 2017, 17, 2067–2084. [Google Scholar] [CrossRef] [Green Version]
  19. Barnaba, F.; Gobbi, G.P. Aerosol seasonal variability over the Mediterranean region and relative impact of maritime, continental and Saharan dust particles over the basin from MODIS data in the year 2001. Atmos. Chem. Phys. 2004, 4, 2367–2391. [Google Scholar] [CrossRef] [Green Version]
  20. Merico, E.; Donateo, A.; Gambaro, A.; Cesari, D.; Gregoris, E.; Barbaro, E.; Dinoi, A.; Giovanelli, G.; Masieri, S.; Contini, D. Influence of in-port ships emissions to gaseous atmospheric pollutants and to particulate matter of different sizes in a Mediterranean harbour in Italy. Atmos. Environ. 2016, 139, 1–10. [Google Scholar] [CrossRef]
  21. Donateo, A.; Gregoris, E.; Gambaro, A.; Merico, E.; Giua, R.; Nocioni, A.; Contini, D. Contribution of harbour activities and ship traffic to PM2.5, particle number concentrations and PAHs in a port city of the Mediterranean Sea (Italy). Environ. Sci. Pollut. Res. 2014, 21, 9415–9429. [Google Scholar] [CrossRef] [PubMed]
  22. Bove, M.C.; Brotto, P.; Calzolai, G.; Cassola, F.; Cavalli, F.; Fermo, P.; Hjorth, J.; Massabò, D.; Nava, S.; Piazzalunga, A.; et al. PM10 source apportionment applying PMF and chemical tracer analysis to ship-borne measurements in the Western Mediterranean. Atmos. Environ. 2016, 125 Pt A, 140–151. [Google Scholar] [CrossRef]
  23. Pérez, N.; Pey, J.; Reche, C.; Cortés, J.; Alastuey, A.; Querol, X. Impact of harbour emissions on ambient PM10 and PM2.5 in Barcelona (Spain): Evidences of secondary aerosol formation within the urban area. Sci. Total Environ. 2016, 571, 237–250. [Google Scholar] [CrossRef] [PubMed]
  24. Sellitto, P.; di Sarra, A.; Corradini, S.; Boichu, M.; Herbin, H.; Dubuisson, P.; Sèze, G.; Meloni, D.; Monteleone, F.; Merucci, L.; et al. Synergistic use of Lagrangian dispersion and radiative transfer modelling with satellite and surface remote sensing measurements for the investigation of volcanic plumes: The Mount Etna eruption of 25–27 October 2013. Atmos. Chem. Phys. 2016, 16, 6841–6861. [Google Scholar] [CrossRef]
  25. Sellitto, P.; Zanetel, C.; di Sarra, A.; Salerno, G.; Tapparo, A.; Meloni, D.; Pace, G.; Caltabiano, T.; Briole, P.; Legras, B. The impact of Mount Etna sulfur emissions on the atmospheric composition and aerosol properties in the central Mediterranean: A statistical analysis over the period 2000–2013 based on observations and Lagrangian modelling. Atmos. Environ. 2017, 148, 77–88. [Google Scholar] [CrossRef]
  26. Goudie, A.S.; Middleton, N.J. Saharan dust storms: Nature and consequences. Earth Sci. Rev. 2001, 56, 179–204. [Google Scholar] [CrossRef]
  27. Barkan, J.; Alpert, P.; Kutiel, H.; Kishcha, P. Synoptics of dust transportation days from Africa toward Italy and central Europe. J. Geophys. Res. 2005, 110, D07208. [Google Scholar] [CrossRef]
  28. Engelstaedter, S.; Tegen, I.; Washington, R. North African dust emissions and transport. Earth Sci. Rev. 2006, 79, 73–100. [Google Scholar] [CrossRef]
  29. Engelstaedter, S.; Washington, R. Atmospheric controls on the annual cycle of North African dust. J. Geophys. Res. 2007, 112, D03103. [Google Scholar] [CrossRef]
  30. Pérez, L.; Tobias, A.; Querol, X.; Künzli, N.; Pey, J.; Alastuey, A.; Viana, M.; Valero, N.; González-Cabré, M.; Sunyer, J. Coarse particles from Saharan dust and daily mortality. Epidemiology 2008, 19, 800–807. [Google Scholar] [CrossRef] [PubMed]
  31. Sajani, S.Z.; Miglio, R.; Bonasoni, P.; Cristofanelli, P.; Marinoni, A.; Sartini, C.; Goldoni, C.A.; De Girolamo, G.; Lauriola, P. Saharan dust and daily mortality in Emilia-Romagna (Italy). Occup. Environ. Med. 2010, 68, 446–451. [Google Scholar] [CrossRef] [PubMed] [Green Version]
  32. Kallos, G.; Kotroni, V.; Lagouvardos, K.; Papadopoulos, A. On the long-range transport of air pollutants from Europe to Africa. Geophys. Res. Lett. 1998, 25, 619–622. [Google Scholar] [CrossRef]
  33. Gangoiti, G.; Millan, M.M.; Salvador, R.; Mantilla, E. Long-range transport and re-circulation of pollutants in the western Mediterranean during the project Regional Cycles of Air Pollution in the West-Central Mediterranean Area. Atmos. Environ. 2001, 35, 6267–6276. [Google Scholar] [CrossRef]
  34. Ramanathan, V.; Crutzen, P.J.; Lelieveld, J.; Mitra, A.P.; Althausen, D.; Anderson, J.; Andreae, M.O.; Cantrell, W.; Cass, G.R.; Chung, C.E.; et al. Indian Ocean Experiment: An integrated analysis of the climate forcing and effects of the great Indo-Asian haze. J. Geophys. Res. 2001, 106, 28371–28398. [Google Scholar] [CrossRef] [Green Version]
  35. Israelevich, P.; Ganor, E.; Alpert, P.; Kishcha, P.; Stupp, A. Predominant transport paths of Saharan dust over the Mediterranean Sea to Europe. J. Geophys. Res. 2012, 117, D02205. [Google Scholar] [CrossRef]
  36. Cristofanelli, P.; Busetto, M.; Calzolari, F.; Ammoscato, I.; Gullì, D.; Dinoi, A.; Calidonna, C.R.; Contini, D.; Sferlazzo, D.; Di Iorio, T.; et al. Investigation of reactive gases and methane variability in the coastal boundary layer of the central Mediterranean basin. Elem. Sci. Anth. 2017, 5, 12. [Google Scholar] [CrossRef] [Green Version]
  37. Dinoi, A.; Cesari, D.; Marinoni, A.; Bonasoni, P.; Riccio, A.; Chianese, E.; Tirimberio, G.; Naccarato, A.; Sprovieri, F.; Andreoli, V.; et al. Inter-comparison of carbon content in PM2.5 and PM10 collected at five measurement sites in southern Italy. Atmosphere 2017, 8, 243. [Google Scholar] [CrossRef]
  38. Gullì, D.; Avolio, E.; Calidonna, C.R.; Lo Feudo, T.; Torcasio, R.C.; Sempreviva, A.M. Two years of wind-lidar measurements at an Italian Mediterranean Coastal Site. Energy Procedia 2017, 125, 214–220. [Google Scholar] [CrossRef]
  39. Chirizzi, D.; Cesari, D.; Guascito, M.R.; Dinoi, A.; Giotta, L.; Donateo, A.; Contini, D. Influence of Saharan dust outbreaks and carbon content on oxidative potential of water-soluble fractions of PM2.5 and PM10. Atmos. Environ. 2017, 163, 1–8. [Google Scholar] [CrossRef]
  40. Cesari, D.; Merico, E.; Dinoi, A.; Marinoni, A.; Bonasoni, P.; Contini, D. Seasonal variability of carbonaceous aerosols in an urban background area in Southern Italy. Atmos. Res. 2018, 200, 97–108. [Google Scholar] [CrossRef]
  41. Anderson, T.L.; Covert, D.S.; Marshall, S.F.; Laucks, M.L.; Charlson, R.J.; Waggoner, A.P.; Ogren, J.A.; Caldow, R.; Holm, R.L.; Quant, F.R.; et al. Performance characteristics of a high-sensitivity, three-wavelength, total scatter/backscatter nephelometer. J. Atmos. Ocean. Technol. 1996, 13, 967–986. [Google Scholar] [CrossRef]
  42. Petzold, A.; Kramer, H.; Schönlinner, M. Continuous Measurement of Atmospheric Black Carbon Using a Multi-angle Absorption Photometer. Environ. Sci. Pollut. Res. 2002, 4, 78–82. [Google Scholar]
  43. Müller, T.; Laborde, M.; Kassell, G.; Wiedensohler, A. Design and performance of a three-wavelength LED-based total scatter and backscatter integrating nephelometer. Atmos. Meas. Tech. 2011, 4, 1291–1303. [Google Scholar] [CrossRef] [Green Version]
  44. Anderson, T.L.; Ogren, J.A. Determining Aerosol Radiative Properties Using the TSI 3563 Integrating Nephelometer. Aerosol Sci. Technol. 1998, 29, 57–69. [Google Scholar] [CrossRef] [Green Version]
  45. Bond, T.C.; Covert, D.S.; Müller, T. Truncation and Angular- Scattering Corrections for Absorbing Aerosol in the TSI 3563 Nephelometer. Aerosol Sci. Technol. 2009, 43, 866–871. [Google Scholar] [CrossRef]
  46. Costabile, F.; Barnaba, F.; Angelini, F.; Gobbi, G.P. Identification of key aerosol populations through their size and composition resolved spectral scattering and absorption. Atmos. Chem. Phys. 2013, 13, 2455–2470. [Google Scholar] [CrossRef]
  47. Anderson, T.L.; Covert, D.S.; Wheeler, J.D.; Harris, J.M.; Perry, K.D.; Trost, B.E.; Jaffe, D.J.; Ogren, J.A. Aerosol backscatter fraction and single scattering albedo: Measured values and uncertainties at a coastal station in the Pacific Northwest. J. Geophys. Res.-Atmos. 1999, 104, 26793–26807. [Google Scholar] [CrossRef]
  48. Bryant, C.; Eleftheriadis, K.; Smolik, J.; Zdimal, V.; Mihalopoulos, N.; Colbeck, I. Optical properties of aerosols over the eastern Mediterranean. Atmos. Environ. 2006, 40, 6229–6244. [Google Scholar] [CrossRef]
  49. Dubovik, O.; Holben, B.; Eck, T.F.; Smirnov, A.; Kaufman, Y.J.; King, M.D.; Tanré, D.; Slutsker, I. Variability of absorption and optical properties of key aerosol types observed in worldwide locations. J. Atmos. Sci. 2002, 59, 590–608. [Google Scholar] [CrossRef]
  50. Delene, D.J.; Ogren, J.A. Variability of aerosol optical properties at four North American surface monitoring sites. J. Atmos. Sci. 2002, 59, 1135–1150. [Google Scholar] [CrossRef]
  51. Schuster, G.L.; Dubovik, O.; Holben, B.N. Angstrom exponent and bimodal aerosol size distributions. J. Geophys. Res. 2006, 111, D07207. [Google Scholar] [CrossRef]
  52. Virkkula, A.; Backman, J.; Aalto, P.P.; Hulkkonen, M.; Riuttanen, L.; Nieminen, T.; dal Maso, M.; Sogacheva, L.; de Leeuw, G.; Kulmala, M. Seasonal cycle, size dependencies, and source analyses of aerosol optical properties at the SMEAR II measurement station in Hyytiälä, Finland. Atmos. Chem. Phys. 2011, 11, 4445–4468. [Google Scholar] [CrossRef] [Green Version]
  53. Dubovik, O.; King, M.D. A flexible inversion algorithm for retrieval of aerosol optical properties from Sun and sky radiance measurements. J. Geophys. Res. Atmos. 2000, 105, 20673–20696. [Google Scholar] [CrossRef] [Green Version]
  54. Ramachandran, S.; Srivastava, R.; Kedia, S.; Rajesh, T.A. Contribution of natural and anthropogenic aerosols to optical properties and radiative effects over an urban location. Environ. Res. Lett. 2012, 7, 034028. [Google Scholar] [CrossRef] [Green Version]
  55. Mallet, M.; Roger, J.C.; Despiau, S.; Dubovik, O.; Putaud, J.P. Microphysical and optical properties of aerosol particles in urban zone during ESCOMPTE. Atmos. Res. 2003, 69, 73–97. [Google Scholar] [CrossRef]
  56. Andrews, E.; Sheridan, P.J.; Fiebig, M.; McComiskey, A.; Ogren, J.A.; Arnott, P.; Covert, D.; Elleman, R.; Gasparini, R.; Collins, D.; et al. Comparison of methods for deriving aerosol asymmetry parameter. J. Geophys. Res. 2006, 111, D05S04. [Google Scholar] [CrossRef]
  57. Kneizys, F.X.; Shettle, E.P.; Abreu, L.W.; Anderson, G.P.; Chetwynd, J.H.; Gallery, W.O.; Selby, E.A.; Clough, S.A. LOWTRAN7: Status, review and impact for short-to long wavelength infrared applications. In AGARD, Atmospheric Propagation in the UV, Visible, IR, and MM-Wave Region and Related Systems Aspects 11 p (SEE N90-21907 15-32); AGARD, NATO: Neuilly-sur-Seine, France, 1990. [Google Scholar]
  58. Draxler, R.R.; Rolph, G.D. HYSPLIT (HYbrid Single-Particle Lagrangian Integrated Trajectory) Model; NOAA Air Resources Laboratory: College Park, MD, USA, 2013. Available online: http://www.arl.noaa.gov/HYSPLIT.php (accessed on 20 July 2018).
  59. Rolph, G.D. Real-Time Environmental Applications and Display System (READY); NOAA Air Resources Laboratory: College Park, MD, USA, 2013. Available online: http://www.ready.noaa.gov (accessed on 20 July 2018).
  60. Conte, M.; Donateo, A.; Dinoi, A.; Belosi, F.; Contini, D. Case study of particle number fluxes and size distributions during nucleation events in southeastern Italy in the summer. Atmosphere 2015, 6, 942–959. [Google Scholar] [CrossRef]
  61. Pereira, S.N.; Wagner, F.; Silva, A.M. Seven year of measurements of aerosol scattering properties, near the surface, in the southwestern Iberia Peninsula. Atmos. Chem. Phys. 2011, 11, 17–29. [Google Scholar] [CrossRef]
  62. Perrone, M.R.; Romano, S.; Orza, J.A.G. Particle optical properties at a Central Mediterranean site: Impact of advection routes and local meteorology. Atmos. Res. 2014, 145–146, 152–167. [Google Scholar] [CrossRef]
  63. Cesari, D.; De Benedetto, G.E.; Bonasoni, P.; Busetto, M.; Dinoi, A.; Merico, E.; Chirizzi, D.; Cristofanelli, P.; Donateo, A.; Grasso, F.M.; et al. Seasonal variability of PM2.5 and PM10 composition and sources in an urban background site in Southern Italy. Sci. Total Environ. 2018, 612, 202–213. [Google Scholar] [CrossRef] [PubMed]
  64. Moulin, C.; Lambert, C.E.; Dayan, U.; Masson, V.; Ramonet, M.; Bousquet, P.; Legrand, M.; Balkanski, Y.J.; Guelle, W.; Marticorena, B.; et al. Satellite climatology of African dust transport in the Mediterranean atmosphere. J. Geophys. Res. 1998, 103, 13137–13144. [Google Scholar] [CrossRef] [Green Version]
  65. Kubilay, N.; Nickovic, S.; Moulin, C.; Dulac, F. An illustration of the transport and deposition of mineral dust onto the eastern Mediterranean. Atmos. Environ. 2000, 34, 1293–1303. [Google Scholar] [CrossRef]
  66. Israelevich, P.L.; Levin, Z.; Joseph, J.H.; Ganor, E. Desert aerosol transport in the Mediterranean region as inferred from the TOMS aerosol index. J. Geophys. Res. 2002, 107, 4572. [Google Scholar] [CrossRef]
  67. Pinker, R.T.; Pandithurai, G.; Holben, B.N.; Dubovik, O.; Aro, T.O. A dust outbreak episode in sub-Sahel West Africa. J. Geophs. Res. 2001, 106, 22923–22930. [Google Scholar] [CrossRef] [Green Version]
  68. Smirnov, A.; Holben, B.N.; Kaufman, Y.J.; Dubovik, O.; Eck, T.F.; Slutsker, I.; Pietras, C.; Halthore, R. Optical properties of atmospheric aerosol in maritime environments. J. Atmos. Sci. 2002, 59, 501–523. [Google Scholar] [CrossRef]
  69. Cao, C.; Zheng, S.; Singh, R.P. Characteristics of aerosol optical properties and meteorological parameters during three major dust events (2005–2010) over Beijing, China. Atmos. Res. 2014, 150, 129–142. [Google Scholar] [CrossRef]
  70. d’Almeida, G.A.; Koepke, P.; Shettle, E.P. Atmospheric Aerosols: Global Climatology and Radiative Characteristics; A Deepak Pub: Hampton, VA, USA, 1991. [Google Scholar]
  71. Di Iorio, T.; Sarra, A.D.; Junkermann, W.; Cacciani, M.; Fiocco, G.; Fuà, D. Tropospheric aerosols in the Mediterranean: 1. Microphysical and optical properties. J. Geophys. Res. 2003, 108, 4316. [Google Scholar] [CrossRef]
  72. Lazaridis, M.; Eleftheriadis, K.; Smolik, J.; Colbeck, I.; Kallos, G.; Drossinos, Y.; Zdimal, V.; Vecera, Z.; Mihalopoulos, N.; Mikuska, P.; et al. Dynamics of fine particles and photooxidants in the eastern Mediterranean (SUB-AERO). Atmos. Environ. 2006, 40, 6214–6228. [Google Scholar] [CrossRef]
  73. Titos, G.; Foyo-Moreno, I.; Lyamani, H.; Querol, X.; Alastuey, A.; Alados-Arboledas, L. Optical properties and chemical composition of aerosol particles at an urban location: An estimation of the aerosol mass scattering and absorption efficiencies. J. Geophys. Res. 2012, 117, D04206. [Google Scholar] [CrossRef]
Figure 1. Geographical location of the three GAW regional observatories in Southern Italy (red points). Wind rose for the measurement period at CGR, LMT, and ECO observatories are shown.
Atmosphere 09 00369 g001
Figure 2. PM10, PM2.5 concentrations at (a) CGR, (b) LMT and (c) ECO observatory, respectively.
Atmosphere 09 00369 g002
Figure 3. Aerosol size distribution for the (a) CGR, (c) LMT, and (e) ECO stations, respectively (left panels). Diurnal variation (right panels) for fine and coarse particles during the measurement period for (b) CGR, (d) LMT, and (f) ECO stations in local time (UTC + 1). Error bars represent standard error (standard deviation of the mean).
Atmosphere 09 00369 g003
Figure 4. Time series (local time: UTC+1) of hourly average values of SAE, SSA, and asymmetry parameter at three observatories. (a) CGR, (c) LMT, and (e) ECO, respectively. Diurnal variation (local time: UTC+1) for SAE, SSA, and g during the whole measurement campaign at (b) CGR, (d) LMT, and (f) ECO. Error bars represent the standard error (standard deviation of the mean).
Atmosphere 09 00369 g004
Figure 5. HYSPLIT model results of the Sahara dust event for (a) CGR, (b) LMT, and (c) ECO stations, respectively. Aerosol dust load map on the Mediterranean area for (d) 12th, (e) 13th and (f) 14th April.
Atmosphere 09 00369 g005
Figure 6. Time evolution of fine and coarse mode (aerosol size distribution) for the period 12th–14th April for (a) CGR, (c) LMT, and (e) ECO observatories, respectively, during the Saharan dust event. Time evolution of SAE, SSA, and g for the dust event at (b) CGR, (d) LMT and (f) ECO observatories, respectively.
Atmosphere 09 00369 g006
Figure 7. A time example for SAE, SSA, and g for a marine episode at (a) CGR, (c) LMT observatories (left side), respectively. Box and whiskers plots for SAE, SSA, and g for marine contribution selection at (b) CGR and (d) LMT. Horizontal black lines are the median value. Boxes represent the 25th and 75th percentile. Whiskers are min and max values. In green (diamond) are the average values for the three measured parameters.
Atmosphere 09 00369 g007
Figure 8. A time example for SAE, SSA, and g for an anthropic episodes at (a) CGR, (c) LMT, and (e) ECO observatory, respectively. Box and whiskers plots for SAE, SSA, and g for anthropic contribution selection at (b) CGR, (d) LMT and (f) ECO observatory, respectively. Horizontal black lines are the median value. Boxes represent the 25th and 75th percentiles. Whiskers are min and max values. In green (diamond) are the average values for the three measured parameters.
Atmosphere 09 00369 g008
Figure 9. Box and whiskers plots for (a) SAE, (b) SSA, and (c) asymmetry parameter for the three aerosol types studied in this work in an aggregated way. Horizontal black lines are the median value. Boxes represent the 25th and 75th percentile. Whiskers are min and max values. In green (diamond) are the average values for the three measured parameters.
Atmosphere 09 00369 g009
Table 1. Statistical properties (from 5 min average) of the measured and calculated optical properties over the whole period analysed for the CGR observatory.
Parameterλ (nm)MeanSt. Dev.MedianMinMaxPercentiles
1090
CGRσsc (Mm−1)
45036.3514.9235.237.47100.6018.3955.11
55029.9112.3928.855.6782.4714.7145.51
70024.4010.6122.683.9868.7012.0237.88
σbsc (Mm−1)
4504.481.714.421.0414.222.436.67
5503.851.503.810.9211.122.075.76
7003.381.353.300.6610.201.775.07
SAE
450–7000.920.380.930.152.030.391.42
550–7000.860.380.830.162.050.391.39
450–5500.980.401.040.102.010.381.48
b
4500.130.010.120.100.180.110.14
5500.130.010.130.100.200.110.15
7000.140.020.140.100.220.120.16
g
4500.600.030.600.470.660.560.63
5500.580.030.580.440.670.540.62
7000.560.040.560.410.660.510.61
SSA6370.920.050.930.541.000.870.97
Table 2. Statistical properties (from 5 min average) of the measured and calculated optical properties over the whole period analysed for the LMT observatory.
Parameterλ (nm)MeanSt. Dev.MedianMinMaxPercentiles
1090
LMTσsc (Mm−1)
45050.0124.7048.7213.05288.1318.9976.50
55037.5720.5035.439.04218.5814.1055.76
70027.1116.9423.975.62148.5710.4142.82
σbsc (Mm−1)
4505.442.415.121.8828.802.718.14
5504.472.004.121.7423.262.206.82
7003.751.723.570.4817.621.875.52
SAE
450–7001.490.541.540.192.780.632.10
550–7001.470.591.490.162.670.622.16
450–5501.510.501.640.012.920.702.01
b
4500.110.020.110.080.270.090.14
5500.130.030.120.080.240.100.16
7000.150.030.150.040.340.110.19
g
4500.630.050.640.330.730.560.68
5500.590.060.600.370.710.510.66
7000.540.070.550.230.830.450.62
SSA6370.880.070.890.220.990.820.96
Table 3. Statistical properties (from 5 min average) of the measured and calculated optical properties over the whole period analysed for the ECO observatory.
Parameterλ (nm)MeanSt. Dev.MedianMinMaxPercentiles
1090
ECOσsc (Mm−1)
45024.1415.6120.513.33265.5110.6940.83
55018.0011.0915.492.52177.318.1530.64
70013.728.1812.181.85106.935.9923.28
σbsc (Mm−1)
4502.371.552.030.2926.841.034.13
5501.841.161.590.1619.580.793.10
7001.510.881.370.2213.670.642.52
SAE
450–7001.280.511.290.182.410.581.99
550–7001.140.581.070.022.560.411.96
450–5501.450.481.490.042.850.752.05
b
4500.100.010.100.030.200.080.12
5500.100.010.100.070.160.090.12
7000.110.020.110.060.250.090.14
g
4500.660.040.660.440.870.620.71
5500.650.030.650.510.760.610.70
7000.630.060.630.350.780.560.70
SSA6370.770.090.780.430.950.660.88

