Communication

A New Type of Haze? The December 2015 Purple (Magenta) Haze Event in Nanjing, China

1
Key Laboratory of Transportation Meteorology, China Meteorological Administration, Nanjing 210008, China
2
Jiangsu Meteorological Observatory, Nanjing 210008, China
3
College of Resources and Environmental Sciences, China Agricultural University, Beijing 100193, China
4
Department of Atmospheric Science, Colorado State University, Fort Collins, CO 80523, USA
5
Key Laboratory for Aerosol-Cloud-Precipitation of China Meteorological Administration, Nanjing University of Information Science and Technology, Nanjing 210044, China
*
Author to whom correspondence should be addressed.
Atmosphere 2017, 8(4), 76; https://doi.org/10.3390/atmos8040076
Submission received: 25 December 2016 / Revised: 6 April 2017 / Accepted: 6 April 2017 / Published: 14 April 2017
(This article belongs to the Special Issue Urban Air Pollution)

Abstract

:
A special and unusual purple (magenta) haze episode was observed in Nanjing, China, at 17:00 on 22 December 2015. Many local and national news outlets reported this event. Based on an analysis of the pollution features and meteorological factors, including boundary layer characteristics, we concluded that this haze event was similar in most respects to other local haze episodes. We discuss the reasons and the possibilities about this rare color haze at the end of the paper. One way to attain a combination of blue and red light is to have the green wavelengths selectively absorbed, and this seems unlikely for typical atmospheric constituents. Another way involves pollution gases or particles together with small liquid-water drops, which need further confirmation. A third possibility is that the combination of transmitted red light from the sun and scattered blue light from above could produce a purple/magenta color in the sky. In general, further studies are required to assess the physical, chemical, and optical features of this purple haze in order to explain and predict this phenomenon in the future.

1. Introduction

In many polluted areas, a layer of haze is formed; usually, the haze has white, red, reddish, yellow, brownish, or brown colors, and different researchers [1,2,3,4,5,6] have discussed the formation mechanism of these haze colors. Smog particles are well known for creating red skies and brilliant horizons [4,5]. In heavily polluted air, aerosol particles scatter the sun’s blue, green, and red light, providing a source of white light to a viewer from all points along the horizon [4,5]. By analyzing the solar radiation, Delusis et al. (1977) suggested that the absorption rate of the polluted air is about four times that for natural aerosols, and some gases such as NO2, O3, and H2O might increase the absorption [7].
Early research has suggested that reddish and brown colors in smog could be due to many factors. One is the preferential absorption of blue and green light by NO2, which allows most of green and red light to be transmitted, giving smog with NO2 a yellow, brown, or reddish-green color [4,5,8,9]. However, some studies conclude that light absorption by NO2 is only a minor contributor to the reduction of the visual range [10] and that particle absorption (29%) makes a greater contribution than does NO2 absorption (7%) [11], which may be due to the minor NO2 content. Waggoner et al. (1983) found aerosol extinction, compared to extinction due to NO2, more variable over the period of measurement [12]. A second possible causal factor is the preferential absorption of blue light by nitroaromatics and polycyclic aromatic hydrocarbons (PAHs) in aerosol particles; such absorption can also contribute a reddish or brownish appearance to the atmosphere [4,5]. A third possibility is that, when soil dust concentrations are high, air can appear reddish or brown because soil particles preferentially absorb blue and green light over red light. In the absence of a dust storm and away from desert regions, however, the concentration of soil-dust particles is generally low, and the effect of soil dust on atmospheric optics is limited. A thin layer of predominantly monodisperse droplets has also been observed to cause brown haze at some distance above ground by selective light scattering [11,13].
For particles smaller than the wavelengths of visible light, a preferential scattering of shorter, blue wavelengths can lend a blue appearance to haze [14,15]. Blue haze has been studied over forested areas [16], where small particles formed by interactions between biogenic organic acids and sulfuric acid scatter light. Blue skies have also been investigated in a volcanic eruption area [4,5]; after a strong volcanic eruption, volcanic emission of sulfur dioxide into the stratosphere can lead to formation of small sulfuric acid particles, many of which reach the stratosphere. Such particles scatter light through the stratospheric ozone layer, and ozone weakly absorbs green and some red wavelengths, transmitting blue and some red, which combine to form purple [4,5].
A purple (magenta) haze episode was observed in Nanjing, China, on 22 December 2015. Many news outlets reported this event [17]. Based on Newton’s primary colors (see Figure 1), we can see that, if green light is removed, the resulting color is magenta or purple. One way to attain a combination of blue and red light is to have the green wavelengths selectively absorbed. This seems unlikely for typical atmospheric constituents. The formation of purple haze is difficult to be explained by the phenomena described above. The aim of this short communication is to describe the purple haze event in Nanjing, China, examine the pollution characteristics and meteorological conditions, and discuss the possible mechanisms for this rare color haze. The formation mechanisms need further observation and analysis.

2. Observation and Analysis

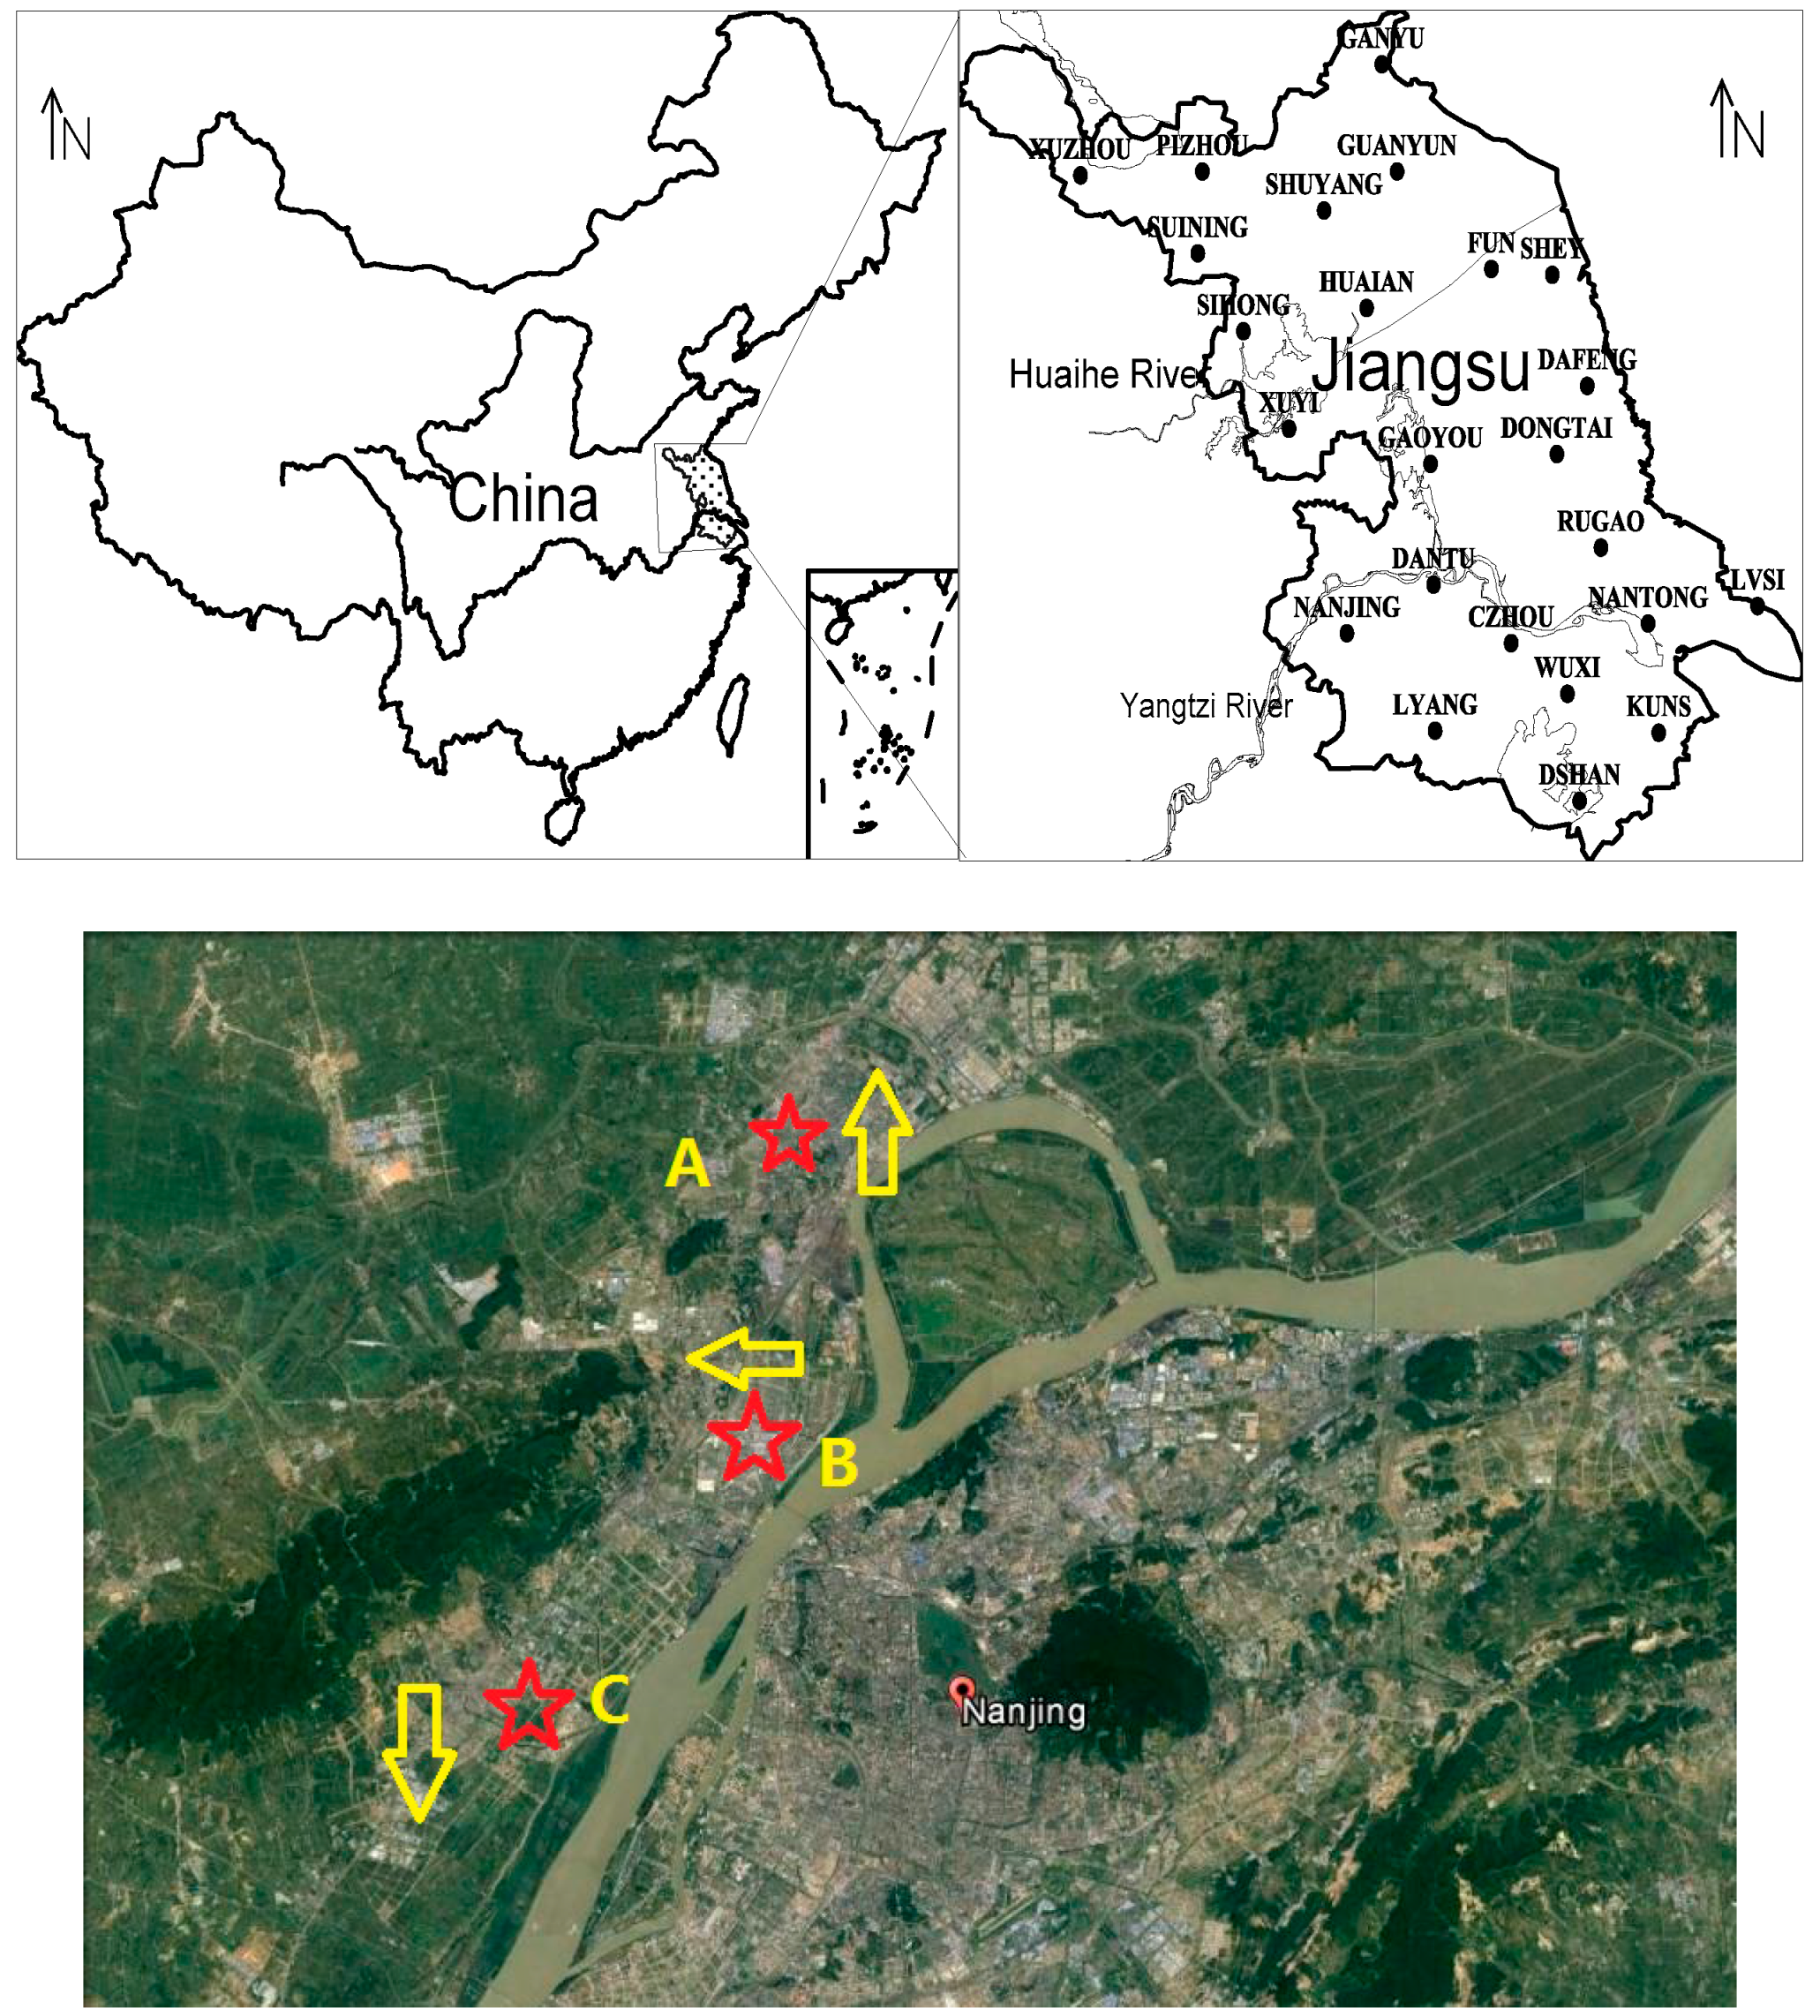
2.1. Observation Sites and Data

The haze was observed on 22 December 2015 at different locations in Nanjing (Figure 2). During this period, the visibility was about 1–2 km, and the relative humidity (RH) was lower than 85%, according to the China Meteorological Administration observation standard, this was a heavy haze. This weather phenomenon was observed by different citizens during the same time at different positions in Nanjing from 16:00 to 17:30 (the sunset time was 17:05). The duration was about 1.5–2.0 h. It was also recorded by a meteorological observatory. In order to show this phenomenon more clearly, we chose pictures from citizens from different positions. According to the meteorological observatory record, this kind of weather phenomenon had not been observed in the previous 50 years. The rarity justifies our discussion.
Figure 2 shows three points where different citizens watched this phenomenon, took pictures, and uploaded them to the web immediately. All pictures were taken in the northern suburbs of Nanjing at 17:00 local time. The photographs were taken in different directions: the observer at Point A took pictures facing north at Liuhe (Figure 3A); most of the sky was purple or magenta, and this phenomenon lasted more than 2 h. The observer at Point B took photos facing west at Pukou (Figure 3B); most of the sky was purple or magenta, and the phenomenon lasted more than 2 h. The observer at Point C took photographs facing south at Jiangpu (Figure 3C); the sky was purple gray, and the phenomenon persisted for more than 1 h.
The meteorological conditions from Liuhe, Pukou, and Jiangning are examined here, including wind speed, wind direction, air temperature 2 m above ground, surface air temperature, dew point temperature, RH (relative humidity), visibility, and total and low cloud cover.
The concentrations of six major pollutants, including PM2.5, PM10, SO2, NO2, O3, and CO at nine official monitoring sites (Olympic center, Caochangmen, Maigaoqiao, Pukou, Ruijin road, Shanxi road, Xianlin, Xuanwu Lake, and Zhonghuamen) are also summarized.
The concentrations of PM2.5 at 13 different cities are also examined here.

2.2. Trajectory Analysis

The NOAA HYSPLIT4.8 (Hybrid Single Particle Lagrangian Integrated Trajectory) model is used to calculate backward trajectories for Pukou at 17:00 22 December 2015 local time, using the United States National Center for Environmental Prediction (NCEP) reanalysis of meteorological data [18,19]. Seventy-two hour backward trajectories were calculated at four heights: 50 m, 150 m, 300 m, and 500 m.

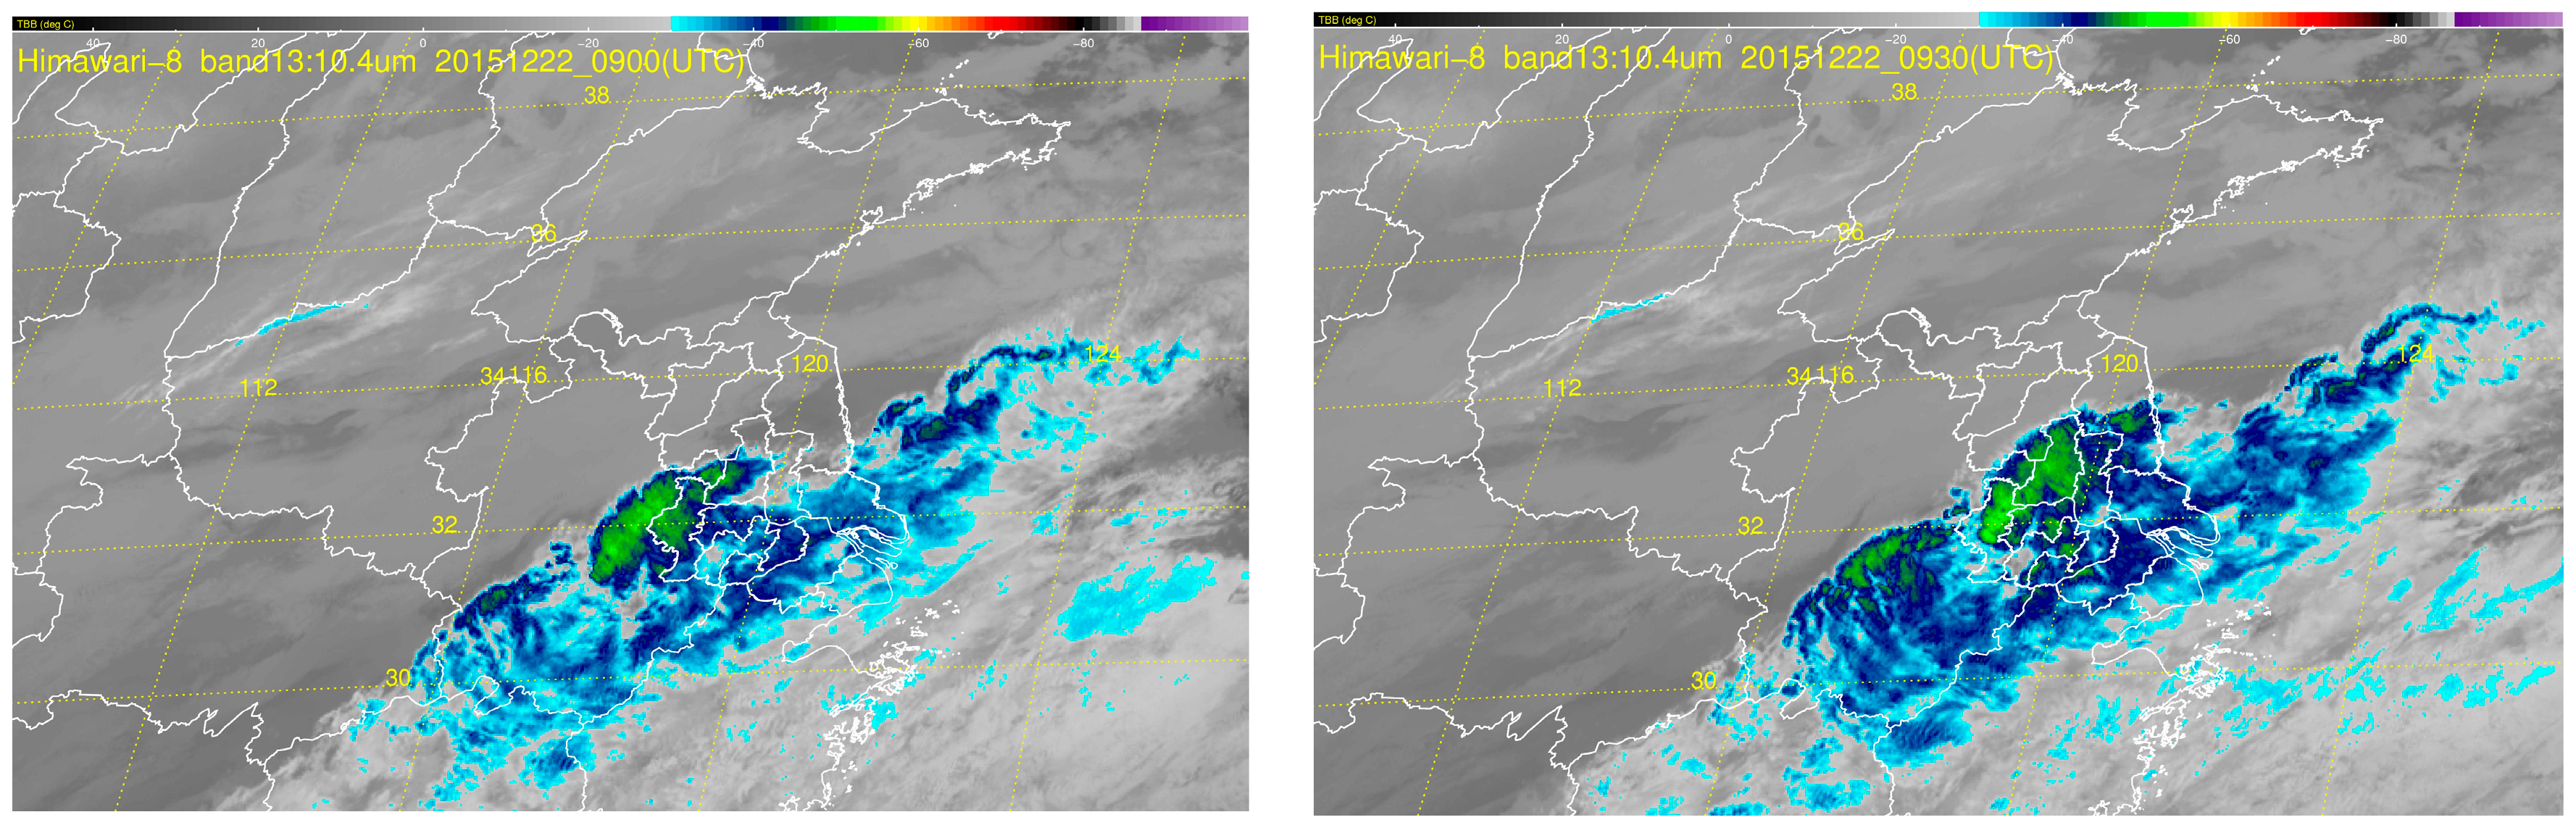
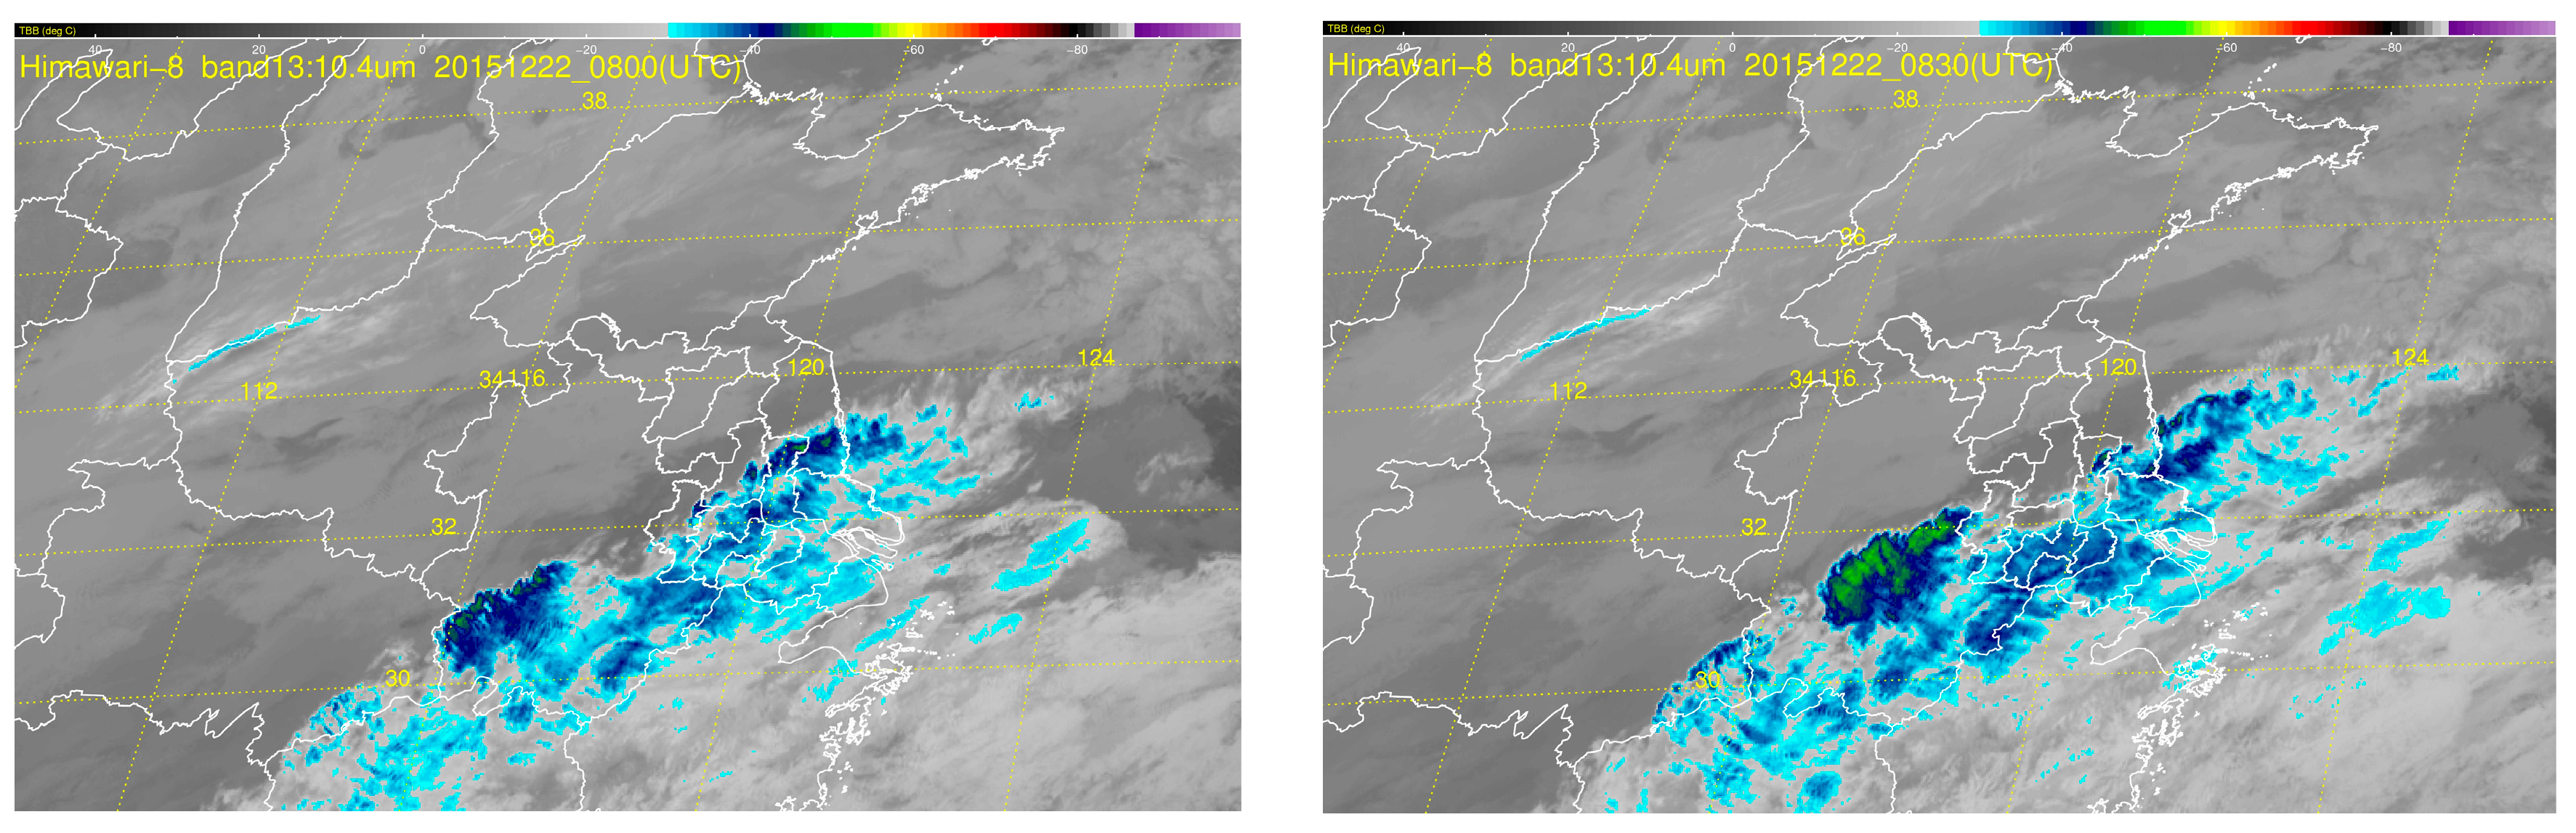
2.3. Satellite Image

The Himawari-8 satellite image was used during the haze episode to show the cloud conditions. We choose Band 13: 10.4 μm—the image from 08:00 to 09:30 UTC 22 December 2015.

3. Results

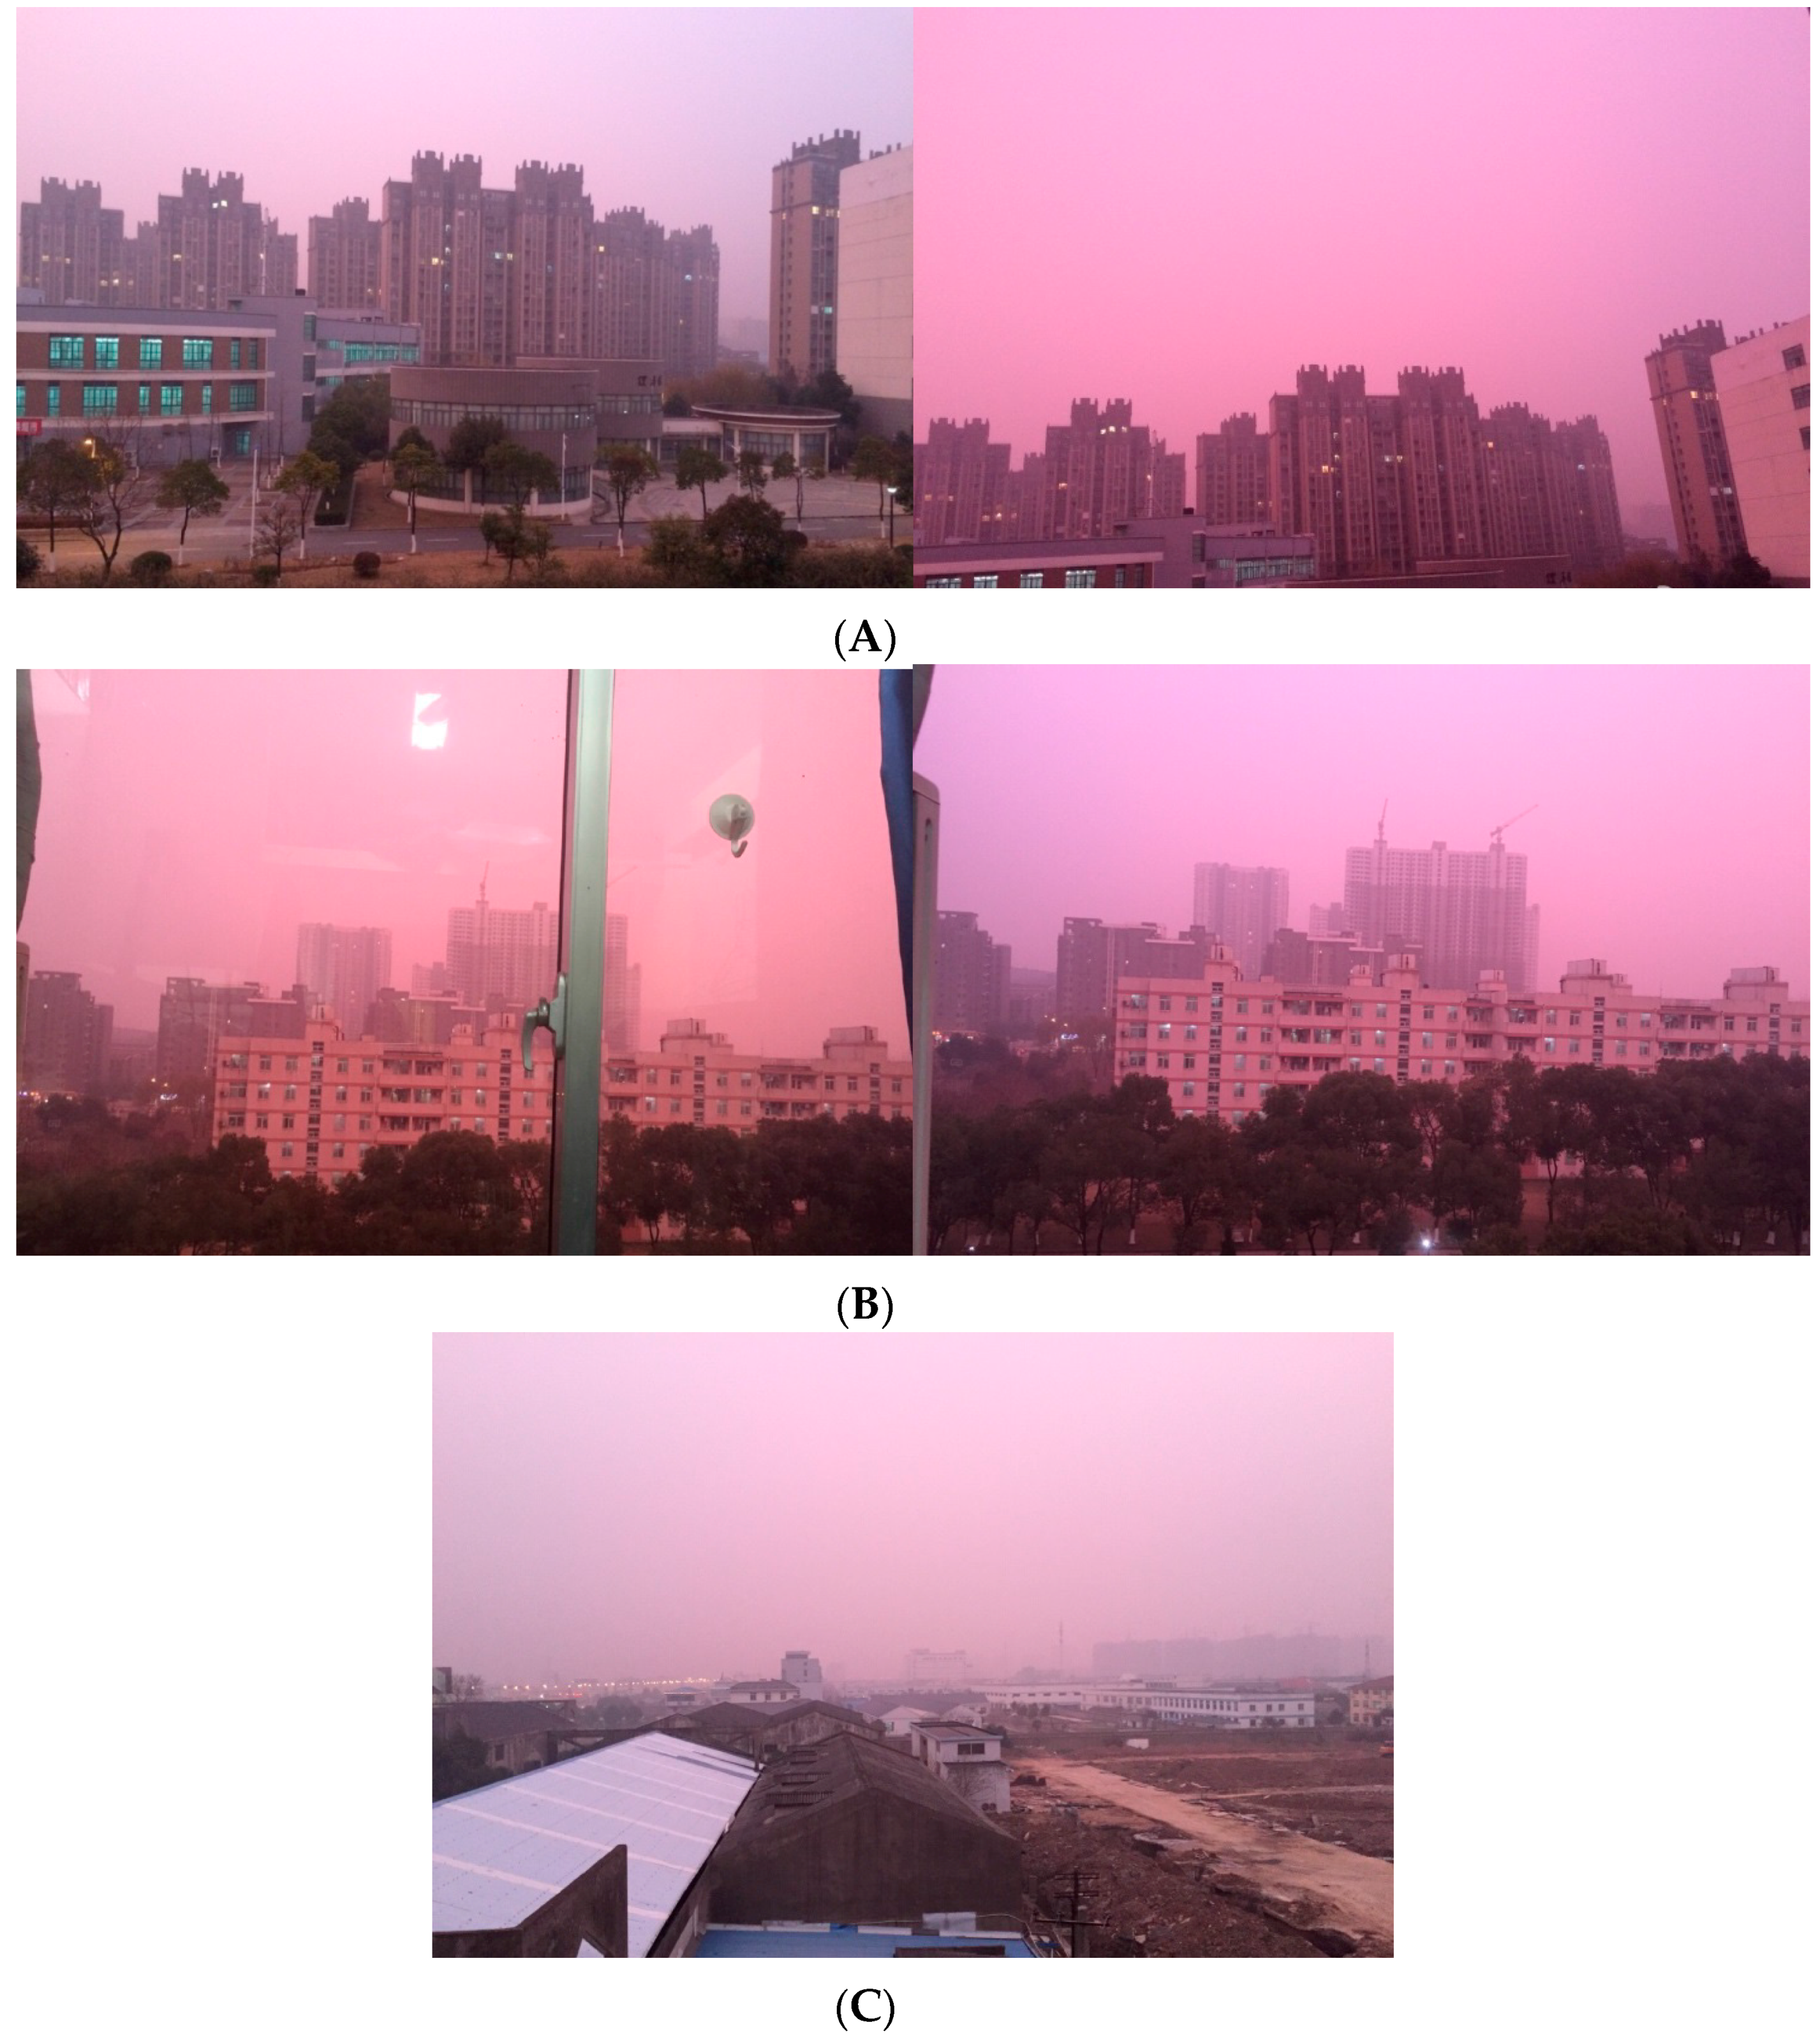
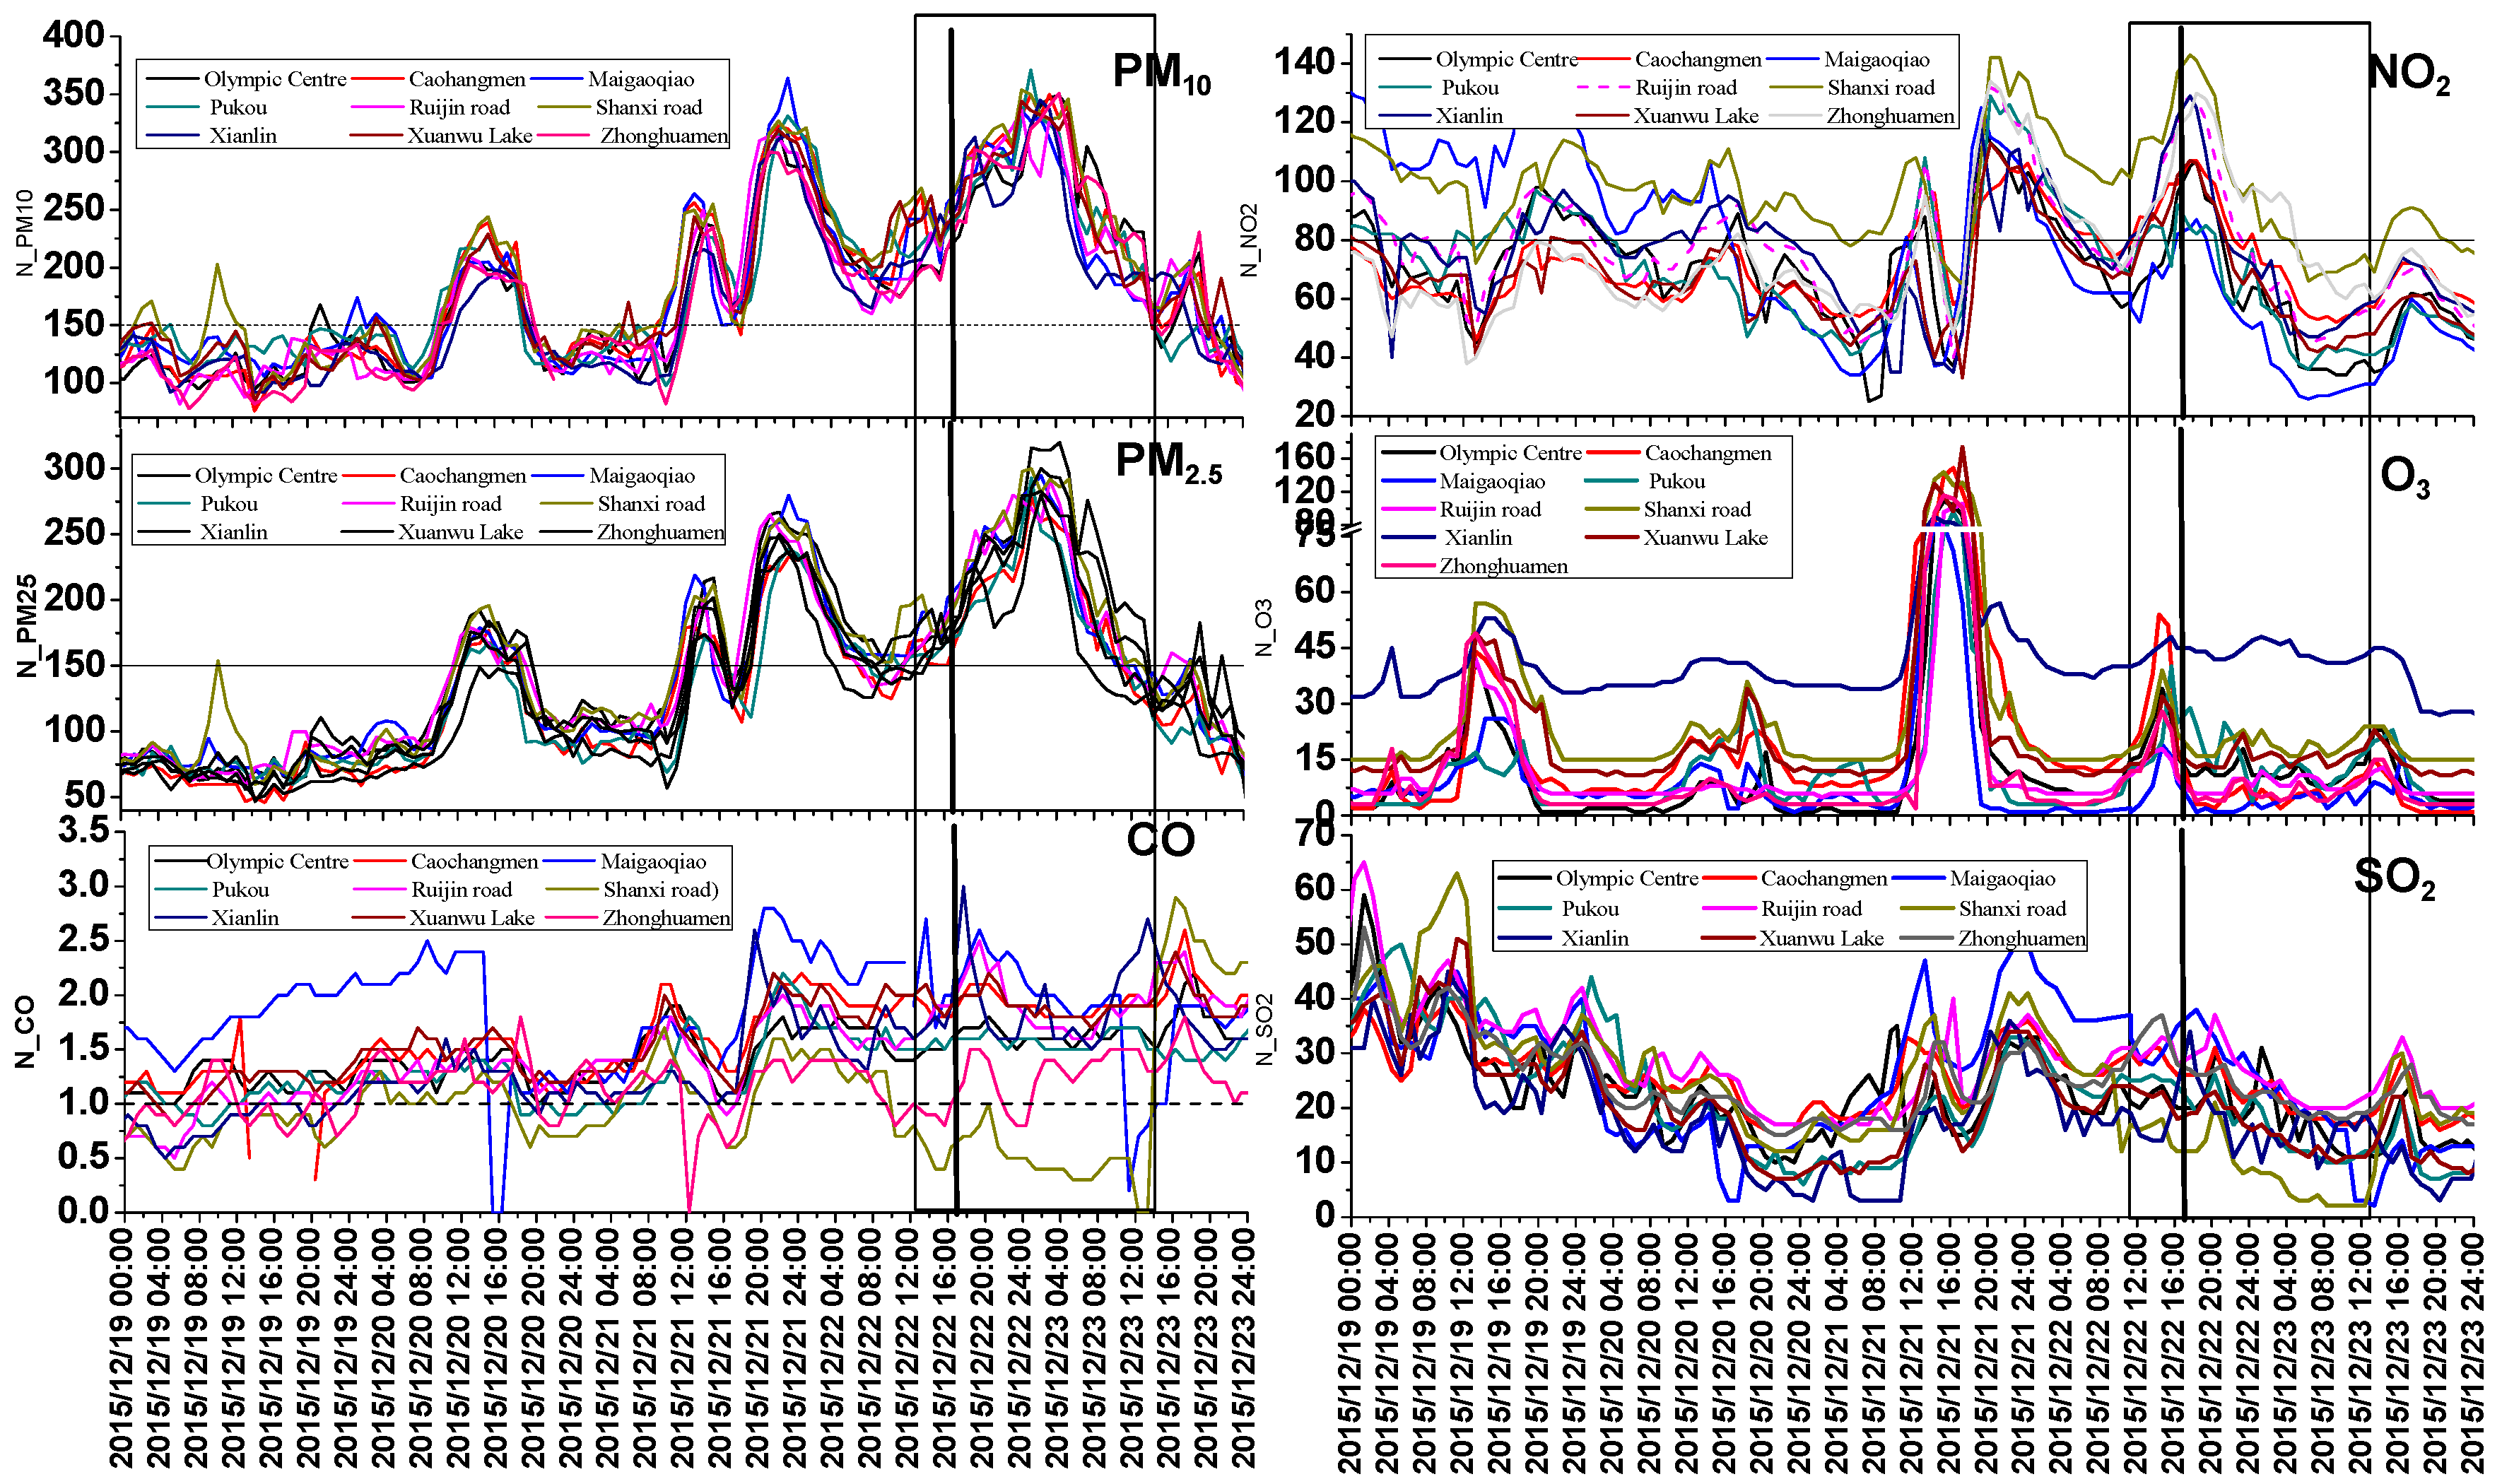
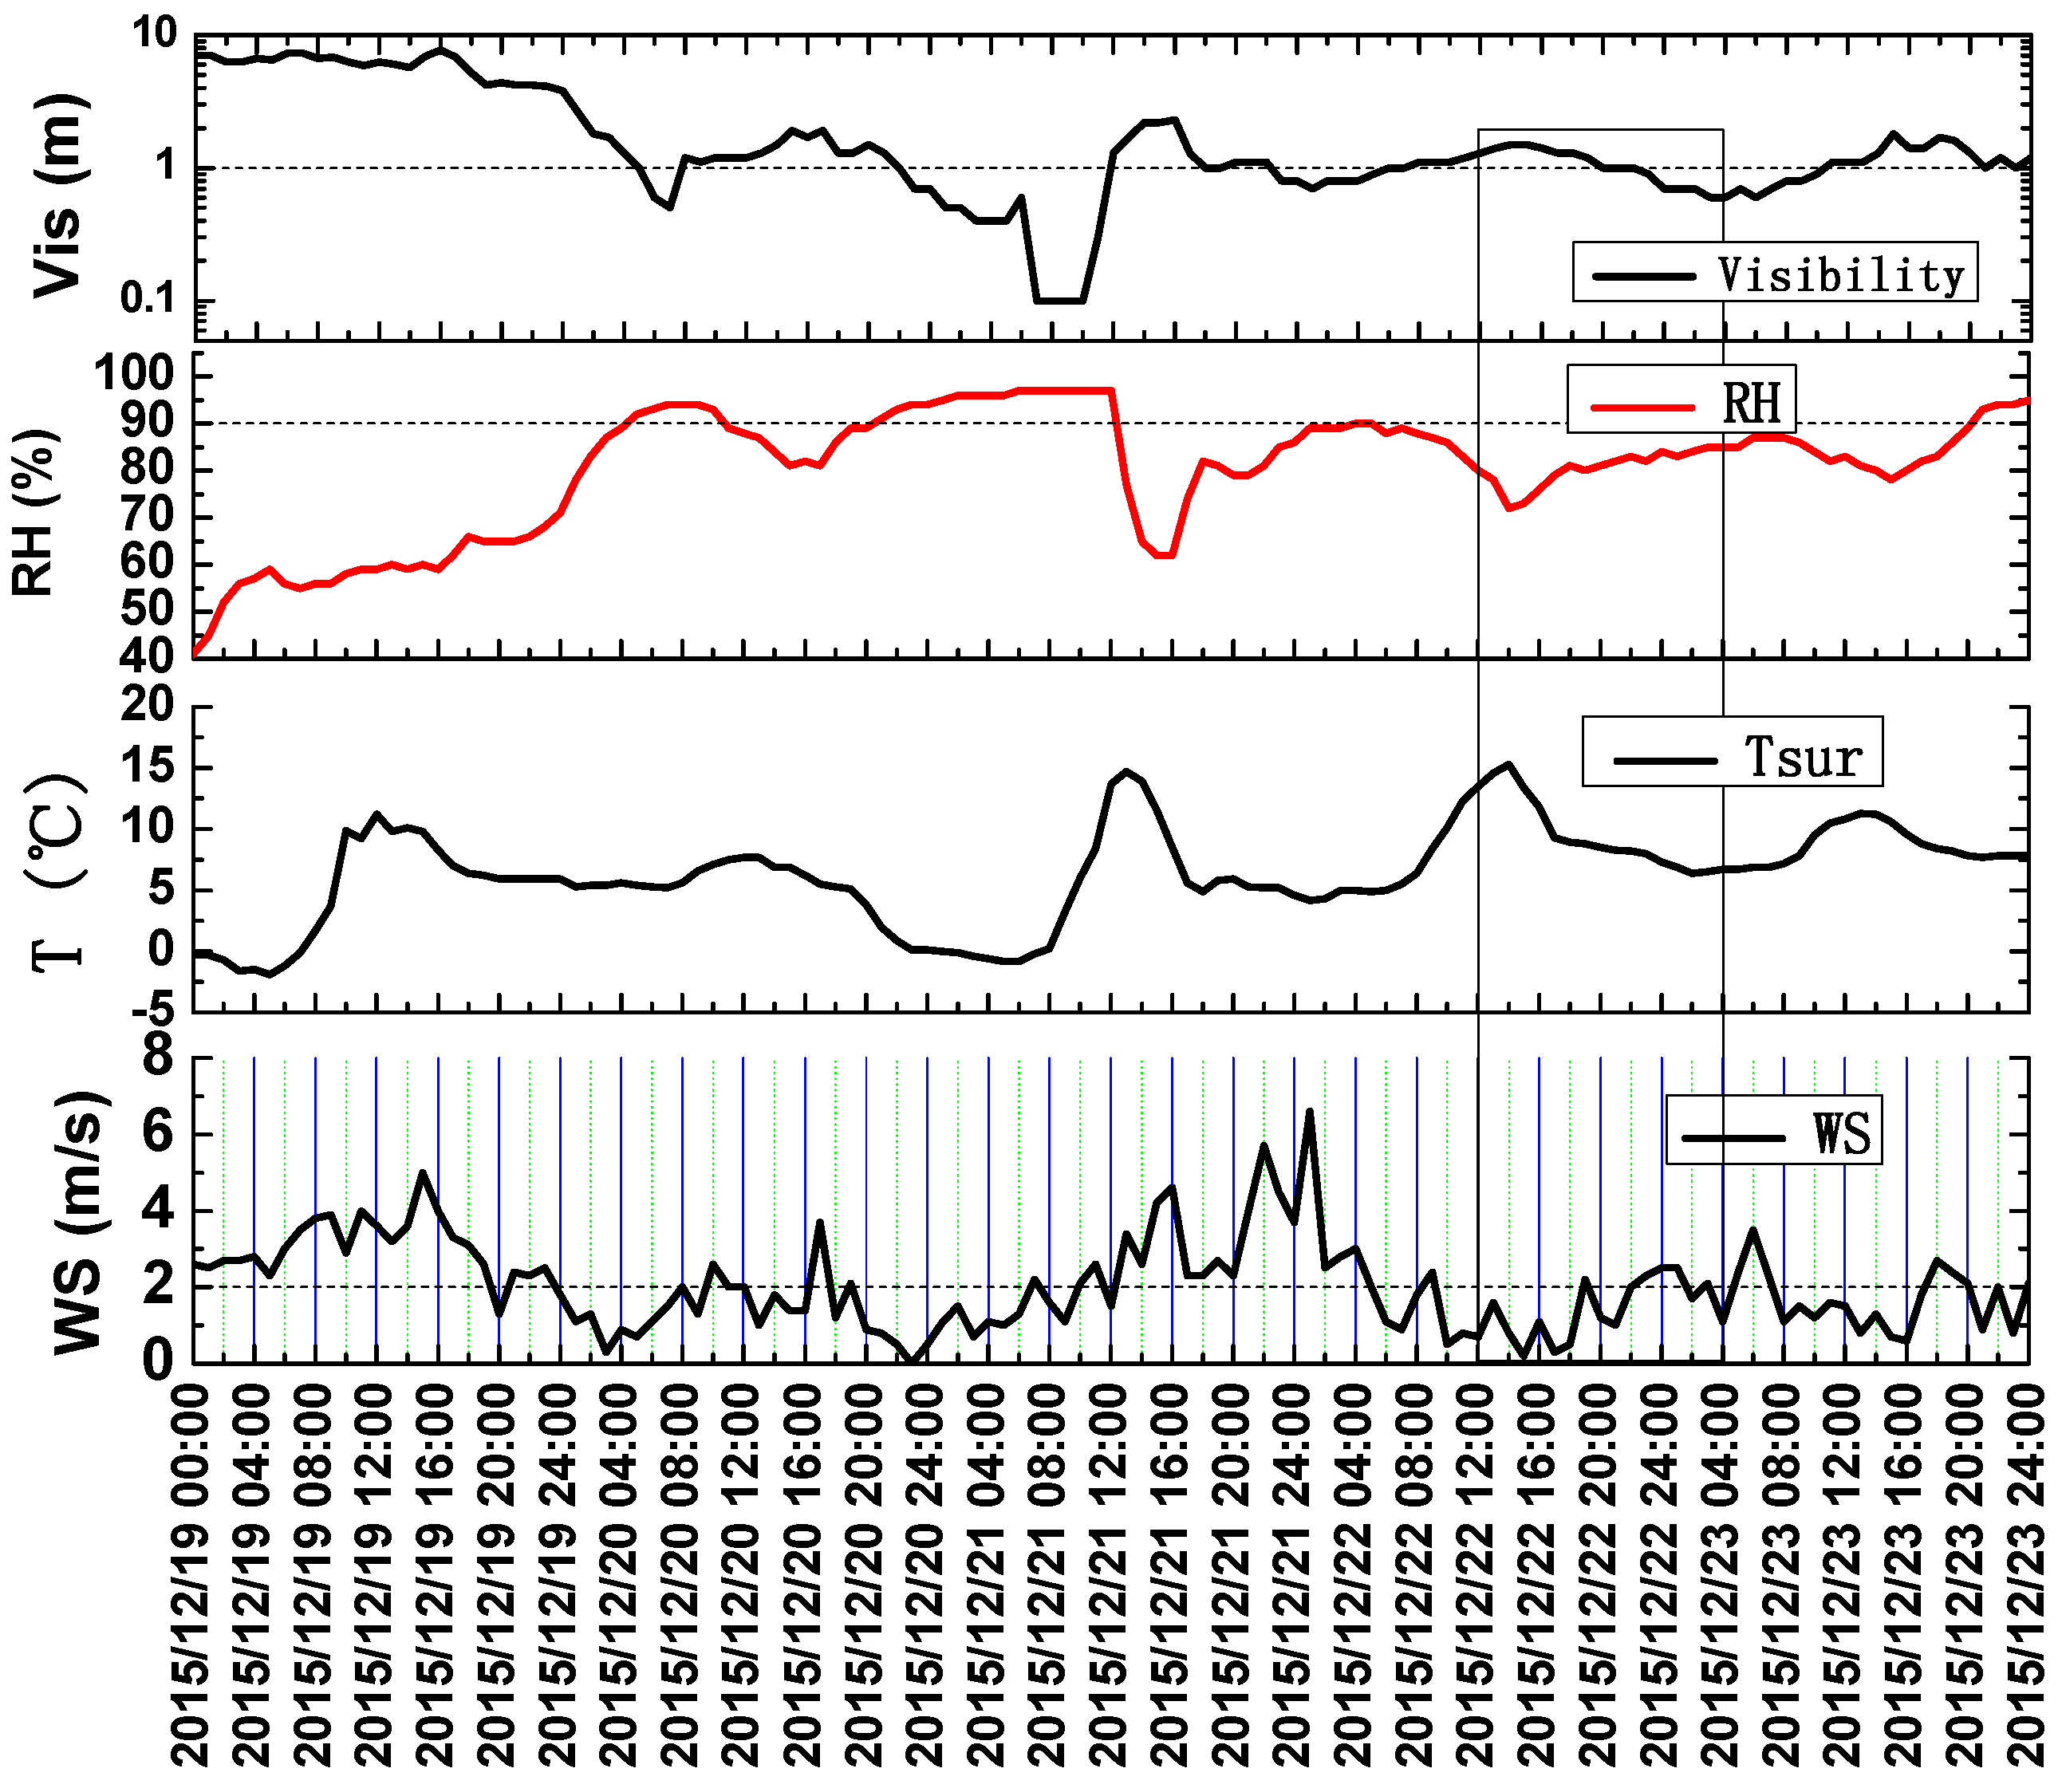
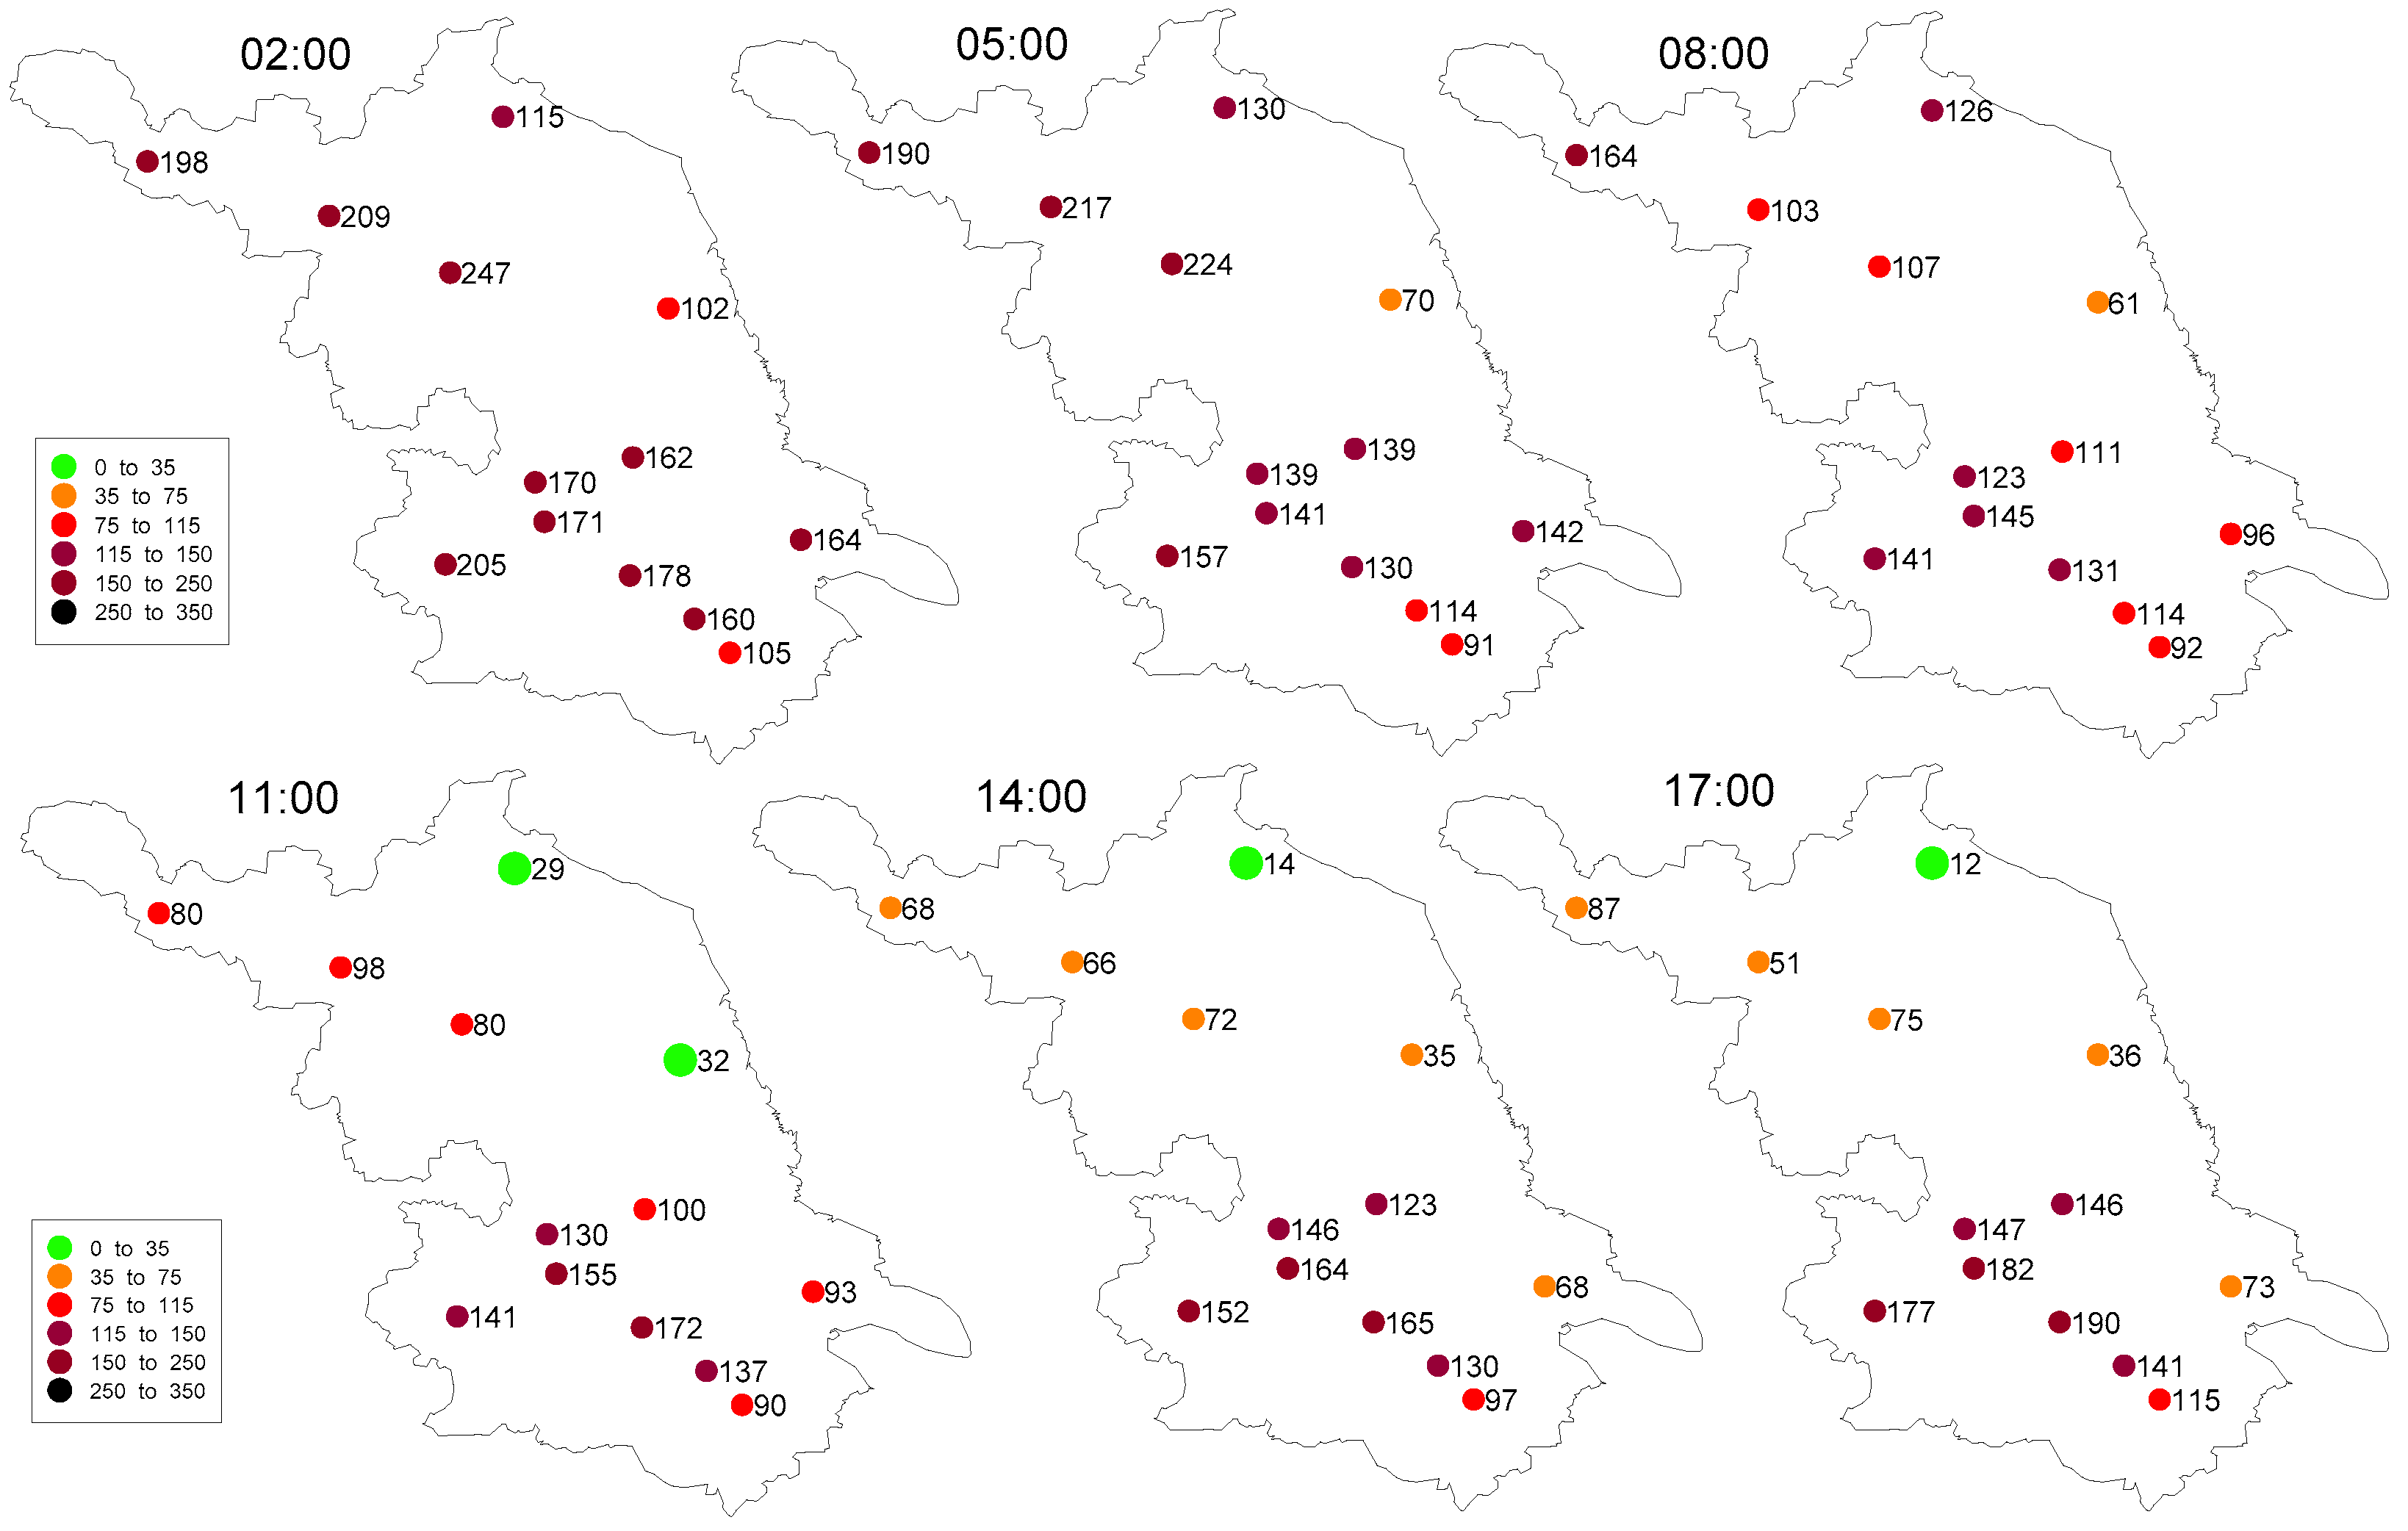
3.1. Pollution Features and Meteorological Elements

Table 1 presents surface pollution concentrations at 17:00 on 22 December 2015 (local time) for nine stations in Nanjing, China. During the purple haze, the surface PM2.5 concentrations in Nanjing were all greater than 180 µg/m3, with some exceeding 250 µg/m3. PM10 concentrations were all greater than 230 µg/m3, with some exceeding 300 µg/m3. The SO2 concentrations were mostly lower than 30 µg/m3. Most NO2 concentrations exceeded 100 µg/m3. CO concentrations were all larger than 1.0 mg/m3, with concentrations at the downtown stations (Caochangmen, Maigaoqiao, Ruijinlu, Xianlin, and Xuanwu Lake) all exceeding 2 mg/m3.
From the pollution concentration changes of 9 stations (Figure 4), we can see that the PM2.5, PM10, CO, and NO2 all showed an increasing trend as of 19 December.
PM2.5 and PM10 reached the first peak during 20:00–23:00 on 21 December, and then declined. There was an increasing trend after 10:00 on 22 December and reached a peak again at 04:00 on 23 December. The purple haze appeared during these two peaks. NO2 also peaked twice: the first one was from 19:00 to 21:00 on 21 December, and the second one was from 16:00 to 18:00 on 22 December. When the second peak occurred, most NO2 concentrations exceeded 100 µg/m3, and this was when the purple haze occurred. O3 concentration also peaked twice: once from 13:00 to 17:00 on 21 December, and once from 14:00 to 16:00 on 22 December, respectively, and the second peak appeared just before the purple haze.
In Figure 5 and Table 2, it can be seen that, during the purple haze period, surface winds came from the northwest with speeds below 2.5 m/s. The temperatures were between 8.5 and 9.6 °C, RH values were in the range 75–82%, and visibilities were between 1.1 and 1.6 km (Table 2).

3.2. The Mixing Boundary Layer Features

The wind, RH, and temperature profiles of Nanjing at 20:00 on 22 December 2015, 3 h after this purple haze, are displayed in Figure 6. From these profiles, we can see that there were three cloud layers: the first between 250 and 700 m, the second between 1500 and 1600 m, and the third between 2000 and 2200 m. These three cloud layers were associated with three temperature inversions. The first inversion was between 400 and 760 m, the second inversion between 1500 and 1600 m, and the third inversion between 2000 and 2250 m.
The wind direction was westerly or southwesterly above 600 m, and easterly below 600 m. The wind speed was lower than 4 m/s below 660 m, and lower than 2 m/s below 100 m and between 350 and 550 m (Figure 6).
From the satellite image (Figure 7), it can be seen that, from 08:00 to 09:30 UTC on 22 December 2015, there was a cloud layer covered Nanjing from 16:20–17:30 on 22 December 2015 (local time), and the cloud moved from the southwest to the northeast, which was consistent with the second and the third cloud layers (Figure 6).

3.3. Regional Transport Process

In order to analyze the pollution transportation of this purple haze, the 72 h backward trajectories during the purple haze were calculated (Figure 8). The length of cluster-mean trajectories determines the transport speed of the air masses. A longer pathway equates to faster transport. From 72 h backward trajectories, we can see that all of the air parcels were recirculated within a 300 km area, the air parcels at 50 m, 150 m, and 300 m height are all circled in Jiangsu province. Figure 9 shows the surface PM2.5 concentrations from 02:00 to 17:00 on 22 December 2015 (local time) in 13 cities of Jiangsu, and it can be seen that the pollutions were all greater than 100 µg/m3 in the south of Jiangsu. The upstream transportation caused the PM2.5 concentrations to increase to a high level.
In Figure 6, it can be seen that the first inversion was between 400 and 760 m, and based on Figure 8 and Figure 9, we can estimate that the pollution concentrations would have similar concentrations below 400 m.

4. Questions, Possibilities and Discussion

During sunset, with such typical pollution conditions, a brown haze is expected. Pollution levels, meteorological conditions, and transport patterns were not unusual relative to those commonly seen during other Nanjing haze events [20,21,22,23,24]. Why might the haze have presented such a distinctive purple color? Where did the blue light come from? Why was the blue light not absorbed? Why was the green light absorbed, the blue and red light transmitted, and what pollution absorbed the green light? Was it O3 or other polluting gases or particles?
The scattering of sunlight by atmospheric gas molecules tends to make the sky look blue, since short wavelengths are scattered more effectively by these small objects compared to longer ones. The shortest wavelengths in the visible spectrum are actually violet/purple, but the human eye does not detect these as well, so the sky generally appears blue to a human observer. At sunset, as the sun’s light travels through a longer atmospheric path before reaching the observer, the sky tends to appear red/orange, because the shorter blue wavelengths are scattered out of the line of sight. Jacobson (2012) [5] points out that, under severe polluted conditions, sunset hazes also generally tend toward red or brown due to the absorption of blue and green light by NO2, with a more effective transmission of longer wavelengths.
A second possibility not only includes other pollution gas or particle influences, but also small liquid-water drops, or pollution together with small liquid-water drops. However, this requires further physical, chemical, and optical observation and explanation.
Another possibility is that red light, typically associated with sunsets, is transported toward the observer. The addition of a shorter-wavelength blue light scatters off small particles in the atmosphere above the observer. This scattering could be enhanced by sunlight reflected off of overhead clouds still illuminated by the sun. The combination of transmitted red light from the sun and scattered blue light from above could produce a purple/magenta color in the sky. There are three cloud layers and inversions below 2500 m. There is a great amount of purple sunset glow in the sky in many different places, and a purple sky is usually influenced by clouds during the sunrise of sunset. Thus, the third possibility is that this event is a combination of sunset glow and haze.

5. Conclusions

If this third explanation is correct, the appearance of purple haze is not a new phenomenon—just an unusual one. It is simply a combination of typical haze and cloud layers arranged in such a way such that a low sun angle results in an observer’s witnessing a combination of transmitted (red) and scattered (blue) light that combine to make the sky appear purple.

Acknowledgments

Funding for this work was jointly provided by the National Key Project of MOST (JFYS2016ZY01002213-03), the Natural Science Foundation of Jiangsu Province (Grant No. BK20130111, BK20161073), the National Natural Science Foundation of China (Grant Nos. D0511/41275151, D0512/91544229 and D0512/91544231), the Key Projects of Jiangsu Meteorological Bureau (Grant NO. KZ201405), the National Key Technology Support Program (2014BAC22B04), and the Qing Lan Project. The authors would also like to thank William C. Malm from Cooperative Institute for Research in the Atmosphere (CIRA), Colorado State University for his advice on text revision.

Author Contributions

This study was completed with cooperation among all authors: Duanyang Liu conceived and designed the research topic. Duanyang Liu and Yi Li conducted the research and wrote the manuscript. Duanyang Liu, Xuejun Liu, Xingna Yu, Zhiming Kang, Hongbin Wang, Hao Chen, and Lu Cao collaborated in discussing the results and providing editorial advice.

Conflicts of Interest

The authors declare no conflict of interest.

References

  1. Burger, J.W.; Pienaar, J.J.; Fourie, L.; Jordaan, J.H.L.; Brebbia, C.A. Identification and quantification of volatile organic compounds in the Cape Town brown haze. Air Pollut. 2004, 74. [Google Scholar] [CrossRef]
  2. Charlson, R.J.; Ahlquist, N.C. Brown haze: NO2 or aerosol? Atmos. Environ. 1969, 3, 653–656. [Google Scholar] [CrossRef]
  3. Horvath, H. On the brown colour of atmospheric haze. Atmos. Environ. 1971, 5, 333–344. [Google Scholar] [CrossRef]
  4. Jacobson, M.Z. Atmospheric Pollution Pistory, Science, and Regulation; Cambridge University Press: New York, NY, USA, 2002. [Google Scholar]
  5. Jacobson, M.Z. Air Pollution and Global Warming History, Science, and Solutions; Cambridge University Press: New York, NY, USA, 2012. [Google Scholar]
  6. Sloane, C.S. Contribution of NO2 and soot to the discoloration of urban skies. Atmos. Environ. (1967) 1988, 22, 2021–2031. [Google Scholar] [CrossRef]
  7. Deluisi, J.J.; Bonelli, J.E.; Shelden, C.E. Spectral absorption of solar radiation by the denver brown (pollution) cloud. Atmos. Environ. 1977, 11, 829–836. [Google Scholar] [CrossRef]
  8. Huang, L.; Yuan, C.-S.; Wang, G.; Wang, K. Chemical characteristics and source apportionment of PM10 during a brown haze episode in Harbin, China. Particuology 2011, 9, 32–38. [Google Scholar] [CrossRef]
  9. Senaratne, I.; Shooter, D. Elemental composition in source identification of brown haze in Auckland, New Zealand. Atmos. Environ. 2004, 38, 3049–3059. [Google Scholar] [CrossRef]
  10. Ferman, M.A.; Wolff, G.T.; Kelly, N.A. An assessment of the gaseous pollutants and meteorological conditions associated with Denver’s brown cloud. J. Environ. Sci. Health Part A Environ. Sci. Eng. 1981, 16, 315–339. [Google Scholar] [CrossRef]
  11. Groblicki, P.J.; Wolff, G.T.; Countess, R.J. Visibility-reducing species in the denver “brown cloud”—I. Relationships between extinction and chemical composition. Atmos. Environ. 1981, 15, 2473–2484. [Google Scholar] [CrossRef]
  12. Waggoner, A.P.; Weiss, R.E.; Ahlquist, N.C. The color of denver haze. Atmos. Environ. (1967) 1983, 17, 2081–2086. [Google Scholar] [CrossRef]
  13. Megaw, W.J. Thin layer brown haze. J. Aerosol Sci. 1977, 8, 21–29. [Google Scholar] [CrossRef]
  14. Malm, W.C. Introduction to Visibility. Fort Collins, CO: Cooperative Institute for Research in the Atmosphere, NPS Visibility Program; Colorado State University: Fort Collins, CO, USA, 1999. [Google Scholar]
  15. Malm, W.C. Visibility, the Seeing of Near and Distant Landscape Features. Fort Collins, CO: Cooperative Institute for Research in the Atmosphere, NPS Visibility Program; Colorado State University: Fort Collins, CO, USA, 2016. [Google Scholar]
  16. Zhang, R.; Wang, L.; Khalizov, A.F.; Zhao, J.; Zheng, J.; McGraw, R.L.; Molina, L.T. Formation of nanoparticles of blue haze enhanced by anthropogenic pollution. Proc. Natl. Acad. Sci. USA 2009, 106, 17650–17654. [Google Scholar] [CrossRef] [PubMed]
  17. Purple Haze: Lilac Sky at Night Highlights China’s Smog Blight. Available online: http://www.theguardian.com/world/2015/dec/23/purple-haze-lilac-sky-night-highlights-china-smog-blight (accessed on 23 December 2015).
  18. Fleming, Z.; Monks, P.; Manning, A. Review: Untangling the influence of air-mass history in interpreting observed atmospheric composition. Atmos. Res. 2012, 104–105, 1–39. [Google Scholar] [CrossRef]
  19. Zhao, M.; Huang, Z.; Qiao, T.; Zhang, Y.; Xiu, G.; Yu, J. Chemical characterization, the transport pathways and potential sources of PM2.5 in Shanghai: Seasonal variations. Atmos. Res. 2015, 158–159, 66–78. [Google Scholar] [CrossRef]
  20. Deng, J.; Wang, T.; Jiang, Z.; Xie, M.; Zhang, R.; Huang, X.; Zhu, J. Characterization of visibility and its affecting factors over Nanjing, China. Atmos. Res. 2011, 101, 681–691. [Google Scholar] [CrossRef]
  21. Kang, H.; Zhu, B.; Su, J.; Wang, H.; Zhang, Q.; Wang, F. Analysis of a long-lasting haze episode in Nanjing, China. Atmos. Res. 2013, 120–121, 78–87. [Google Scholar] [CrossRef]
  22. Kong, S.; Li, X.; Li, L.; Yin, Y.; Chen, K.; Yuan, L.; Zhang, Y.; Shan, Y.; Ji, Y. Variation of polycyclic aromatic hydrocarbons in atmospheric PM2.5 during winter haze period around 2014 Chinese Spring Festival at Nanjing: Insights of source changes, air mass direction and firework particle injection. Sci. Total Environ. 2015, 520, 59–72. [Google Scholar] [CrossRef] [PubMed]
  23. Lu, F.; Zhou, L.; Xu, Y.; Zheng, T.; Guo, Y.; Wellenius, G.A.; Bassig, B.A.; Chen, X.; Wang, H.; Zheng, X. Short-term effects of air pollution on daily mortality and years of life lost in Nanjing, China. Sci. Total Environ. 2015, 536, 123–129. [Google Scholar] [CrossRef] [PubMed]
  24. Yu, X.; Ma, J.; Kumar, K.R.; Zhu, B.; An, J.; He, J.; Li, M. Measurement and analysis of surface aerosol optical properties over urban Nanjing in the Chinese Yangtze River Delta. Sci. Total Environ. 2016, 542, 277–291. [Google Scholar] [CrossRef] [PubMed]
Figure 1. Newton’s primary colors.
Atmosphere 08 00076 g001
Figure 2. Map of China showing the location of Nanjing and observation sites for the purple haze. The suburban observation locations were at (A) Liuhe; (B) Pukou; and (C) Jiangpu. The arrows denote directions of photographs taken at these locations.
Atmosphere 08 00076 g002
Figure 3. The purple haze event in the winter of Nanjing, China at 17:00 22 December 2015 local time (locations for photography: (A), Liuhe; (B), Pukou; (C), Jiangpu).
Atmosphere 08 00076 g003
Figure 4. Surface pollution concentrations from 19 to 23 December 2015 (local time) in Nanjing (9 stations: Olympic Center, Caochangmen, Maigaoqiao, Pukou, Ruijin Road, Shanxi Road, Xianlin, Xuanwu Lake, Zhonghuamen), China.
Atmosphere 08 00076 g004
Figure 5. Meteorological conditions from 19 to 23 December 2015 (local time) in Nanjing, China.
Atmosphere 08 00076 g005
Figure 6. The profiles of the wind, RH, and temperature in Nanjing at 20:00 on 22 December 2015.
Atmosphere 08 00076 g006
Figure 7. The Himawari-8 satellite image (Band 13: 10.4 µm—from 08:00 to 09:30 UTC on 22 December 2015).
Atmosphere 08 00076 g007aAtmosphere 08 00076 g007b
Figure 8. Backward trajectories ending at 17:00 BST on 22 December 2015 for Nanjing (height: red, 50 m; blue, 150 m; cyan, 300 m; green, 500 m).
Atmosphere 08 00076 g008
Figure 9. Surface PM2.5 concentrations from 02:00 to 17:00 on 22 December 2015 (local time) in 13 cities (Nanjing, Xuzhou, Suqian, Lianyungang, Huaian, Yancheng, Yangzhou, Taizhou, Zhenjiang, Changzhou, Wuxi, Suzhou, and Nantong), China. Unit: µg/m3.
Atmosphere 08 00076 g009
Table 1. Surface pollution concentrations at 17:00 on 22 December 2015 (local time) in Nanjing, China.
StationsPM2.5PM10SO2NO2O3CO
Unitµg/m3mg/m3
Olympic Center20524620107111.7
Caochangmen1922932610732.1
Maigaoqiao251304296112.3
Pukou1992742285161.6
Ruijin road2532993112162.5
Shanxi road25130921129161.0
Xianlin22030226125442.4
Xuanwu lake20727719106132.0
Zhonghuamen1882392613041.5
Table 2. Meteorological conditions at 17:00 on 22 December 2015 in Nanjing, China.
Meteorological ElementsWSWDT2mTsurfaceTdRHTotal Cloud CoverLow Cloud CoverVisibility
Unitm/s°°C%%km
Jiangning0.3315.010.09.36.5791001.3
Liuhe1.3292.59.28.56.3821001.1
Pukou2.3337.510.29.66.0751001.6
WS: wind speed; WD: wind direction; Td: dew-point temperature; RH: relative humidity.

