3.1. Seasonal Monsoon Variation
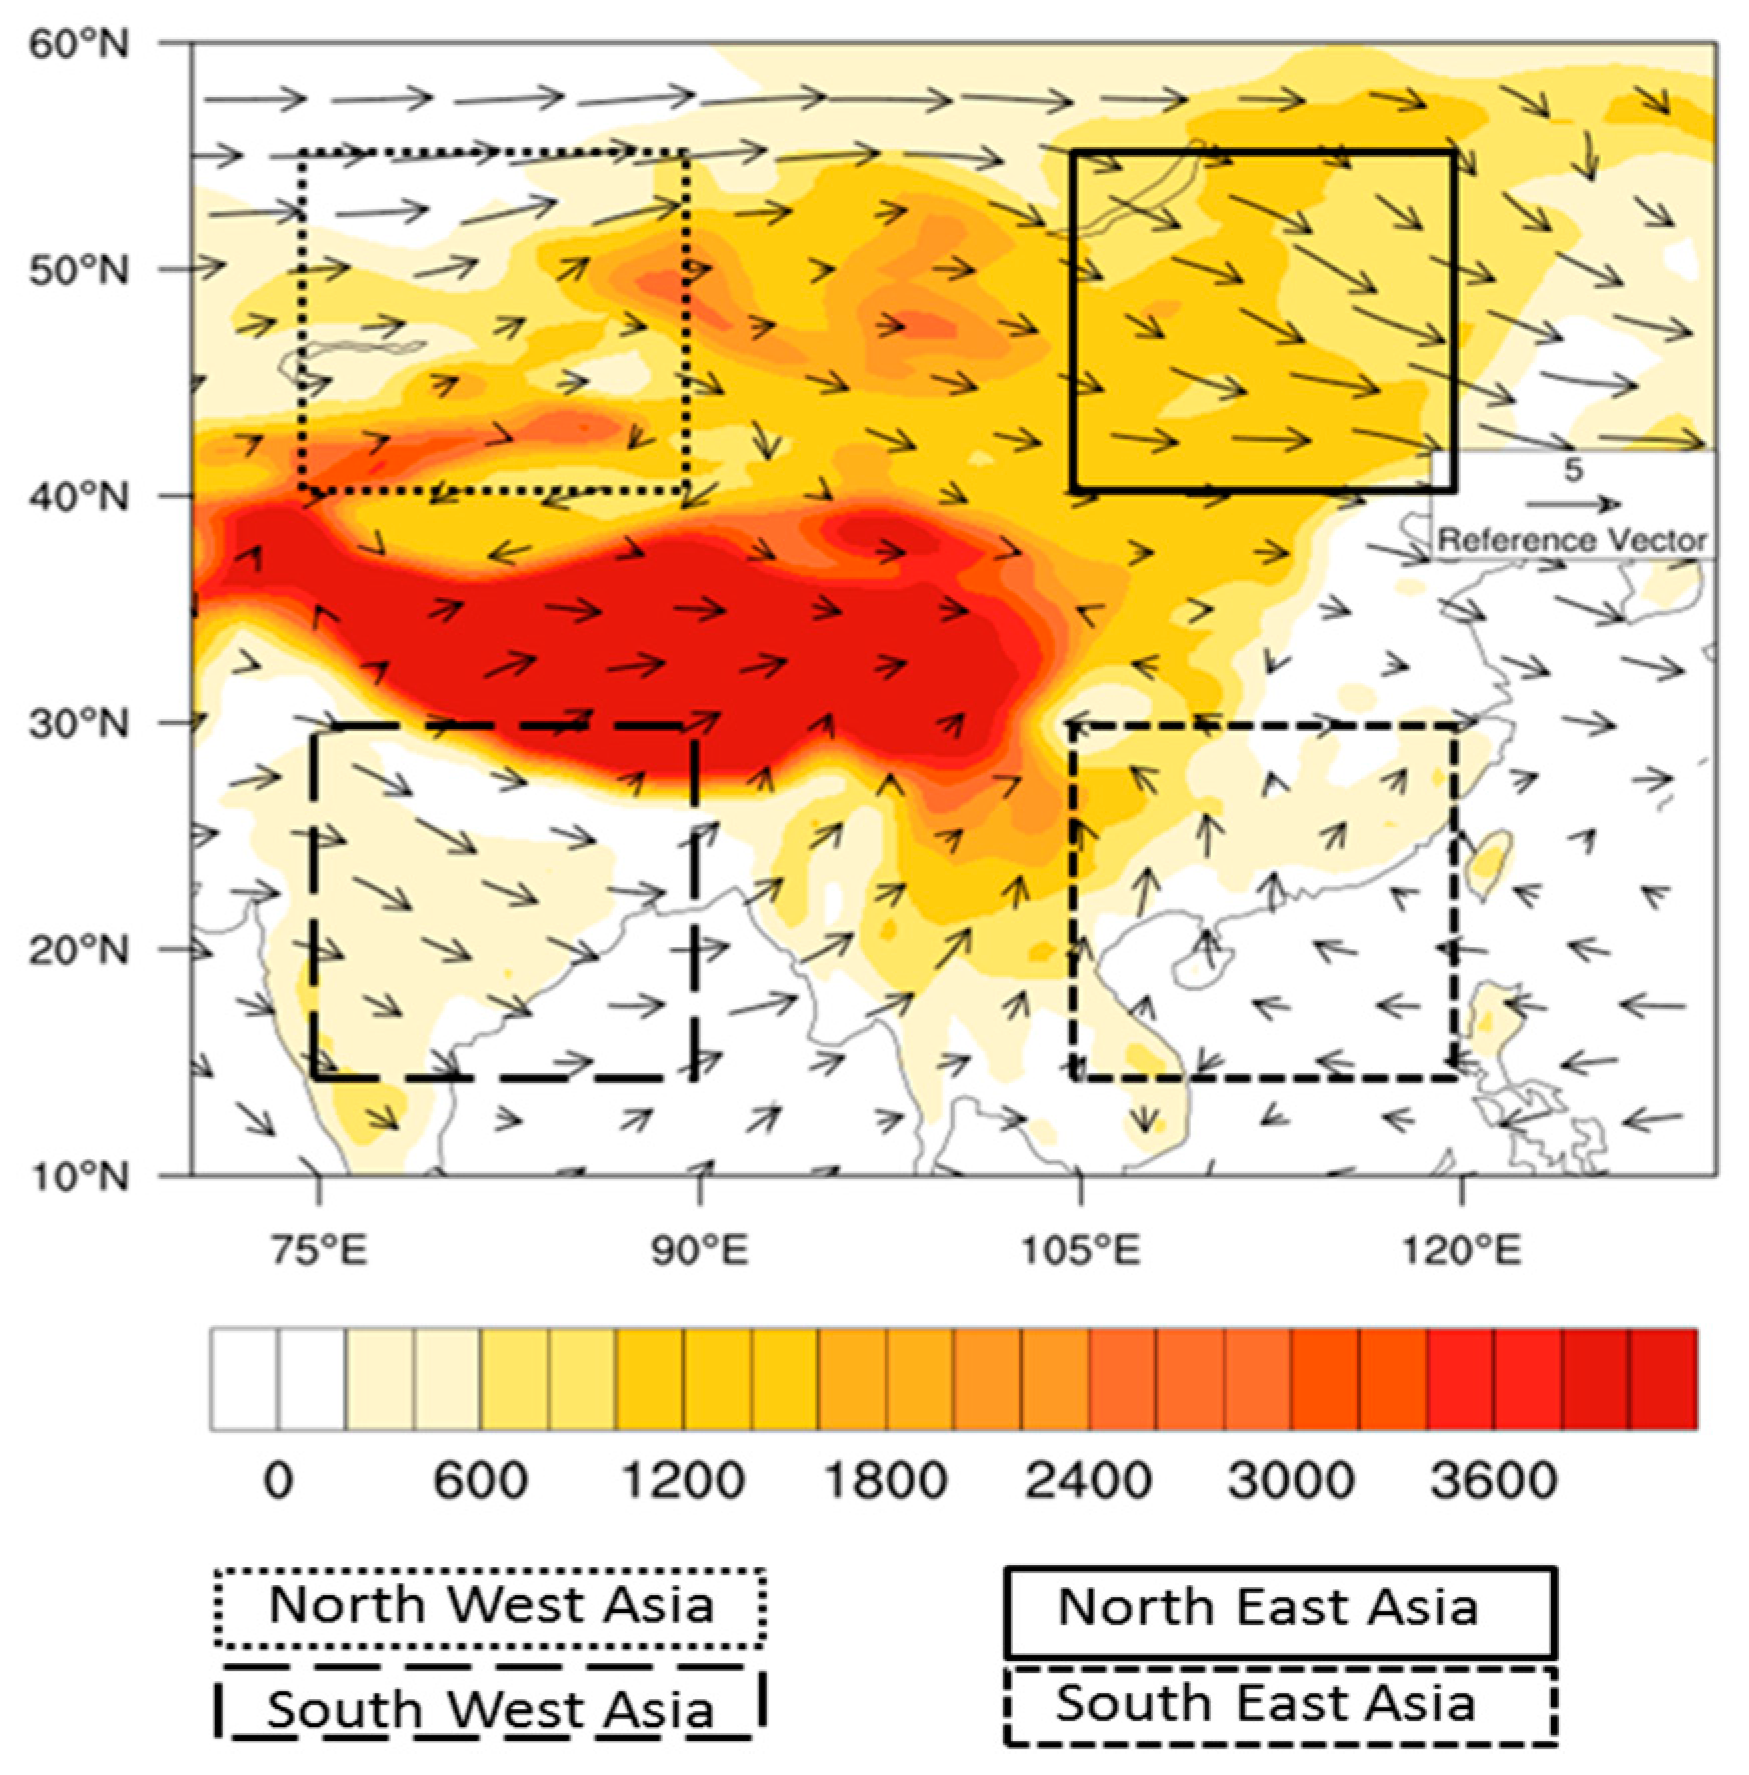
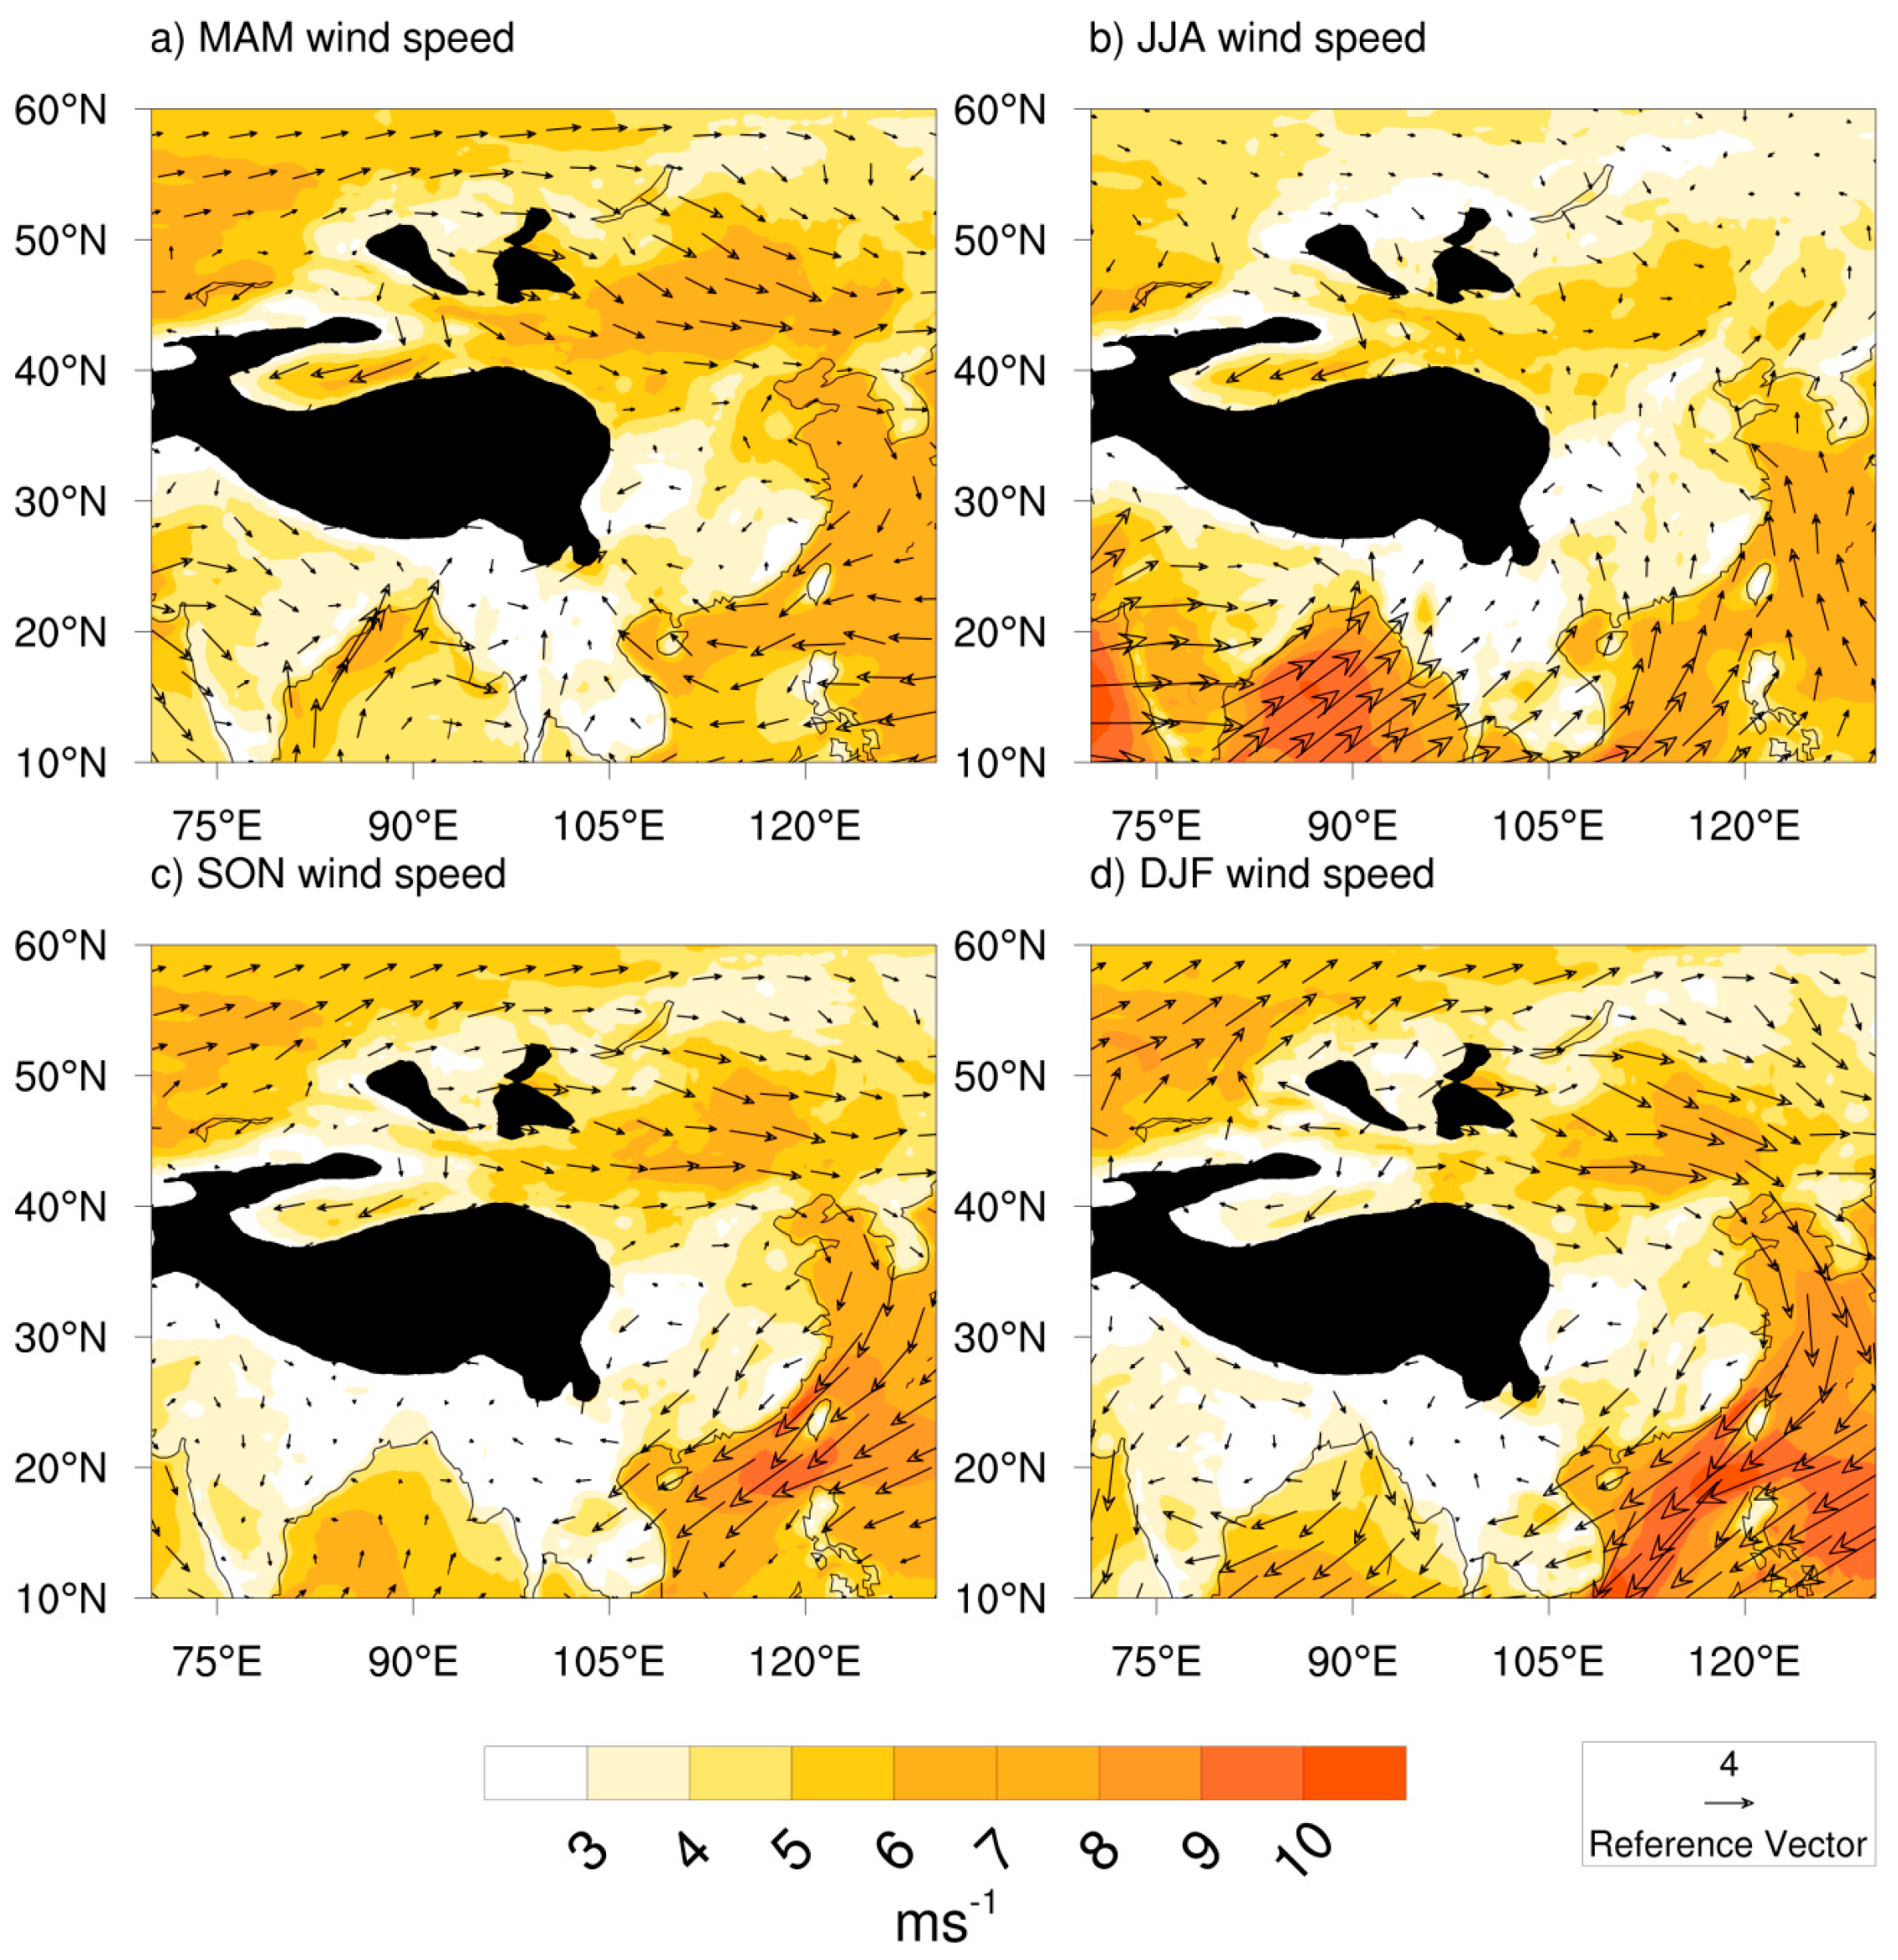
Figure 3 shows the wind climatology and vectors during the four seasons. The climatology and wind vectors over China (latitude 10°–60° N and longitude 70°–130° E) from 1979 to 2014 for the spring season (MAM) are shown in
Figure 3a. Consistent with land–sea thermal contrast patterns, strong southwesterly winds around central to southern China may be directly traced to air currents originating from the Bay of Bengal (BoB) and the Arabian Sea. A countercurrent exists in eastern China, however, attributed to the influence of the neighbouring South China Sea (SCS), which also has its own attendant influence on the circulation pattern where easterly and northeasterly winds are observed. Northern China, in contrast, exhibits a strengthening westerly wind, which perhaps confirms the fact that the East Asian Monsoon comprises tropical and subtropical systems and is hence more independent of the Indian Monsoon. The southwesterly winds coincide with the arrival of the East Asian Summer Monsoon, which has been the subject of numerous studies over the last decade. A previous study by Zhou and Chan [
23] surmised that the onset of the South China Sea Summer Monsoon (SCSSM) can be early e.g., on 14 April 1980 and late e.g., on 9 June 1987 over a study period of 1979–2000. The conventionally accepted fourth pentad in May (14–20 May) had the highest occurrence as an onset date. Zhang et al. [
24] noted that changes in monsoonal convection and rainfall were consistent with changes in wind and circulation patterns where the monsoon onset was set at the first pentad in May, also confirming the direct relationship between monsoon commencement in May and changes in wind vector dynamics. Fong and Wang [
25] observed features of abrupt change in 40-year mean pentad precipitation maps around the pentad of 16–20 May, which was thought to signal the onset of the summer monsoon. Ding [
26] acknowledged a connection between the convection system over the Indian Ocean, the southern BoB, the SCS, and the subtropical West Pacific, thereby confirming the changes in circulation features during the transition from winter to summer (spring) in the BoB, Southeast Asia, and East Asia.
This strengthening over the southern and southeastern regions of the study area is more pronounced in summer (JJA), as seen in
Figure 3b. The magnitude of the southwesterly wind originating from the BoB and its environs can be clearly noted, while the former easterly and northeasterly currents from the southern East China Sea witnessed in spring gradually reverse to southwesterly. Perhaps the sparseness of vectors in northern China may be attributed to the distinct nature of the summer monsoon over China. Ding [
26,
27] described the summer monsoon over China as comprising seasonal stepwise northward jumps, and this could thus be responsible for the vector sparseness up north. This agrees with the findings of Ding and Sun [
28], who compared latitude–time cross-sections of wind vectors at 850 hPa and 200 hPa on a pentad–pentad basis from 1979 to 1999, and observed a dominance of southwesterlies from the equator to about 15° N and some midlatitude westerlies around 35° N to 50° N, whose intensity weakened significantly along with the northward advancement of the summer monsoon. Ding [
26] suggests that the second northward jump from the Yangtze River basin to northern China occurs in the first 10 days of July, while the leading zone of the summer monsoon advances to its northernmost location in northeastern China around the 41st pentad (20–24 July) and its retreat starts at about the 44th pentad (5–9 August), effectively limiting the summer monsoon in northern and northeastern China to about a month, which may be responsible for the trend observed in wind vectors over northern China during JJA.
In autumn, wind speed shows a greater magnitude in the SCS domain and its coastal surroundings, as seen in
Figure 3c, comprising dominant northeasterly and easterly winds. Some studies explained the quick withdrawal of the leading zone of the summer monsoon southward to the northern part of the SCS in early September, where it becomes stationary and thus marks the end of the summer monsoon in East Asia [
26,
28]. The predominant wind in northern China is now westerly and southwesterly, in line with the global circulation pattern of prevailing westerlies between the latitudes of ±30° and 60° caused by the alternating high-pressure and low-pressure belts above and below this region. This also suggests an alternating interaction between the Indian Ocean (BoB and Arabian Sea) and the SCS, which corroborates the findings of Ding [
28], with autumn as a transition season with northerly and northeasterly winds interposed with westerly and southwesterly winds.
Winter witnesses a strengthening of the wind vectors observed in the transition period of autumn, as displayed in
Figure 3d. The prevalent northeasterly wind strengthens over the coastal and inland regions of the SCS under the influence of the sea. This constitutes a total reversal of what occurred in summer, where the dominance of southwesterly winds was obtained in the lower latitudes of China. The northern region, however, still exhibits westerly winds, which weaken and strengthen along the region. Cressman [
29] reported a strong eastward acceleration of jet stream wind direction for January (1968–1977), at 200 hPa, in a similar study carried out in the same region of northern China, while Chang and Lau [
30] described the intensification of the winter monsoon in southern China as eventually becoming a prevailing northerly or northeasterly wind at low levels, defining this as cold surge and providing insight on how it can be measured. The influence of the midlatitude prevailing westerlies is more pronounced here than in autumn. Another area thought to contribute to the microclimate of this region is the Tibetan Plateau. The Tibetan Plateau produces an elevated heat source during summer [
31,
32], which considerably alters the wind circulation pattern in central China, as well as affects the East Asian Summer Monsoon. Zhao and Chen [
33], using NCEP wind reanalysis data, evaluated the heat field over the Qinghai–Tibet Plateau and posited a high probability that the heat regime over that region affects the formation and variation of the Asian monsoon and interaction with the ocean. Yeh et al. [
34], as cited by Chen et al. [
32], stressed that a heat sink in winter and a heat source in summer are obtained in the atmosphere above the plateau, while Ding [
28] also confirmed that the atmosphere above the same region acts as a heat sink during late fall and winter.
In terms of magnitude, average wind speed peaked in summer around the BoB with a value of about 9 to 10 m/s while being quite light up north at <5 m/s average wind speed. Around the coastal region and the SCS, wind speed was relatively higher at >6 m/s, possibly influenced by sea breezes and the SCS temperature gradient. Through the transition into winter, wind speed gradually rises to a peak of about 11 m/s for the coastal areas. Comparatively, peak wind speeds are observed around the BoB during summer and the SCS during winter and autumn.
3.2. Wind Power Distribution and Its Variability
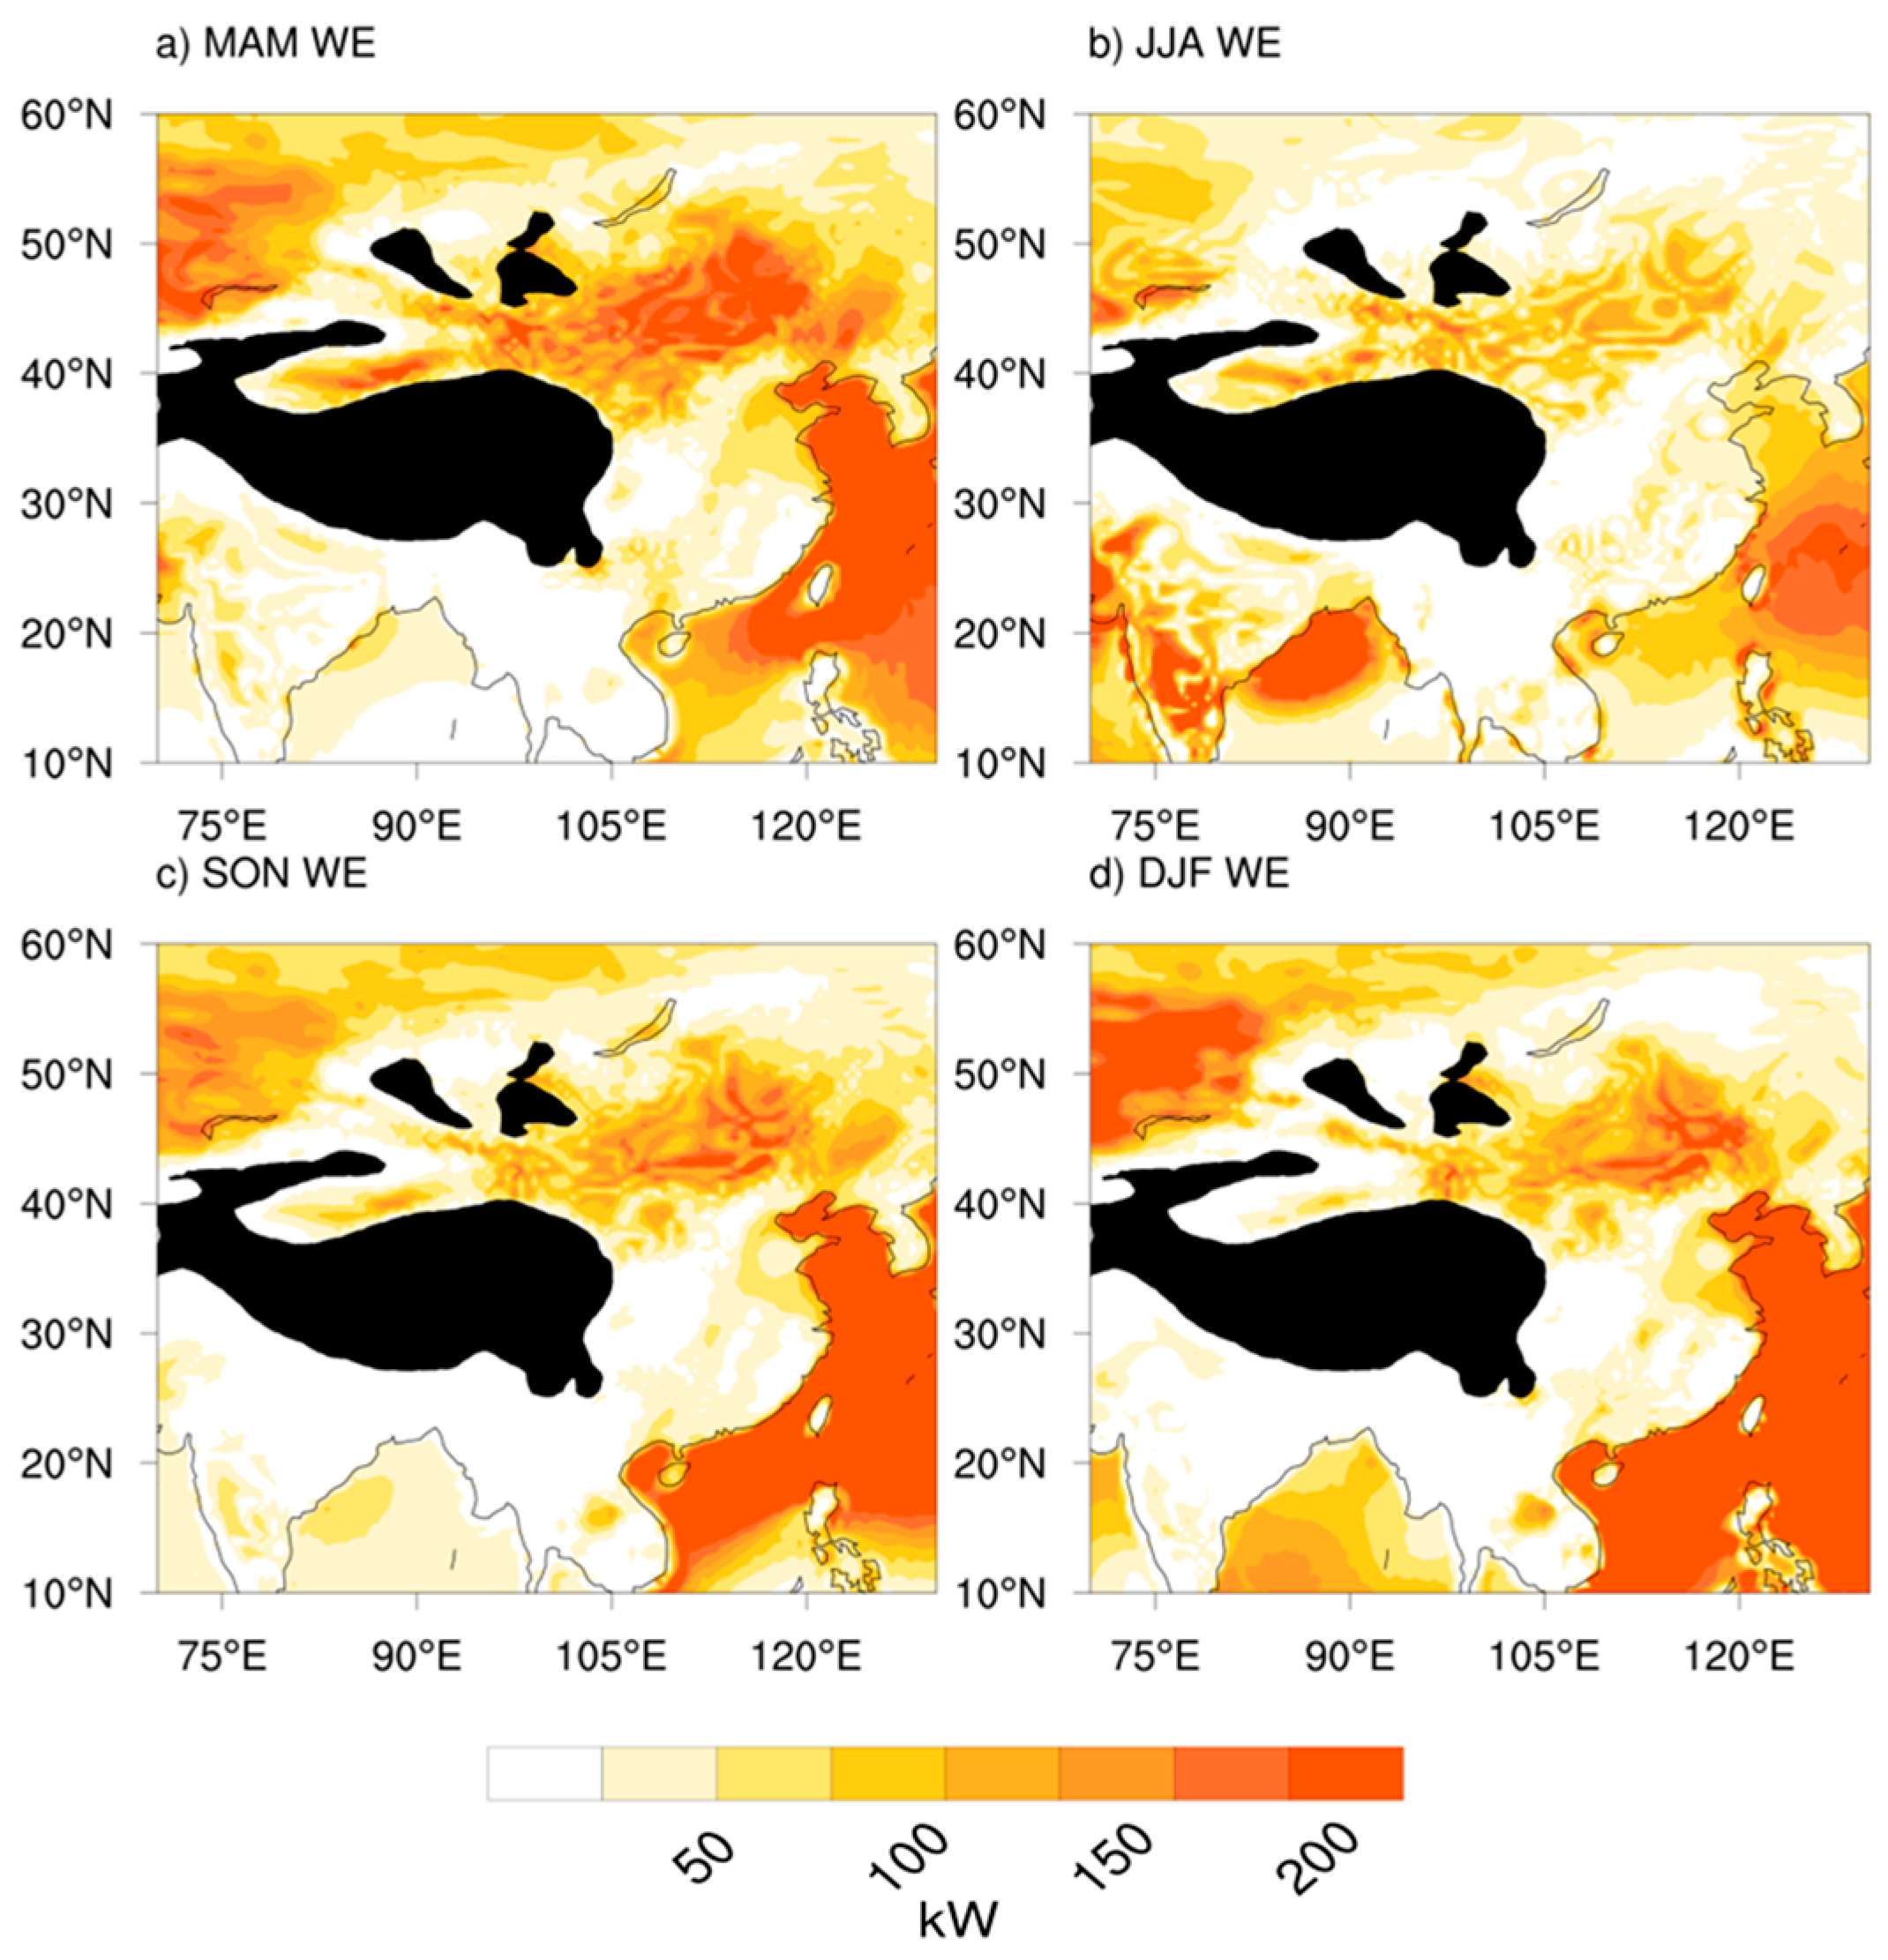
The mean seasonal wind power in kW was estimated for the entire study area and ranged from 50 kW to about 200 kW, with similar trends to what was obtained in the wind climatology, as seen in
Figure 4. Since wind speed contributes the most to wind power, it follows that total wind power output should vary directly with the wind speed observed over the study area. Wind power is at its peak throughout the study area in DJF, with the eastern parts of China around the coast of the East China Sea with values in excess of 160 kW. Wind energy is lowest in JJA, indicating lower mean wind speed in the study area, as compared to winter. A strengthening pattern is observed from JJA (
Figure 4b) through SON (
Figure 4c) to DJF (
Figure 4d), before peaking in MAM (
Figure 4a). This suggests that despite slightly stronger wind vectors and wind speed climatology observed in DJF during the wind vector assessment, temporal variability may affect the amount of wind energy that can be harnessed per unit time.
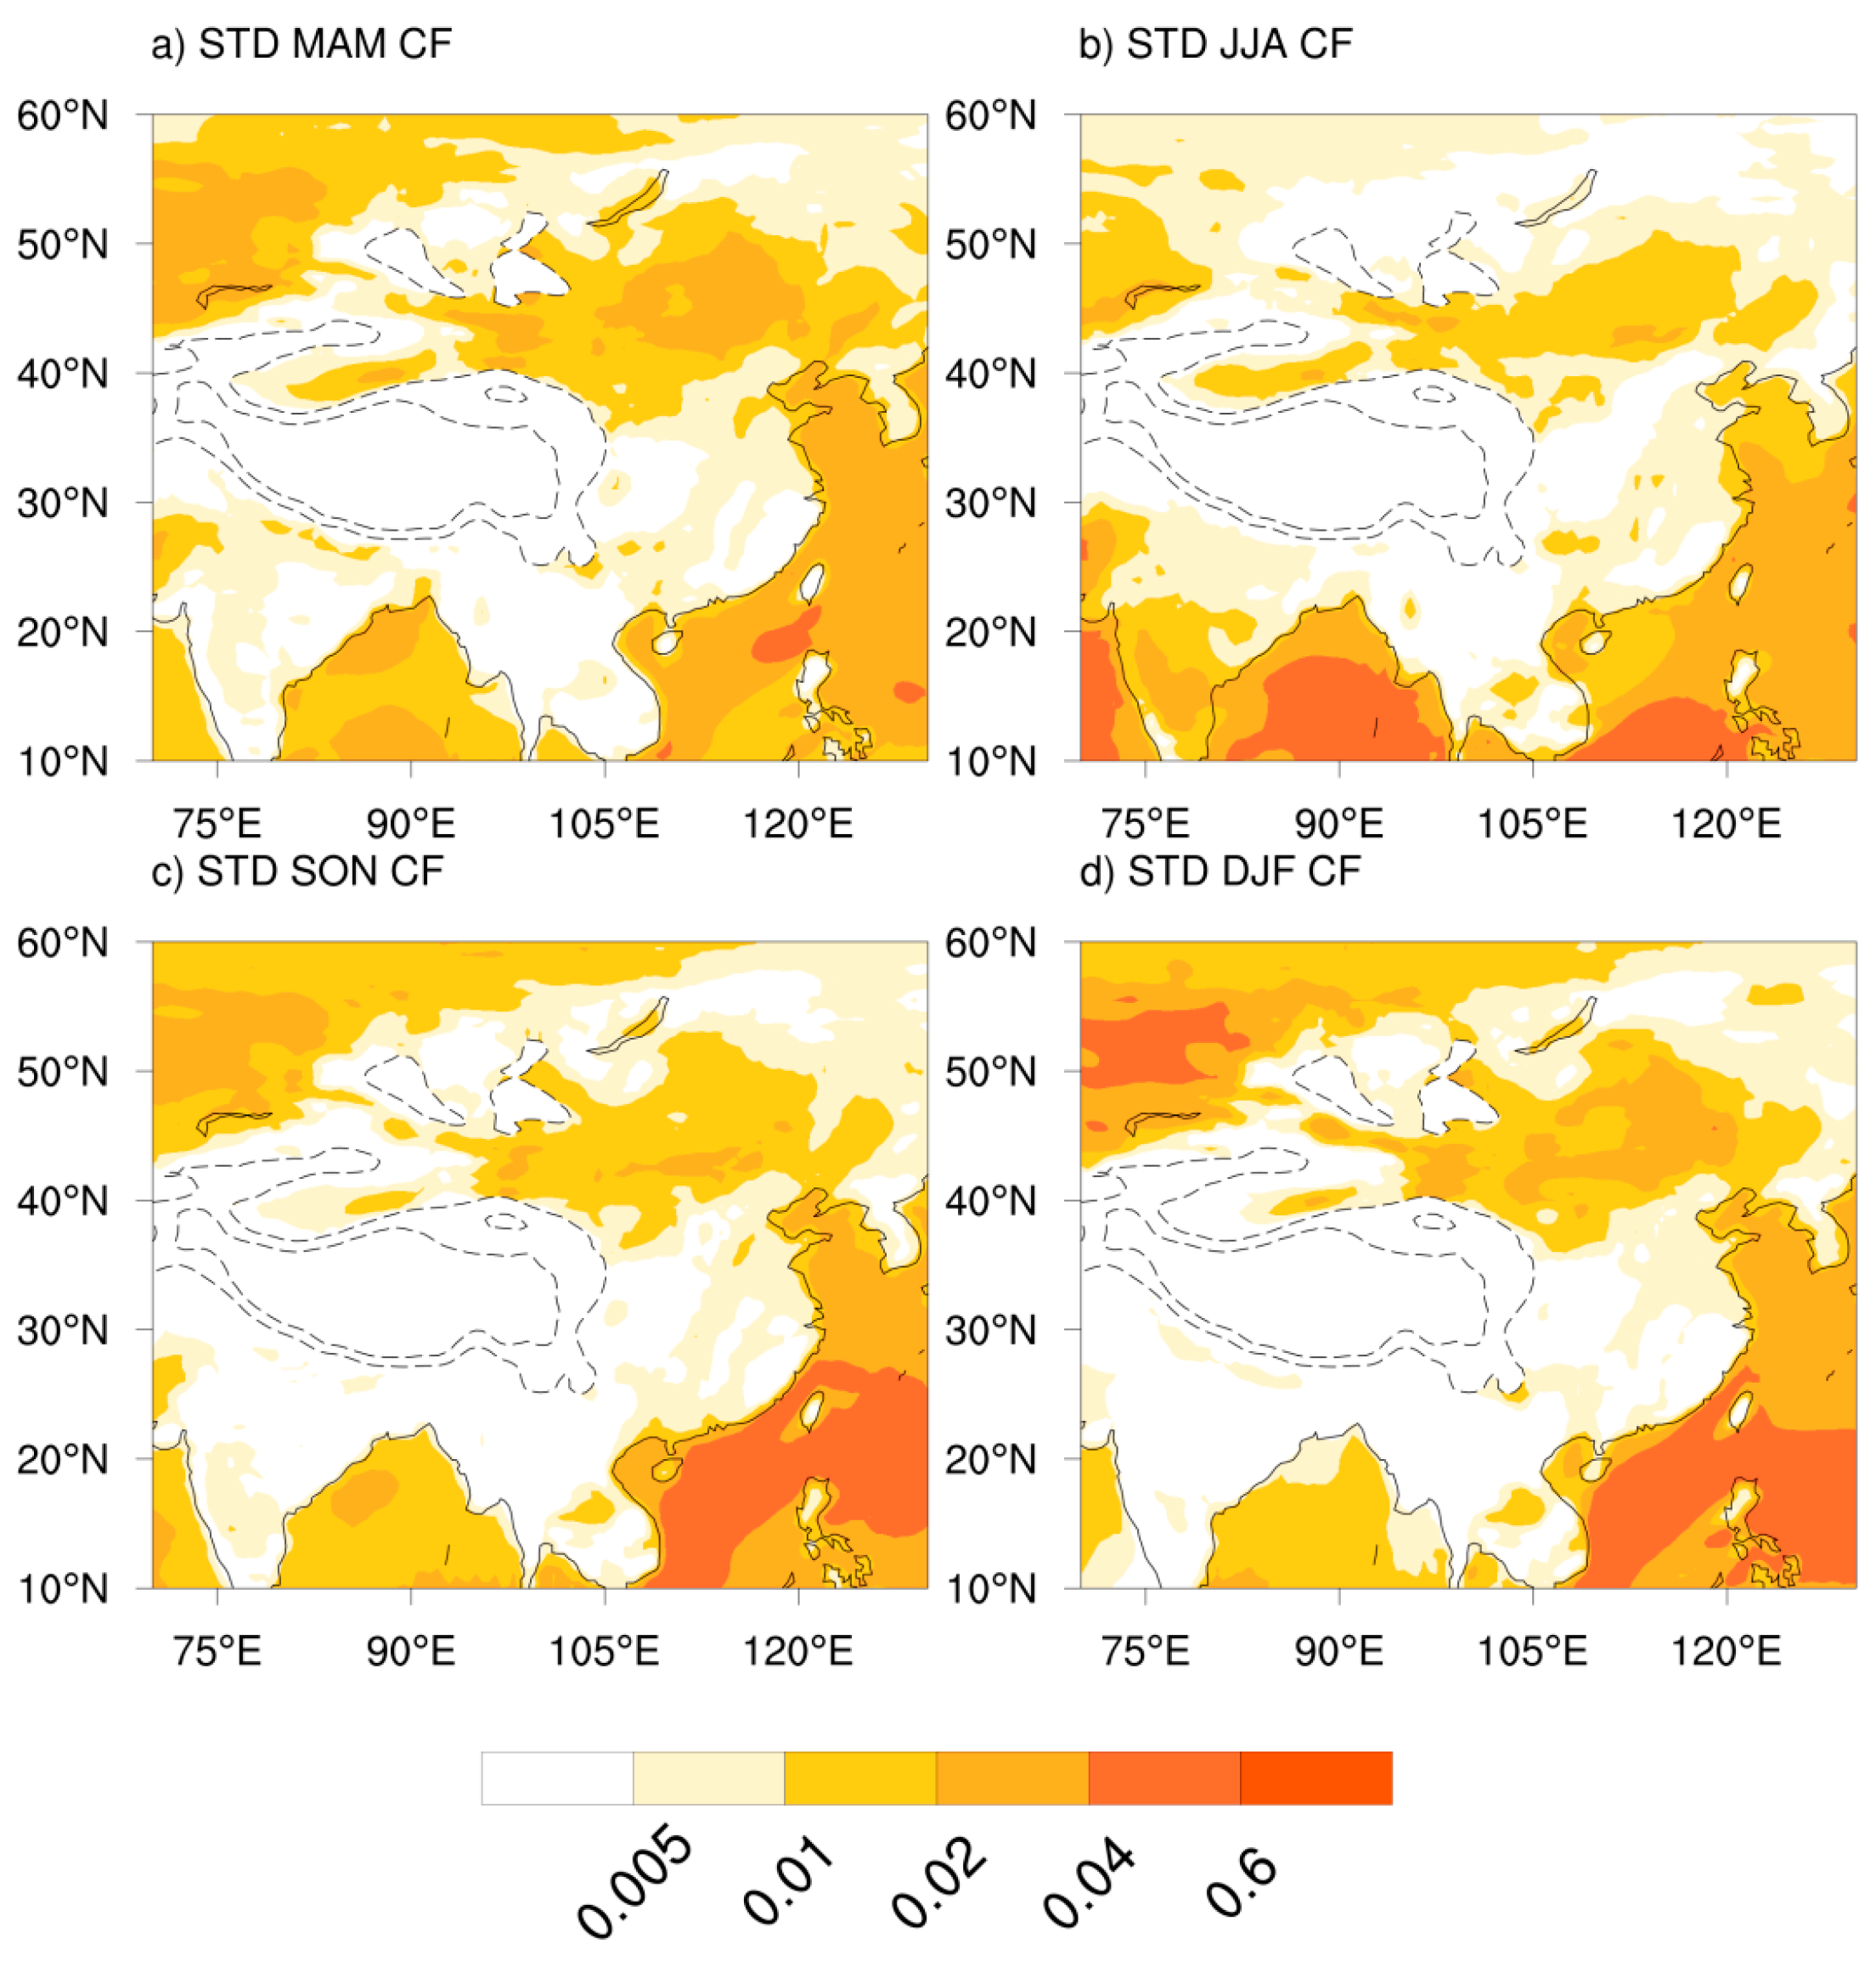
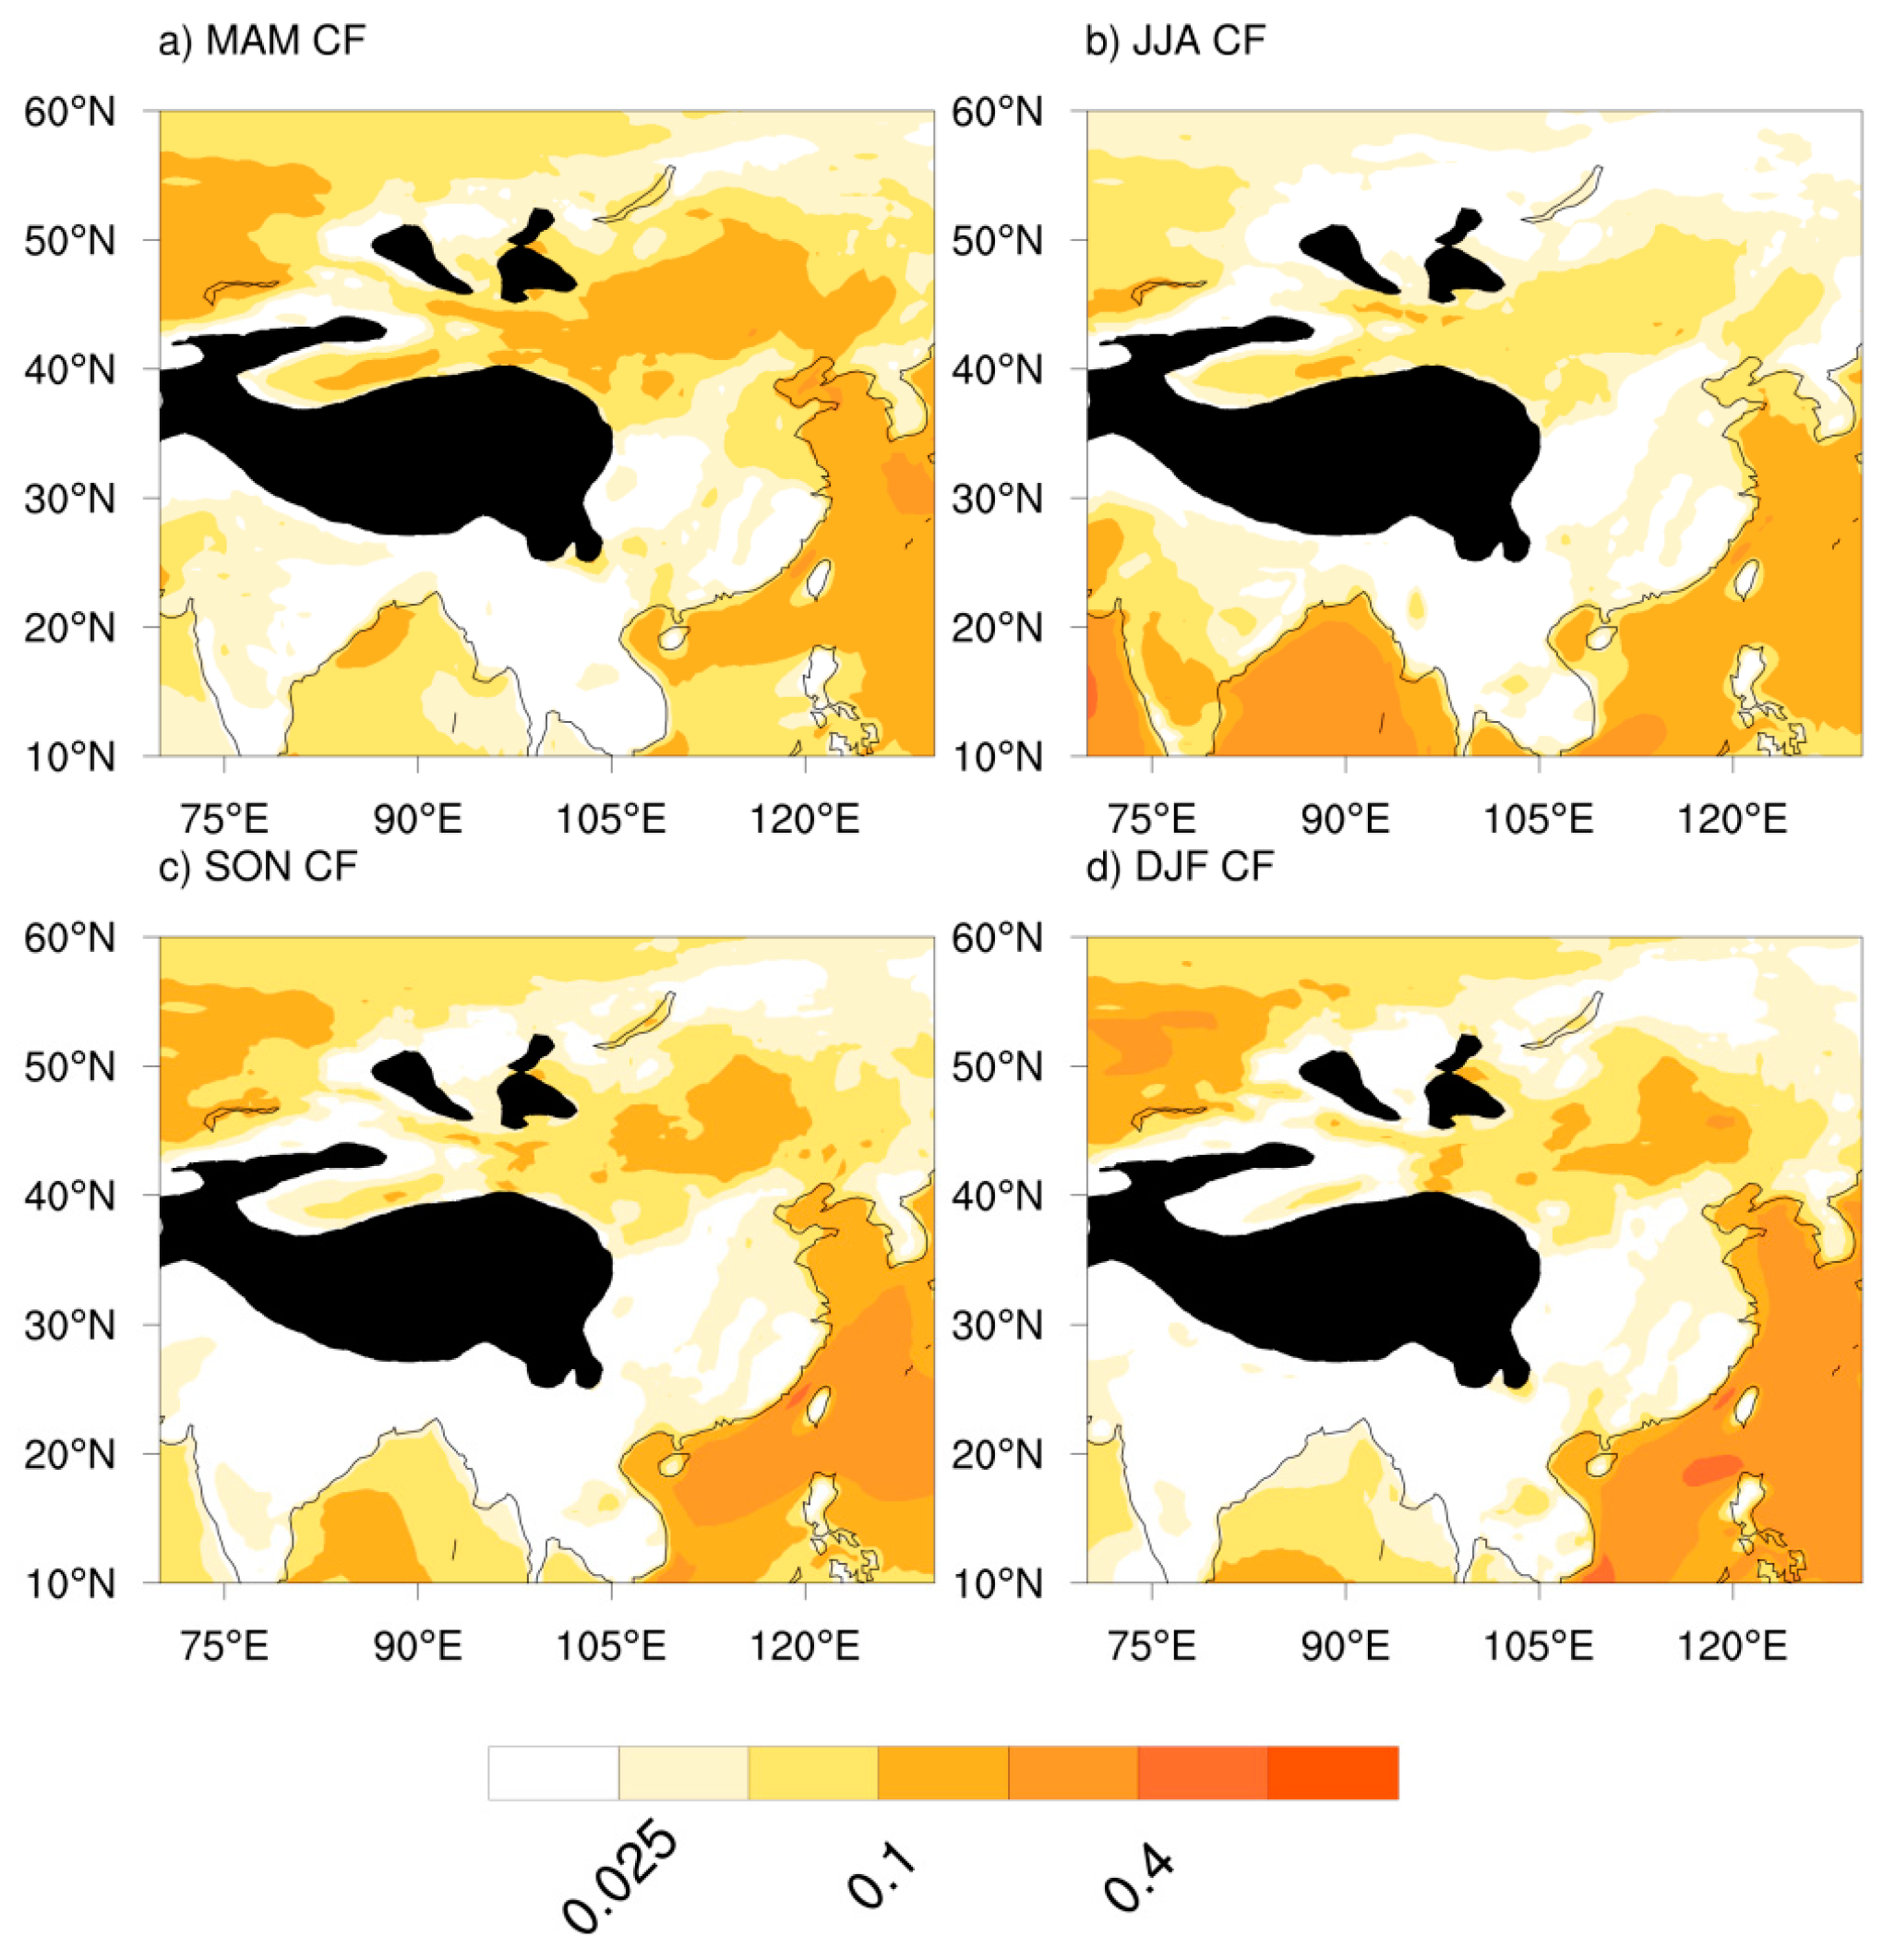
To fully explore this distribution, seasonal mean wind speed was transformed to a capacity factor, as shown in
Figure 5. As highlighted earlier, the capacity factor gives an indication of the extent of utilization of a wind turbine, especially since a lot of power can be generated at the rated speed, but variable wind speeds pose a challenge. Regions of higher capacity factor indicate areas of higher utilization and also point out possible areas of larger investment in wind power development. Capacity factor ranges between 0 and 1 for corresponding wind speeds between the cut-in speed and the rated speed. Usually, these values depend on the particular turbine specifications and power rating. Capacity factors in the range of 0.2–0.5 are not uncommon in various wind power studies, due to the highly varied nature of wind vectors on various timescales. While it is most common to experience low wind speeds for a protracted period, higher wind speeds generally last for shorter periods and may come in gusts at particular locations over varied intervals [
2,
35,
36].
The capacity factor ranges for this study region agree with the results obtained in surveyed studies. On the seasonal timescale, the capacity factor in MAM (see
Figure 5a) averages about 0.2 and is more uniformly distributed over the study area. JJA in
Figure 5b has a more diffuse pattern, stronger offshore from the southwest around the BoB (about 0.35) and in the East China Sea and its environs (about 0.2); however, inland values are much lower, almost exhibiting values less than 0.1. From
Figure 5c, in SON, the capacity factor decreases considerably, especially in the southwest, corresponding to the major switch of wind vectors, with the eastern and southeastern region increasing to almost 0.3, while increasing in the north. The maximum capacity factor is recorded offshore around the East China Sea in DJF (
Figure 5d) nearing 0.4, and it is also strong in North East Asia, although the values drop as we go inland, and this effect is quite pronounced relative to MAM, which has better inland values.
The capacity factor shown in
Figure 6 varied considerably more during the summer season than the winter season, especially in the BoB region. This may directly imply less variation of wind speed in winter than in summer for this environ. The case is reversed, however, for the SCS and its environ, where a higher standard deviation is observed during winter. This reversal may be explained by the strengthening of wind vectors during the monsoon and transition seasons. All in all, the nature of the variability of wind speed and how it affects the wind power is expressed here, although further insight can be gained by exploring the wind speed distribution frequency plots using individual domains.
3.3. Wind Speed Distribution and Its Variability
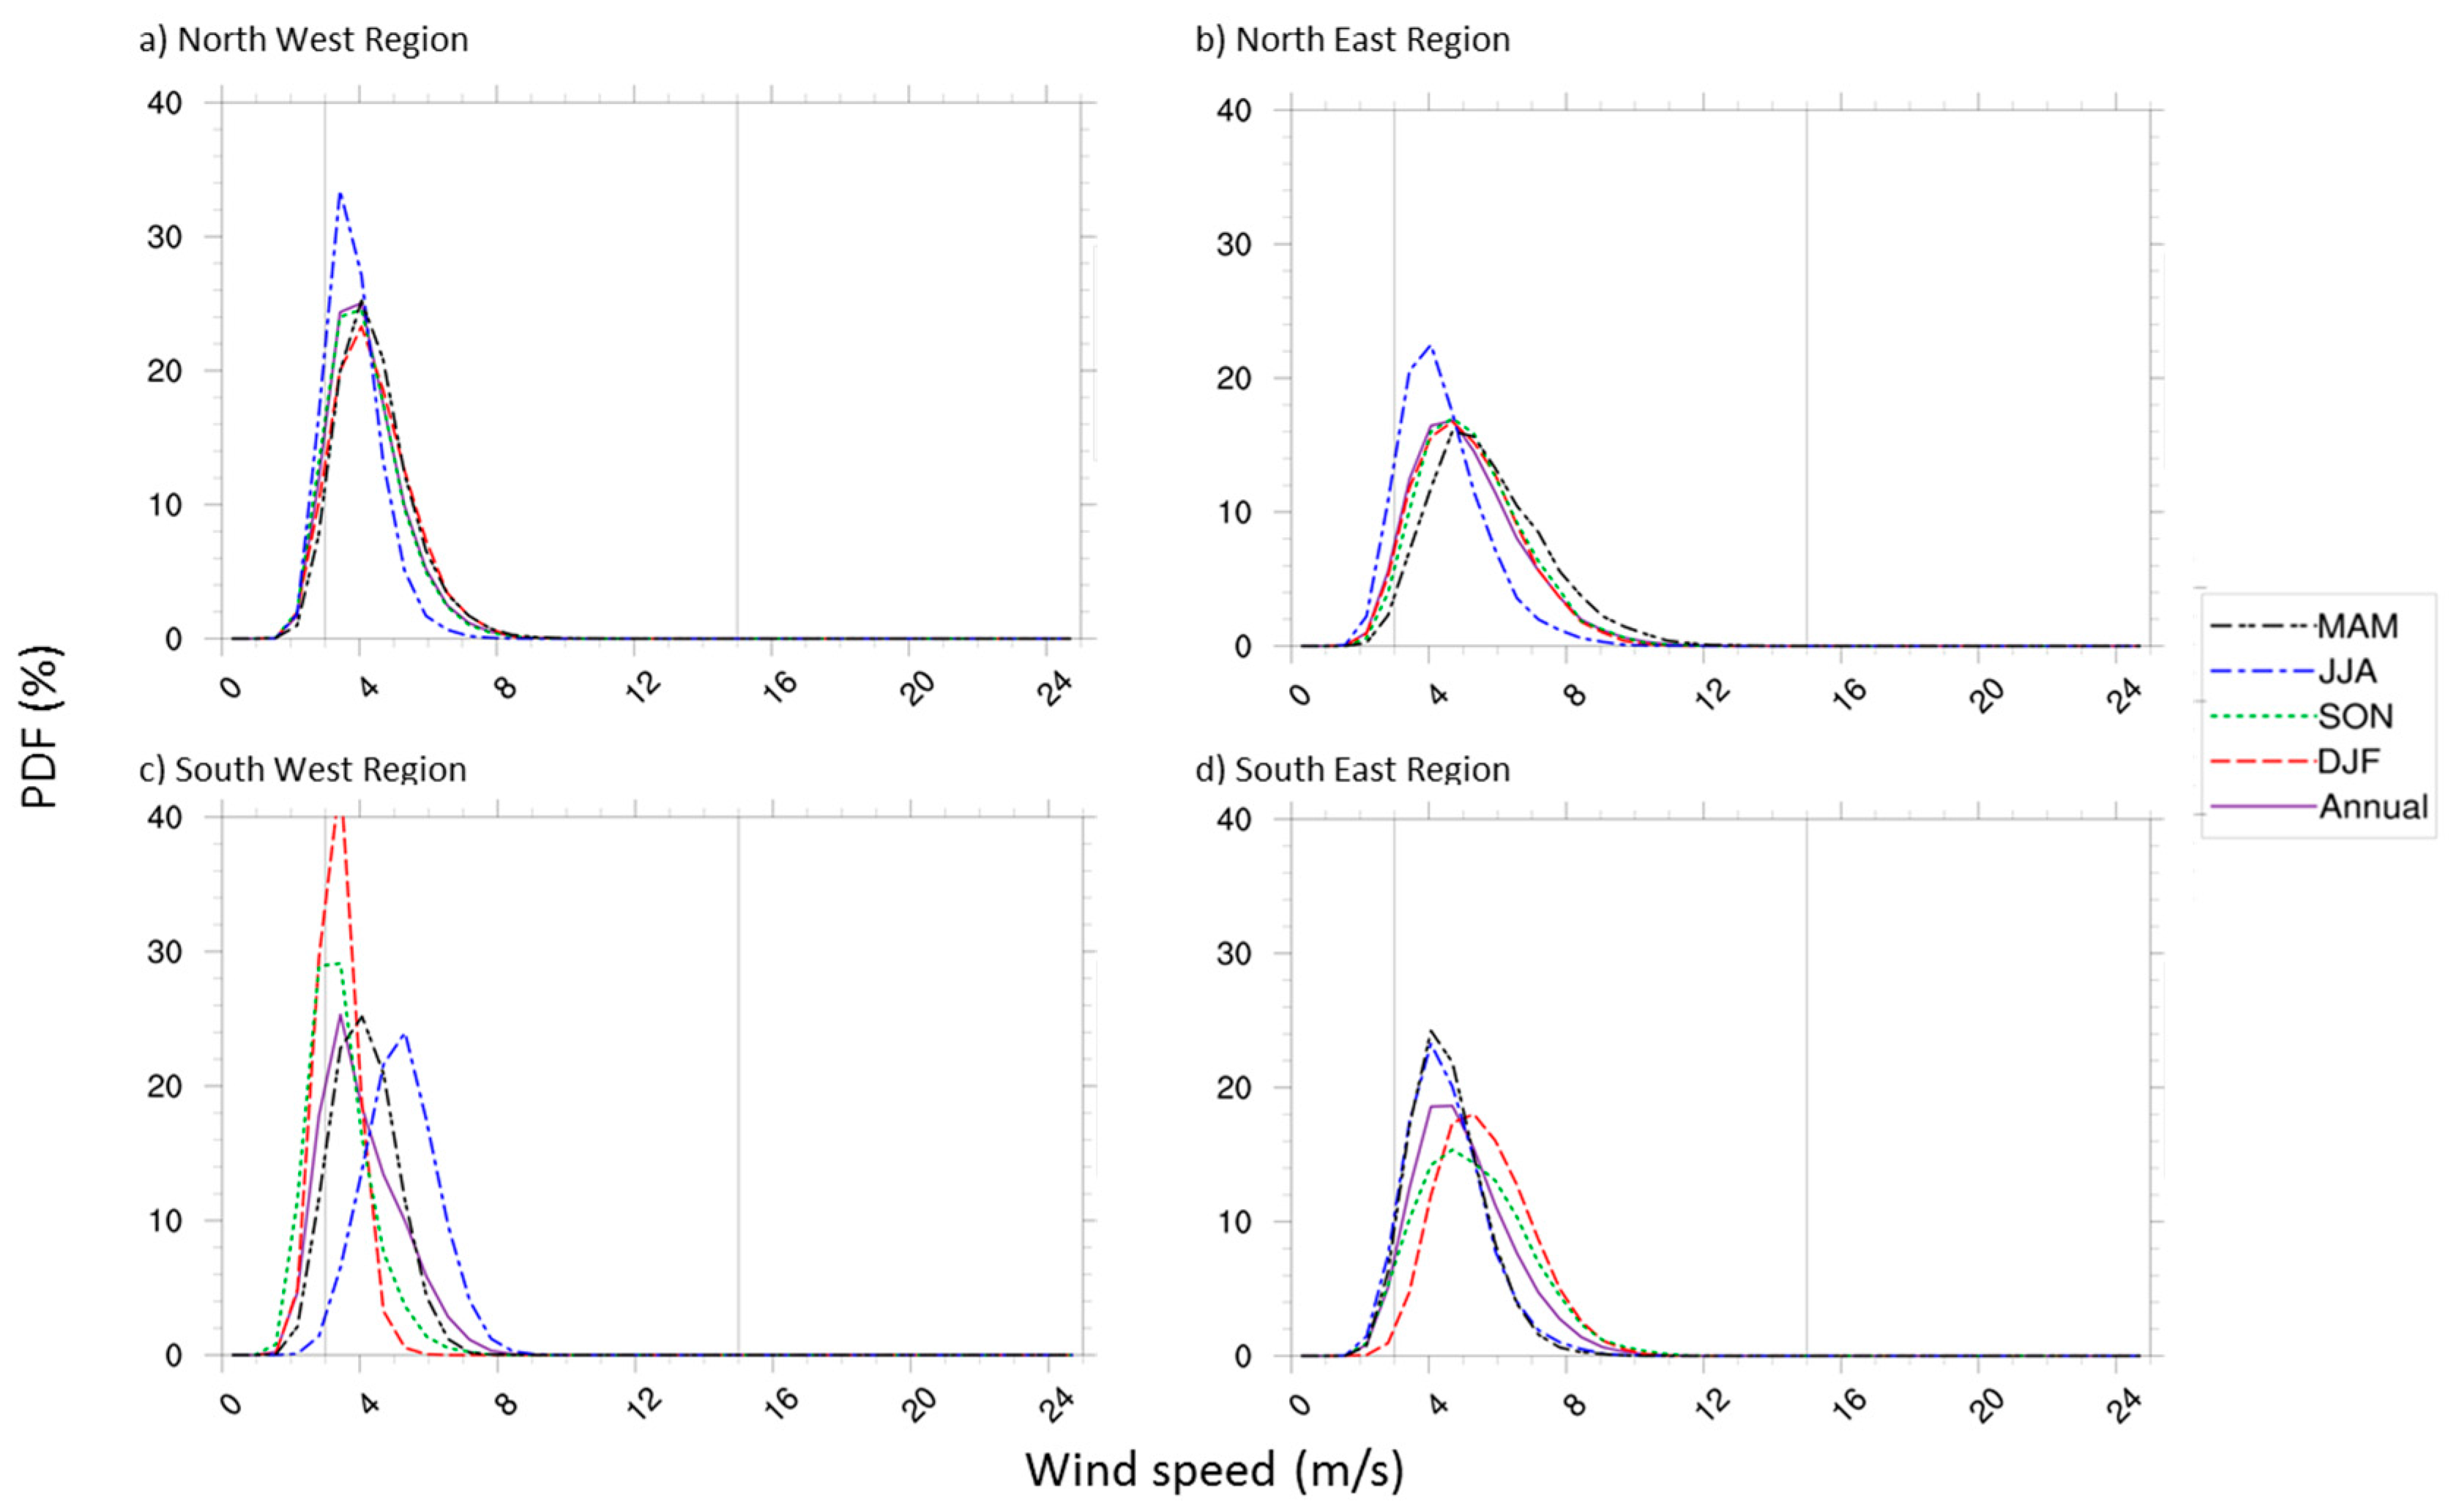
Wind speed distribution over the study area was also examined seasonally and annually by using the probability density function (PDF). Higher average wind speeds are observed in the North East and South East (coastal) regions. The most probable wind speed was obtained in JJA for all regions except the South West, where DJF had the most occurring wind speed. The North West and South West regions had slightly higher probabilities to experience wind speed greater than 4 m/s than both the North East and South East regions, although the latter had more occurrences of higher wind speeds for all seasons, as seen in
Figure 7a,c. The steeper curves for DJF in the South West region mean that the most probable wind speed in the region is considerably low and hence may not generate as much power compared to the North East, which has a gentler slope and thus more chances of higher wind speeds. The South East region as seen in
Figure 7d, however, has the least deviation between seasonal averages, suggesting that wind power in this region would be the maximum. Based on these plots, DJF (SON) wind speed of about 3 m/s had a probability of 40% (35%) in the South West region while for JJA, the value increased to about 5.5 m/s with a 30% probability.
The trend was reversed in the North West with slightly lower probabilities. The South East region, on the other hand, has a maximum probability of about 25% and 24% in JJA and MAM, equivalent to 4 m/s and 4.4 m/s, respectively. The relatively higher wind speeds over the South East can be linked to the inclusion of the South China Sea and modulation of sea breezes into the surrounding landmass. The curve for DJF is slightly skewed to the right, implying higher wind speeds in this season relative to others. It is therefore probable from the above that, depending on the region considered, MAM wind power might sometimes exceed that of DJF, or vice-versa. Faced with this possibility, seasonal contribution to annual wind power over the 35-year period is thus subsequently examined and discussed.
3.4. Annual Variation of Seasonal Wind Power
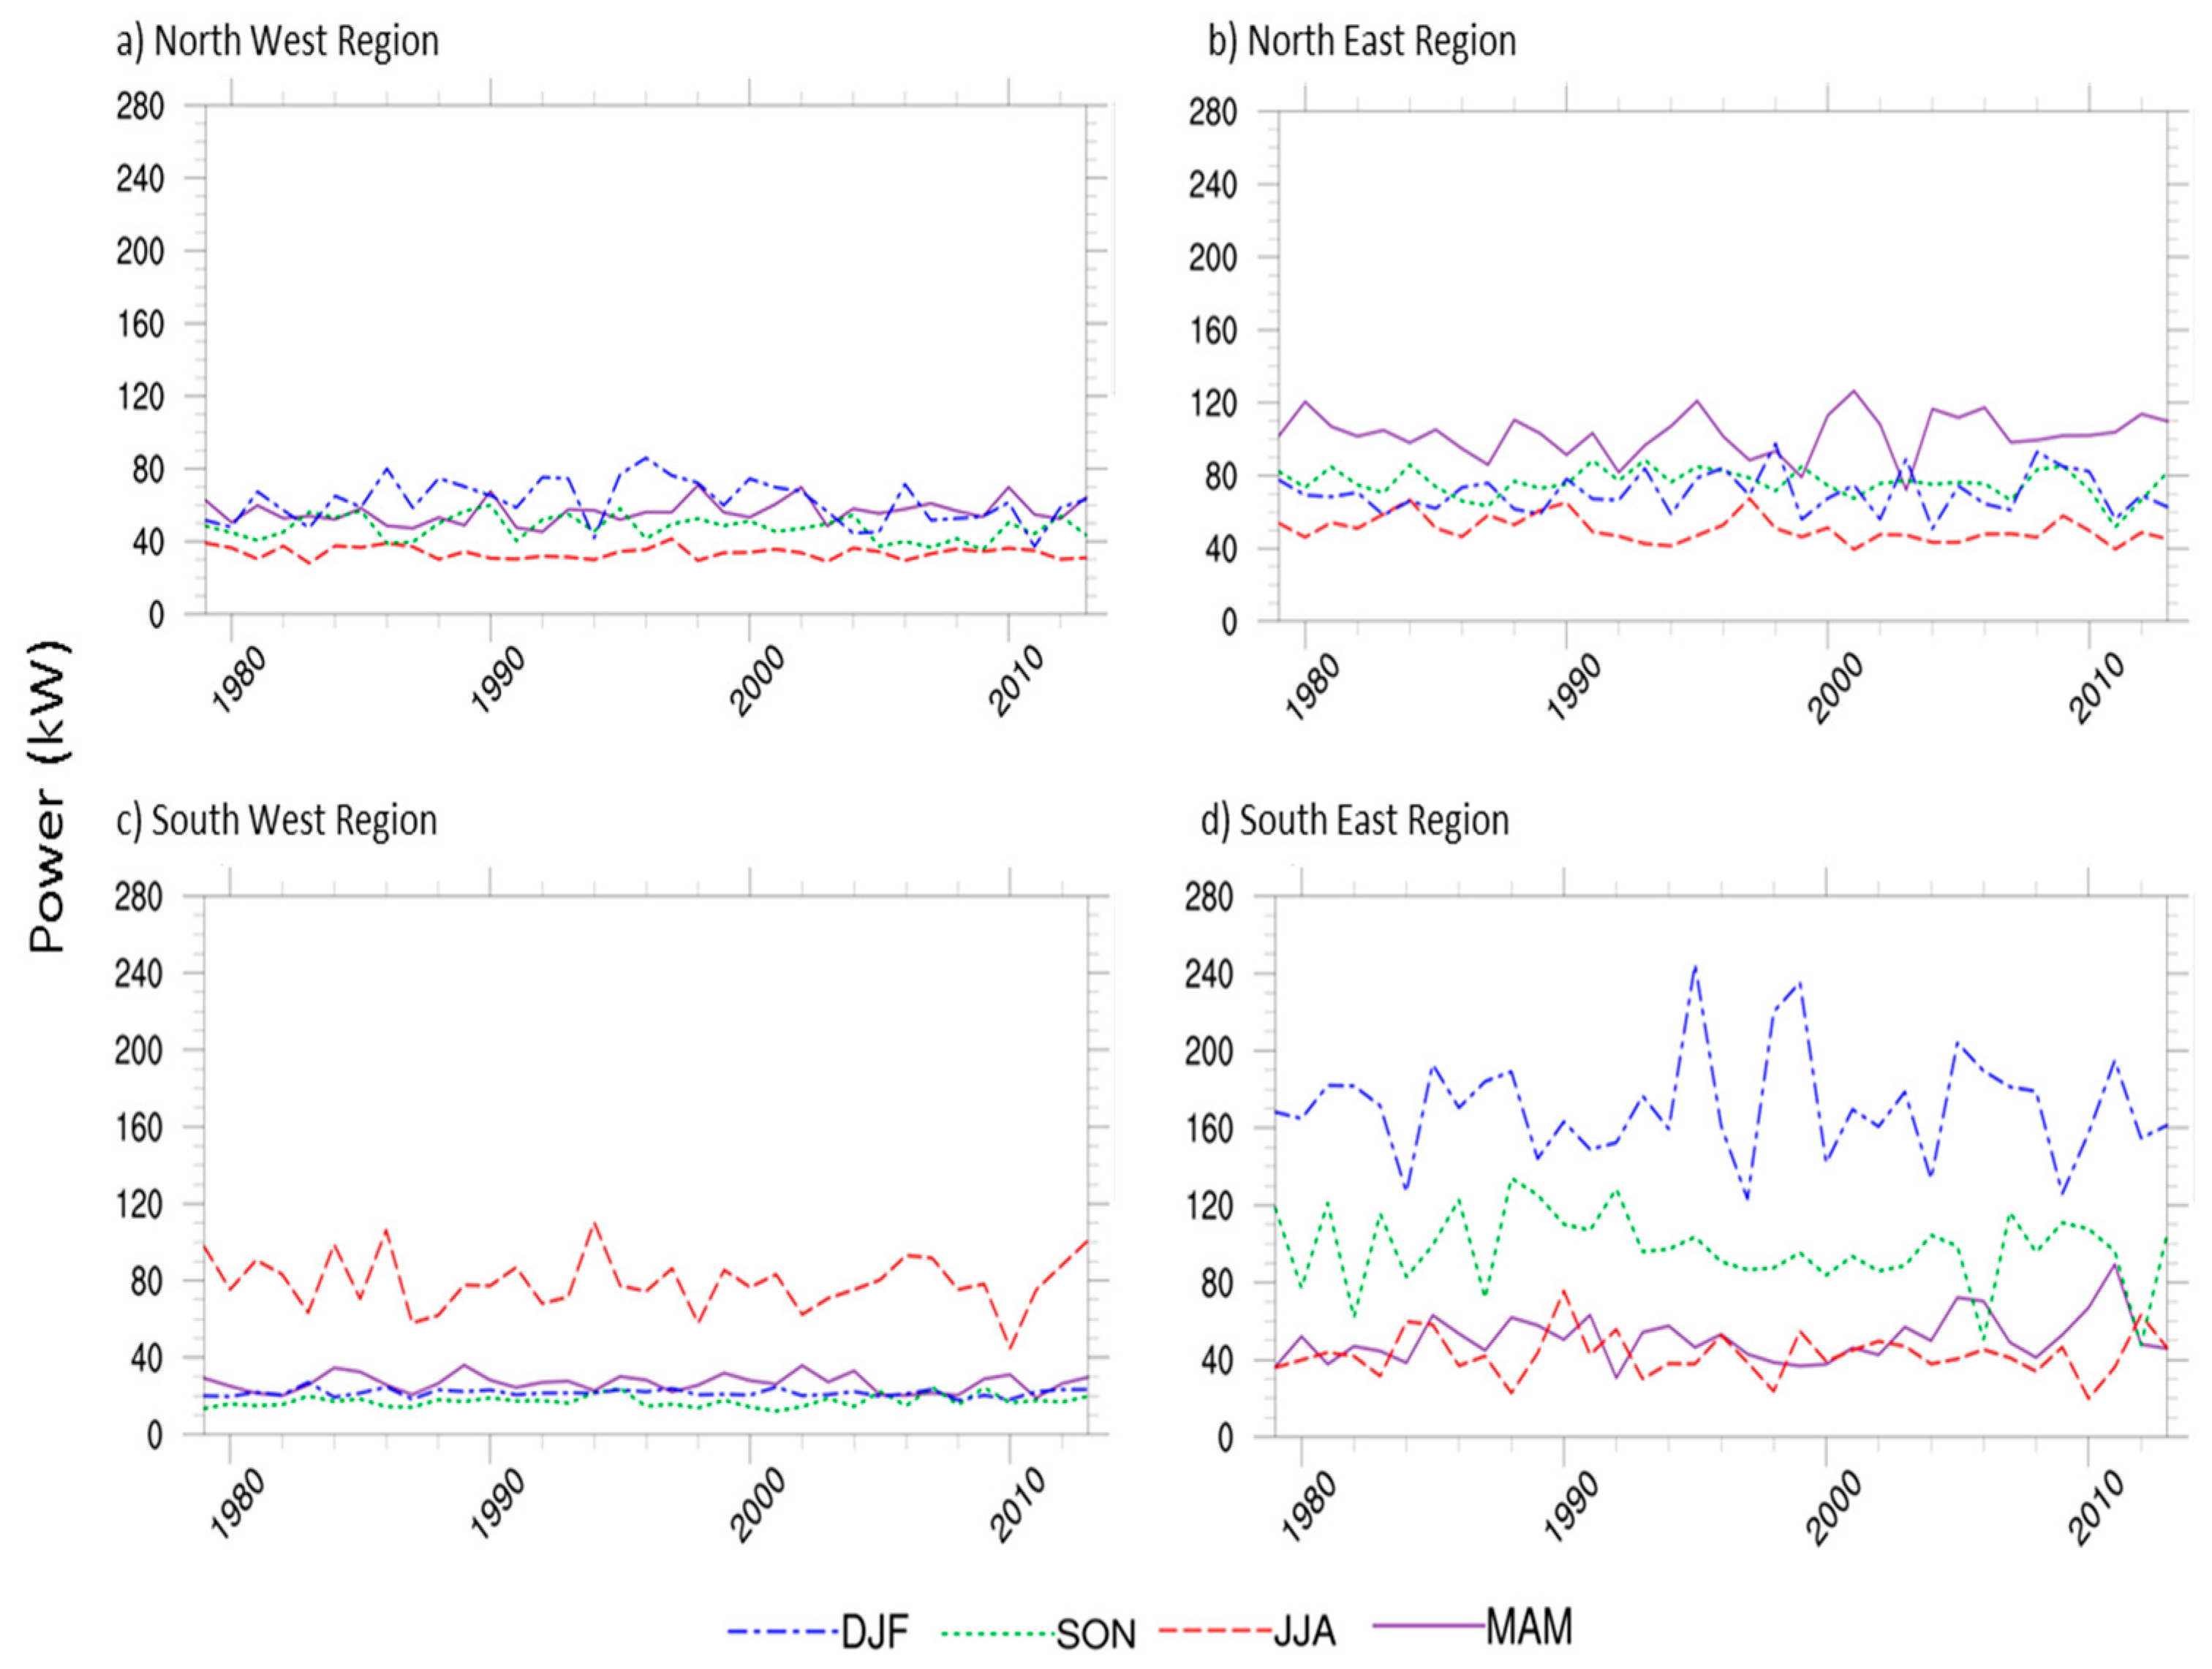
The wind power annual variation for each region is shown in
Figure 8. Power peaked in the winter of 1996 at about 86 kW, while it was lowest in 2011 over the North West region for DJF, according to
Figure 8a. Variability appeared to be higher in DJF but lowest in JJA, with a range of about 40 kW and 12 kW, respectively. For the time period considered, JJA wind power was never greater than DJF wind power for this region, while MAM and SON were considerably closer in the early years before a further deviation around 2004 onward. Wind power is slightly greater in the North East with a peak value of 120 kW during MAM, as illustrated in
Figure 8b. Unlike in the previously discussed season, wind power during MAM was highest for the entire period considered, while JJA was again the lowest in terms of contribution. A high range of about 50 kW also suggests that relatively higher wind speeds and thus more variability in MAM than in DJF, in line with the conclusions obtained from the PDFs. These higher wind speeds translated to more wind power. The contributions of the SON and DJF seasons were also relatively close to each other for the study duration, as seen in
Figure 8c. An interesting observation is that for these two regions, DJF and SON dipped in year 2011. The trend is reversed in the South West, as JJA had peak wind power of about 110 kW in 1994 and remained the highest contributor to annual wind power throughout the study duration. SON was the lowest contributor, behind DJF and MAM, while also showing the least variability for the duration considered. The contributions of DJF and MAM are close in this case as well, creating a similar pattern to the previous regions seasonal contribution structure. As inferred from the probability density plots, wind power was highest in the South East (coastal) region with DJF clearly being the highest contributor, as shown in
Figure 8d. Wind power peaked at about 240 kW in 1995 and was lowest in 1997 at about 130 kW. The pattern for this region differed considerably from the others, as MAM and DJF were the lowest contributors of about the same values intermittently. The variability in contribution also appeared relatively lower until around 2004. SON contribution was higher, averaging about 90 kW per year, which is about the peak value recorded in the North West region.
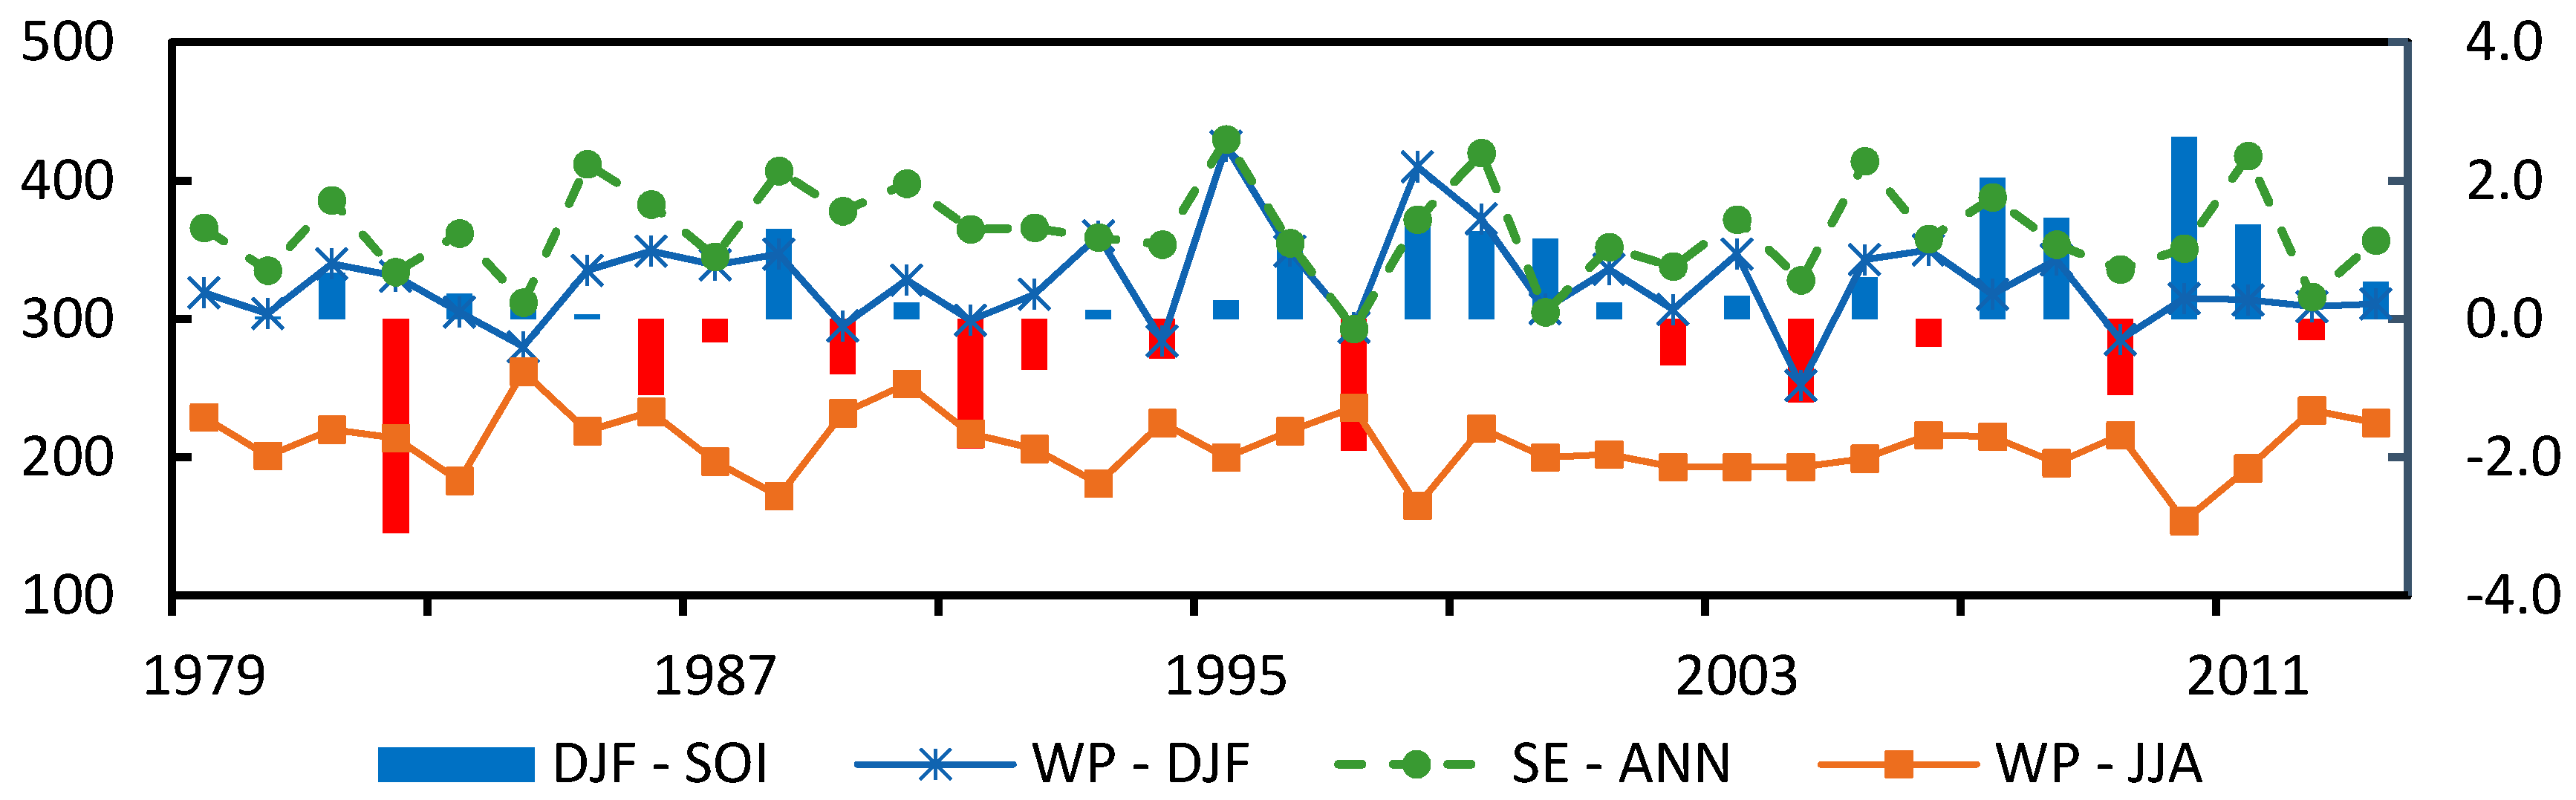
Preliminary studies show a relatively low correlation with the Southern Oscillation Index (SOI), thus, a detailed study of this annual variability and its relationship to major teleconnection indices is motivation for future studies. Notwithstanding, there is a significant positive correlation between DJF SOI and MAM wind power in the North West region and DJF wind power in the SE region, while it is negative for DJF SOI and JJA wind power. In the case of JJA SOI, the correlation is positive and significant for the South East region SON wind power and North West region MAM wind power. For the whole domain, the correlation is significant and positive between DJF SOI and DJF wind power, but negative for JJA wind power, with the reverse case occurring for the JJA SOI. Annual wind power and both JJA SOI and DJF SOI are positively correlated in the South East region only. The results for DJF SOI are shown in
Figure 9.
In terms of trend, an anti-correlation is observed between the South East and South West for winter and summer seasons, respectively. Power production is highest in the South West during summer but lowest during winter in the South East. This anti-correlation would impact on wind power supply, but it provides good opportunities to combine power resources. In terms of magnitude, wind power could be reduced by 50% or more from region to region depending on the season considered, and this has huge implications for energy-mix discussions and renewables optimization. Influenced more considerably by prevailing direction of the East Asian Monsoon, wind power on average reduced by up to 25% in SON, 30% in MAM, and 37% in JJA, using DJF values as base reference.
3.5. Impact on Wind Energy Optimization
Effectively, seasonal variations in the capacity factor imply that the amount of energy harnessed from the wind would likewise vary seasonally. A wider variance in values would thus affect the design and development of hybrid power generation systems if energy demand is to be met. This suggests that much care must go into designing these plants, since the conventional variation of wind vectors cannot be perfectly estimated or replicated. Consequently, it is expected that demand net wind (DNW, which is the energy demand that must be supplied by non-wind sources to maintain the demand–supply equilibrium) would vary seasonally over the entire study domain with lower values expected in winter and higher values expected in summer because of seasonal variation in the wind vectors. Thus, designing and operating a plant which can accommodate fluctuations in DNW is essential for optimizing the potential offered by wind.
On a regional scale, wind power has the greatest potential in the South East region. The relatively stronger wind vector and characteristics obtained in this region arise as a direct influence of the South China Sea. For interconnection on large-scale wind farms, a link between the South East and the South West may likely produce a more stable pattern of DNW, as the shortfall of JJA power in South East would be augmented by the peak of JJA power in the South West, and vice-versa. The findings from the regional assessments also show that higher values of DNW can be expected during summer for all regions except the South West, whose maximum power output is observed in summer.
These results agree with the conclusions of Yeh et al. [
34], that the cooling effect of the Asiatic continent produces higher wind speeds in winter, while its heating effect results in relatively lower wind speeds during summer. This relationship would help in the design and operation of hybrid energy plants and electricity grids by energy sector players, while also guiding policy-makers in decision-making towards optimizing wind energy output. More importantly, in the near future, a “demand–supply” trade-off could also be implemented where energy demand for both cooling during summer and heating during winter could be supplied via wind sources.


