Article

Characteristics of Ultrafine Particles and Their Relationships with Meteorological Factors and Trace Gases in Wuhan, Central China

1
State Key Laboratory of Information Engineering in Surveying, Mapping and Remote Sensing, Wuhan University, Wuhan 430079, China
2
College Information Science and Engineering, Wuchang Shouyi University, Wuhan 430064, China
3
Collaborative Innovation Center for Geospatial Technology, Wuhan 430079, China
4
School of Public Health, Wuhan University, 115# Donghu Road, Wuhan 430071, China
5
School of Information Management, Central China Normal University, Wuhan 430079, China
6
Land and Resources Technical Center of Guangdong Province, Guangzhou 510075, China
*
Author to whom correspondence should be addressed.
Atmosphere 2016, 7(8), 96; https://doi.org/10.3390/atmos7080096
Submission received: 13 June 2016 / Revised: 13 July 2016 / Accepted: 18 July 2016 / Published: 23 July 2016
(This article belongs to the Special Issue Ultrafine Particles: Determination, Behavior and Human Health Effects)

Abstract

:
Ultrafine particles with a diameter below 1 μm are strongly linked to traffic and industrial emissions, causing a growing global health concern. In order to reveal the characteristics of ultrafine particles in central China, which makes up the sparse research in industrial cities of a developing country, particle number concentrations (PNC) together with meteorological parameters and concentrations of trace gases were measured over one year in Wuhan. The number concentration of ultrafine particles peaked in winter and was the lowest in summer across the entire size range monitored. Further, particles with a diameter smaller than 30 nm increased dramatically in concentration with decreasing diameter. The monthly averaged number concentrations of particles discriminated in three size ranges formed a near- inverse parabolic distribution peaking in January. This trend is supported by a negative correlation between PNC and precipitation, temperature, and mixing layer height, which emphasizes the effect of these meteorological parameters on scouring, convection, and diffusion of particles. However, since wind not only disperses particulate matter but also brings in exogenous particles, wind speed plays an equivocal role in particle number concentrations. The diurnal analysis indicates that hourly measurements of trace gases concentrations could be used as a proxy for dense industrial activities and to reveal some complex chemical reactions. The results of this study offer reasonable estimations of particle impacts and provide references for policymaking of emission control in the industrial cities of developing countries.

1. Introduction

Particulate matter plays a crucial role in climate change, directly and indirectly [1,2], affecting cloud formation [3], visibility [4,5] and precipitation [6], as well as the radiation budget [7]. Particulate matter in the air may endanger human health, causing lung inflammatory reactions and cardiovascular problems in the short term, and reduction of life expectancy in the long term [8,9,10]. However, current situation is that more megacities keep being built up and air quality problems emerge frequently in central China.
Several regional studies have published size distribution and number concentrations of aerosol particles in North America [11,12,13], Europe [14,15,16] and many parts of China, including the Pearl River Delta region, the Yangtze River Delta region and northwestern China [17,18,19], revealing intrinsic characteristics of the different areas. For instance, the particle number concentrations and size distribution decrease with increasing distance from a freeway [20]. A study carried out in London, England, pointed out that wind and rain significantly affect PNC [21]. New particle formation events also influence PNC significantly [11,13,14]. Meanwhile, despite a few common characteristics, particle number concentrations and size distribution show different modes, varying across areas. In a German urban area, Wehner [22] found a peak mode of PNC at around 15 nm, while it was estimated around 50 nm in an Australian urban area [23]. Some studies found a clear difference between the PNC on weekdays versus weekends [11,23], while Wu [18] did not observe any distinction. These differences suggest that PNC and size distribution partly depend on regional and local factors.
As previously mentioned, most of these studies were conducted in developed countries, or in capital cities of developing countries such as Beijing [18] or Guangzhou [24]. However, the research in Wuhan, a fast-developing city relying on industry development in central China, is still sparse while the city is experiencing a flourish of the steel industry. The present study reports a 1-year analysis of the measurements of number concentrations and size distribution of fine particles. The seasonal and monthly variations of particle number concentrations and size distribution are detailed and tested for correlations with meteorological parameters including precipitation, temperature, mixing layer height and wind speed. Finally, a case analysis of diurnal variations was conducted using air pollutants to explore the key factors affecting the variability of the concentration of fine particles in different modes in Wuhan.

2. Materials and Methods

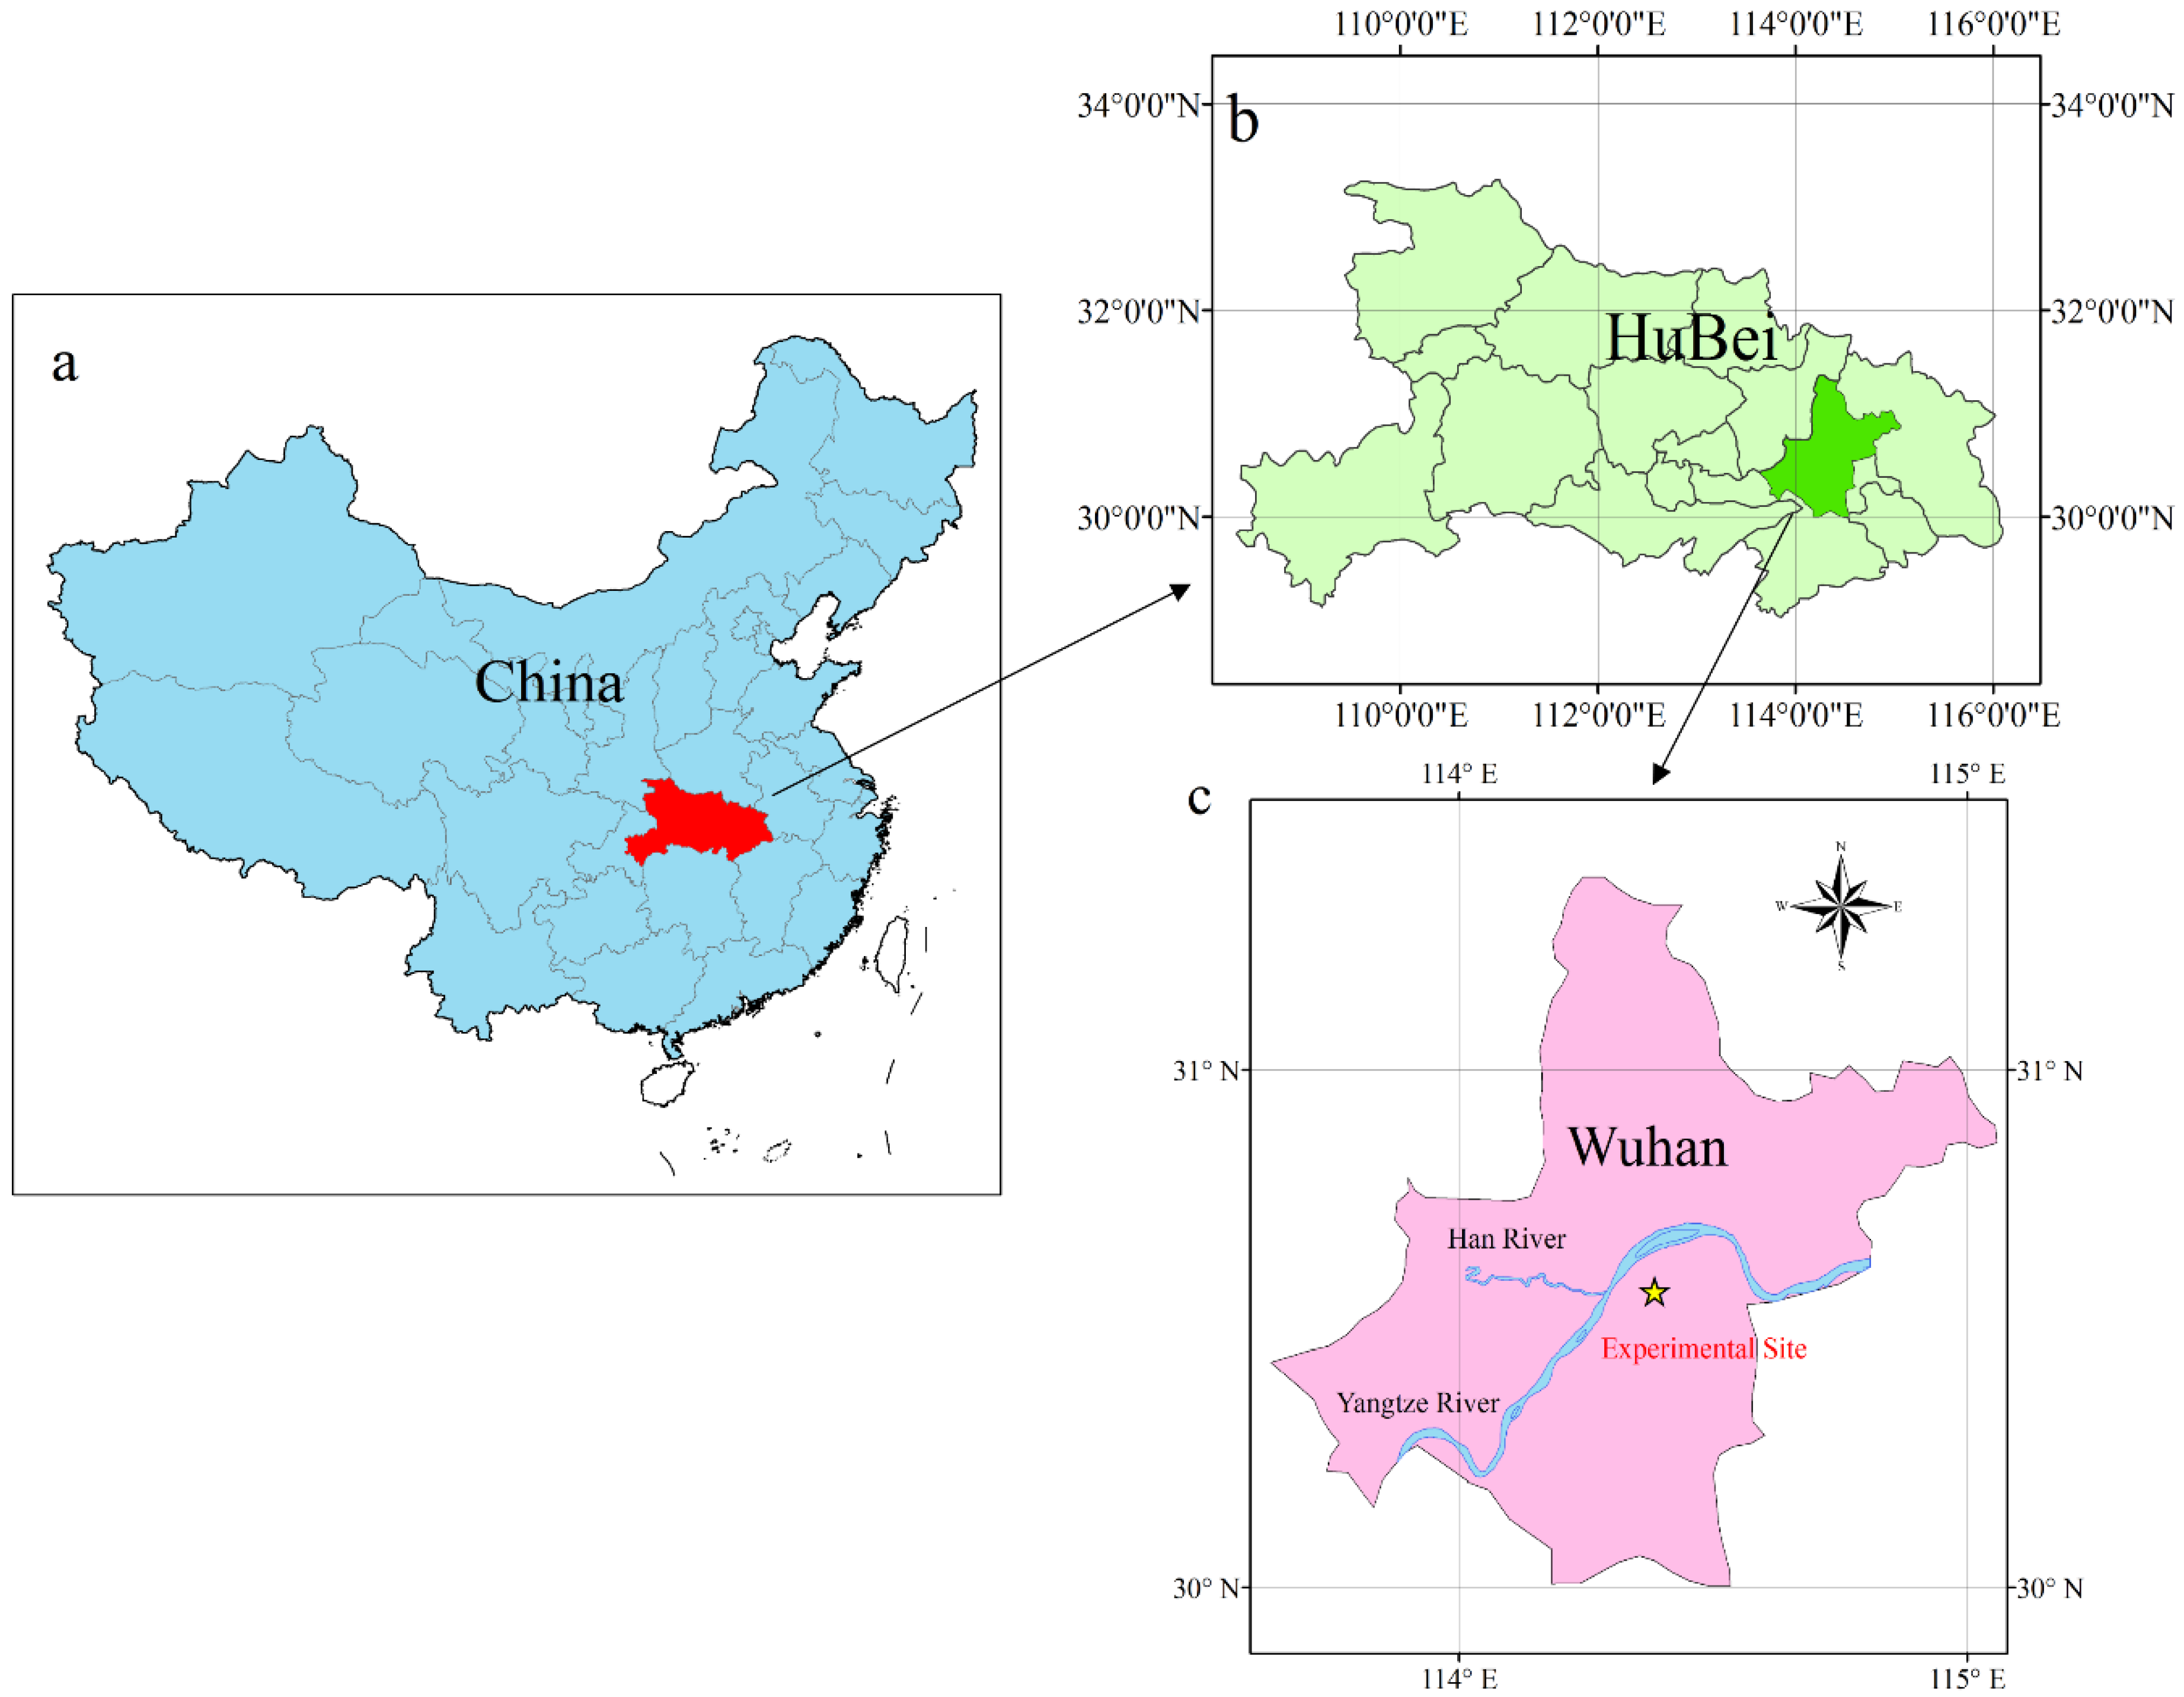
2.1. Site Description

Wuhan, the capital city of Hubei province, is located in central China at the confluence of the Yangtze and Han rivers, with a population exceeding 10 million people. Over the past decades, Wuhan has been experiencing rapid development and it has become a highly industrialized and urbanized mega city in China. Lying in the Middle-Lower Yangtze plains, the city enjoys a subtropical monsoon climate with substantial rainfall in summer and low precipitation in winter. The monitoring site is located on the top floor of the State Key Laboratory of Information Engineering in Surveying, Mapping and Remote Sensing in the Wuhan urban area, which is demonstrated in Figure 1.

2.2. Measurements and Instrumentation

A scanning mobility particle sizer (SMPS, model 3936L75-N, TSI Inc., Shoreview, MN, USA), which detects particles with diameters from 15.1 to 661.2 nm, was used to measure particle size distribution continuously at the study site. The SMPS separates particles based on their electrical mobility and consists of an Electrostatic Classifier (EC, model 3080, TSI Inc., Shoreview, MN, USA) and a Condensation Particle Counter (CPC, model 3775, TSI Inc., Shoreview, MN, USA). The inlet of the measurement instrument was placed about 50 feet above the ground and consisted of a 5-feet long metal tube (0.5-inch internal diameter) with aerosol and sheath flow set to 0.3 and 3.0 L·min−1. A microcomputer system controlled the acquisition and computed the size distribution and number concentrations of the experimental aerosol. The measuring instrument was examined weekly to check for a blocked inlet, for the performance indicator and for zero counts.
Meteorological parameters and gaseous pollutants data were added to support the analysis discussion. Precipitation, temperature, wind speed and mixing layer height values were obtained from the website [25] and China Meteorological Administration in Wuhan. By comparing and analyzing the weather record over five years, the data of the year in this experiment did not depict significant difference and could embody the general meteorological characteristics in Wuhan. The mixing layer height, which is not determined by a measure, was calculated according to the nation standard GB/T13201-91. Here are the formulas:
when atmospheric stability is at level A, B, C and D:
L b = a s u 10 f
when atmospheric stability is at level E and F:
L b = b s u 10 f
where L b is the mixing layer height, a s and b s are mixing layer coefficients, u 10 is the average wind speed at 10-meter height and f is Coriolis parameter which is calculated by the following formula:
f = 2 Ω sin Φ
where Φ is geographic latitude and Ω is the rotation rate of the earth whose value is 7.29 × 10⁻⁵ rad·s−1. However, this is the national standard from China Meteorological Administration. More accurate mixing layer height could be calculated by additionally considering convective turbulence and prognostic equations on unstable atmospheric conditions [26].
The concentrations of air pollutants, including CO, SO2, O3, and NO2 used in this study were supplied by three national air quality monitoring sites located around the experimental site and monitored by a non-dispersive infrared analyzer (Advanced Pollution Instrumentation, model 300A), a pulsed ultraviolet fluorescence analyzer (API, model 200A), an ultraviolet photometric analyzer (TEI 49i) and a chemiluminescence method (API, Model 100A).

3. Results and Discussion

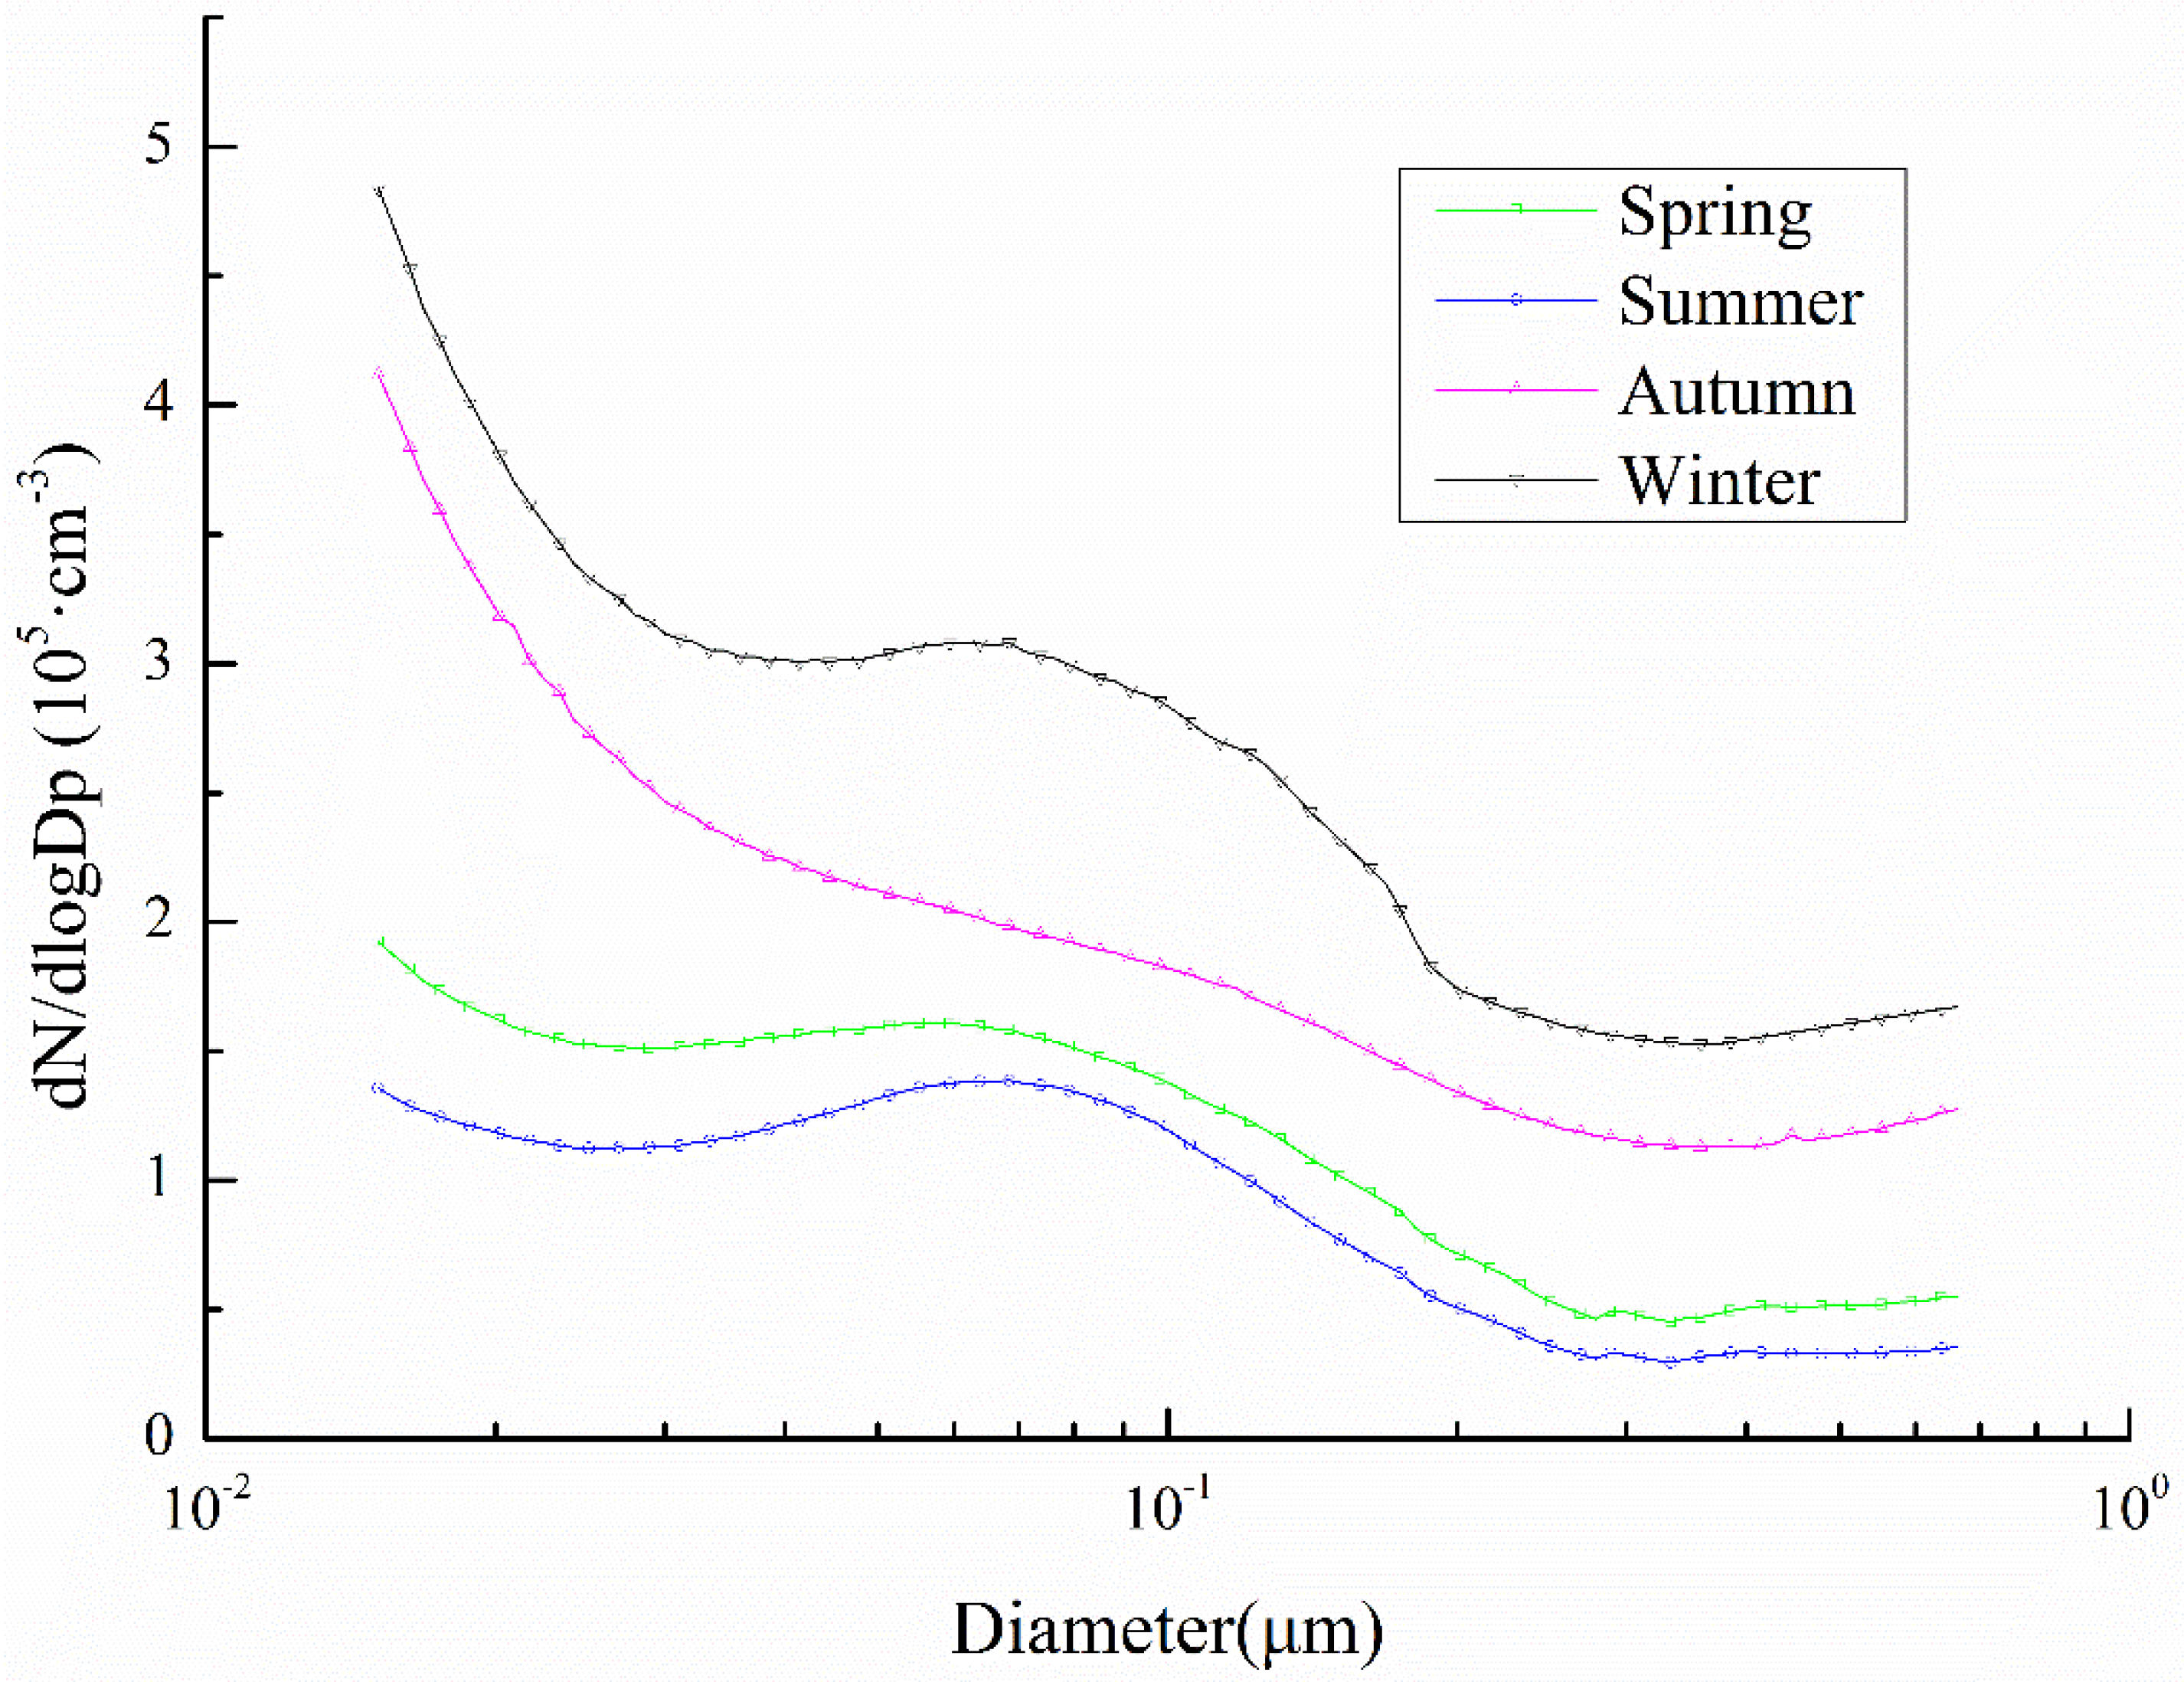
3.1. Seasonal Variability

A seasonal analysis was demonstrated firstly to display the seasonal variations and characteristics of particle size distribution and number concentration. In this study, the four seasons were defined based on both astronomy and climate method conjunctively, which is the common practice of seasonal classification, i.e., spring (March, April, and May), summer (June, July, and August), autumn (September, October, and November) and winter (December, January, and February). Continuous hourly measurements were divided per season and Figure 2 shows the concentrations of particles of varying diameter and size distributions in the four seasons. Since the log-normal law serves as an appropriate mathematical model for particle size distribution analysis so that the various mathematical terms are properly interpreted, the particle number size distribution was fitted by a log-normal distribution function [27], defined as:
dN dlogD p = N 2 π log σ g exp [ ( logD p logCMD ) 2 2 ( log σ g ) 2 ]
where N is the total number concentration, D p is the particle diameter, σ g is the geometrical standard deviation, and CMD is the count median diameter.
The particle size distribution indicates differences across seasons during the year. Overall, the PNC in winter were higher than in the other three seasons for each diameter. The PNC in summer was the lowest, which may be attributable to meteorological parameters, such as temperature [28], precipitation [29], wind speed [29] and mixing height [30]. There was a decreasing trend in concentrations with particle diameter in winter and autumn, interrupted by a slight increase in concentrations for particles around 50 nm in winter. Concentrations were slightly different between spring and summer, especially for particles smaller than 100 nm that were more abundant in spring. PNC dropped consistently for particles between 100 and 300 nm and then remained around 5 × 104 cm−3 for larger particles. In all four seasons, the concentrations of particles with diameter larger than 110 nm were relatively low and the highest concentrations were dominated by particles smaller than 110 nm throughout the year. Such findings concur with research conducted in Pittsburg [11] and Lanzhou, China [31]. In addition, particles smaller than 30 nm in winter and autumn display a sharp increase in concentration with decreasing diameter, while particles of the same size range in summer and spring did not vary as much. Considering the technical limit of the instrument, particles smaller than 15 nm were not detected. Nevertheless, it can be hypothesized by extrapolation of the curves that particles smaller than 15 nm might make up for a large proportion of all particles in winter and autumn, as has been previously found [31,32]. These differences in four seasons suggest the existence of different sources of ultrafine particles. For instance, in winter, with less photochemical reaction and a weak convection, high vehicle or burning emissions may be the major sources of ultrafine particles [32].

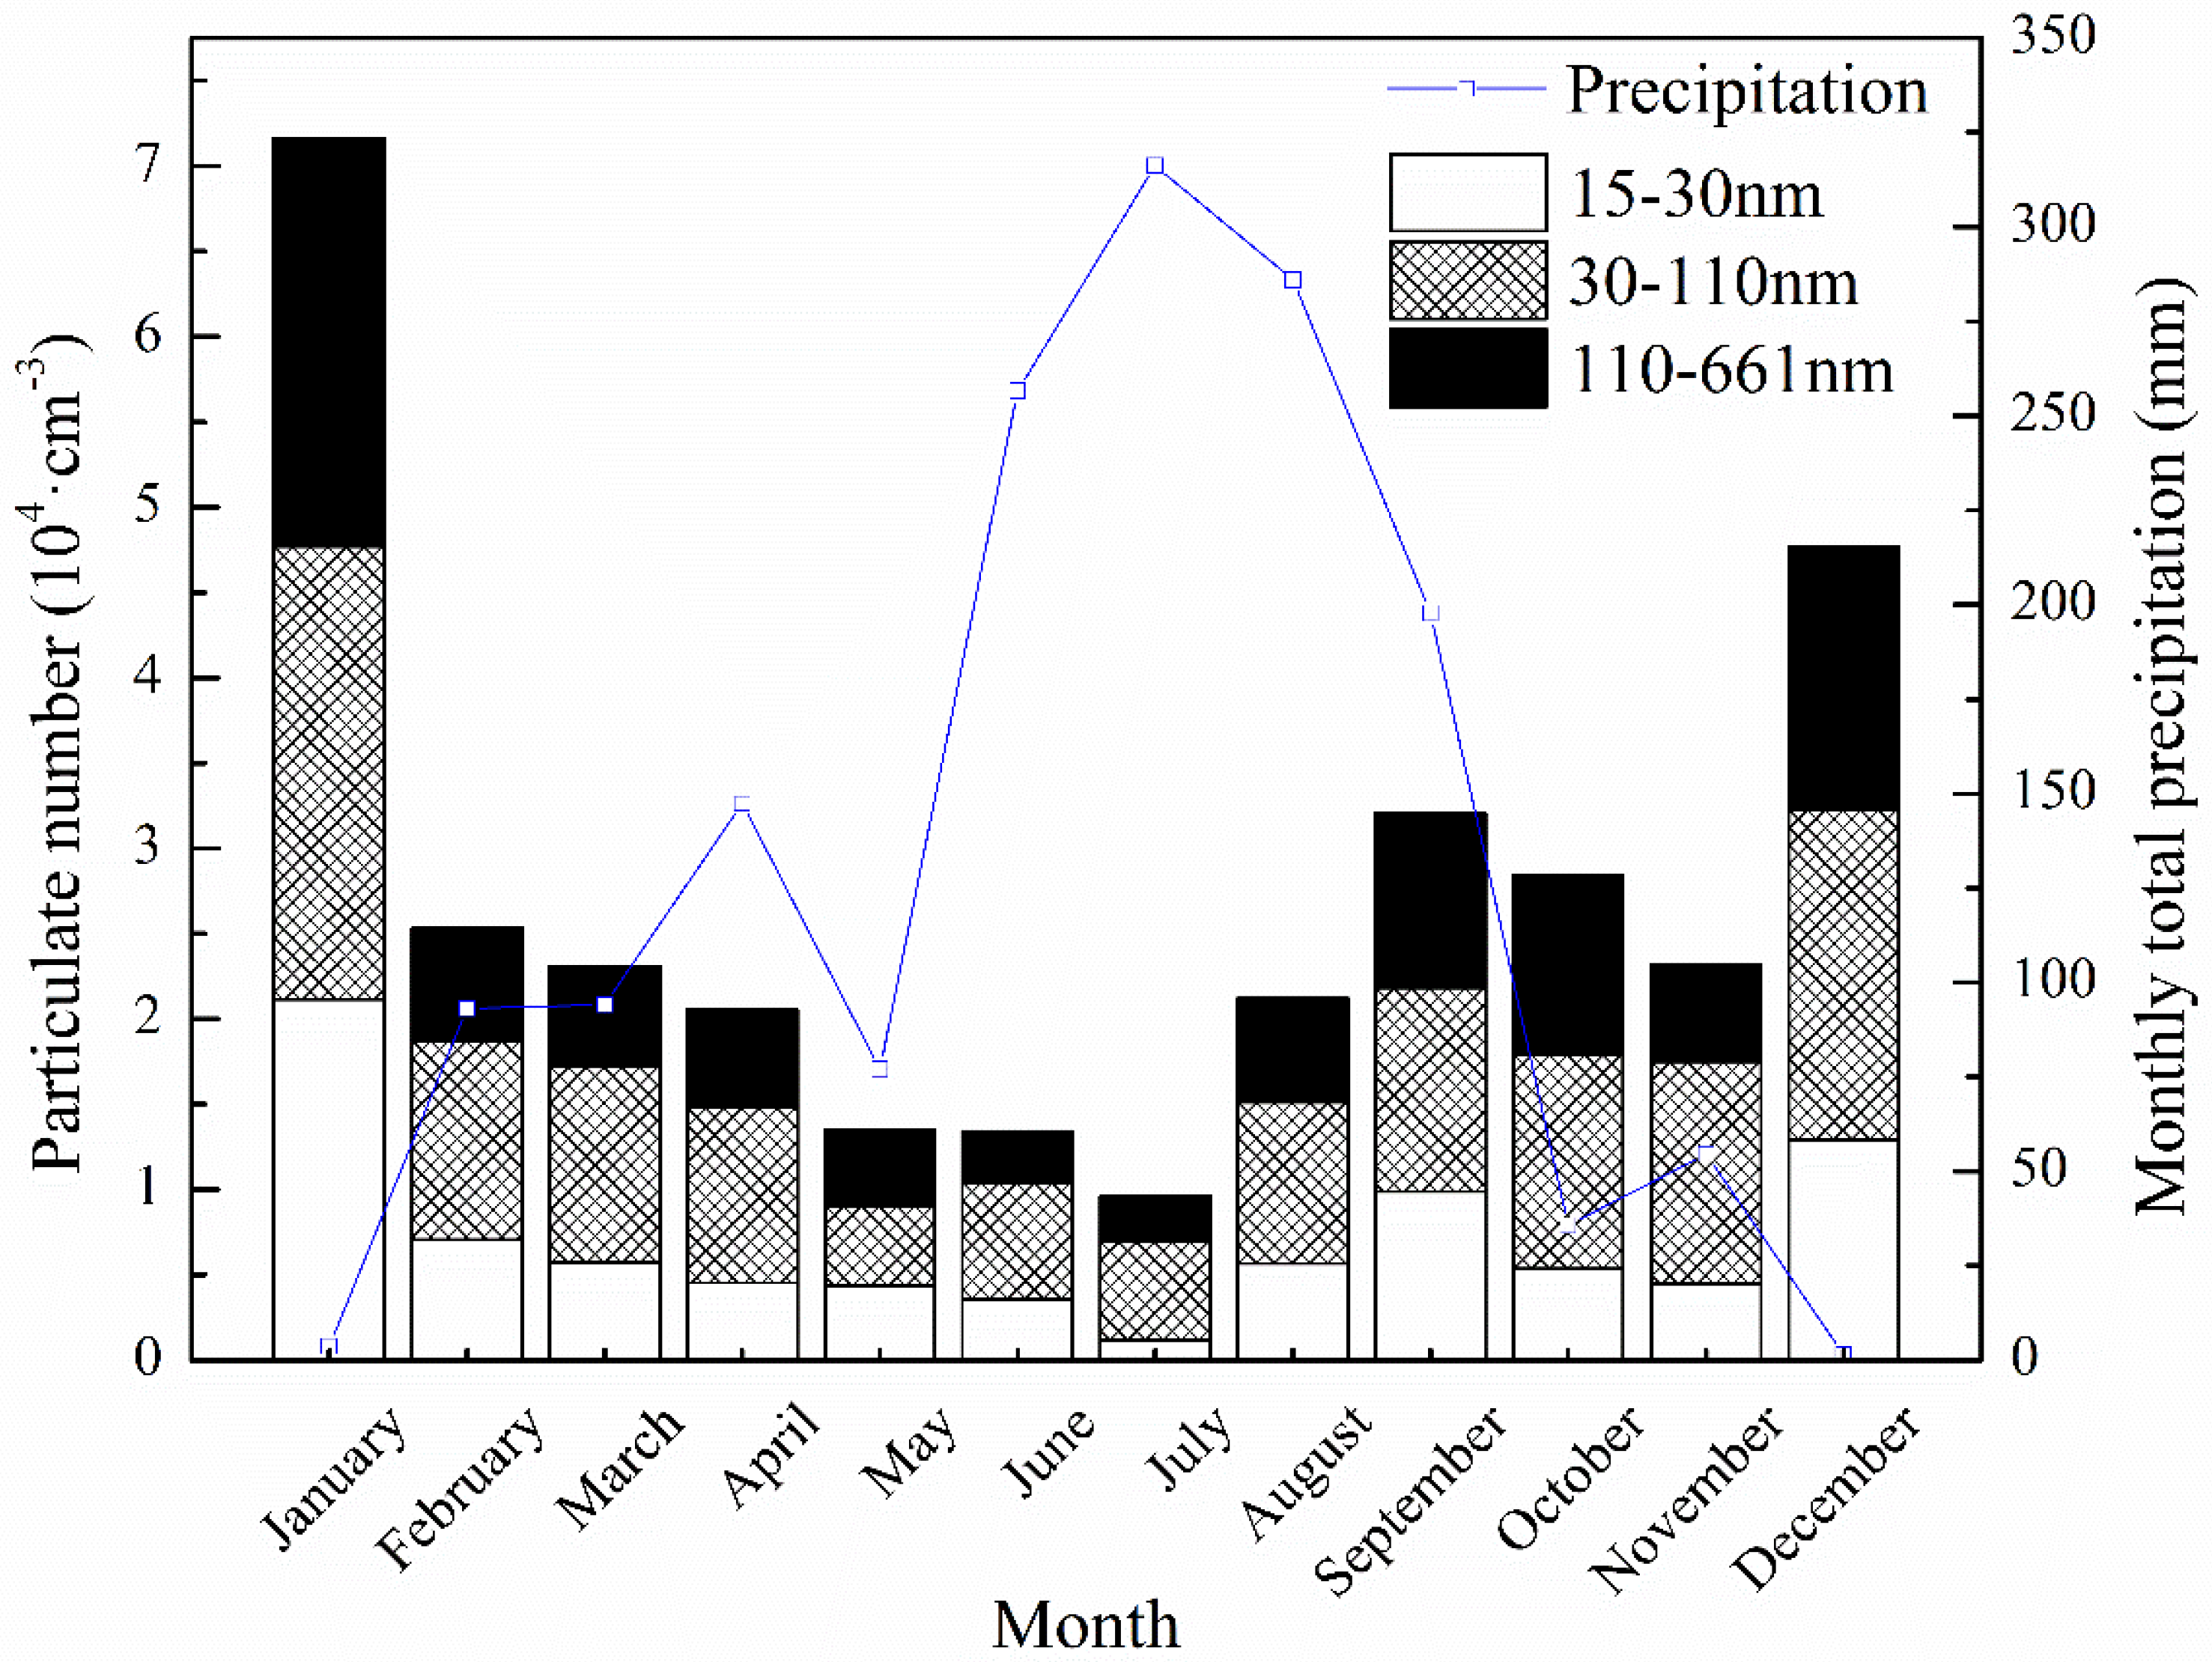
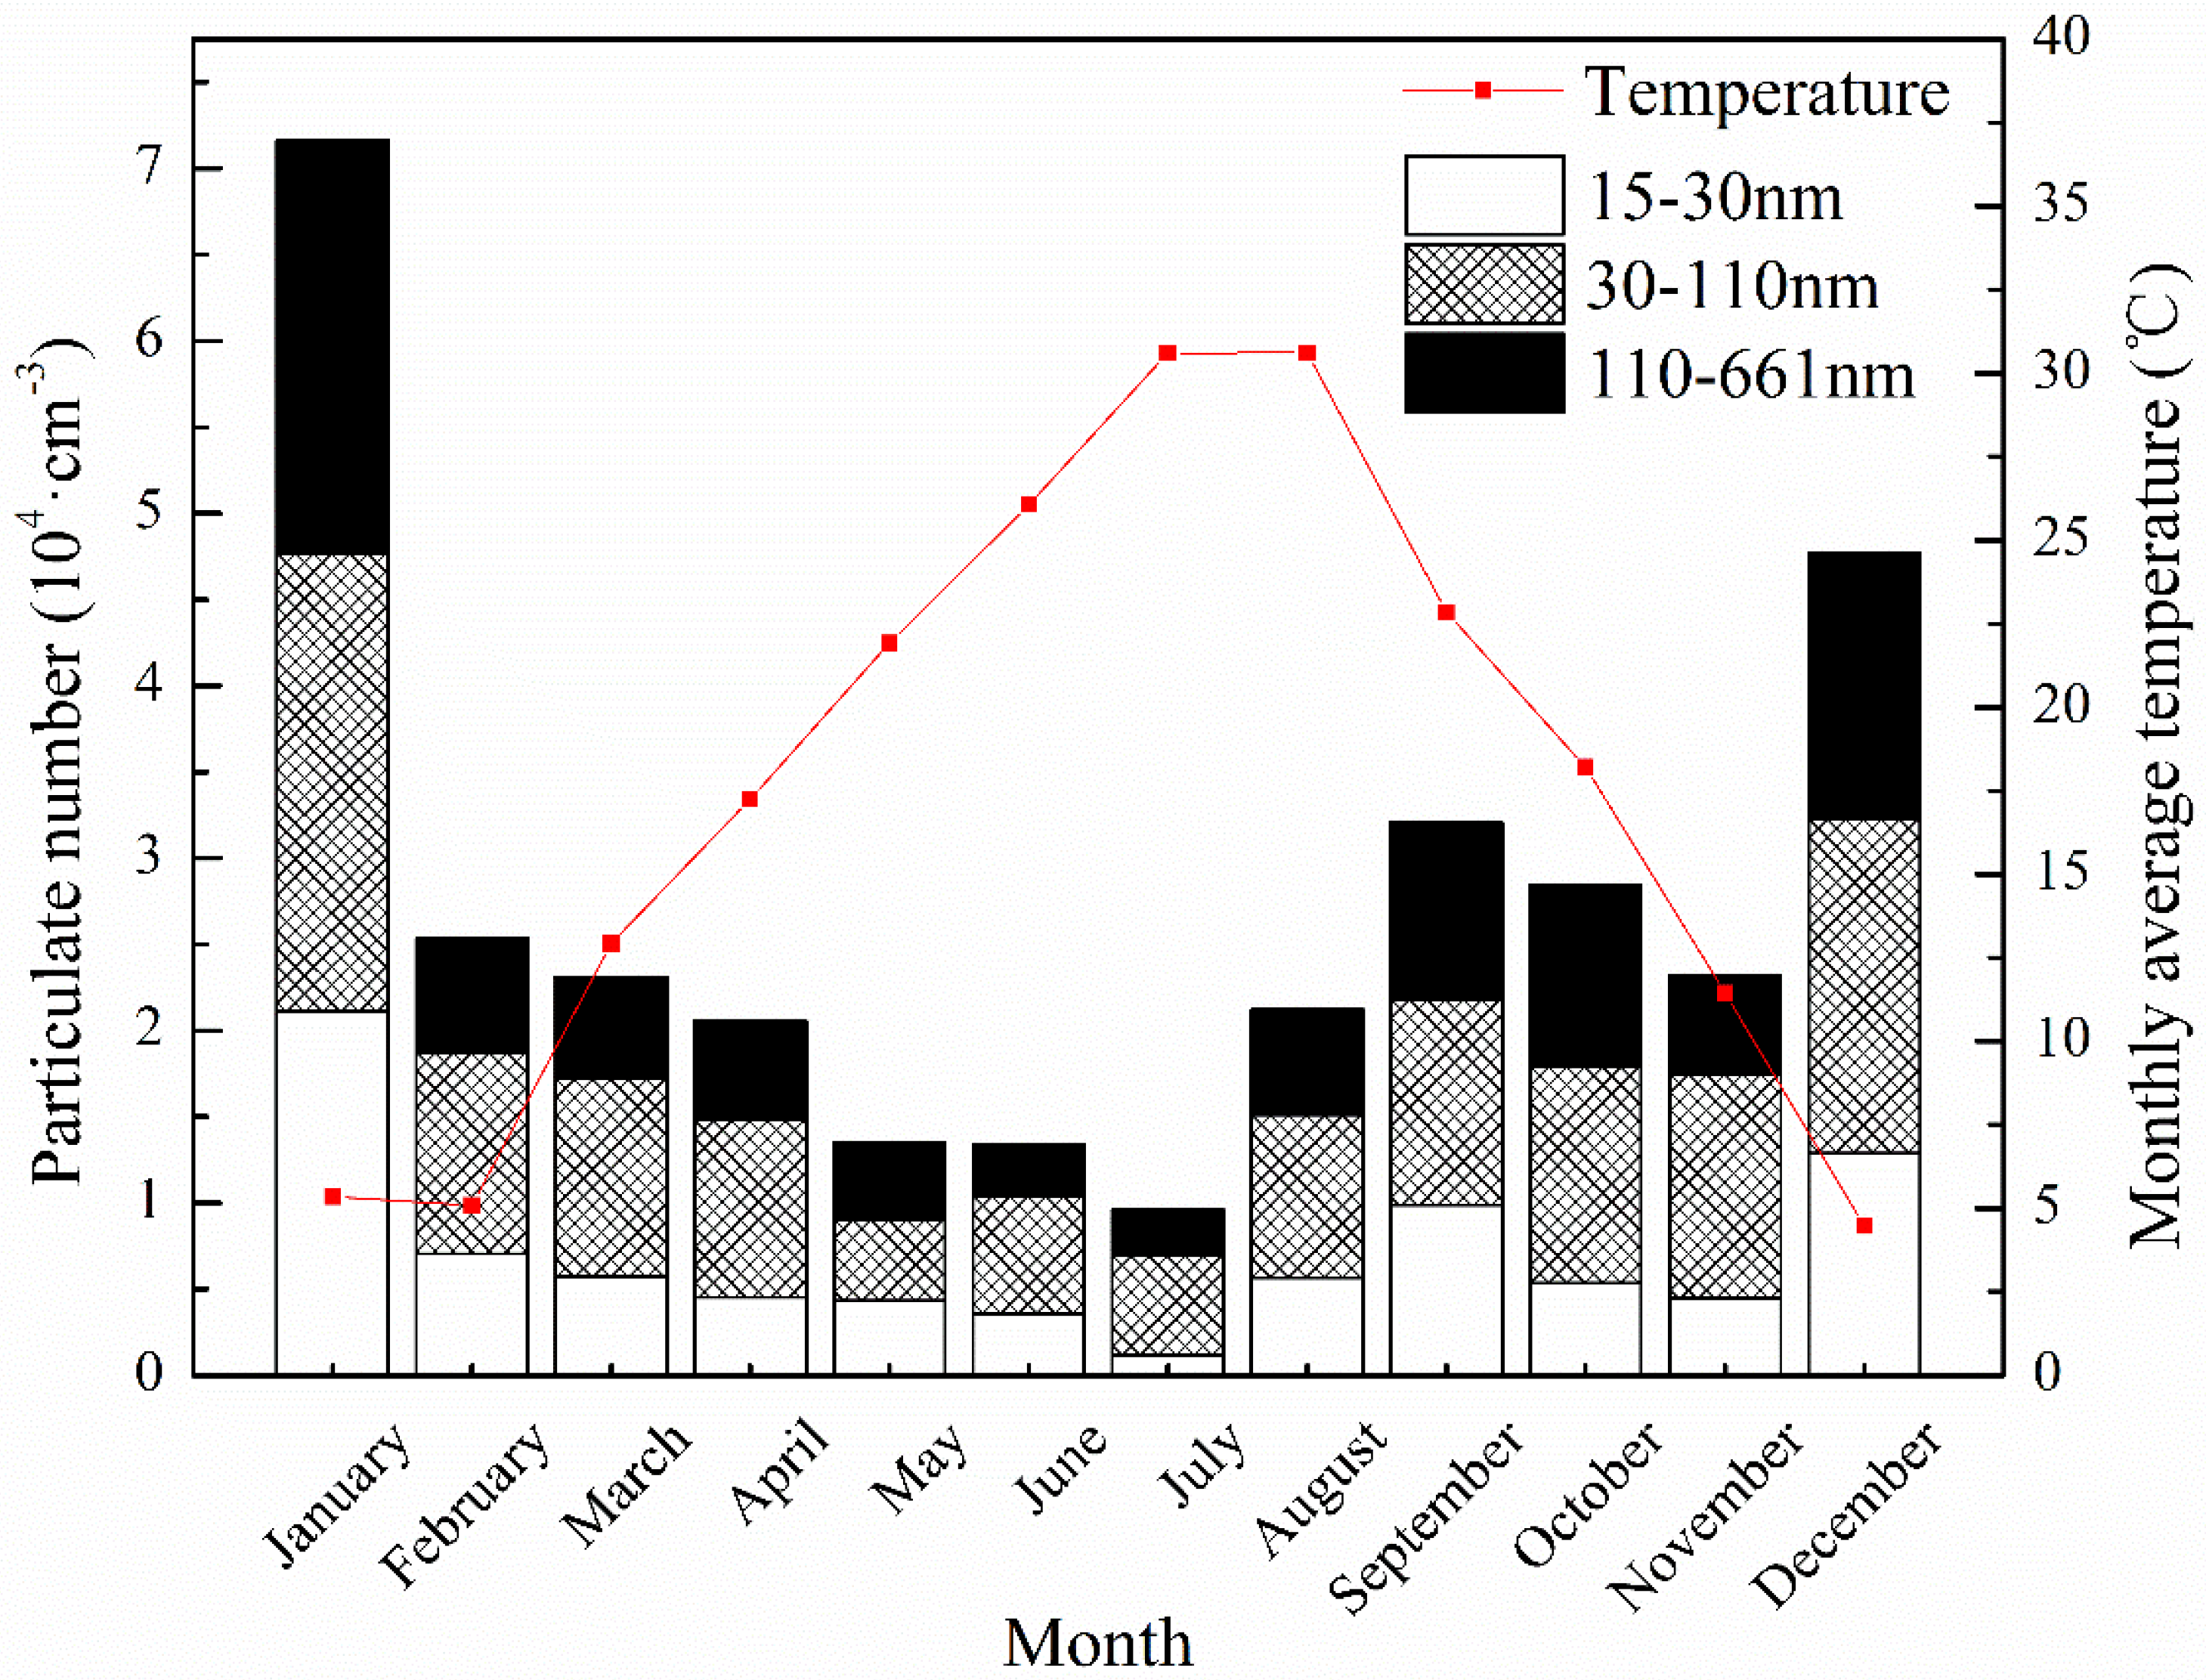
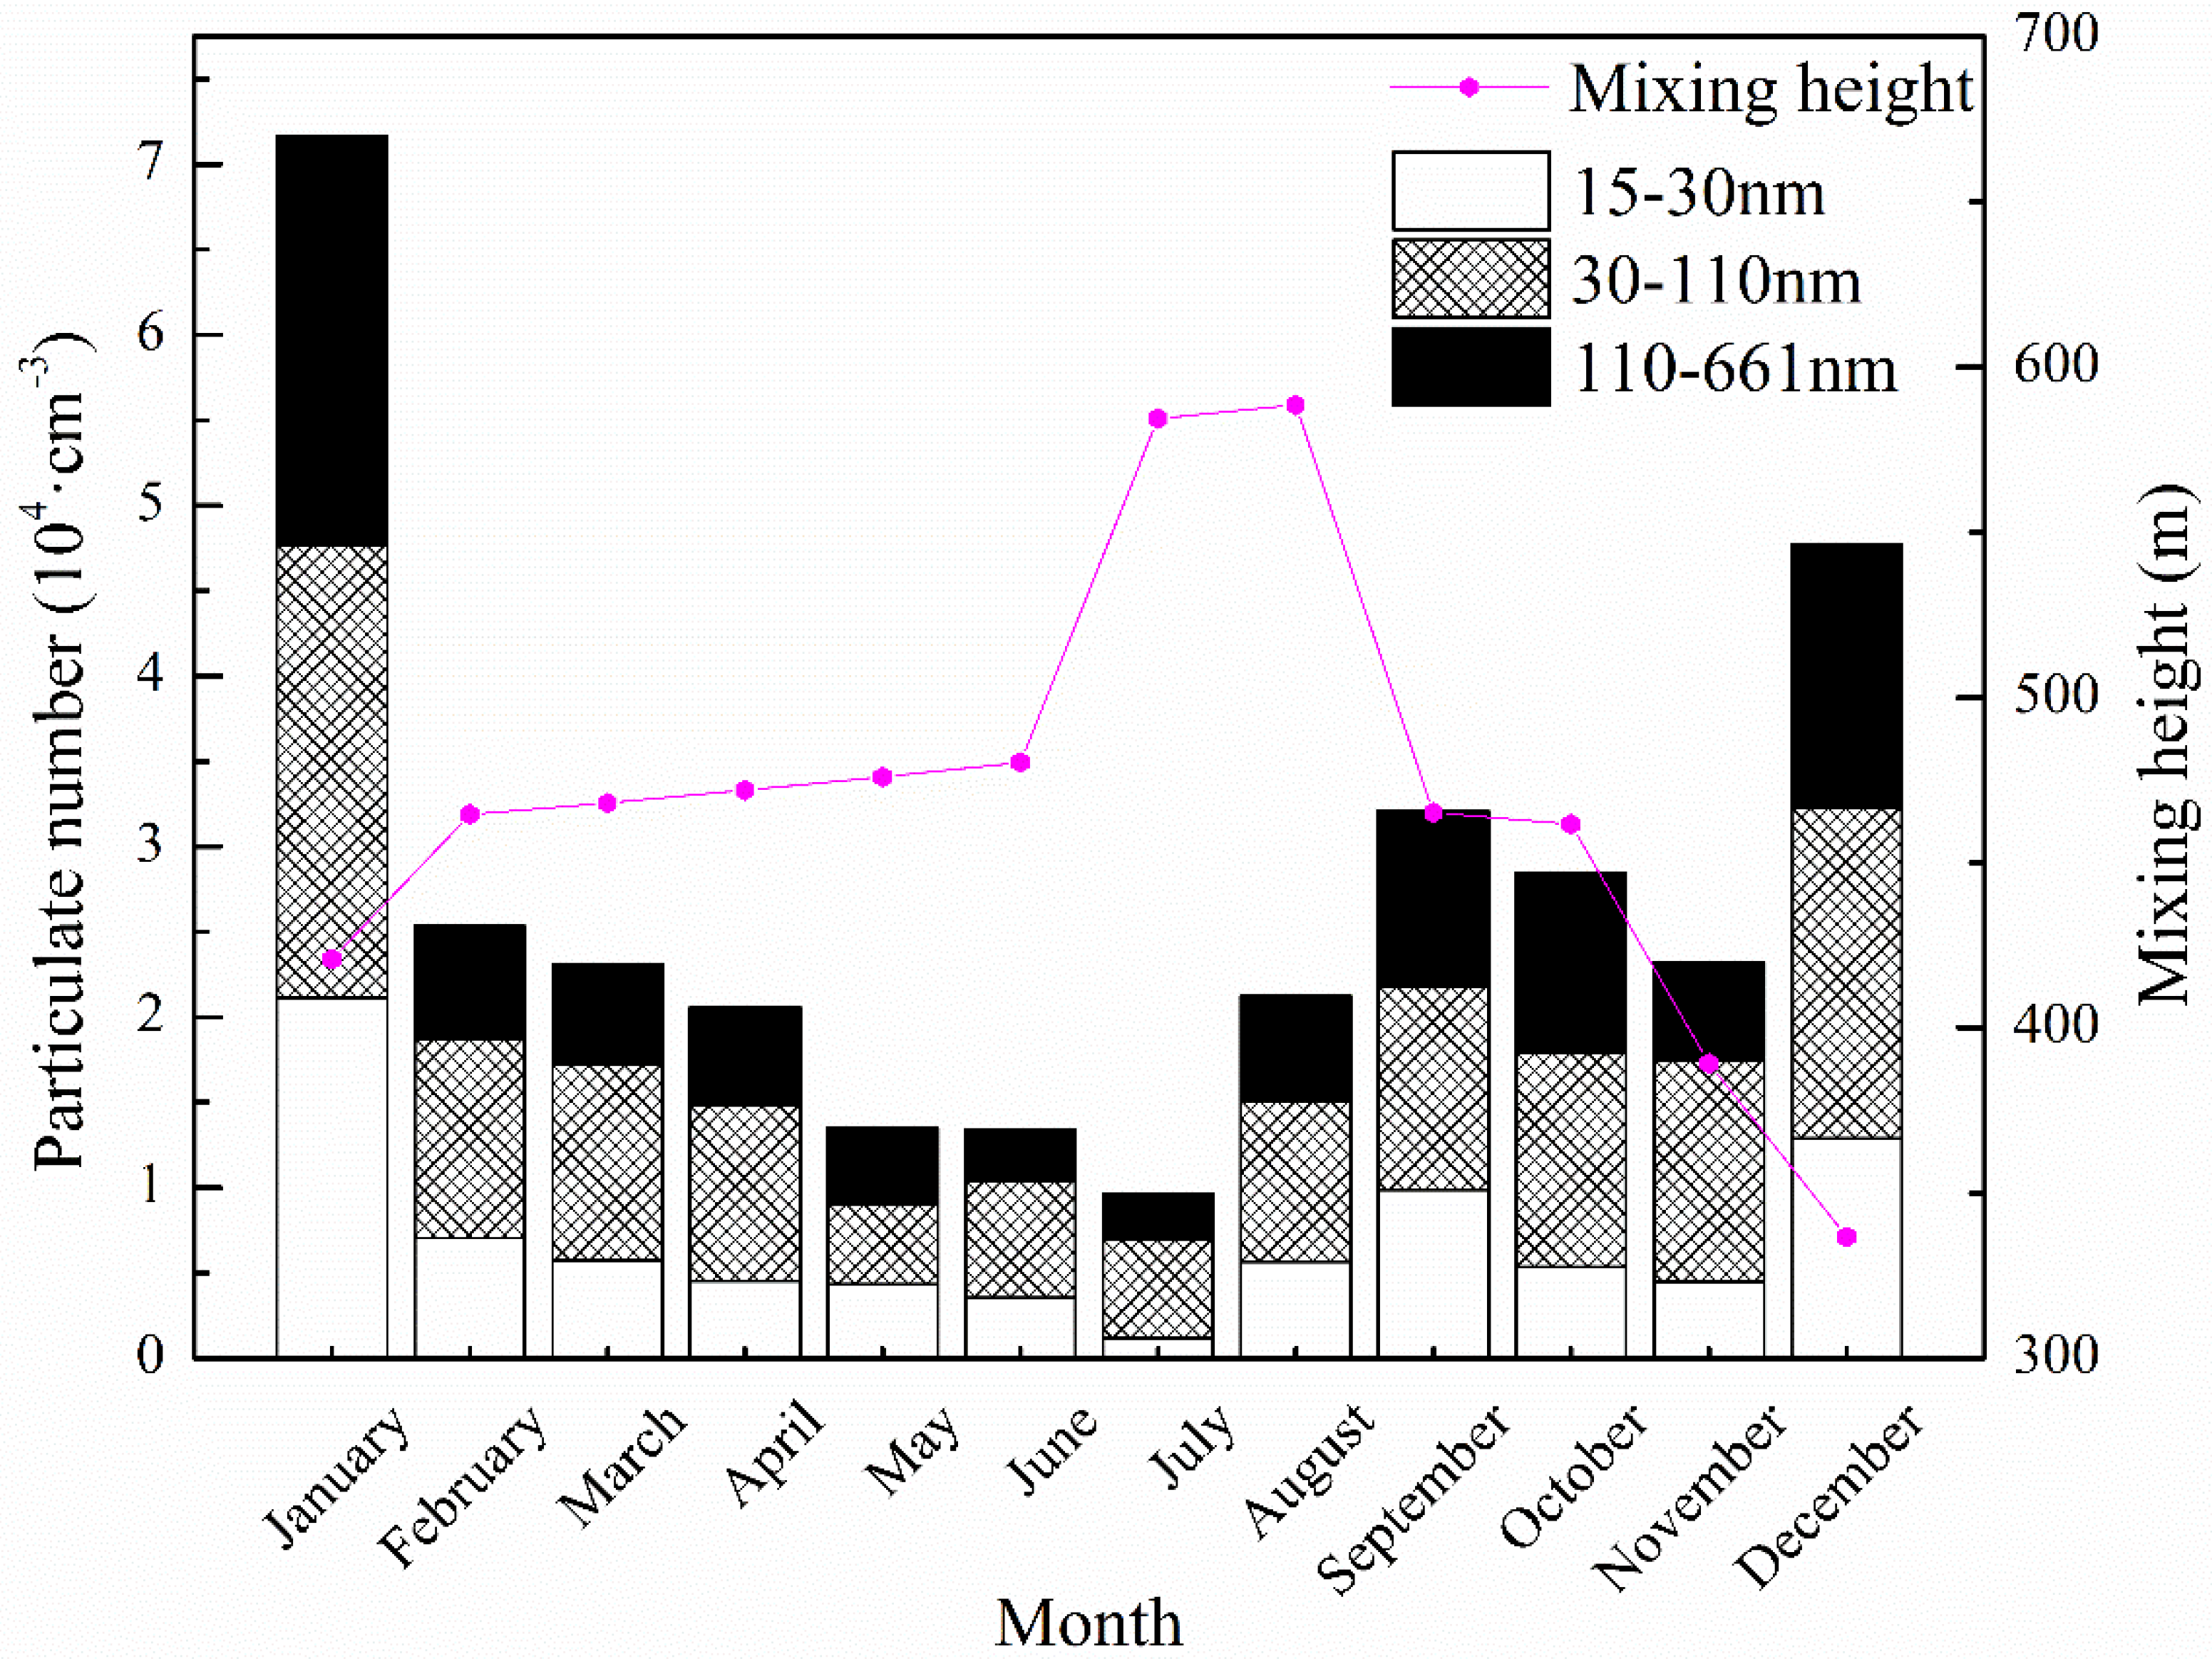
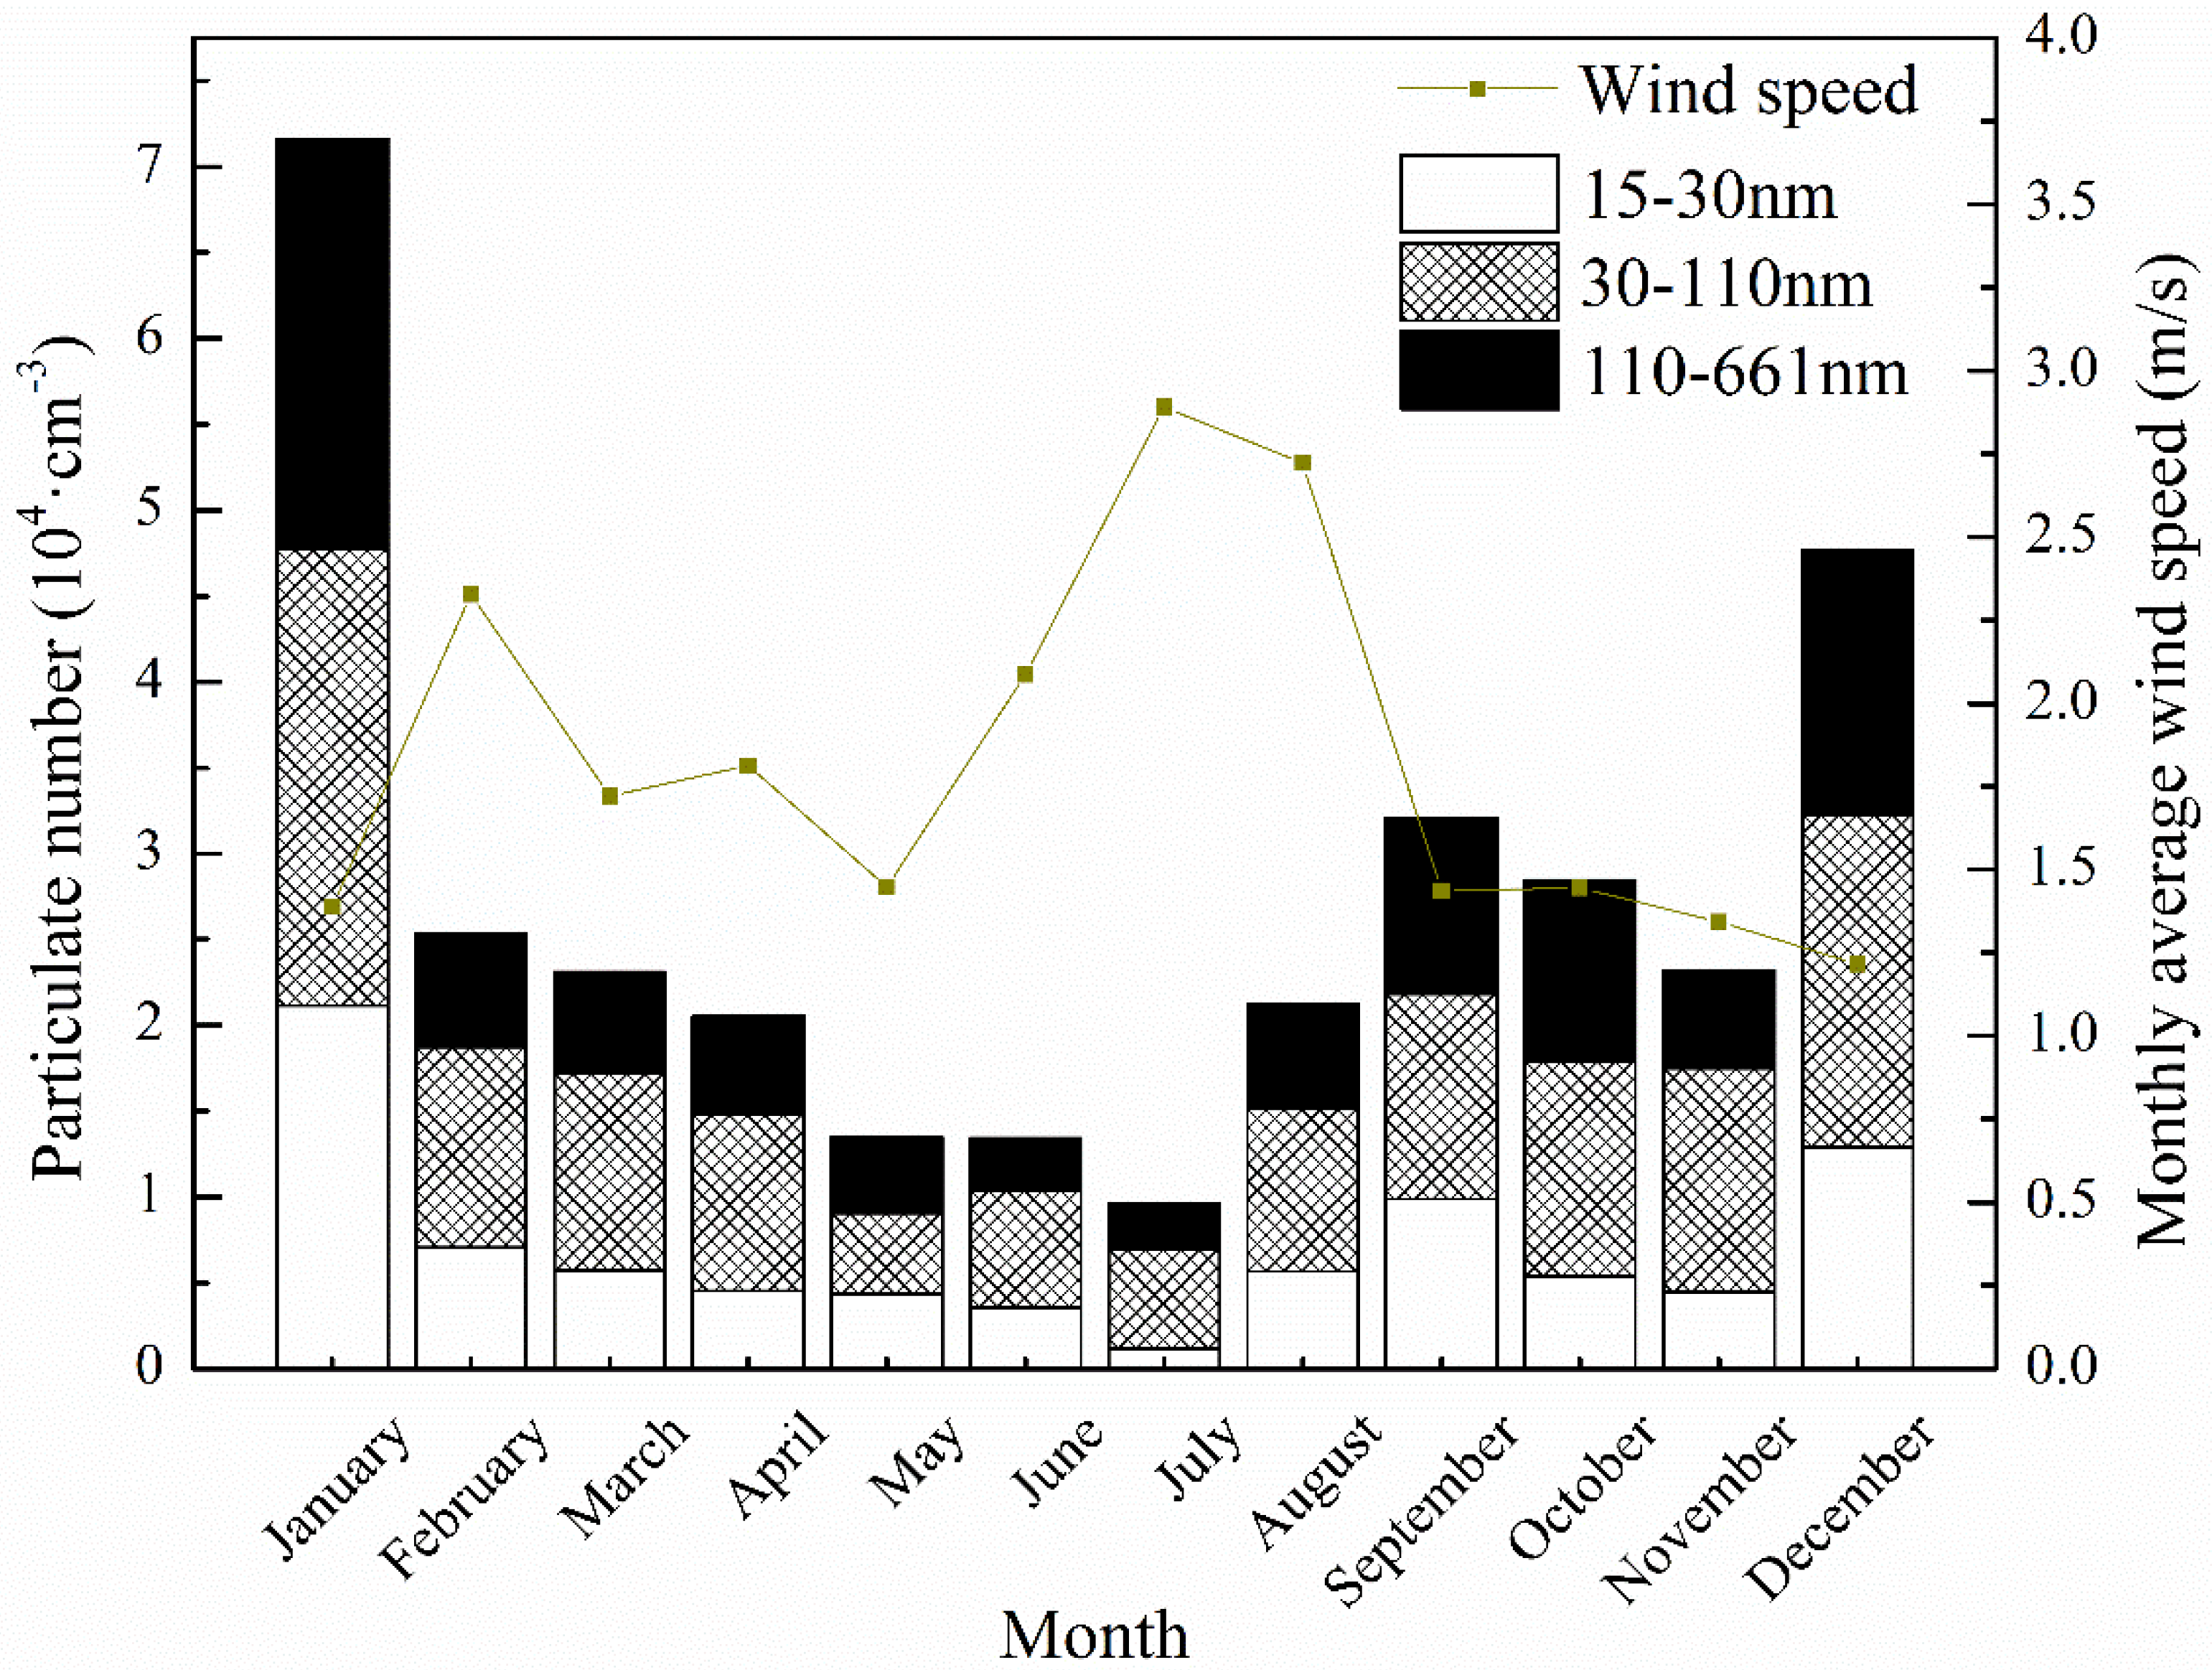
3.2. Monthly Variability

In order to better understand the possible relationship between meteorological parameters and particle number concentrations and size distribution, monthly measurements of PNC were confronted with meteorological parameters such as precipitation, temperature, mixing layer height and wind speed, as shown in Figure 3, Figure 4, Figure 5 and Figure 6. Particles were divided into three size ranges, based on their mobility diameter: 15–30 nm, 30–110 nm and 110–661 nm, respectively representing the nucleation mode, the Aitken mode and the accumulation mode [33]. The annual averaged number concentrations of submicron particles in three sizes reached 8083 cm−3, 11,193 cm−3 and 7801 cm−3, respectively, which is similar to previous study in Beijing [18]. By observing the concentration variation in Figure 3, the particles in all three modes displayed a comparable trend from January to December, forming a near-inverse parabolic distribution. The highest monthly concentration appeared in January, reaching 21,150 cm−3, 26,557 cm−3 and 23,918 cm−3, respectively for each mode. The lowest monthly concentration of particles in nucleation mode and accumulation mode appeared in July, reaching 1157 cm−3 and 2629 cm−3, respectively. Particles with a diameter of 30 to 110 nm reached the lowest concentration in May, namely 4734 cm−3. The correlation coefficients describing the relationship between particle number concentrations in three modes and meteorological parameters, including precipitation, temperature, mixing layer height and wind speed, are shown in Table 1. There does exist autocorrelation between these variables that the solar radiation, which is represented by temperature, drives the mixing layer height during the day by generating convective turbulence, while the mixing layer height is determined by mechanical turbulence via wind during the night [34,35,36]. However, this study tries to explore the meteorological effects separately to explain the specific contribution by each meteorological variable, although they could have influence on the others.
The monthly averaged precipitations during the experimental period varied from 14 mm to 3162 mm. Figure 3 clearly shows that it rained most in summer, particularly in July, when particles reach their lowest concentrations. By contrast, in December and January, particle concentrations reached maximum values as the precipitation dropped to its minimum. There is a negative correlation between precipitations and the PNC (Table 1), with coefficients of −0.557 (p = 0.060), −0.656 (p = 0.021) and −0.618 (p = 0.032), respectively for the 3 modes. With a confidence level of 95%, the precipitation is significantly negatively correlated with particle concentrations in the size ranges of 30–110 nm and 110–661 nm. As Castro [37] pointed out previously, the washout of soluble particles would be fast and noticeable when the precipitation intensity exceeds 3.2 mm·h−1. Considering that the concentration of particles smaller than 30 nm does not present significant correlation with precipitation, the washout effect may mainly act on large particles. Substantial rainfall in Wuhan, especially in summer, may be the key factor causing the rapid decline of particle concentrations, especially of particles larger than 30 nm.
Monthly averaged temperatures varied from 4.5 to 30.6 °C, with the maximum in August and the minimum in December. It appears clearly that temperature is negatively correlated with particle concentrations (Figure 4), as supported by correlation coefficients of −0.622 (p = 0.031), −0.740 (p = 0.006) and −0.610 (p = 0.035), respectively for the three modes. Since high temperatures is conductive to severe convection which favors diffusion and dispersion, atmospheric particles would be transported rapidly and efficiently, leading to the reduction in particle number concentrations [30].
The recorded mixing layer height displays a monthly variability comparable to that of the temperature and reaches its extremes in the same months, while varying from 337 to 588 m. It is likely that the mixing height that determines the volume through which pollutants are diluted increases with the temperature, causing a higher dilution and lower particle concentrations [30]. Accordingly, Figure 5 demonstrated a negative correlation between the mixing layer height and particle concentrations, with correlation coefficients of 0.594 (p = 0.042), 0.909 (p = 0.000) and 0.657 (p = 0.020) shown in Table 1. The mixing height has a significant negative correlation with particle concentrations with the confidence level of 95%, suggesting another factor directly influencing the particle number concentration, since Wuhan is always experiencing an extremely hot summer, resulting in evident variation of mixing height.
The monthly averaged wind speed displayed a double-peak pattern over one year, as shown in Figure 6, with the maximum of 2.89 m·s−1 in July and the minimum of 1.22 m·s−1 in December. In general, the higher the wind speed was, the lower the particle number concentrations were, which could be explained by the dilution of clean air and dispersion force increasing with the wind speed, whereas a lower wind speed contributes to a relatively stable air condition that prevents the migration and diffusion of gaseous pollutants [18]. Although wind speed may possibly have a reverse impact on the PNC, monthly averaged data indicated that the wind speed was not inversely proportional to PNC. A small peak in wind speed occurred in February when the PNC did not show any peak or nadir. The correlation analysis showed no significant correlation between local wind speed and particle concentrations, with correlation coefficients of 0.487 (p = 0.108), 0.515 (p = 0.087) and 0.531 (p = 0.075). Hussein [28] has previously noted the two opposite effects of the wind speed on PNC: low wind speed contributes to a stable atmospheric stratification, which diminishes the diffusion effect on particles, and a relatively higher wind speed increases the re-suspension of particles larger than 100 nm from street surfaces, enhancing the PNC. Moreover, the high-speed wind may also bring in exogenous aerosols and increase the concentration correspondingly [8]. It is likely that the PNC in Wuhan were affected by wind speed in both manners, and that none of them played a dominant role. Therefore, the unclear influence of the wind may lead to unexplained correlations between wind speed and particle number concentrations.

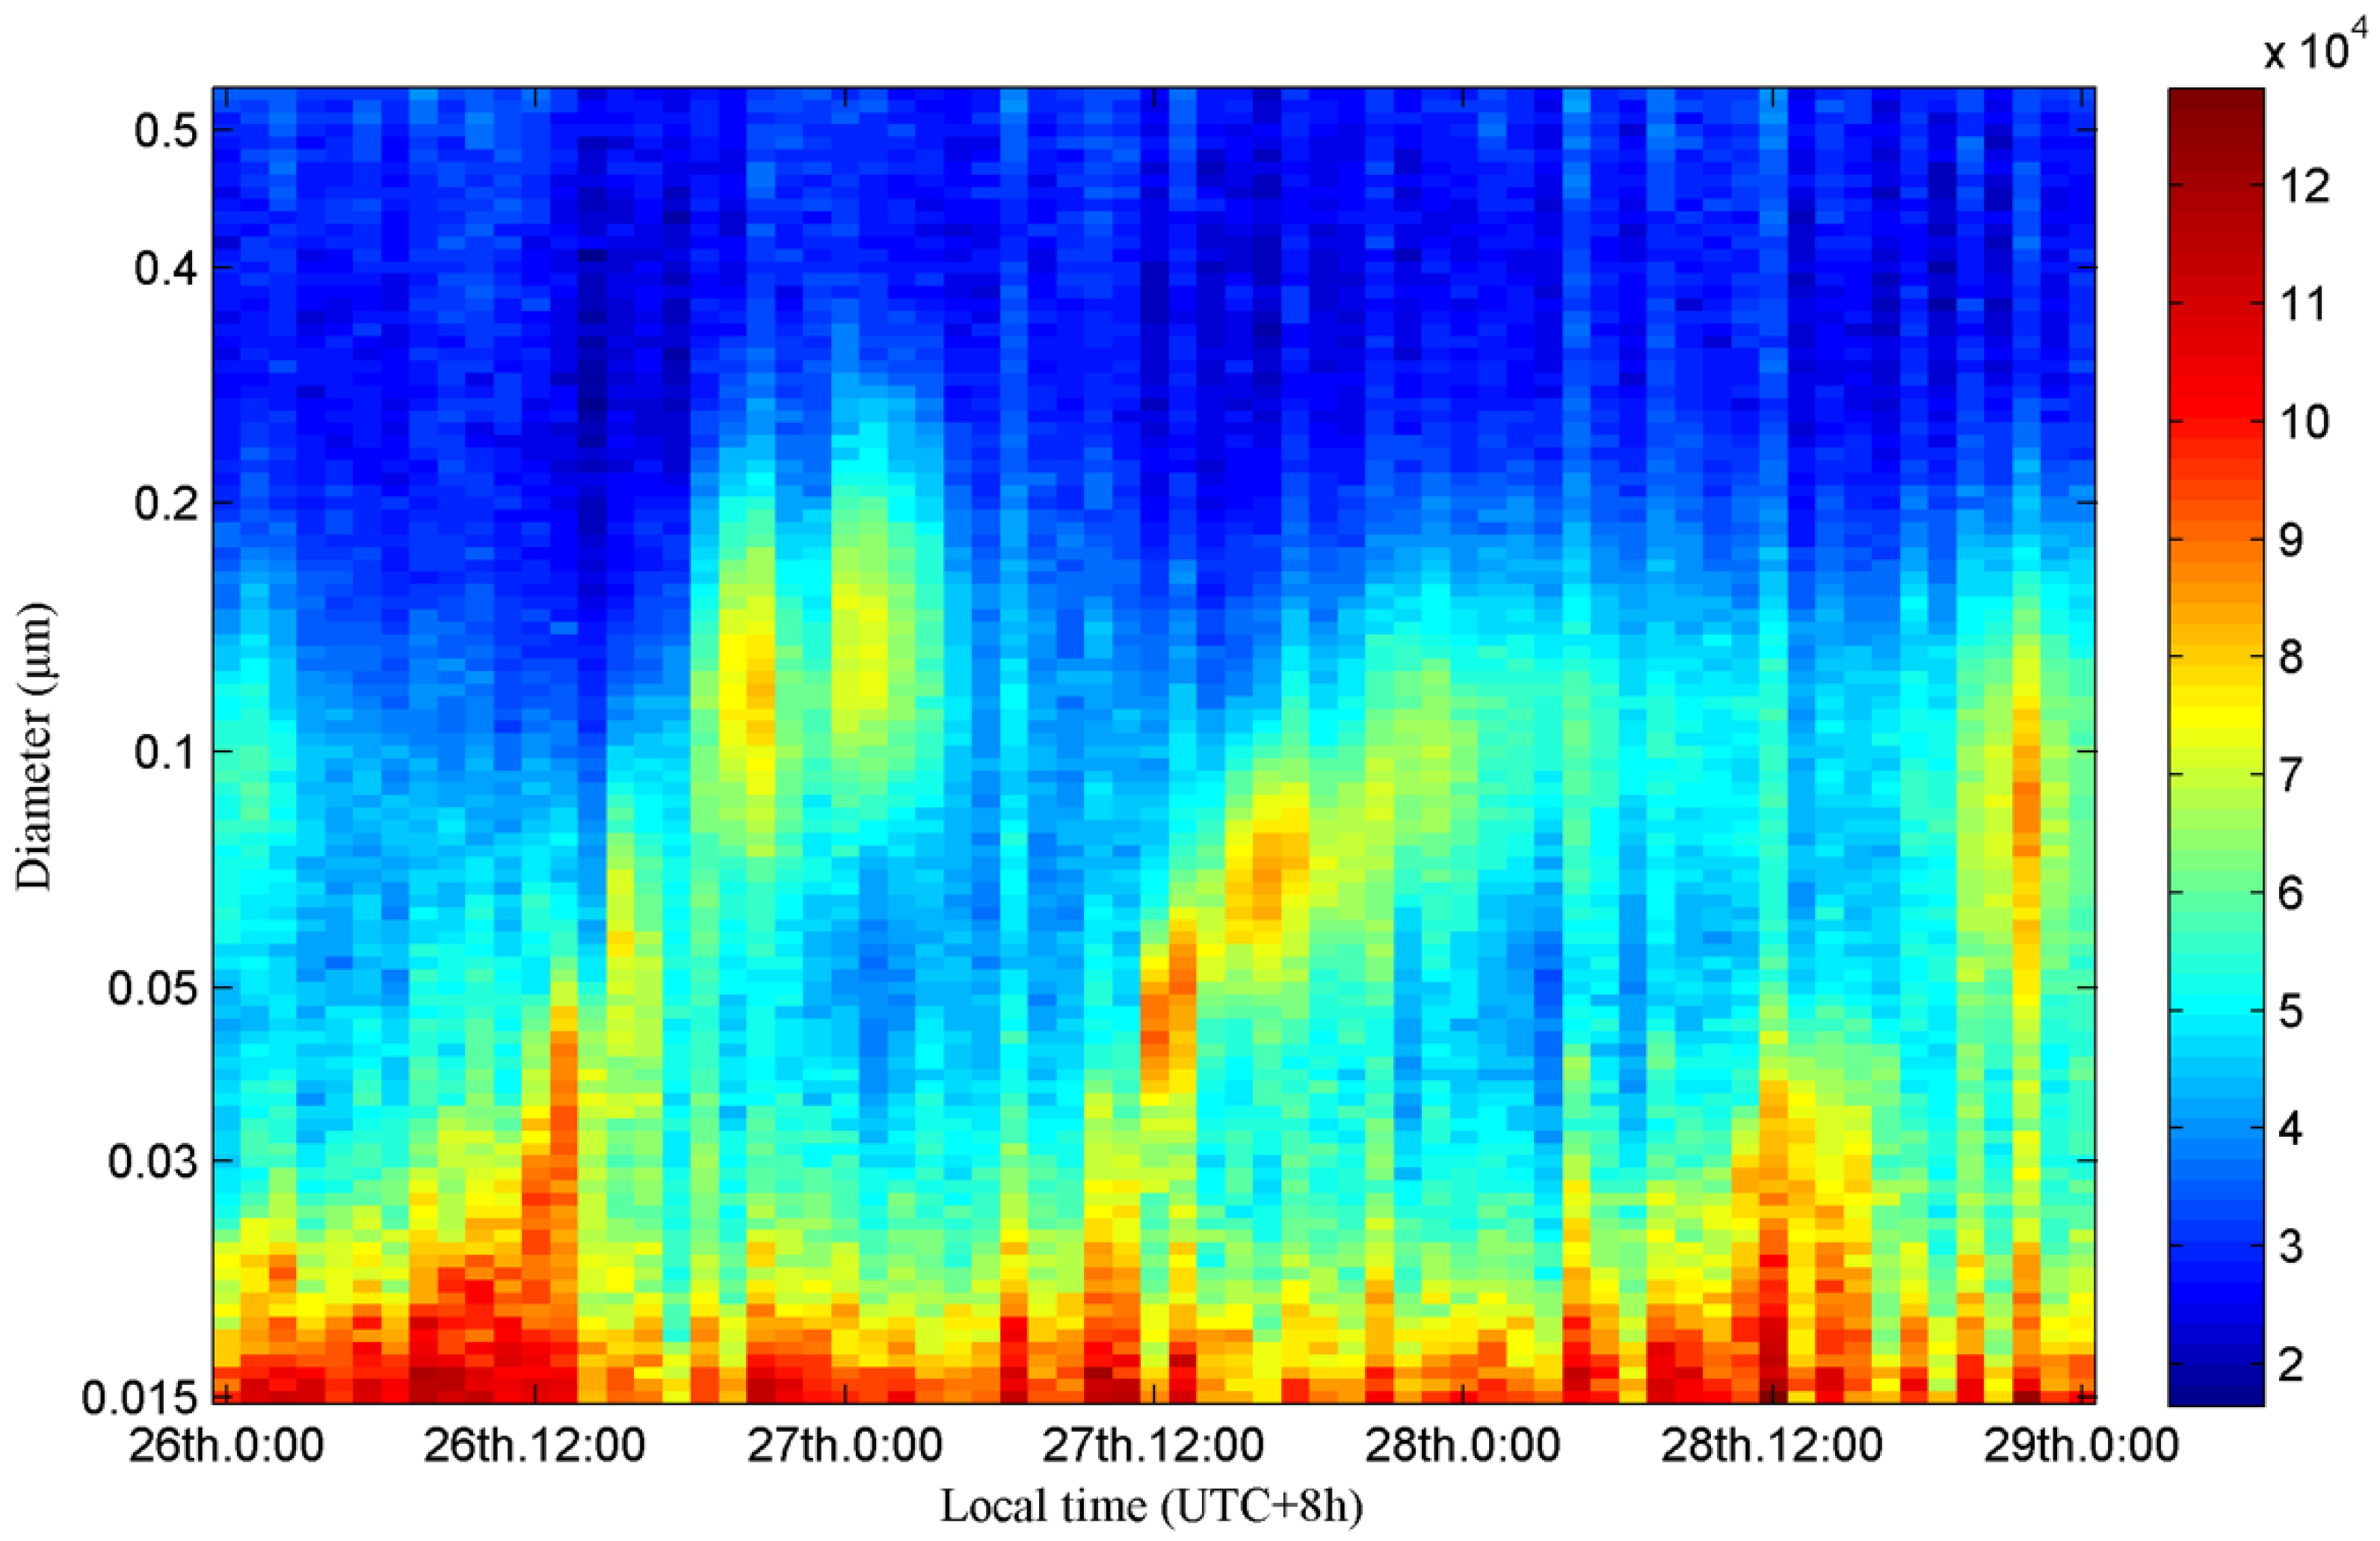
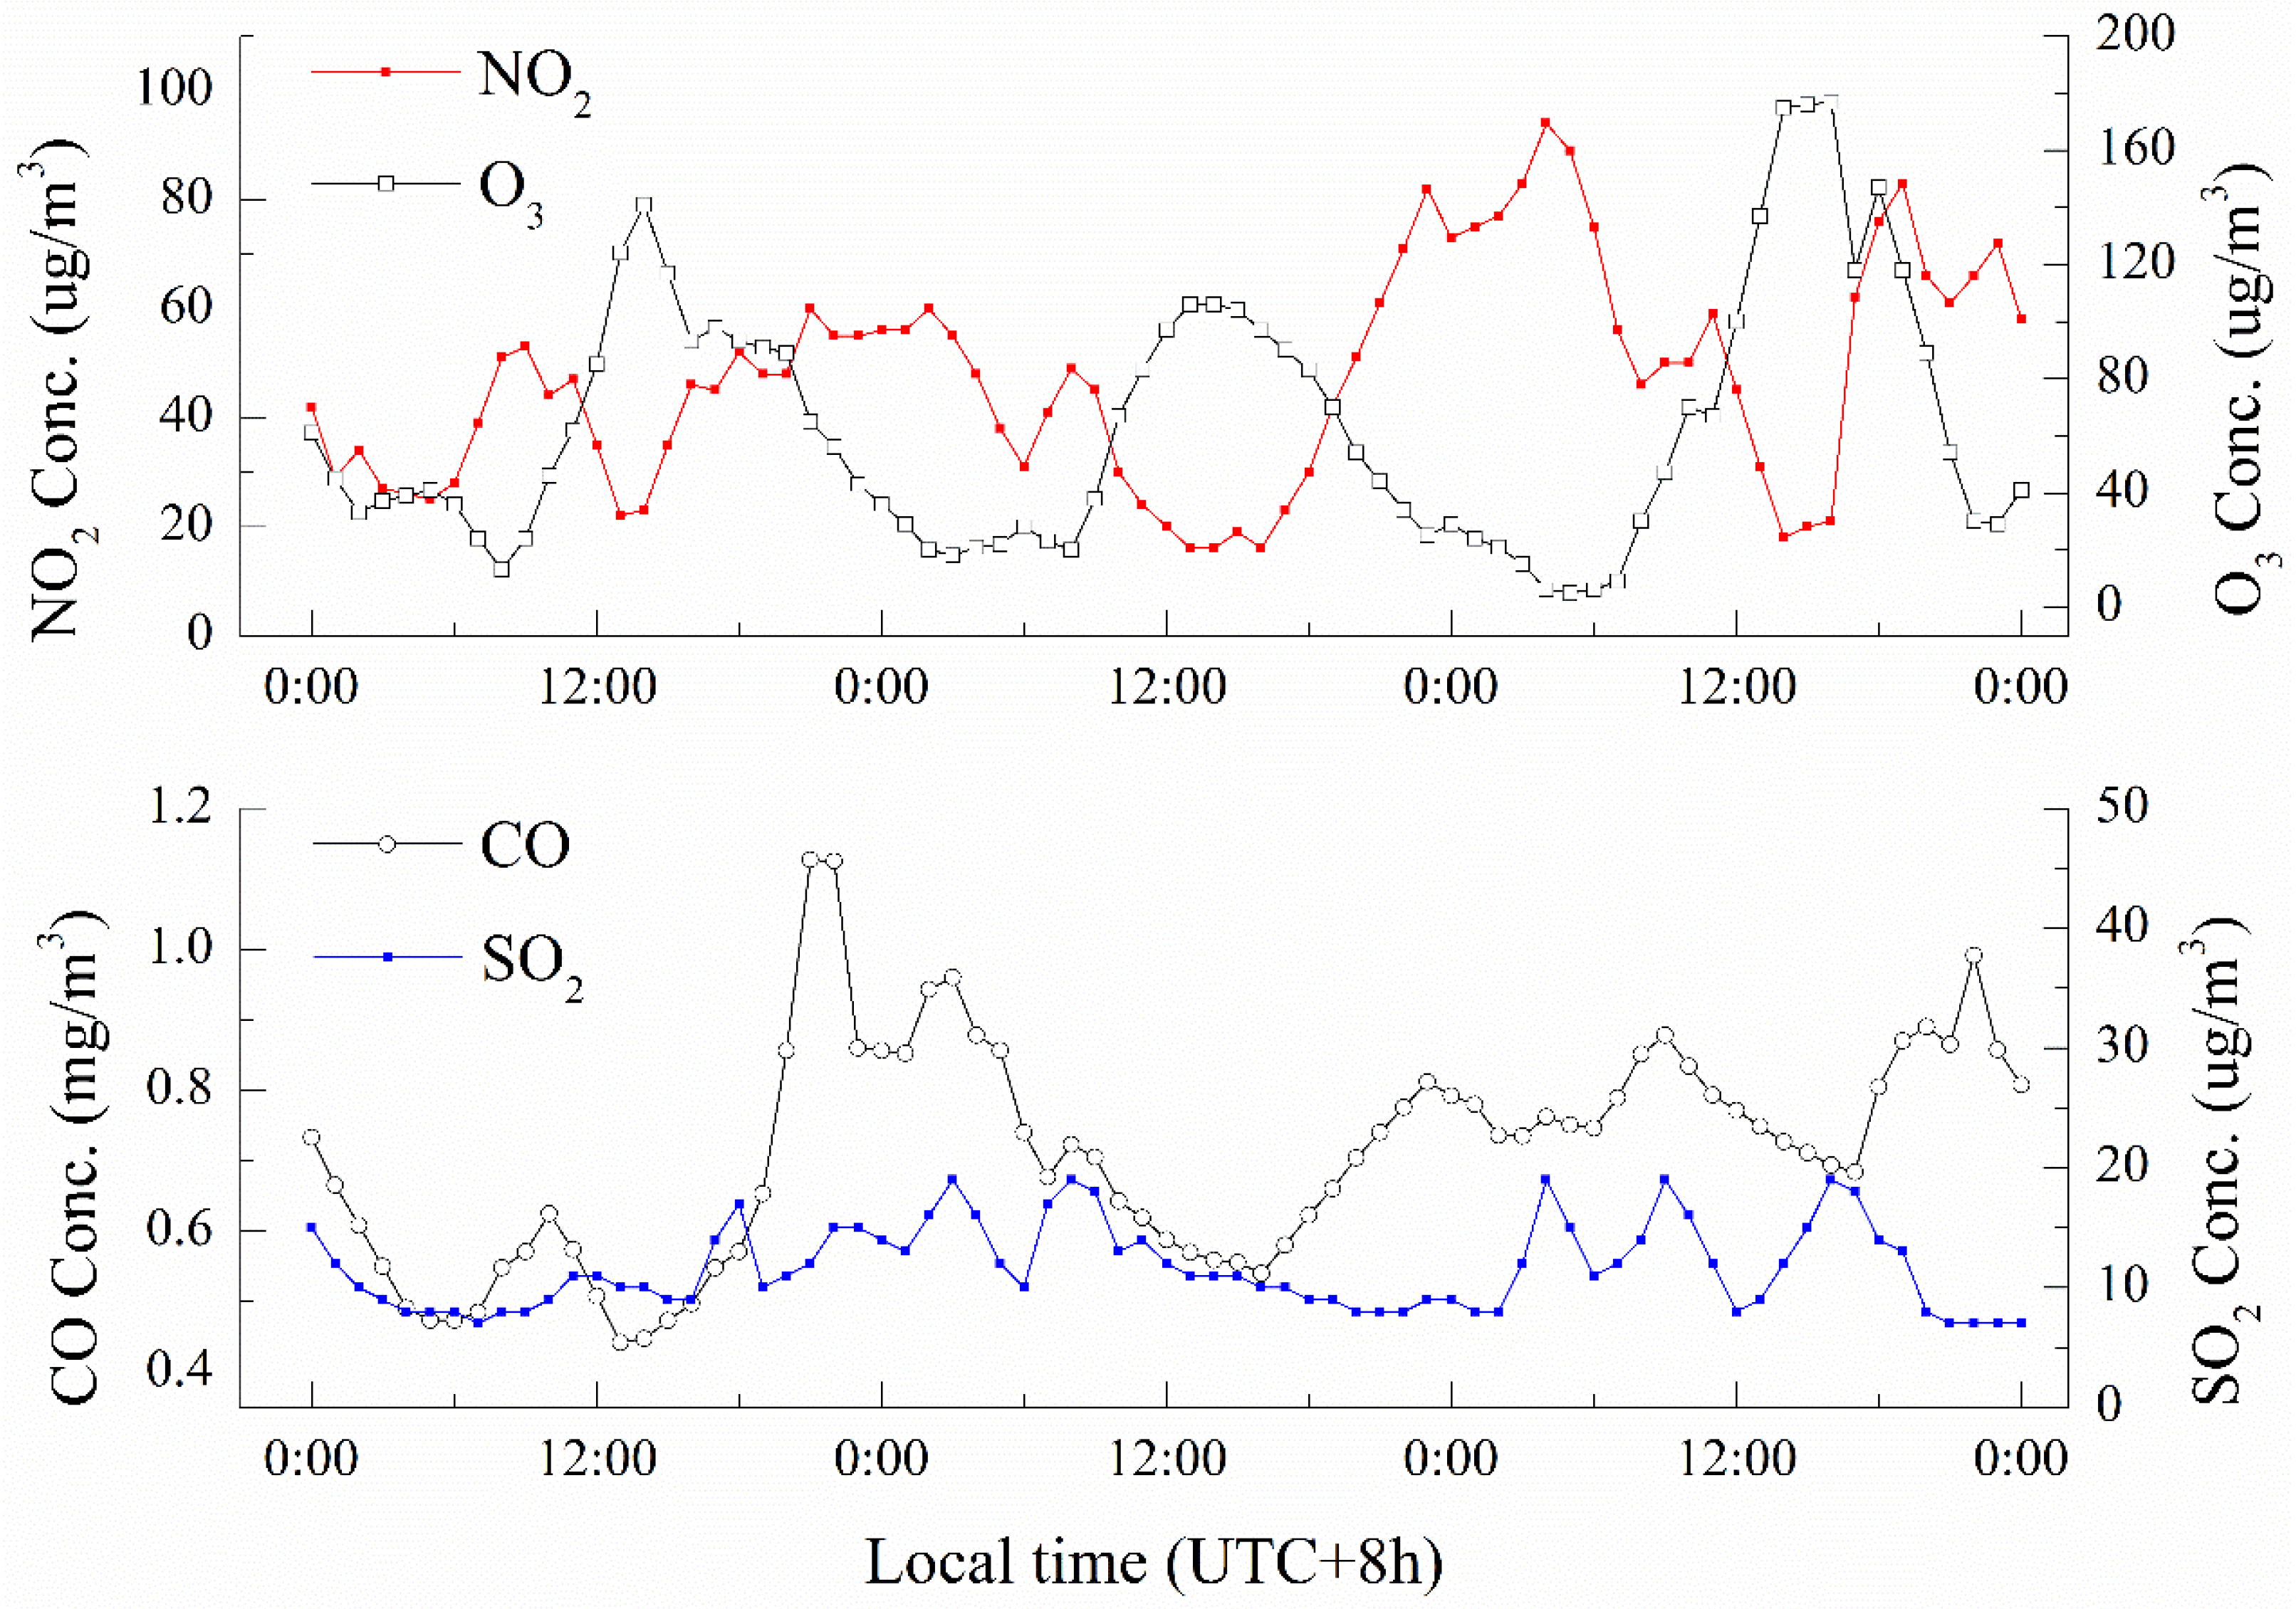
3.3. Diurnal Variability

As shown in Figure 7, the contour plot of the particle number concentration on three consecutive days in April was given to study the diurnal pattern of fine particles, completed with mass concentration of NO2, O3, CO and SO2 studied to obtain further insights into the mechanisms. During this experimental period, the weather was partly cloudy with a gentle breeze and no precipitation.
On a macro scale, the normalized number concentrations of particles in the size range of 20 to 200 nm clearly showed periodic variations, while the normalized number concentrations of particles larger than 200 nm remained relatively low. Particles of approximately 25 to 50 nm display a unimodal diurnal pattern during the 3 days, reaching a peak at noon every day, which is consistent with a study of particles in Pittsburg [11]. What should be noticed is that O3 behaves in a comparable manner, with mass concentrations peaking around 12:00, as Figure 8 indicates. Moreover, the mass concentration of NO2 showed opposite trends. It is known that O3 is generated via photochemical processes involving NO2 and O2 in the air, which may explain the increase of O3 subsequent to a decrease in NO2 in the morning. Therefore, the variations of O3 are linked to the intensity of light and the high mass concentrations of O3 may indicate a strong solar radiation. With the consideration that a strong photochemical process favors the formation and growth of secondary particles, the noon peak could probably be attributed to the nucleation process during which the nanoparticles become detectable via condensation or coagulation [32]. Since the diurnal mass concentrations of O3 are proportional to the number concentration of particles ranging from 25 to 50 nm, the mass concentration of O3 could potentially be used as an indicator of the number concentration of relevant particles.
Another finding from Figure 7 is the periodicity of the PNC for particles with a diameter of around 50 to 150 nm, which experienced a peak at midnight, even though the duration of this growth and the size range of involved particles varied slightly from one day to the other. Accordingly, the CO and NO2 showed a consistent diurnal profile with those particles, with mass concentrations peaking before 12 p.m. It is possible that industrial combustions at night emit these exhaust gas and contribute to the growth of relevant particle number concentrations. Since Wuhan is an industrial city relying on steelmaking in central China, the industrial combustion might have a significant impact on the PNC. The trace gas SO2 did not demonstrate apparent diurnal pattern or periodicity, might be caused by the disturbance of industrial activity. In general, it can be concluded that the industrial emission of pollutants at night might contribute to the burst of particles in large Aitken mode and small accumulation mode.

4. Conclusions

The number concentrations and size distribution of particles in the size range of 15–661 nm were measured for one year by the SMPS 3936 together with meteorological parameters including precipitation, temperature, mixing layer height and wind speed in Wuhan since June 2013. A case study of three-day continuous particle number concentrations was analyzed and revealed the characteristics of the diurnal variations of PNC. The analysis also included measurements of pollutant gases in order to identify the mechanisms driving the variability of the concentration of fine particles within different modes. Some conclusions can be drawn through analysis and discussion.
The annual averaged number concentrations of submicron particles in three size ranges reached 8083 cm−3, 11,193 cm−3 and 7801 cm−3, respectively, which is similar to previous study in Beijing. Fine particles reached the highest number concentrations in winter and the lowest in summer, regardless of their size range. Particles smaller than 110 nm dominated in all four seasons, and more markedly in winter and autumn, while the number concentration of particles smaller than 30 nm rose dramatically with decreasing diameter. This phenomenon was similar to previous researches in Pittsburg and Lanzhou. The phenomenon observed in autumn and winter was caused by the lack of convection, combined with heavy vehicular or burning emissions.
Monthly averaged number concentrations of particles in three size ranges formed a near-inverse parabolic distribution, reaching the highest value in January. The precipitation presents an opposite trend to that of the particle concentrations, supported by a significant negative correlation. It is likely that the washout of soluble particles caused by the abundant rainfall in summer could accounts for the noticeable drop in concentrations since Wuhan experiences a subtropical monsoon climate.
The temperature was negatively correlated with particle concentrations since high temperatures favor vertical convection, which in turn favors diffusion and dispersion. Moreover, the mixing layer height that evolves comparably with the temperature and determines the volume through which pollutants can be diluted demonstrates negative correlation with particle concentrations as well. Thus, the simultaneous high temperature and mixing layer height may directly affect the particle number concentrations.
The monthly averaged wind speed depicted a double-peak pattern during the experiment, with no significant correlation with particle concentrations. What should be noticed is that a relatively high wind speed could not only disperse the particulate matter, but also bring in exogenous aerosol, leading to an unclear change of direction of the particles number concentrations.
In the diurnal analysis, particles ranging from 25 to 50 nm in diameter displayed a unimodal distribution, peaking at noon, which is consistent with the diurnal profile of mass concentration of O3. Since O3 is the product of photochemical reactions affected by the strong solar radiation which is conductive to the formation and growth of secondary particles, O3 could be a relevant indicator of particle concentrations. Particles in the size ranges of 50 to 150 nm experienced increasing concentrations before midnight, like the CO and NO2 concentrations, which may be affected by industrial combustions around midnight given that Wuhan is an industrial city.
This study presents an analysis of the characteristics of particle number concentration and size distribution, completed with meteorological parameters and gaseous pollutants. Complementary studies, such as the chemical and optical properties of particulate matter, are in progress to precisely identify the sources of particles in different size ranges. The results of this study can provide references and guidelines for policymaking of emission control in the industrial cities of China.

Acknowledgments

This study was financially supported by the National Natural Science Foundation of China (No. 41101334, No. 41127901), China Postdoctoral Science Foundation (No. 2015M572198), and the Natural Science Foundation of Hubei (No. 2015CFA002). We express our sincere gratitude to the China Meteorological Administration in Wuhan for providing meteorological parameters.

Author Contributions

The study was carried out in collaboration between all authors. Tianhao Zhang and Zhongmin Zhu designed the research topic. Zhongmin Zhu conducted the experiment and wrote the paper. Wei Gong, Hao Xiang, Ying Li, and Zhenzhen Cui examined the experimental data and checked the experimental results. All authors agreed to submission of the manuscript.

Conflicts of Interest

The authors declare no conflict of interest.

References

  1. Charlson, R.J.; Schwartz, S.; Hales, J.; Cess, R.D.; Coakley, J.A., Jr.; Hansen, J.; Hofmann, D. Climate forcing by anthropogenic aerosols. Science 1992, 255, 423–430. [Google Scholar] [CrossRef] [PubMed]
  2. Ackerman, A.S.; Toon, O.; Stevens, D.; Heymsfield, A.; Ramanathan, V.; Welton, E. Reduction of tropical cloudiness by soot. Science 2000, 288, 1042–1047. [Google Scholar] [CrossRef] [PubMed]
  3. Koren, I.; Kaufman, Y.J.; Remer, L.A.; Martins, J.V. Measurement of the effect of amazon smoke on inhibition of cloud formation. Science 2004, 303, 1342–1345. [Google Scholar] [CrossRef] [PubMed]
  4. Stott, P.A.; Tett, S.; Jones, G.; Allen, M.; Mitchell, J.; Jenkins, G. External control of 20th century temperature by natural and anthropogenic forcings. Science 2000, 290, 2133–2137. [Google Scholar] [CrossRef] [PubMed]
  5. Ramanathan, V.; Crutzen, P.; Kiehl, J.; Rosenfeld, D. Aerosols, climate, and the hydrological cycle. Science 2001, 294, 2119–2124. [Google Scholar] [CrossRef] [PubMed]
  6. Rosenfeld, D.; Lohmann, U.; Raga, G.B.; O’Dowd, C.D.; Kulmala, M.; Fuzzi, S.; Reissell, A.; Andreae, M.O. Flood or drought: How do aerosols affect precipitation? Science 2008, 321, 1309–1313. [Google Scholar] [CrossRef] [PubMed]
  7. Coakley, J.A., Jr.; Cess, R.D.; Yurevich, F.B. The effect of tropospheric aerosols on the earth’s radiation budget: A parameterization for climate models. J. Atmos. Sci. 1983, 40, 116–138. [Google Scholar] [CrossRef]
  8. Gong, W.; Zhang, T.; Zhu, Z.; Ma, Y.; Ma, X.; Wang, W. Characteristics of PM1.0, PM2.5, and PM10, and their relation to black carbon in Wuhan, central China. Atmosphere 2015, 6, 1377–1387. [Google Scholar] [CrossRef]
  9. World Health Organization. Health Aspects of Air Pollution: Results from the WHO Project “Systematic Review of Health Aspects of Air Pollution in Europe”; WHO Regional Office for Europe: Copenhagen, Denmark, 2004. [Google Scholar]
  10. Karottki, D.G.; Spilak, M.; Frederiksen, M.; Jovanovic Andersen, Z.; Madsen, A.M.; Ketzel, M.; Massling, A.; Gunnarsen, L.; Møller, P.; Loft, S. Indoor and outdoor exposure to ultrafine, fine and microbiologically derived particulate matter related to cardiovascular and respiratory effects in a panel of elderly urban citizens. Int. J. Environ. Res. Public Health 2015, 12, 1667–1686. [Google Scholar] [CrossRef] [PubMed]
  11. Stanier, C.O.; Khlystov, A.Y.; Pandis, S.N. Ambient aerosol size distributions and number concentrations measured during the Pittsburgh Air Quality Study (PAQS). Atmos. Environ. 2004, 38, 3275–3284. [Google Scholar] [CrossRef]
  12. Kim, D.; Lim, K.; Xiang, R.; Lee, K. Design and performance evaluation of an aerosol separator. J. Aerosol Sci. 2002, 33, 1405–1415. [Google Scholar] [CrossRef]
  13. Jeong, C.-H.; Hopke, P.K.; Chalupa, D.; Utell, M. Characteristics of nucleation and growth events of ultrafine particles measured in Rochester, NY. Environ. Sci. Technol. 2004, 38, 1933–1940. [Google Scholar] [CrossRef] [PubMed]
  14. Gómez-Moreno, F.; Pujadas, M.; Plaza, J.; Rodríguez-Maroto, J.; Martínez-Lozano, P.; Artíñano, B. Influence of seasonal factors on the atmospheric particle number concentration and size distribution in Madrid. Atmos. Environ. 2011, 45, 3169–3180. [Google Scholar] [CrossRef]
  15. Wang, F.; Costabileb, F.; Li, H.; Fang, D.; Allegrini, I. Measurements of ultrafine particle size distribution near Rome. Atmos. Res. 2010, 98, 69–77. [Google Scholar] [CrossRef]
  16. Puustinen, A.; Hämeri, K.; Pekkanen, J.; Kulmala, M.; De Hartog, J.; Meliefste, K.; Ten Brink, H.; Kos, G.; Katsouyanni, K.; Karakatsani, A. Spatial variation of particle number and mass over four European cities. Atmos. Environ. 2007, 41, 6622–6636. [Google Scholar] [CrossRef]
  17. Li, X.; Wang, J.; Tu, X.; Liu, W.; Huang, Z. Vertical variations of particle number concentration and size distribution in a street canyon in Shanghai, China. Sci. Total Environ. 2007, 378, 306–316. [Google Scholar] [CrossRef] [PubMed]
  18. Wu, Z.; Hu, M.; Lin, P.; Liu, S.; Wehner, B.; Wiedensohler, A. Particle number size distribution in the urban atmosphere of Beijing, China. Atmos. Environ. 2008, 42, 7967–7980. [Google Scholar] [CrossRef]
  19. Zhao, S.; Yu, Y.; Yin, D.; He, J. Meteorological dependence of particle number concentrations in an urban area of complex terrain, Northwestern China. Atmos. Res. 2015, 164, 304–317. [Google Scholar] [CrossRef]
  20. Zhu, Y.; Hinds, W.C.; Kim, S.; Sioutas, C. Concentration and size distribution of ultrafine particles near a major highway. J. Air Waste Manag. Assoc. 2002, 52, 1032–1042. [Google Scholar] [CrossRef] [PubMed]
  21. Charron, A.; Harrison, R.M. Primary particle formation from vehicle emissions during exhaust dilution in the roadside atmosphere. Atmos. Environ. 2003, 37, 4109–4119. [Google Scholar] [CrossRef]
  22. Wehner, B.; Birmili, W.; Gnauk, T.; Wiedensohler, A. Particle number size distributions in a street canyon and their transformation into the urban-air background: Measurements and a simple model study. Atmos. Environ. 2002, 36, 2215–2223. [Google Scholar] [CrossRef]
  23. Morawska, L.; Jayaratne, E.; Mengersen, K.; Jamriska, M.; Thomas, S. Differences in airborne particle and gaseous concentrations in urban air between weekdays and weekends. Atmos. Environ. 2002, 36, 4375–4383. [Google Scholar] [CrossRef] [Green Version]
  24. Liu, S.; Hu, M.; Wu, Z.; Wehner, B.; Wiedensohler, A.; Cheng, Y. Aerosol number size distribution and new particle formation at a rural/coastal site in Pearl River Delta (PRD) of China. Atmos. Environ. 2008, 42, 6275–6283. [Google Scholar] [CrossRef]
  25. History Weather Records in Wuhan, National Meteorological Information Center of China. Available online: http://www.tianqihoubao.com/lishi/wuhan.html (accessed on 22 July 2016).
  26. Fischer, B.; Joffre, S.; Kukkonen, J.; Pringe, M.; Rotach, M.; Schatzmann, M. Meteorology Applied to Urban Air Pollution Problems, Final Report Cost Action 715; OPEC: Luxembourg, 1999. [Google Scholar]
  27. Finlayson-Pitts, B.J.; Pitts, J.N., Jr. Chemistry of the Upper and Lower Atmosphere: Theory, Experiments, and Applications; Academic Press: San Diego, CA, USA, 1999. [Google Scholar]
  28. Hussein, T.; Karppinen, A.; Kukkonen, J.; Härkönen, J.; Aalto, P.P.; Hämeri, K.; Kerminen, V.-M.; Kulmala, M. Meteorological dependence of size-fractionated number concentrations of urban aerosol particles. Atmos. Environ. 2006, 40, 1427–1440. [Google Scholar] [CrossRef]
  29. Chate, D.; Murugavel, P.; Ali, K.; Tiwari, S.; Beig, G. Below-cloud rain scavenging of atmospheric aerosols for aerosol deposition models. Atmo. Res. 2011, 99, 528–536. [Google Scholar] [CrossRef]
  30. Tiwari, S.; Bisht, D.; Srivastava, A.; Pipal, A.; Taneja, A.; Srivastava, M.; Attri, S. Variability in atmospheric particulates and meteorological effects on their mass concentrations over Delhi, India. Atmos. Res. 2014, 145, 45–56. [Google Scholar] [CrossRef]
  31. Gao, J.; Chai, F.; Wang, T.; Wang, W. Particle number size distribution and new particle formation (NPF) in Lanzhou, western China. Particuology 2011, 9, 611–618. [Google Scholar] [CrossRef]
  32. Jian, G.; Jin, W.; Cheng, S.-H.; Xue, L.-K.; Yan, H.-Z.; Hou, L.-J.; Jiang, Y.-Q.; Wang, W.-X. Number concentration and size distributions of submicron particles in Jinan urban area: Characteristics in summer and winter. J. Environ. Sci. 2007, 19, 1466–1473. [Google Scholar]
  33. Birmili, W.; Wiedensohler, A.; Heintzenberg, J.; Lehmann, K. Atmospheric particle number size distribution in central Europe-statistical relations to air masses and meteorology. J. Geophys. Res. D. Atmos. 2001, 106, 32. [Google Scholar] [CrossRef]
  34. Emanuel, K.A. Atmospheric Convection; Oxford University Press: New York, NY, USA, 1994. [Google Scholar]
  35. Fernando, H.J.; Chen, R.-R.; Boyer, D.L. Effects of rotation on convective turbulence. J. Fluid Mech. 1991, 228, 513–547. [Google Scholar] [CrossRef]
  36. Canuto, V.; Mazzitelli, I. Stellar turbulent convection—A new model and applications. Astrophys. J. 1991, 370, 295–311. [Google Scholar] [CrossRef]
  37. Castro, A.; Alonso-Blanco, E.; González-Colino, M.; Calvo, A.I.; Fernández-Raga, M.; Fraile, R. Aerosol size distribution in precipitation events in León, Spain. Atmos. Res. 2010, 96, 421–435. [Google Scholar] [CrossRef]
Figure 1. Location of the sampling site: (a) location of Hubei Province, China; (b) location of Wuhan in Hubei Province and (c) location of the experimental site in Wuhan.
Atmosphere 07 00096 g001
Figure 2. Number size distribution of fine particles in four seasons.
Atmosphere 07 00096 g002
Figure 3. Monthly averaged number concentration of particles in three modes and monthly pattern of precipitation.
Atmosphere 07 00096 g003
Figure 4. Monthly averaged number concentration of particles in three modes and monthly pattern of temperature.
Atmosphere 07 00096 g004
Figure 5. Monthly averaged number concentration of particles in three modes and monthly pattern of mixing layer height.
Atmosphere 07 00096 g005
Figure 6. Monthly averaged number concentration of particles in three modes and monthly pattern of wind speed.
Atmosphere 07 00096 g006
Figure 7. Contour plot of size distribution of number concentration on three consecutive days based on particle diameter (color bar scale: d N / dlog   D p in cm−3).
Atmosphere 07 00096 g007
Figure 8. Diurnal variations in trace gases concentrations (NO2, O3, CO and SO2).
Atmosphere 07 00096 g008
Table 1. Pearson correlation coefficients between particle concentrations in three modes and meteorological parameters.
Correlation Coefficient15–30 nm30–110 nm110–665 nm
Precipitation−0.557−0.656 *−0.618 *
Temperature−0.622 *−0.740 **−0.610 *
Mixing Layer Height−0.594 *−0.909 **−0.657 *
Wind Speed−0.487−0.515−0.531
The * means significance of p < 0.05, the ** means significance of p < 0.01.

