Article

Investigation of the Optical Properties of Aerosols over the Coastal Region at Dalian, Northeast China

1
Institute of Atmospheric Environment, China Meteorological Administration, Shenyang 110016, China
2
Key Laboratory for Atmospheric Chemistry, Institute of Atmospheric Composition, Chinese Academy of Meteorological Sciences (CMA), 46 Zhongguancun South Avenue, Beijing 100081, China
3
State Key Laboratory of Severe Weather (LASW) and Institute of Atmospheric Composition, Chinese Academy of Meteorological Sciences (CMA), 46 Zhongguancun South Avenue, Beijing 100081, China
*
Author to whom correspondence should be addressed.
Atmosphere 2016, 7(8), 103; https://doi.org/10.3390/atmos7080103
Submission received: 30 June 2016 / Revised: 29 July 2016 / Accepted: 2 August 2016 / Published: 5 August 2016

Abstract

:
Measurements of the aerosol optical depth (AOD) and the Ångström exponent were retrieved from level 1.5 data obtained by the CE318 sun photometer at Dalian monitoring station from April 2007 to April 2012 to characterize the aerosol spatial and temporal characteristics in this coastal region of Northeast China. The results suggest that the highest mean ± SD value for the AOD over Dalian occurred in the month of July (0.86 ± 0.45), whereas a lower value was observed in the month of January (0.42 ± 0.31). The monthly mean Ångström exponent was at a maximum (about 1.27) in September and October and the minimum value of about 0.60 was recorded in March. The frequency distributions of the AOD and Ångström exponent at Dalian both presented a single peak distribution, with peak values of 0.26 and 1.06, respectively. The scatter grams of the AOD and Ångström exponent suggested that the aerosol size in Dalian was affected by both fine and coarse particles in different seasons. The spectral difference in Ångström exponent wavelength pairs between 440–675 and 675–870 nm indicate that high AOD440 nm values (>1.50) could be clearly identified by the fine mode growth in summer and the addition of coarse mode particles in spring over Dalian. The AOD440 nm value on a foggy day was almost 2.15 times larger than that on a day with high levels of dust. The Ångström exponents (440–870 nm) were about 0.13 and 1.46 on the days with high levels of dust and on the foggy days, respectively.

1. Introduction

Aerosols play an important part in controlling the Earth’s climate because they both absorb and scatter solar radiation. These processes directly affect the radiation balance between the Earth’s surface and the atmosphere and also indirectly affect the climate by their influence on the microphysical processes that take place in clouds [1,2,3,4]. Aerosol particles contribute to various environmental problems and can affect the health of the human population [5,6,7]. The effects of the optical properties of aerosols on the Earth’s climate have been reported previously [8].
The optical properties of aerosols are important in research on the effects of aerosols on the global climate and in predictions of global climate change [9,10,11,12]. The long-term ground-based monitoring of aerosols is necessary to determine their optical properties [13,14,15,16,17,18]. Networks of ground-based measurements, such as AERONET [19], PHOTONS [20], AEROCAN [21], SKYNET [22] and EARLINET [23] have been established worldwide, including several automated sites in China. The China Aerosol Remote Sensing NET work (CARSNET) and the Chinese Sun Haze meter Network (CSHNET) were established to derive the optical properties of aerosols from ground-based remote sensing data [24,25,26,27].
The majority of the progress made in determining the optical properties of aerosols in China has focused on cities experiencing rapid economic growth and highly polluted regions characterized by high aerosol loads [28,29,30,31,32,33,34,35]. However, few studies have been reported using ground-based measurements of the optical properties of aerosols over Northeast China [36,37,38,39]. Zhao [40,41] described the distribution and variation in the optical properties of aerosols over urban sites in Northeast China and Wang [42] analyzed the optical properties of aerosols over the regional background in Northeast China. Wu [43,44] studied the optical properties of column aerosols at a semi-arid rural site in Northeast China.
Studies using ground-based recordings of the optical properties of aerosols in the coastal regions of Northeast China are sparse; analyses of the optical properties of aerosols in coastal regions have been focused in south and southeast China [45,46,47,48]. As Figure 1 shows, Dalian is an important economic, trade, port, industrial and tourist city on the eastern coast of China in the hinterland of Northeast China (the Huang Bohai coast). This region is the warmest place in Northeast China, with a typical oceanic warm temperate zone continental monsoon climate. Previous aerosol studies at Dalian have focused on the chemical composition of aerosol particles during snow or rain [49,50,51]. A study of the optical properties of aerosols in the coastal region of Northeast China will provide a comparison with measurements from more urban areas and regions with higher levels of pollution.
The aim of this work was to investigate the variation in the optical properties of aerosols based on five years of continuous measurements using data from the CE-318 sun photometer at Dalian monitoring station. A graphical method was used to characterize the growth of fine particles and the addition of coarse particles. The results could be representative of the characteristics of aerosols for the coastal region of Northeast China and could aid our understanding of the effects of aerosols on the climate in Northeast China.

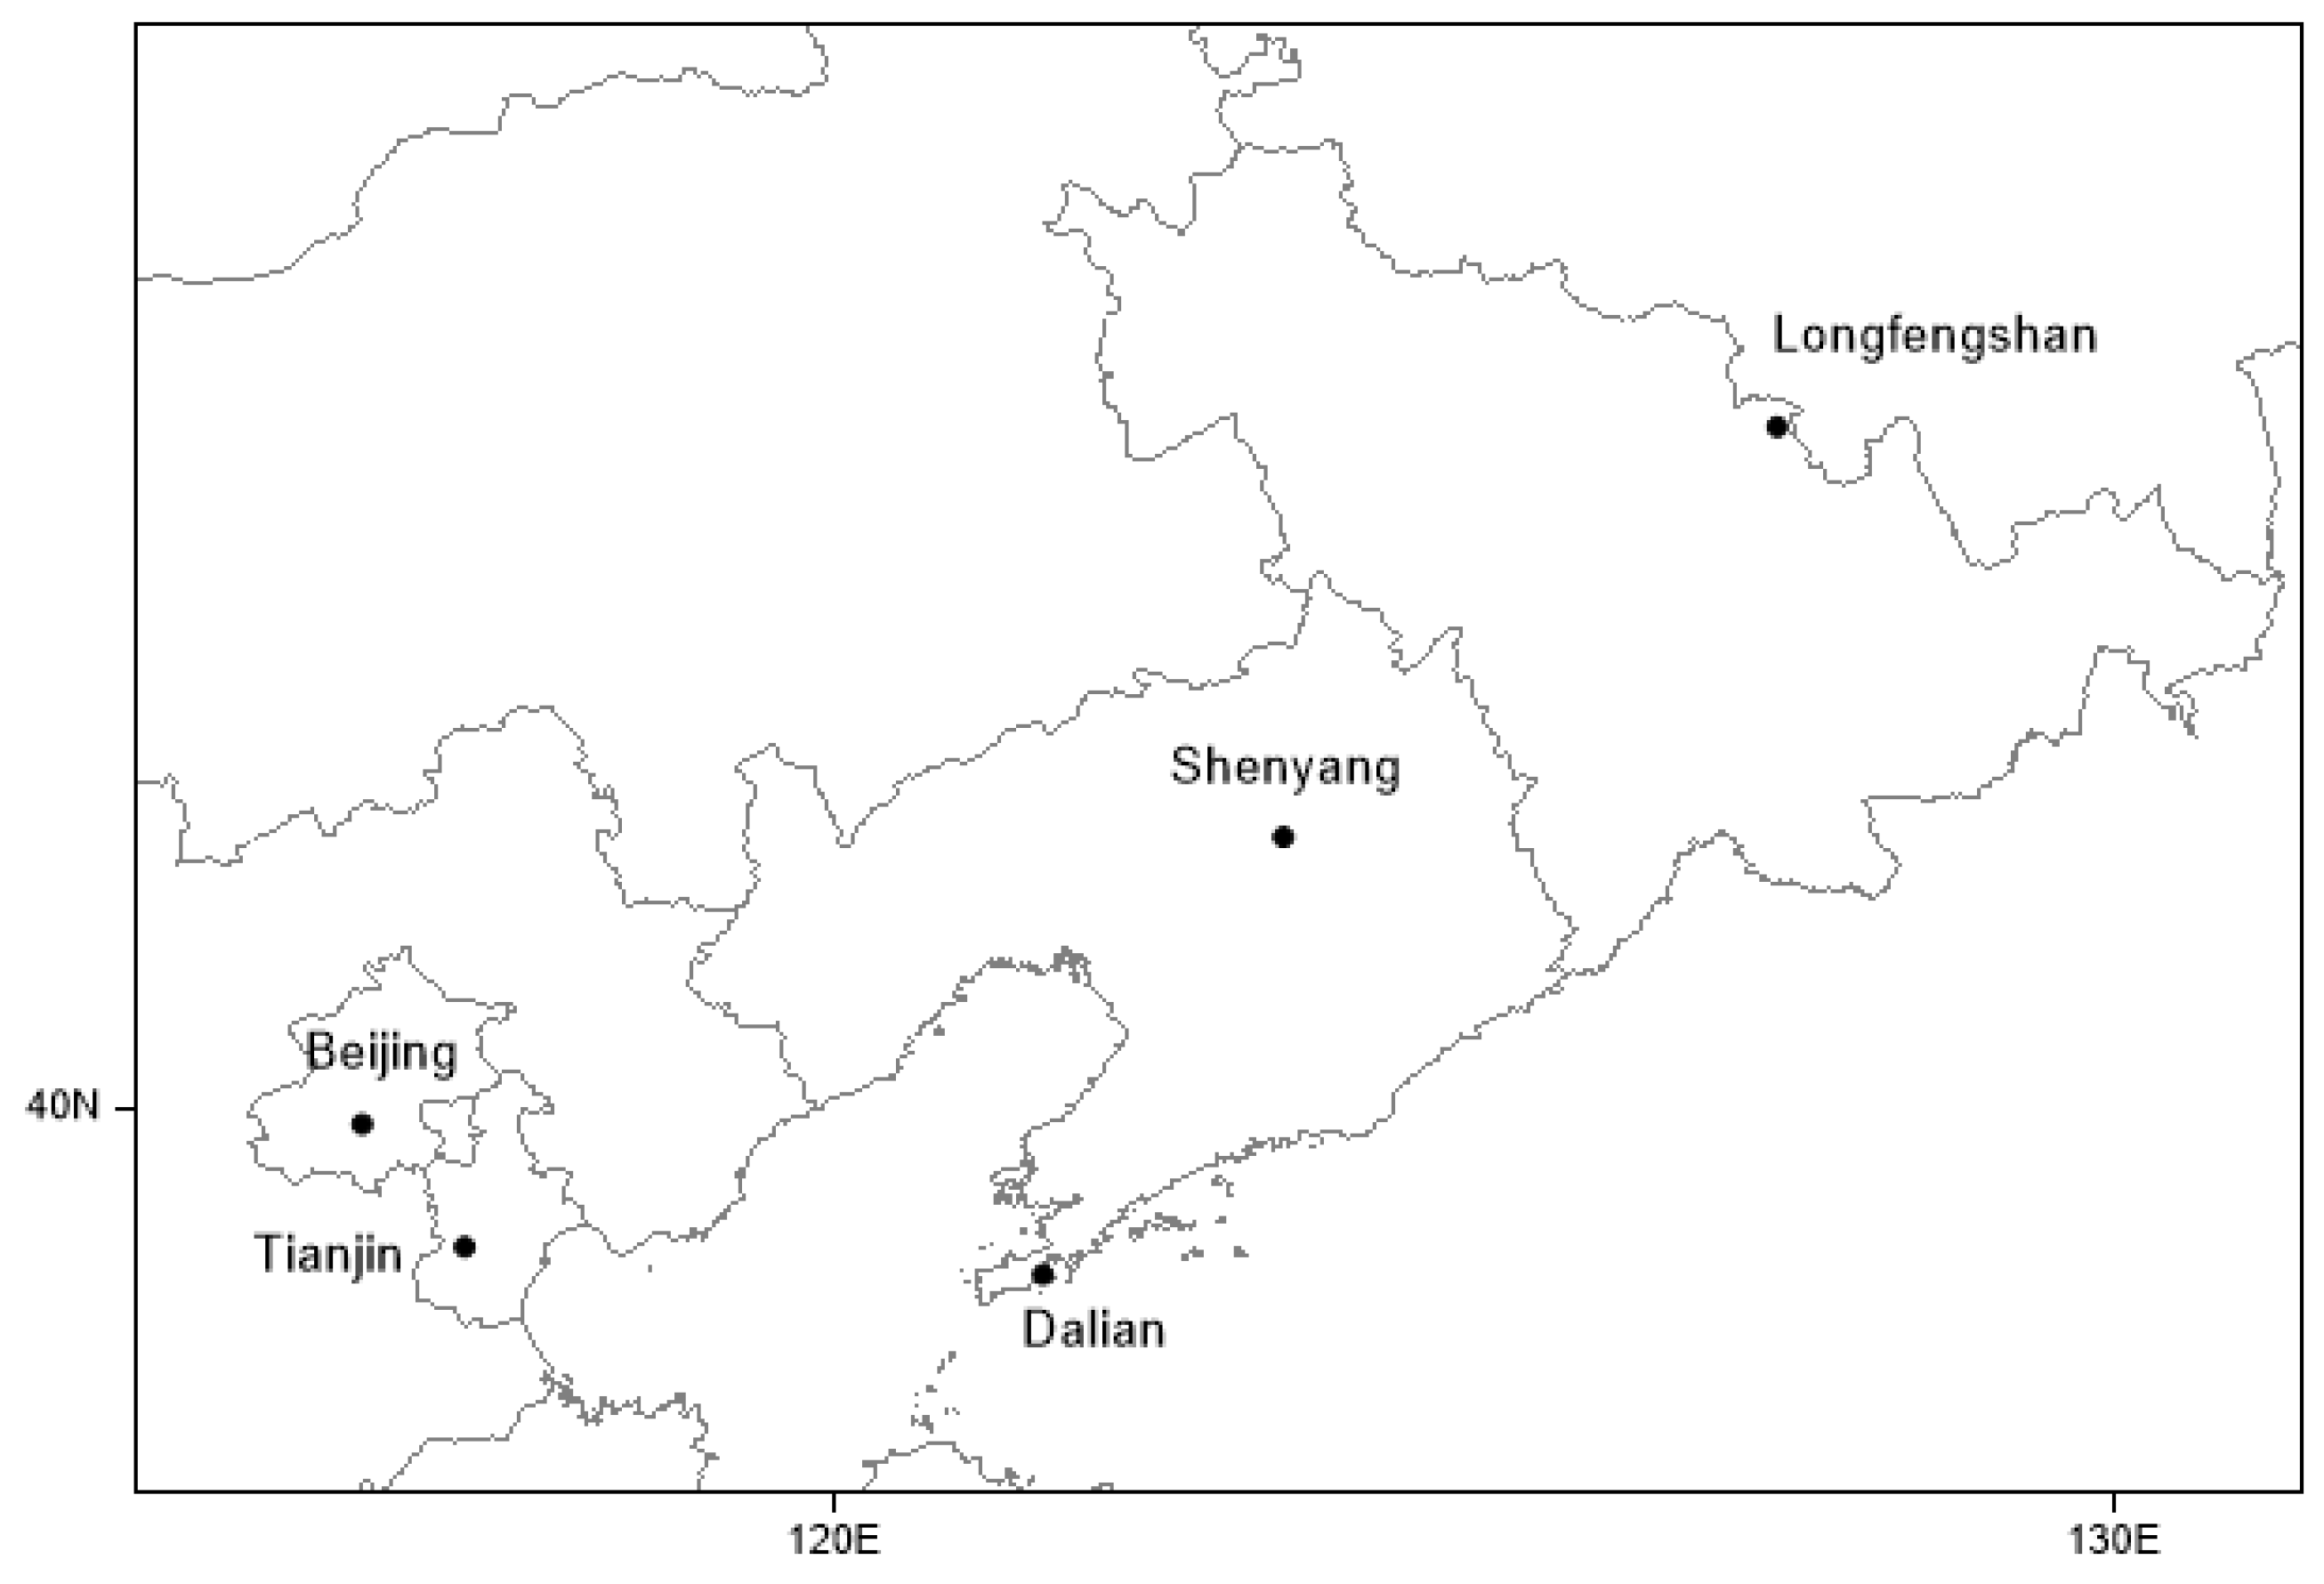
2. Site, Instrument and Data

Dalian is a coastal monitoring station in Northeast China and is located in the south of Liaodong Peninsula at (121.44–121.49°E, 39.01–39.04°N) (Figure 1). Measurement data obtained in this region could be representative of the coastal aerosol loading in Northeast China because there is little effect from urban sources of pollution such as vehicle emissions.
This study used data from the CE-318 sun photometer installed at Dalian monitoring station, which is calibrated annually using the procedure described by Holben [19], Che [24] and Tao [52] to verify the accuracy and reliability of the data. The CE-318 sun photometer (CIMEL Electronique, Paris, France) in Dalian is the AERONET type of instrument and the measurements include direct solar irradiance by the sun direct channel and the sky radiance by the sky scattering channel. The measurements through the sun direct channel are used to calculate the aerosol optical depth (AOD) in this paper. The level 1.5 (cloud-screened) aerosol optical depth (AOD) data obtained at different wavelengths from April 2007 to April 2012 were processed using ASTPwin software (Cimel Ltd Co, Paris, France) based on the work of Smirnov [53]. The Ångström exponents were derived from instantaneous data for the AOD between 440 and 870 nm. The instantaneous data is the temporal resolution of data about 3 min of sun direct data selected >10 times per day in this paper. The observations were not continuous because of the effect of cloud contamination and the cloud screening. Daily AOD data (obtained >10 times per day) were used for the statistical analysis and monthly AOD data were obtained by averaging all the days of a given month independently of the year (Table 1).
The PM10 and meteorological data (wind speed, temperature and relative humidity) were measured at Dalian monitoring station, which makes a better summary of the atmosphere in this typical coastal site. Each year was divided into four seasons (spring, March to May; summer, June to August; autumn, September to November; and winter, December to February) to investigate the seasonal variation in the optical properties of aerosols in this region. The spectral difference in Ångström exponent wavelength pairs between 440–675 and 675–870 nm was used to indicate the effective radius of the fine aerosols [54].

3. Results and Discussion

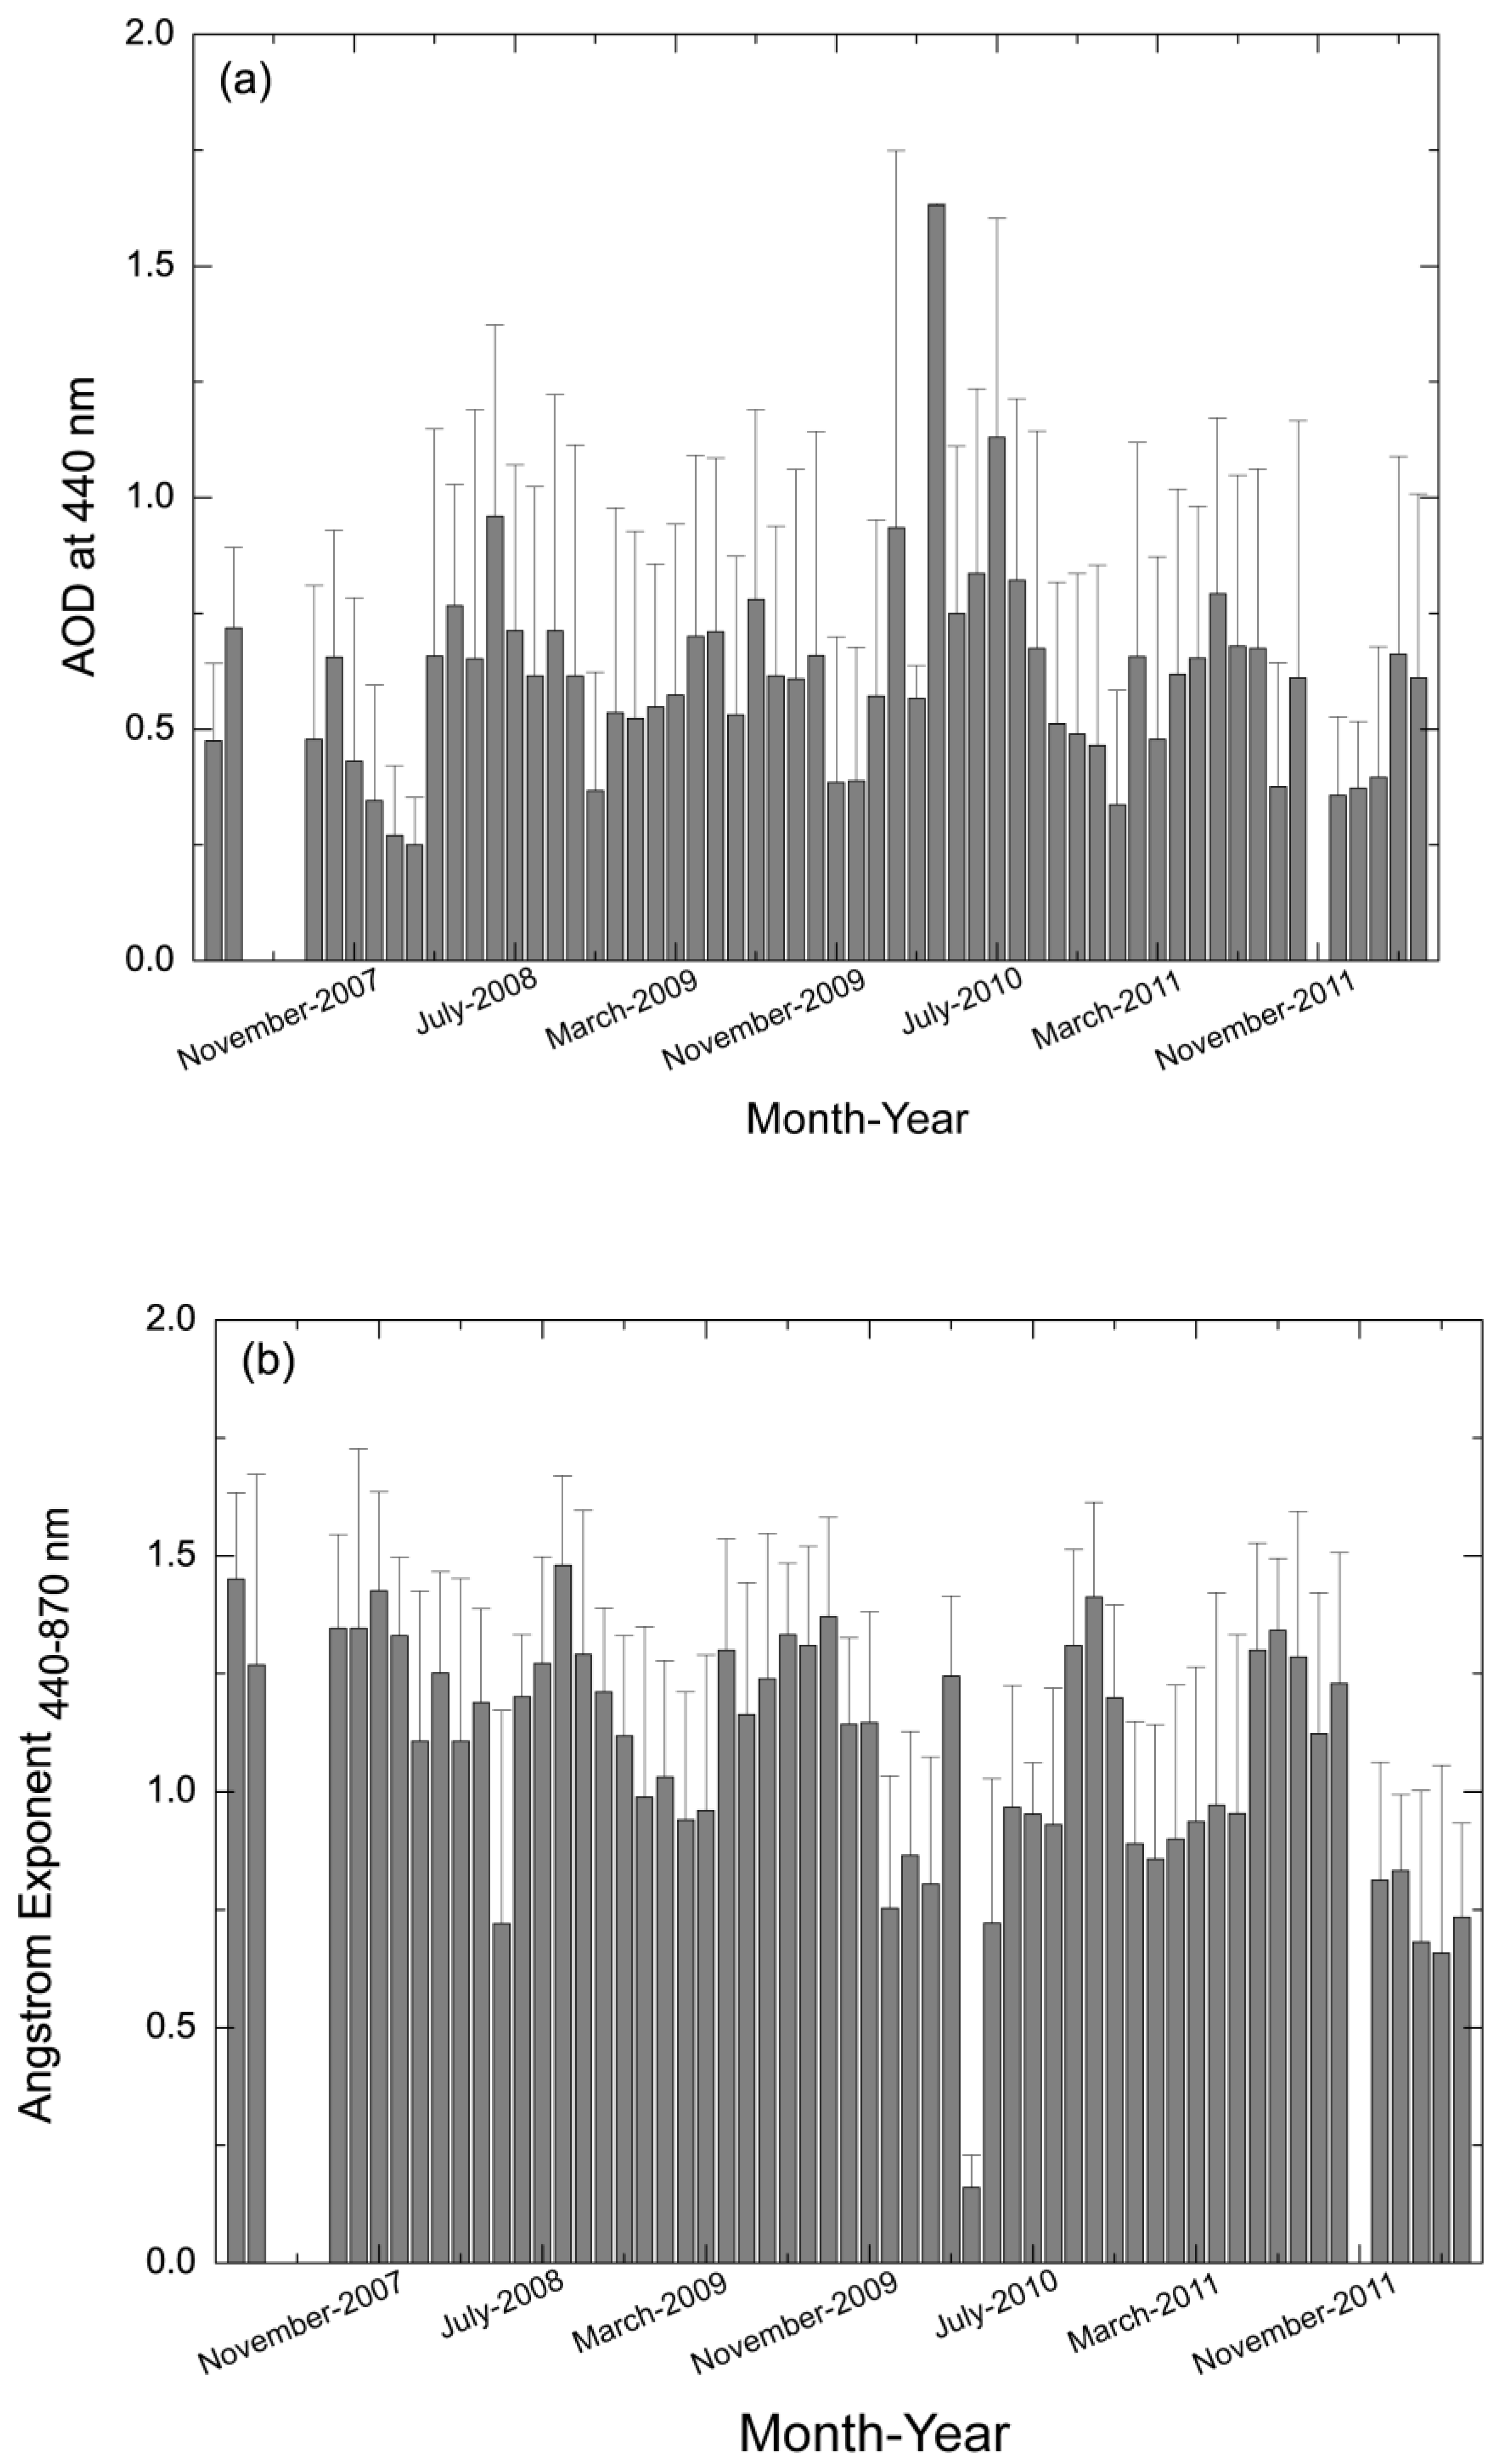
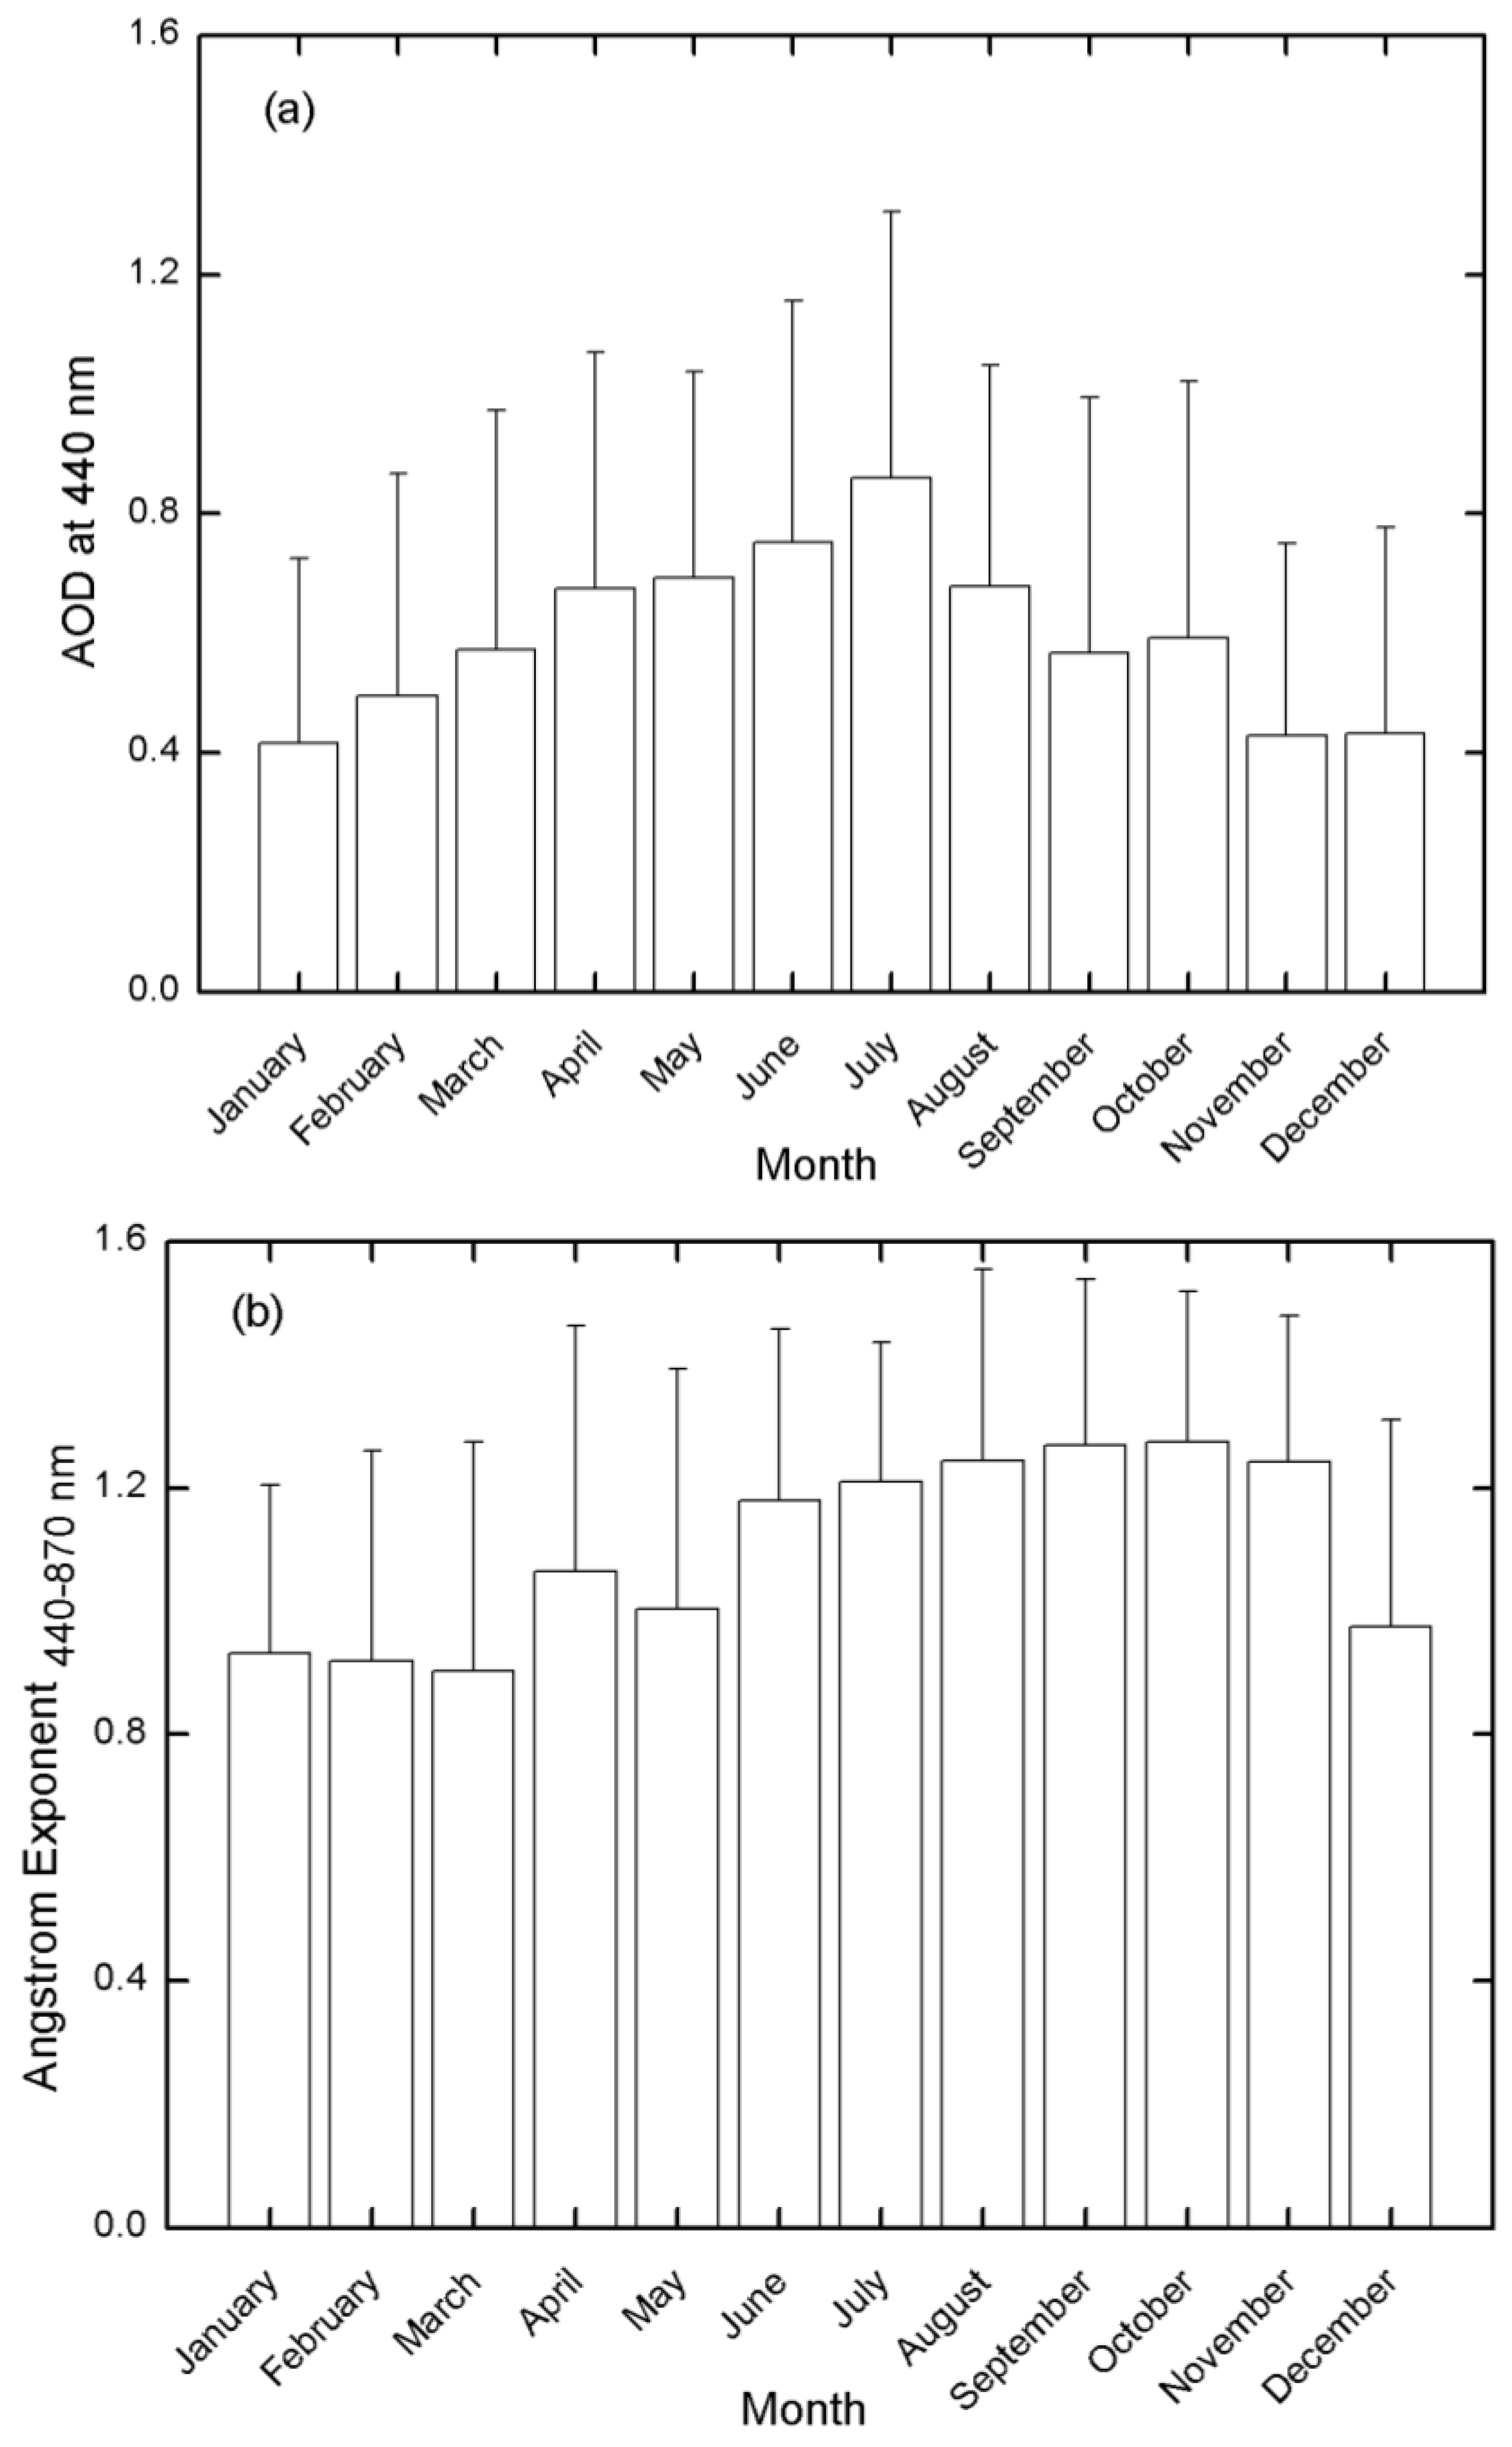
3.1. Annual and Monthly Variations in the AOD and Ångström Exponent

Figure 2a,b show the values of the annual mean AOD440 nm and Ångström exponent (440–870 nm) from April 2007 to April 2012 at Dalian monitoring station. The annual mean ± SD (standard deviation) values of the AOD440 nm were 0.58 ± 0.43, 0.60 ± 0.38, 0.69 ± 0.44 and 0.56 ± 0.39 in 2008, 2009, 2010 and 2011, respectively. The annual mean ± SD Ångström exponents were 1.17 ± 0.30, 1.14 ± 0.30, 1.05 ± 0.33 and 1.04 ± 0.36 in 2008, 2009, 2010 and 2011, respectively, which suggests that the area around the Dalian monitoring station was mainly dominated by small particles. The multi-year average AOD440 nm at Dalian was about 0.59 ± 0.40, which was lower than at other coastal sites in China, such as Tianjin (0.74), Nanjing (0.89), Hangzhou (1.01), Pudong (0.80), Panyu (0.78) and Nanning (0.82), reported by Che [25]. The lower aerosol loading at Dalian suggests that rapid economic development and other anthropogenic activities have less effect on this coastal region of Northeast China than in other Chinese coastal cities, which often have serious atmospheric pollution from particulate matter.
Figure 3a shows the mean annual cycle of monthly variations in the mean ± SD values of the AOD440 nm at Dalian monitoring station and Figure 3b shows the monthly variations in the Ångström exponent (440–870 nm). The peak value of AOD440 nm was 0.86 ± 0.45 in July and the minimum value (0.42 ± 0.31) was recorded in January. The higher AOD440 nm values from June to July may be related to the high levels of water vapor in the atmosphere in these months as a result of higher levels of precipitation. Cao [55] indicated that the aerosol extinction in Dalian was mainly due to the higher relative humidity. The decrease in the AOD440 nm values from November to January could be a result of the exchange of air between urban areas and the surrounding ocean caused by an influx of cold air, which could accelerate the diffusion of pollutants during this winter period according to the geographical features of Dalian descript by Guo [56]. In contrast with the variation in the AOD440 nm values, the highest monthly average Ångström exponent (440–870 nm) of about 1.27 was recorded in September and October, indicating the dominance of fine particles. The lowest value of about 0.90 ± 0.37 was recorded in March and indicated the existence of larger aerosol particles derived from dust events in this region. The results of Song [57] show that the sand dust weather process affecting Dalian could increase the particle concentration remarkably based on the aerosol extinction coefficient derived from Lidar observational data.

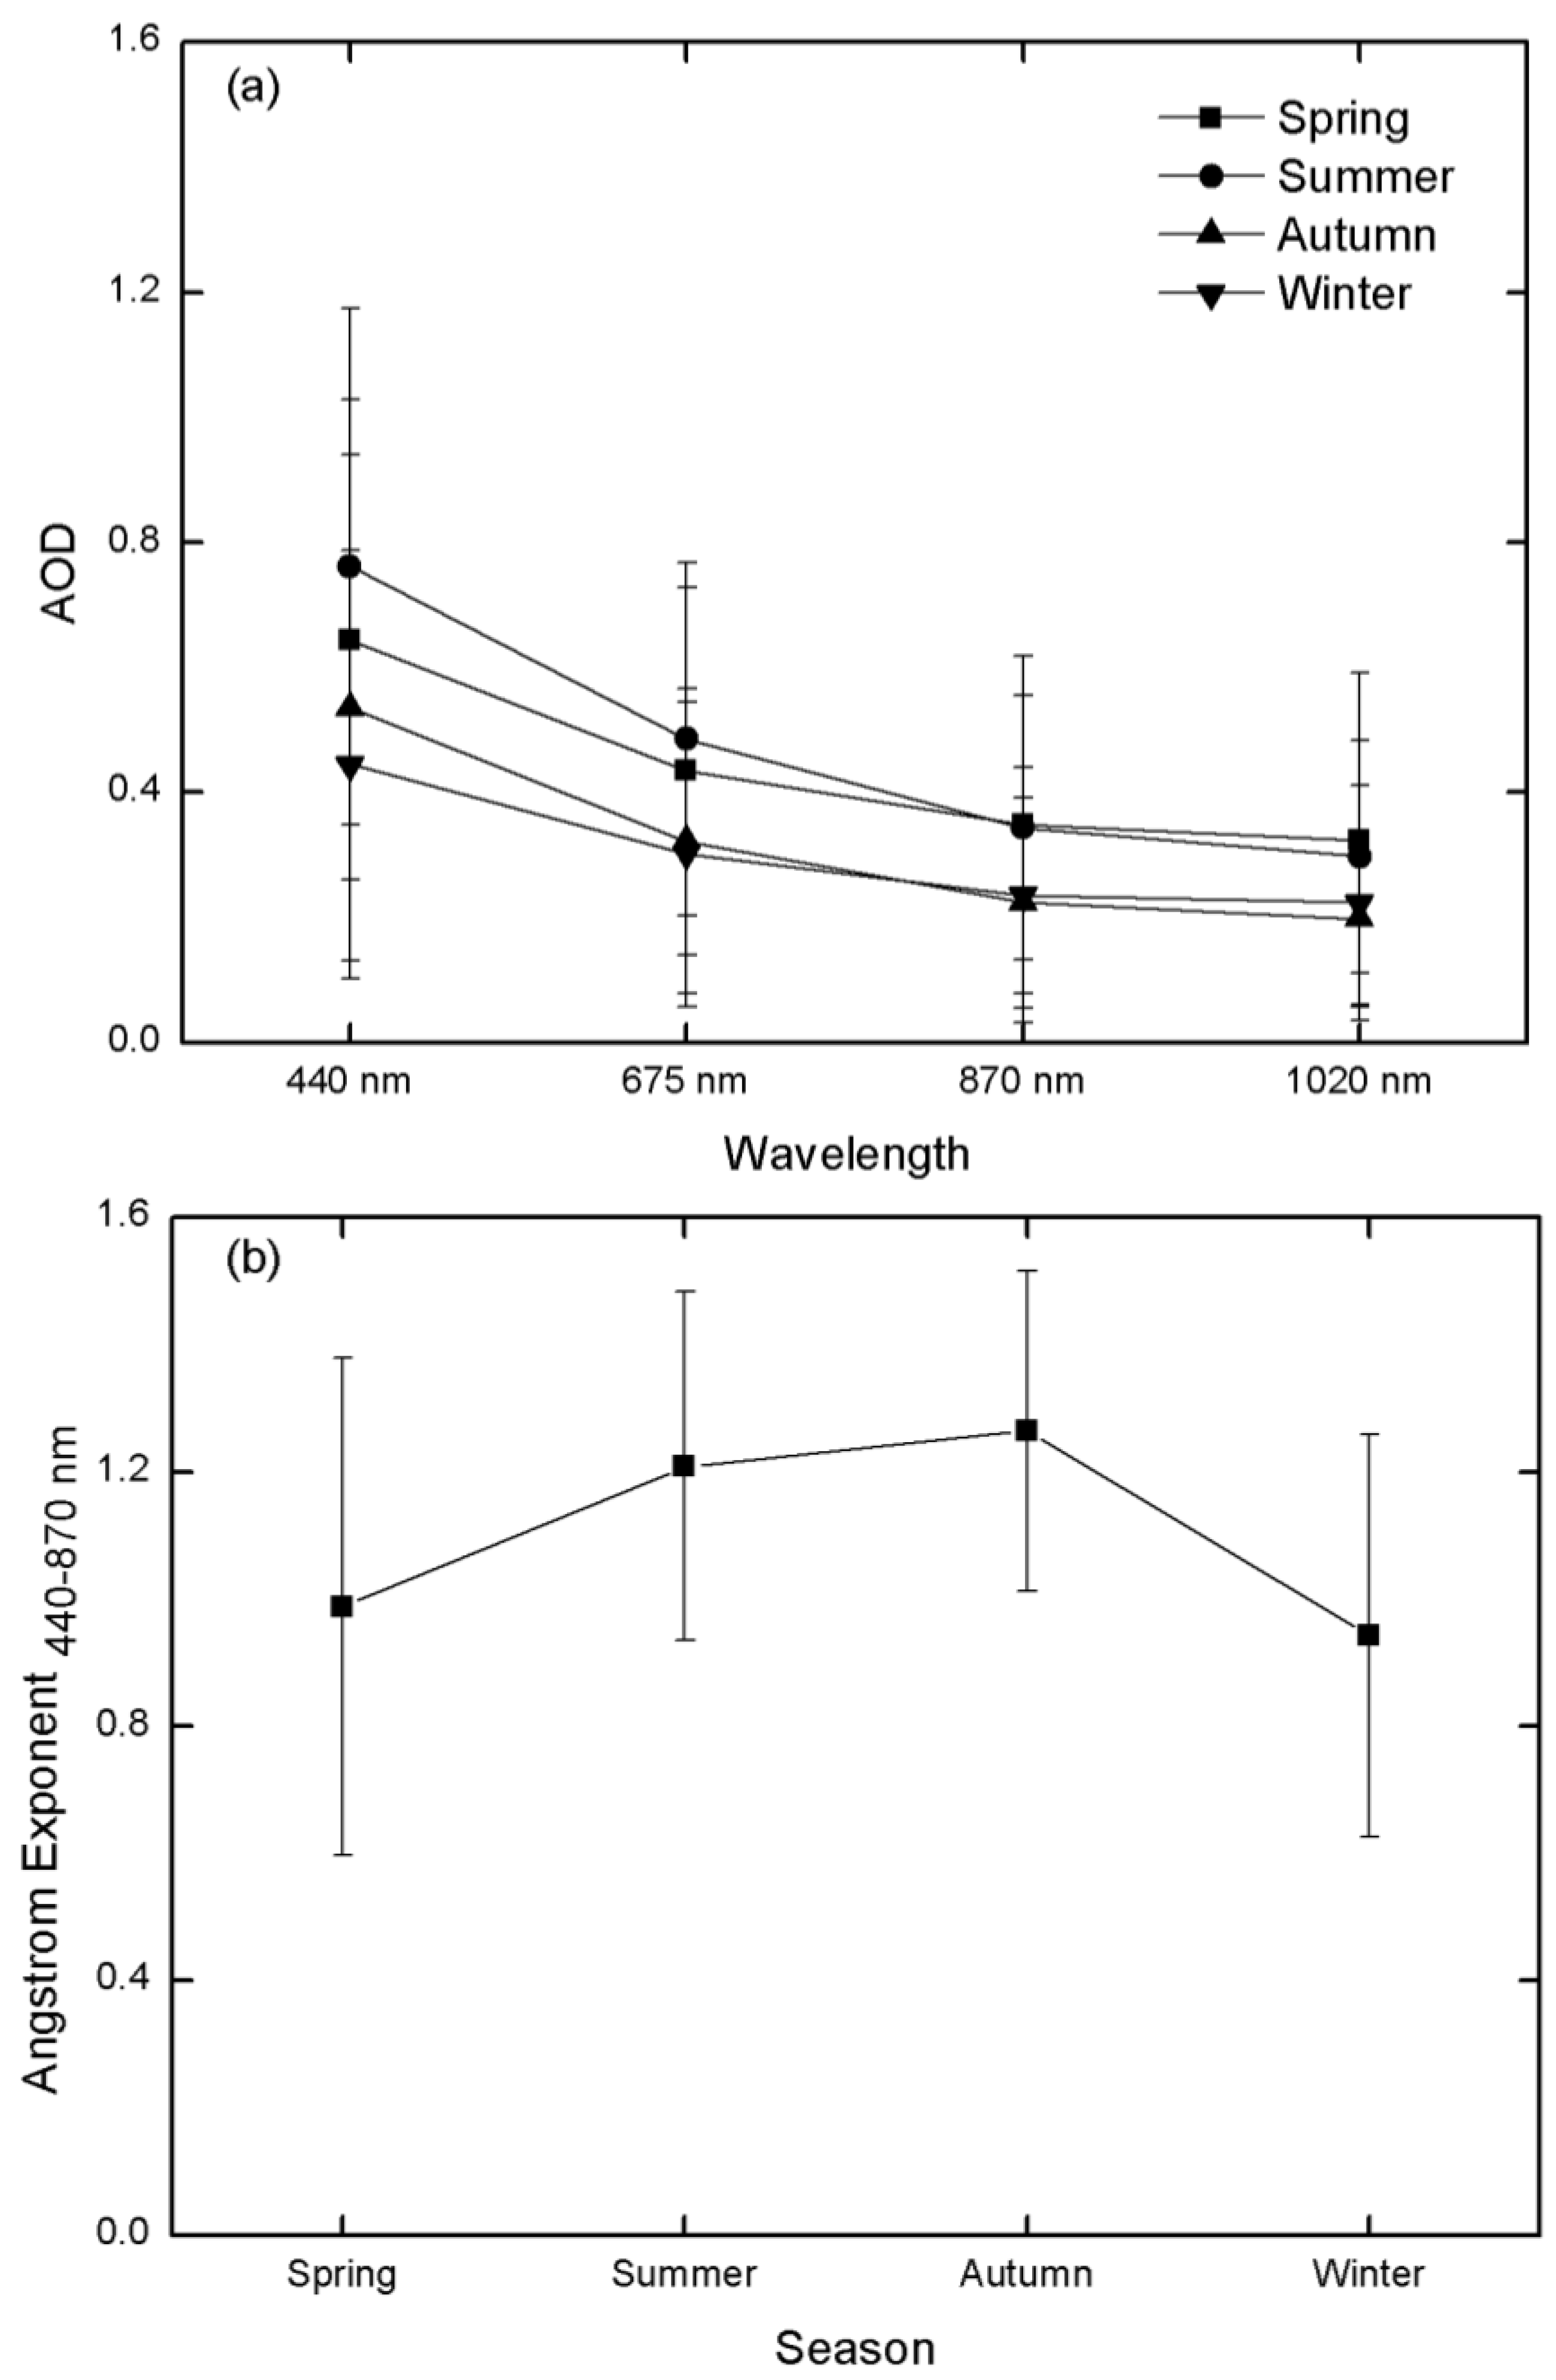
3.2. Seasonal Variationsin the AOD and Ångström Exponent

Figure 4a shows the seasonal average AOD values at 440, 675, 870, and 1020 nm and Figure 4b shows the values of the Ångström exponent (440–870 nm) measured at Dalian monitoring station. The mean ± SD values of AOD440 nm were 0.64 ± 0.38, 0.76 ± 0.41, 0.54 ± 0.40, and 0.45 ± 0.34 in spring, summer, autumn, and winter, respectively. The higher AOD recorded in summer was the same as the result obtained for Shenyang (Figure 1), an inland urban site in Northeast China. However, the lower AOD recorded in winter at Dalian monitoring station was different from that recorded at Shenyang, which may due to lower levels of domestic heating in this season because of the warmer climate [41]. The comparably higher AOD values in summer are most likely to be a result of the larger amounts of water vapor in the atmosphere during this season. Aerosols can easily absorb moisture and grow hygroscopically, which favors the formation of aerosols [58,59,60]. High temperatures can also increase the amount of secondary organic aerosol particles by the photochemical reaction, which may be related to the higher AOD values recorded in summer [61].
The Ångström exponents (440–870 nm) were 0.99 ± 0.39, 1.21 ± 0.27, 1.26 ± 0.25, and 0.94 ± 0.32 in spring, summer, autumn, and winter, respectively. The values of the Ångström exponent in all four seasons were higher than in other urban cities in Northeast China, which may indicate a dominance of fine particles in this area [41]. Wan [62] reported that the higher concentrations of SO2 and NOx in winter over Dalian may be related to the secondary production of the fine pollutants via photochemical reactions.

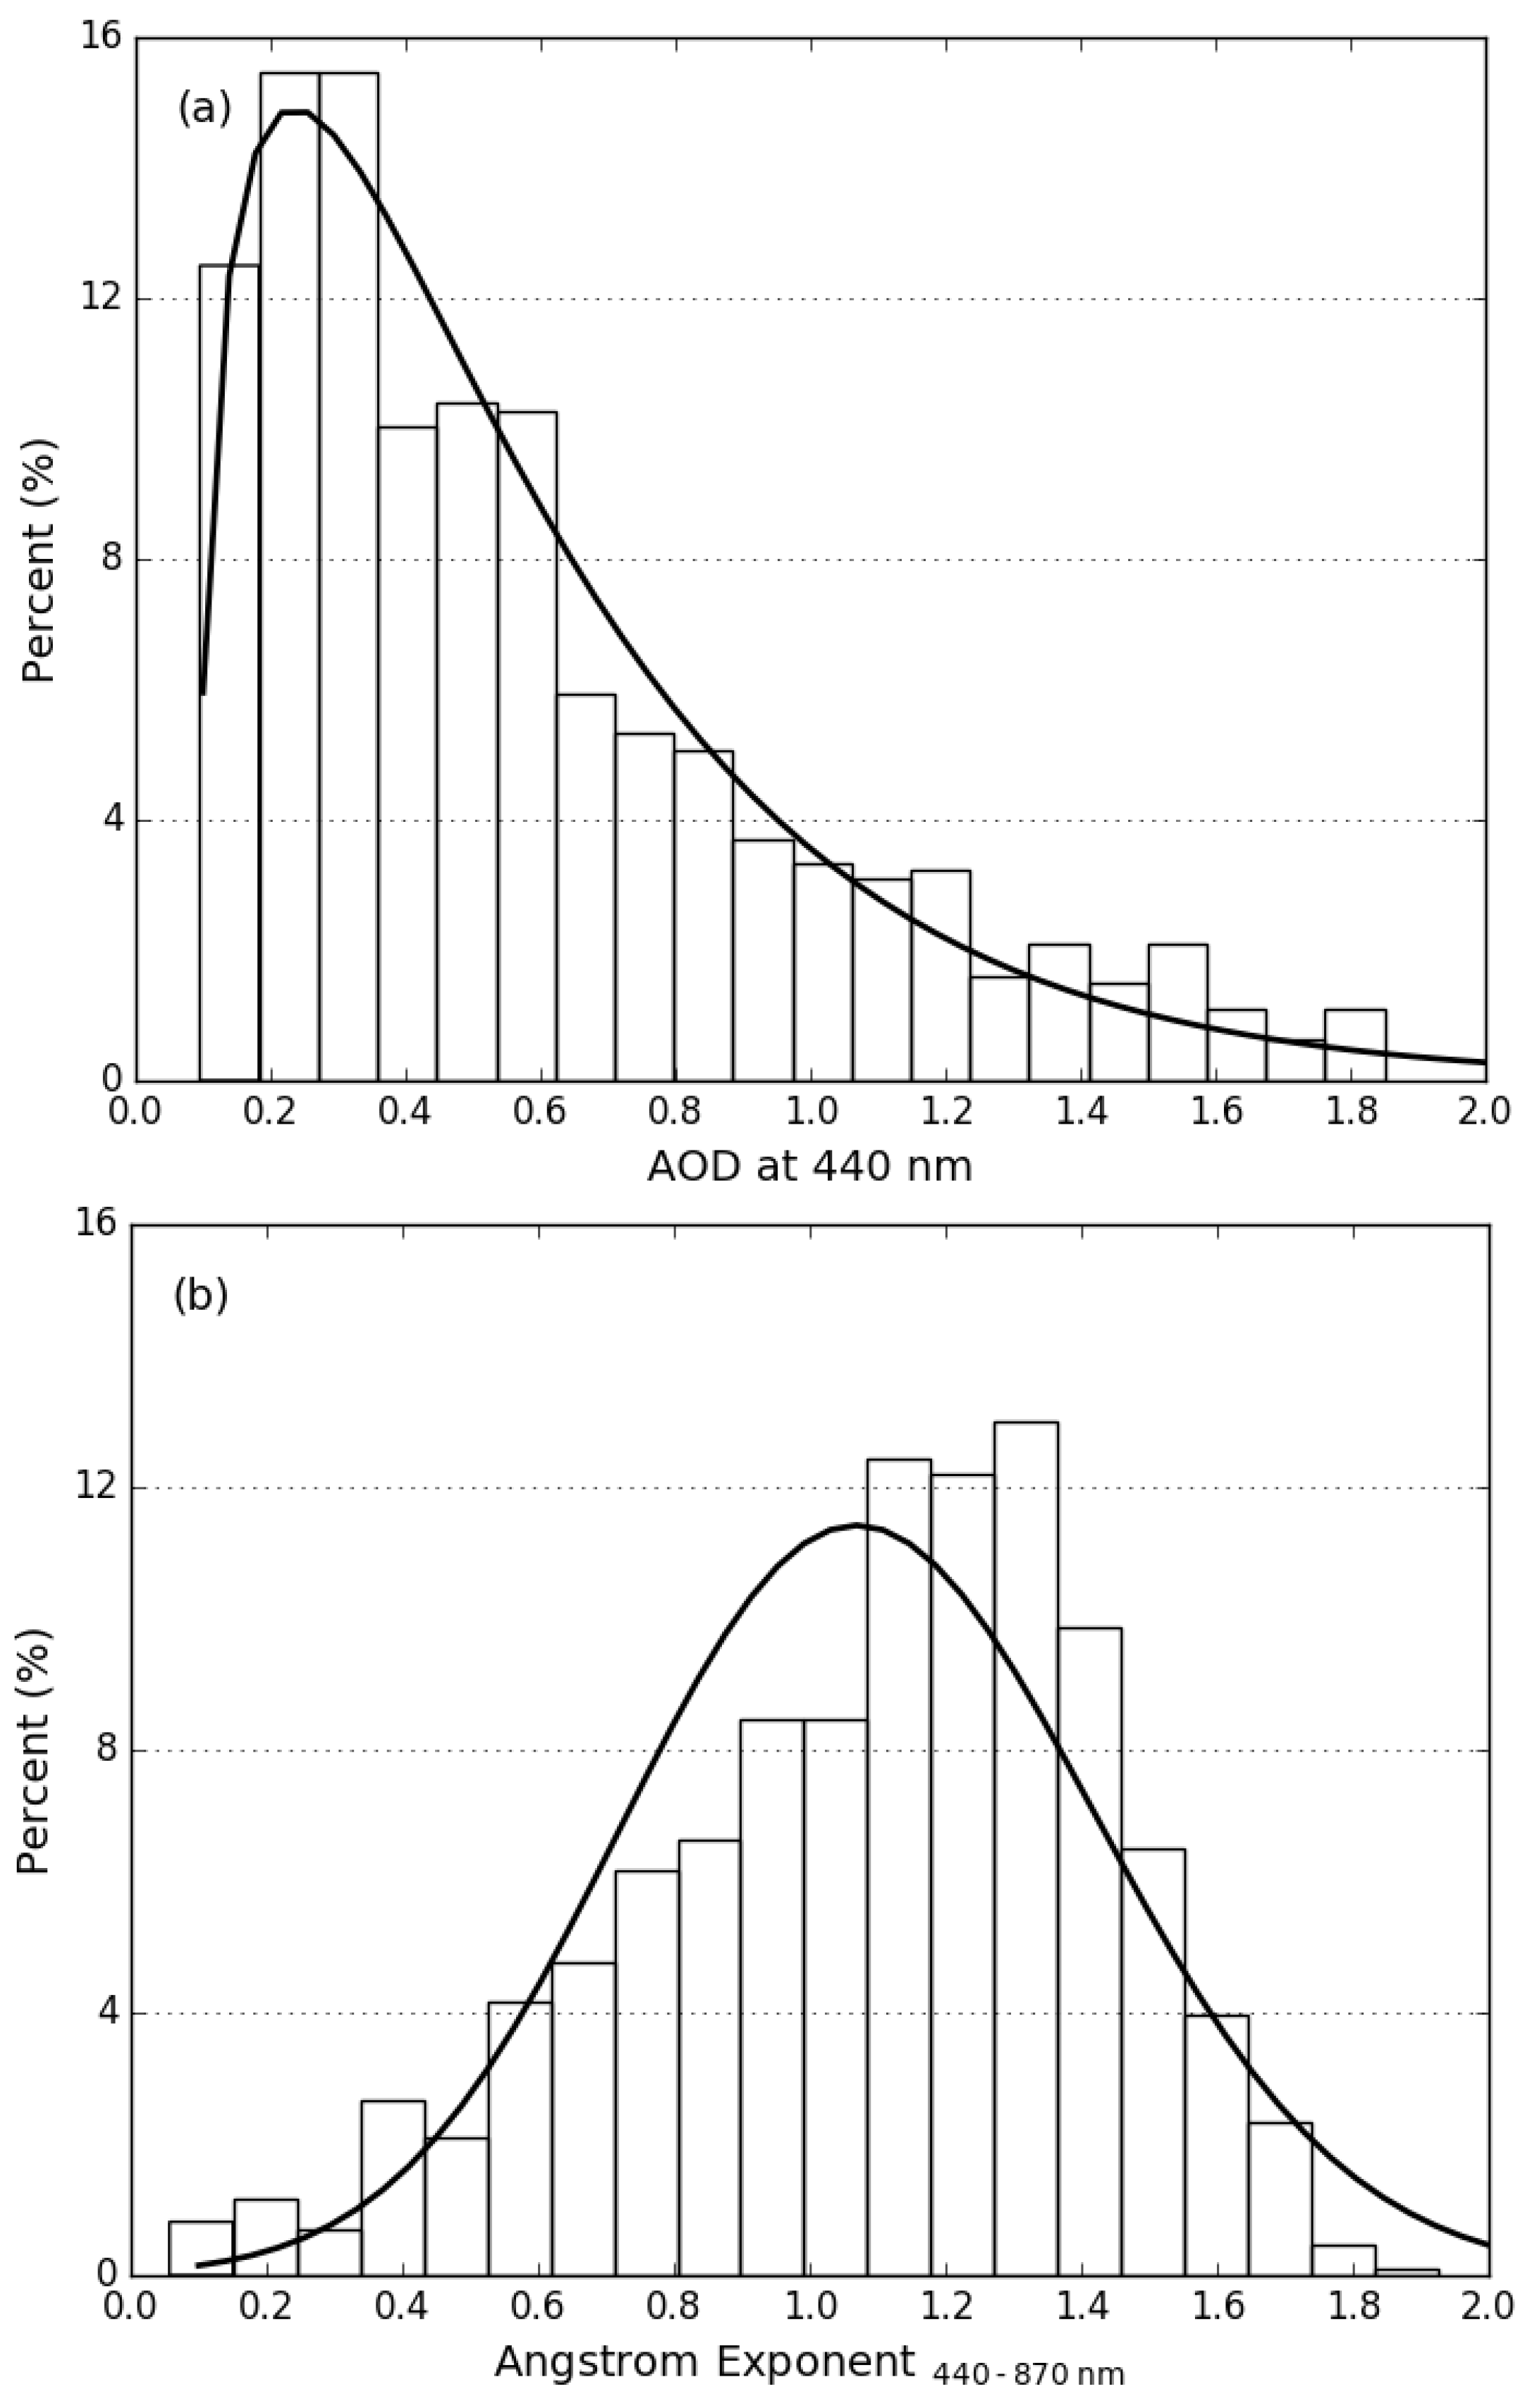
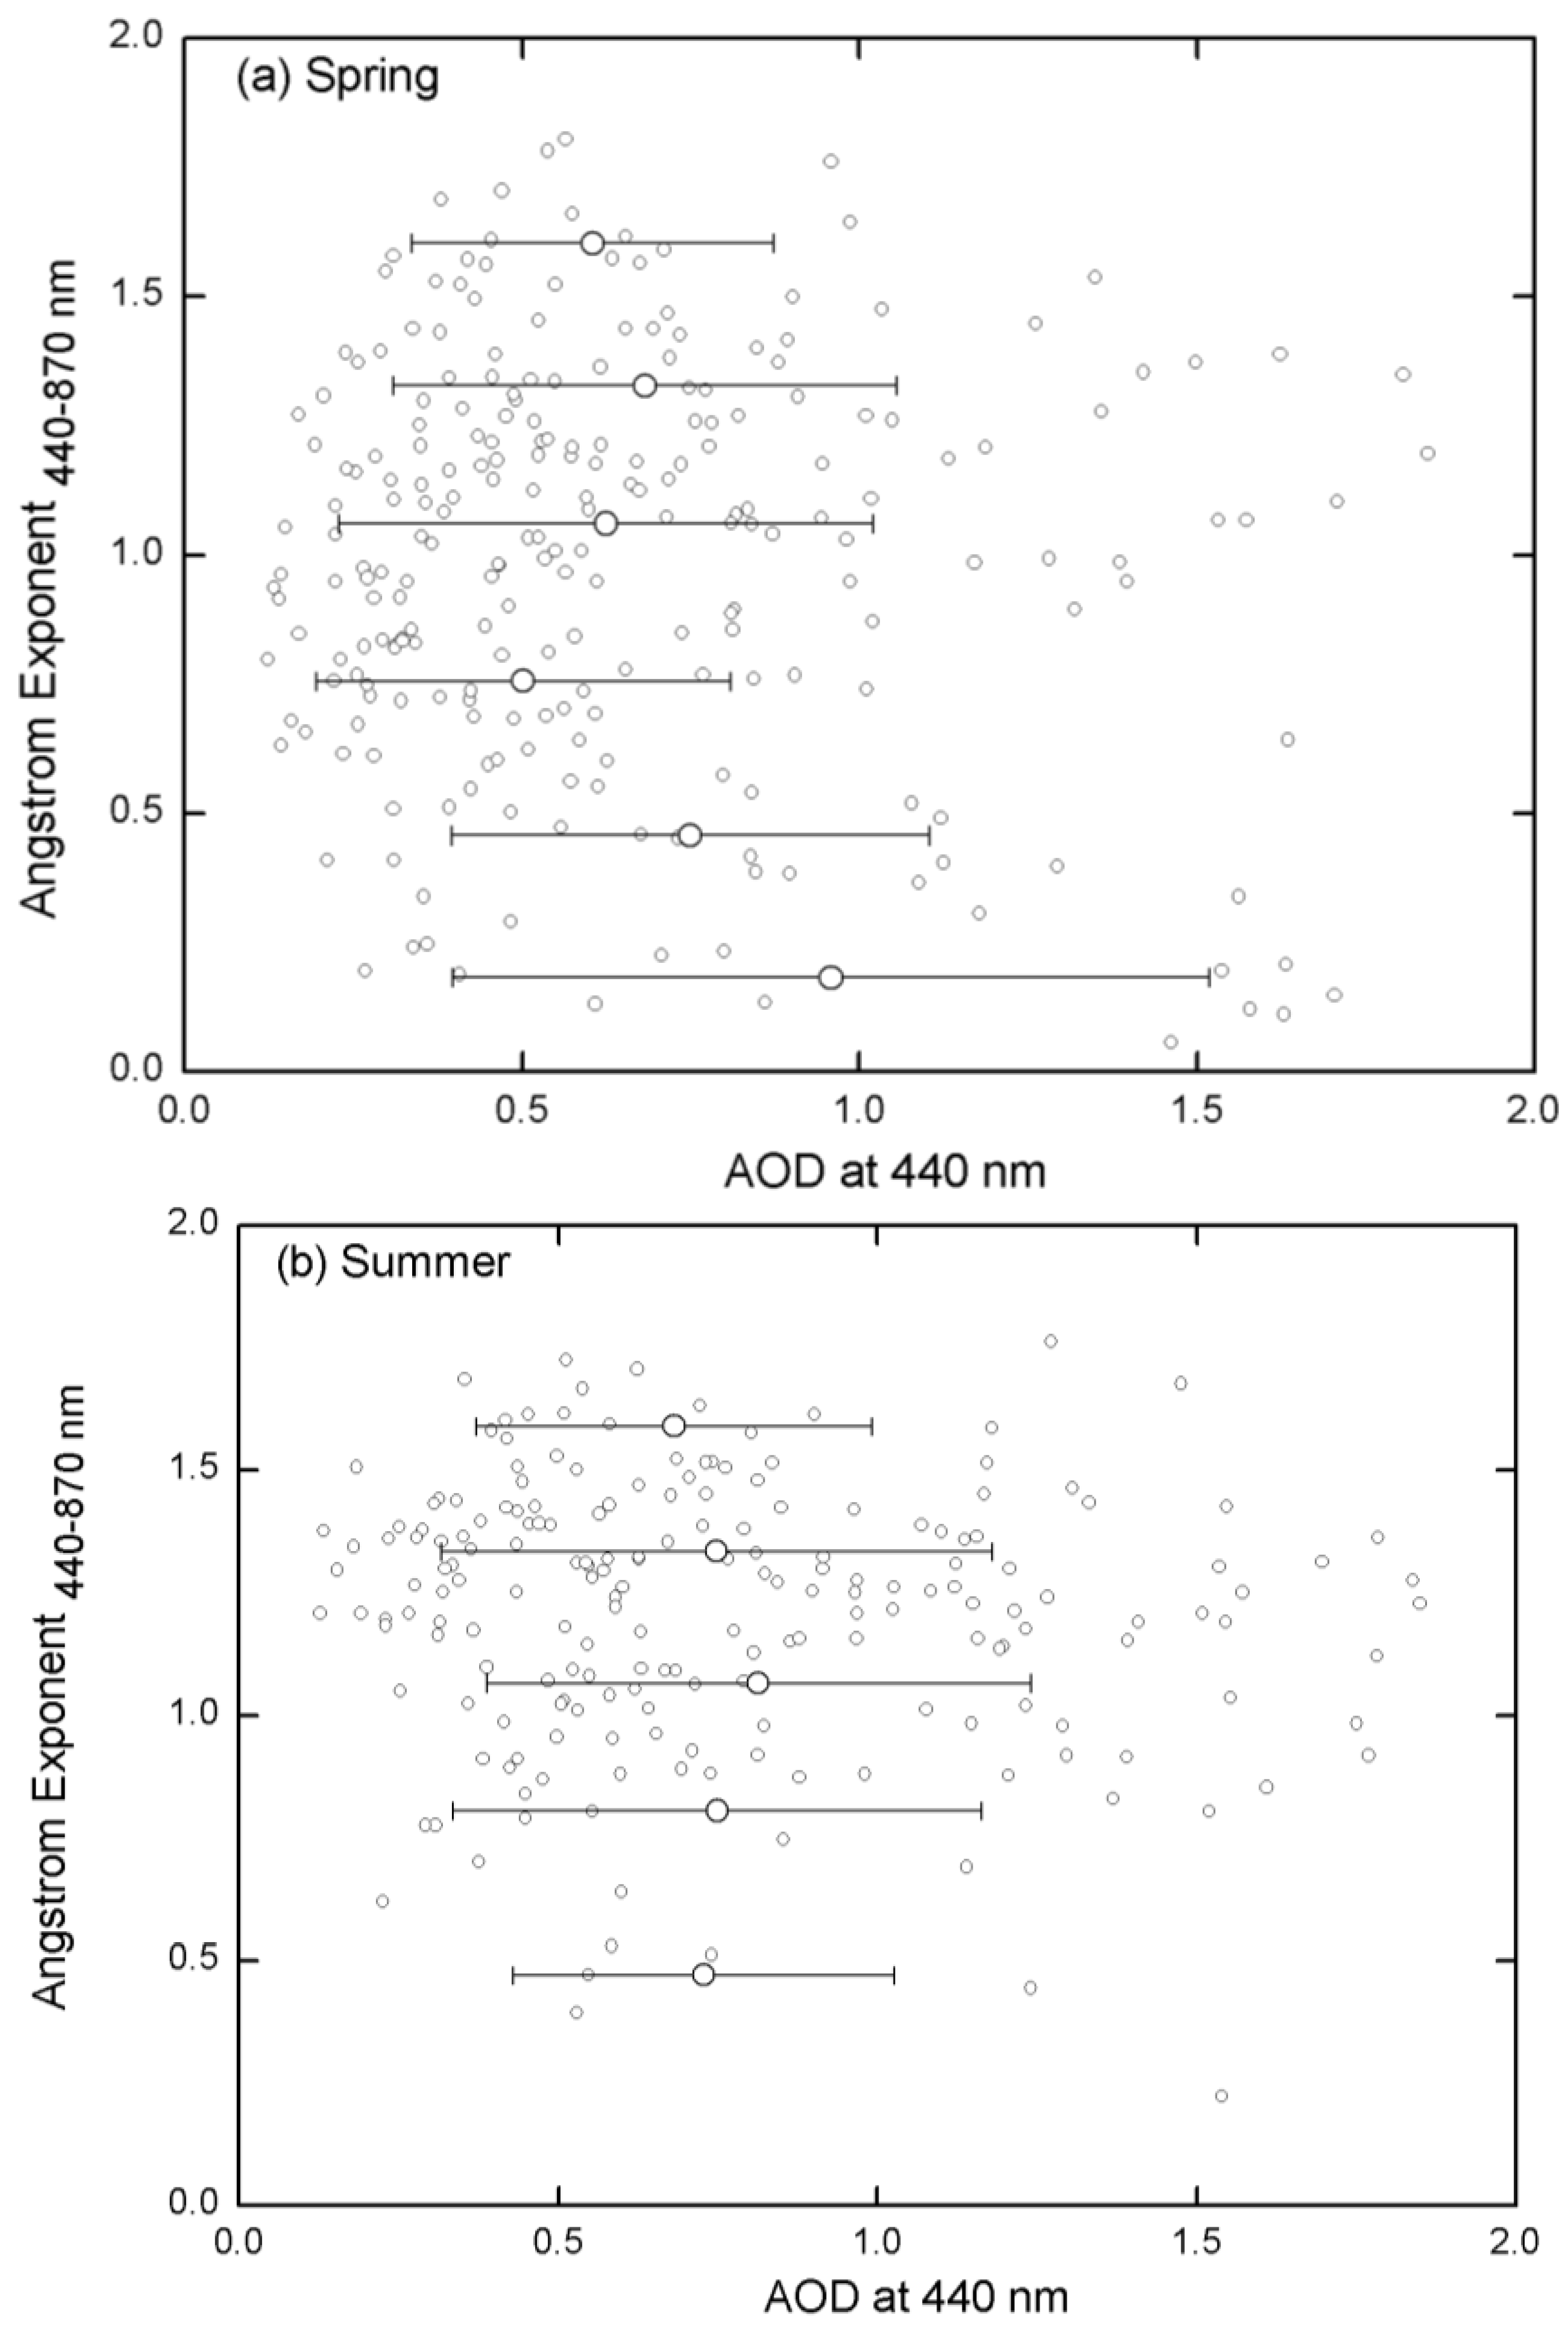
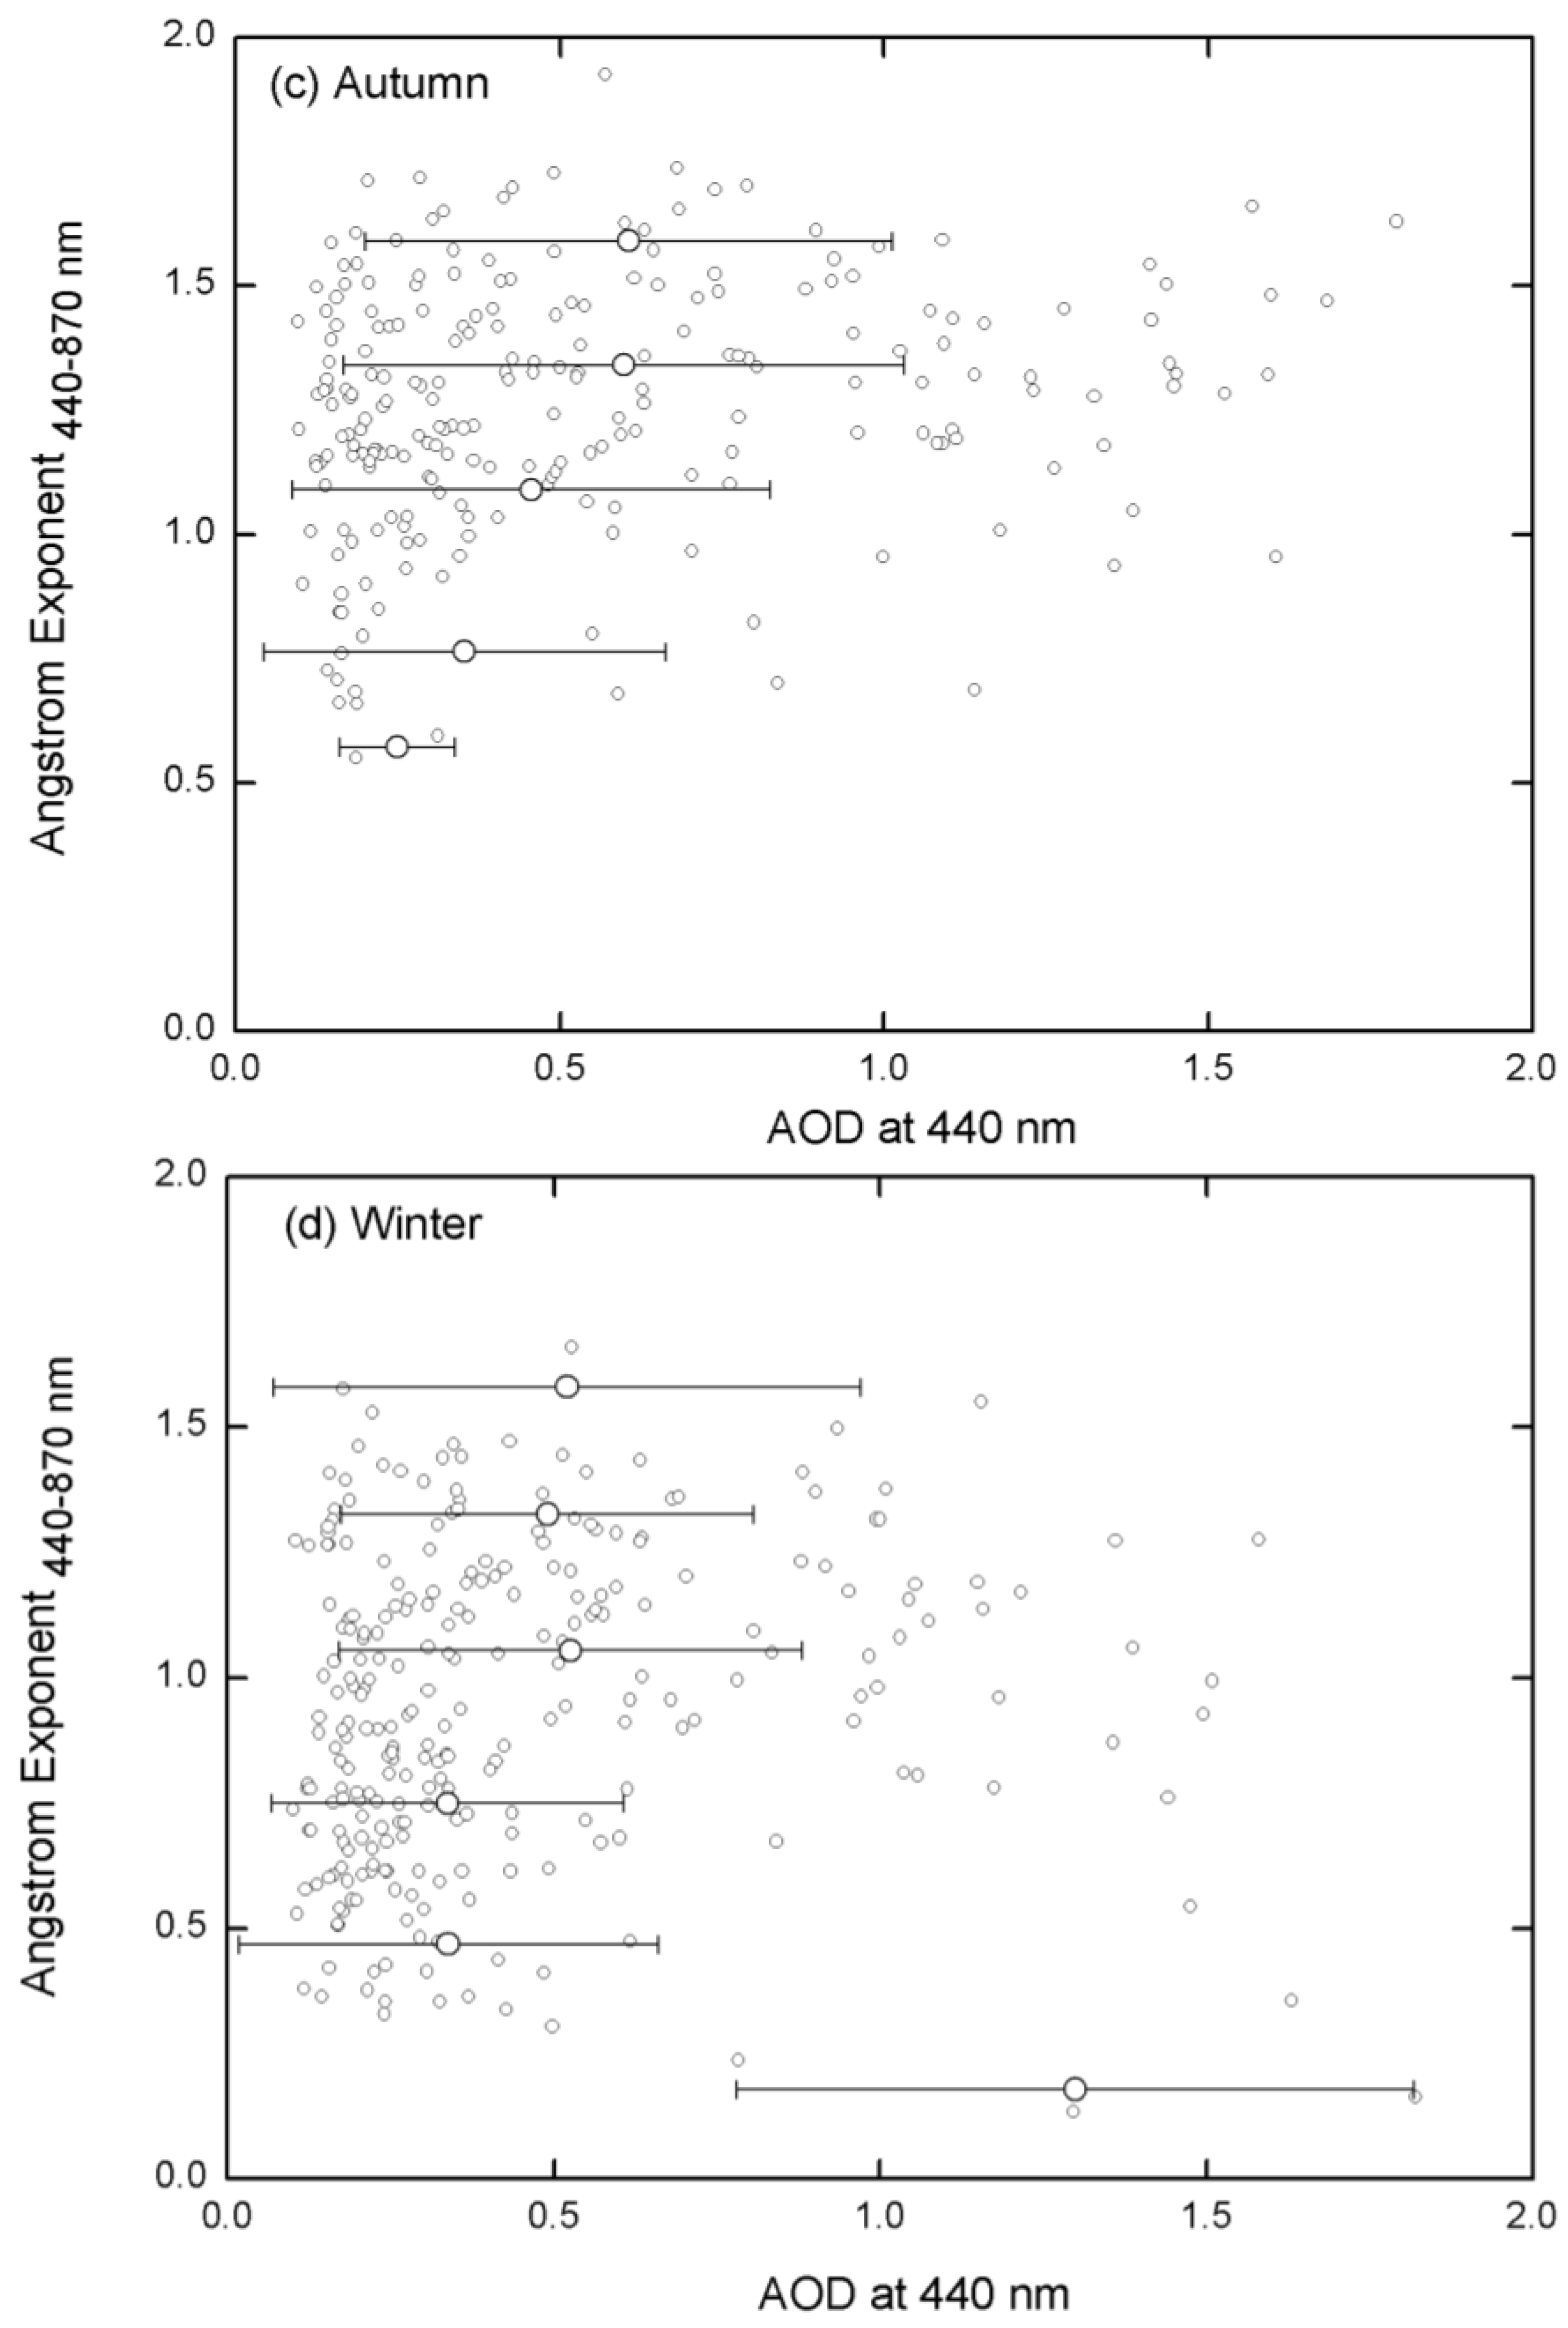
3.3. Frequency Distribution of the AOD and Ångström Exponent

Figure 5a,b show the frequency distributions of the AOD440 nm and Ångström exponent (440–870 nm), respectively, for the instantaneous data recorded at Dalian monitoring station. We used bin intervals of 0.10 for these two parameters.
The frequency histograms for AOD440 nm and the Ångström exponent (440–870 nm) at Dalian monitoring station both showed a clear single peak distribution. The AOD frequency distribution can be well fitted (r2 = 0.78) to a normal distribution approximately centered at 0.26 with a standard deviation of 0.03 and had a percentage of 15.5%. The highest frequency of AOD440 nm values occurred between 0.00 and 0.60 had a percentage of 69.6%, which indicates the lower aerosol burden in this region. The geographical position of Dalian monitoring station is favorable for the formation of both land and sea breezes and this daily variation in the local atmospheric circulation maybe conducive to the dispersal of pollutants, resulting in less air pollution at this location [56].
The frequency distribution of the Ångström exponent (440–870 nm) was also well fitted (r2 = 0.92) to a normal distribution approximately centered at 1.06, with a standard deviation of 0.02 and had a percentages of 11.2%. The range for an Ångström exponent <1.00 and an Ångström exponent >1.00 had percentages of 44.7% and 55.3%, respectively.
The distribution patterns for the relatively clean AOD values and higher Ångström exponent (440–870 nm) at Dalian are similar to those studies at Longfengshan in Northeast China (Figure 1) and probably correspond to the local background atmospheric conditions [42]. However, these results are different from the distribution patterns recorded in other urban and industrial region in Northeast China, which suggest the presence of particular aerosol populations and types in this coastal region, with different proportions of regional and anthropogenic aerosol particles [41].

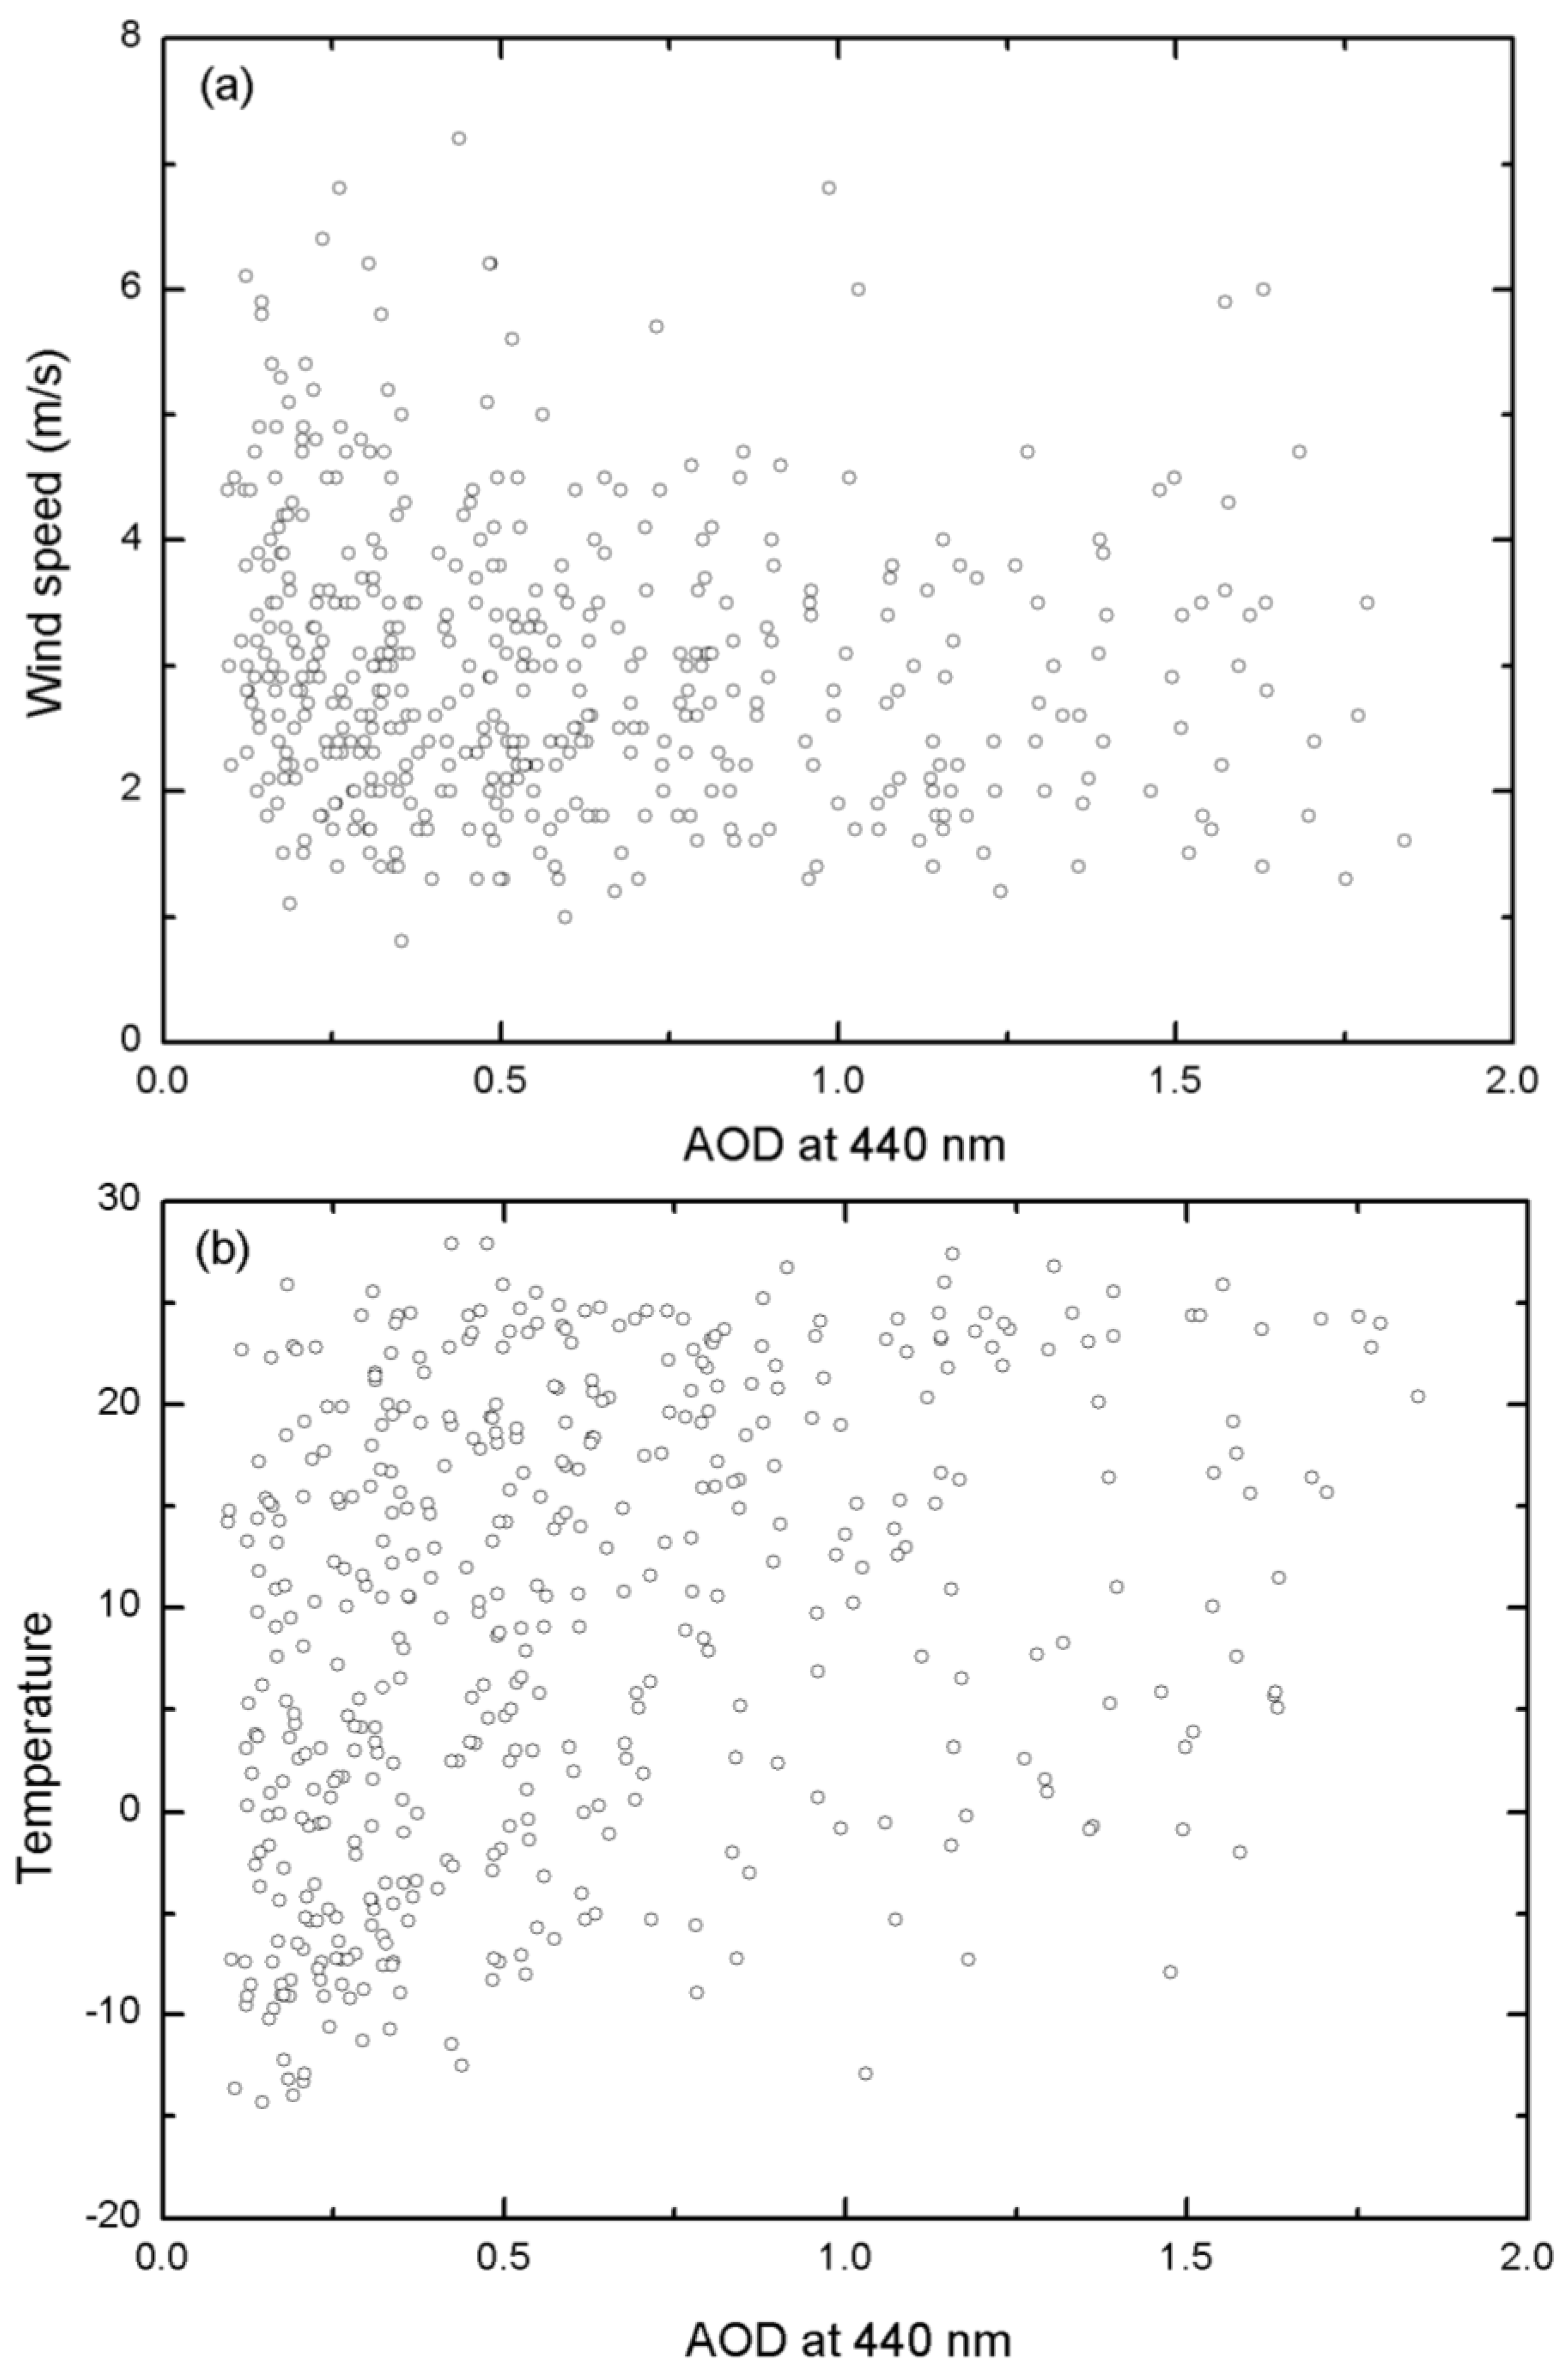
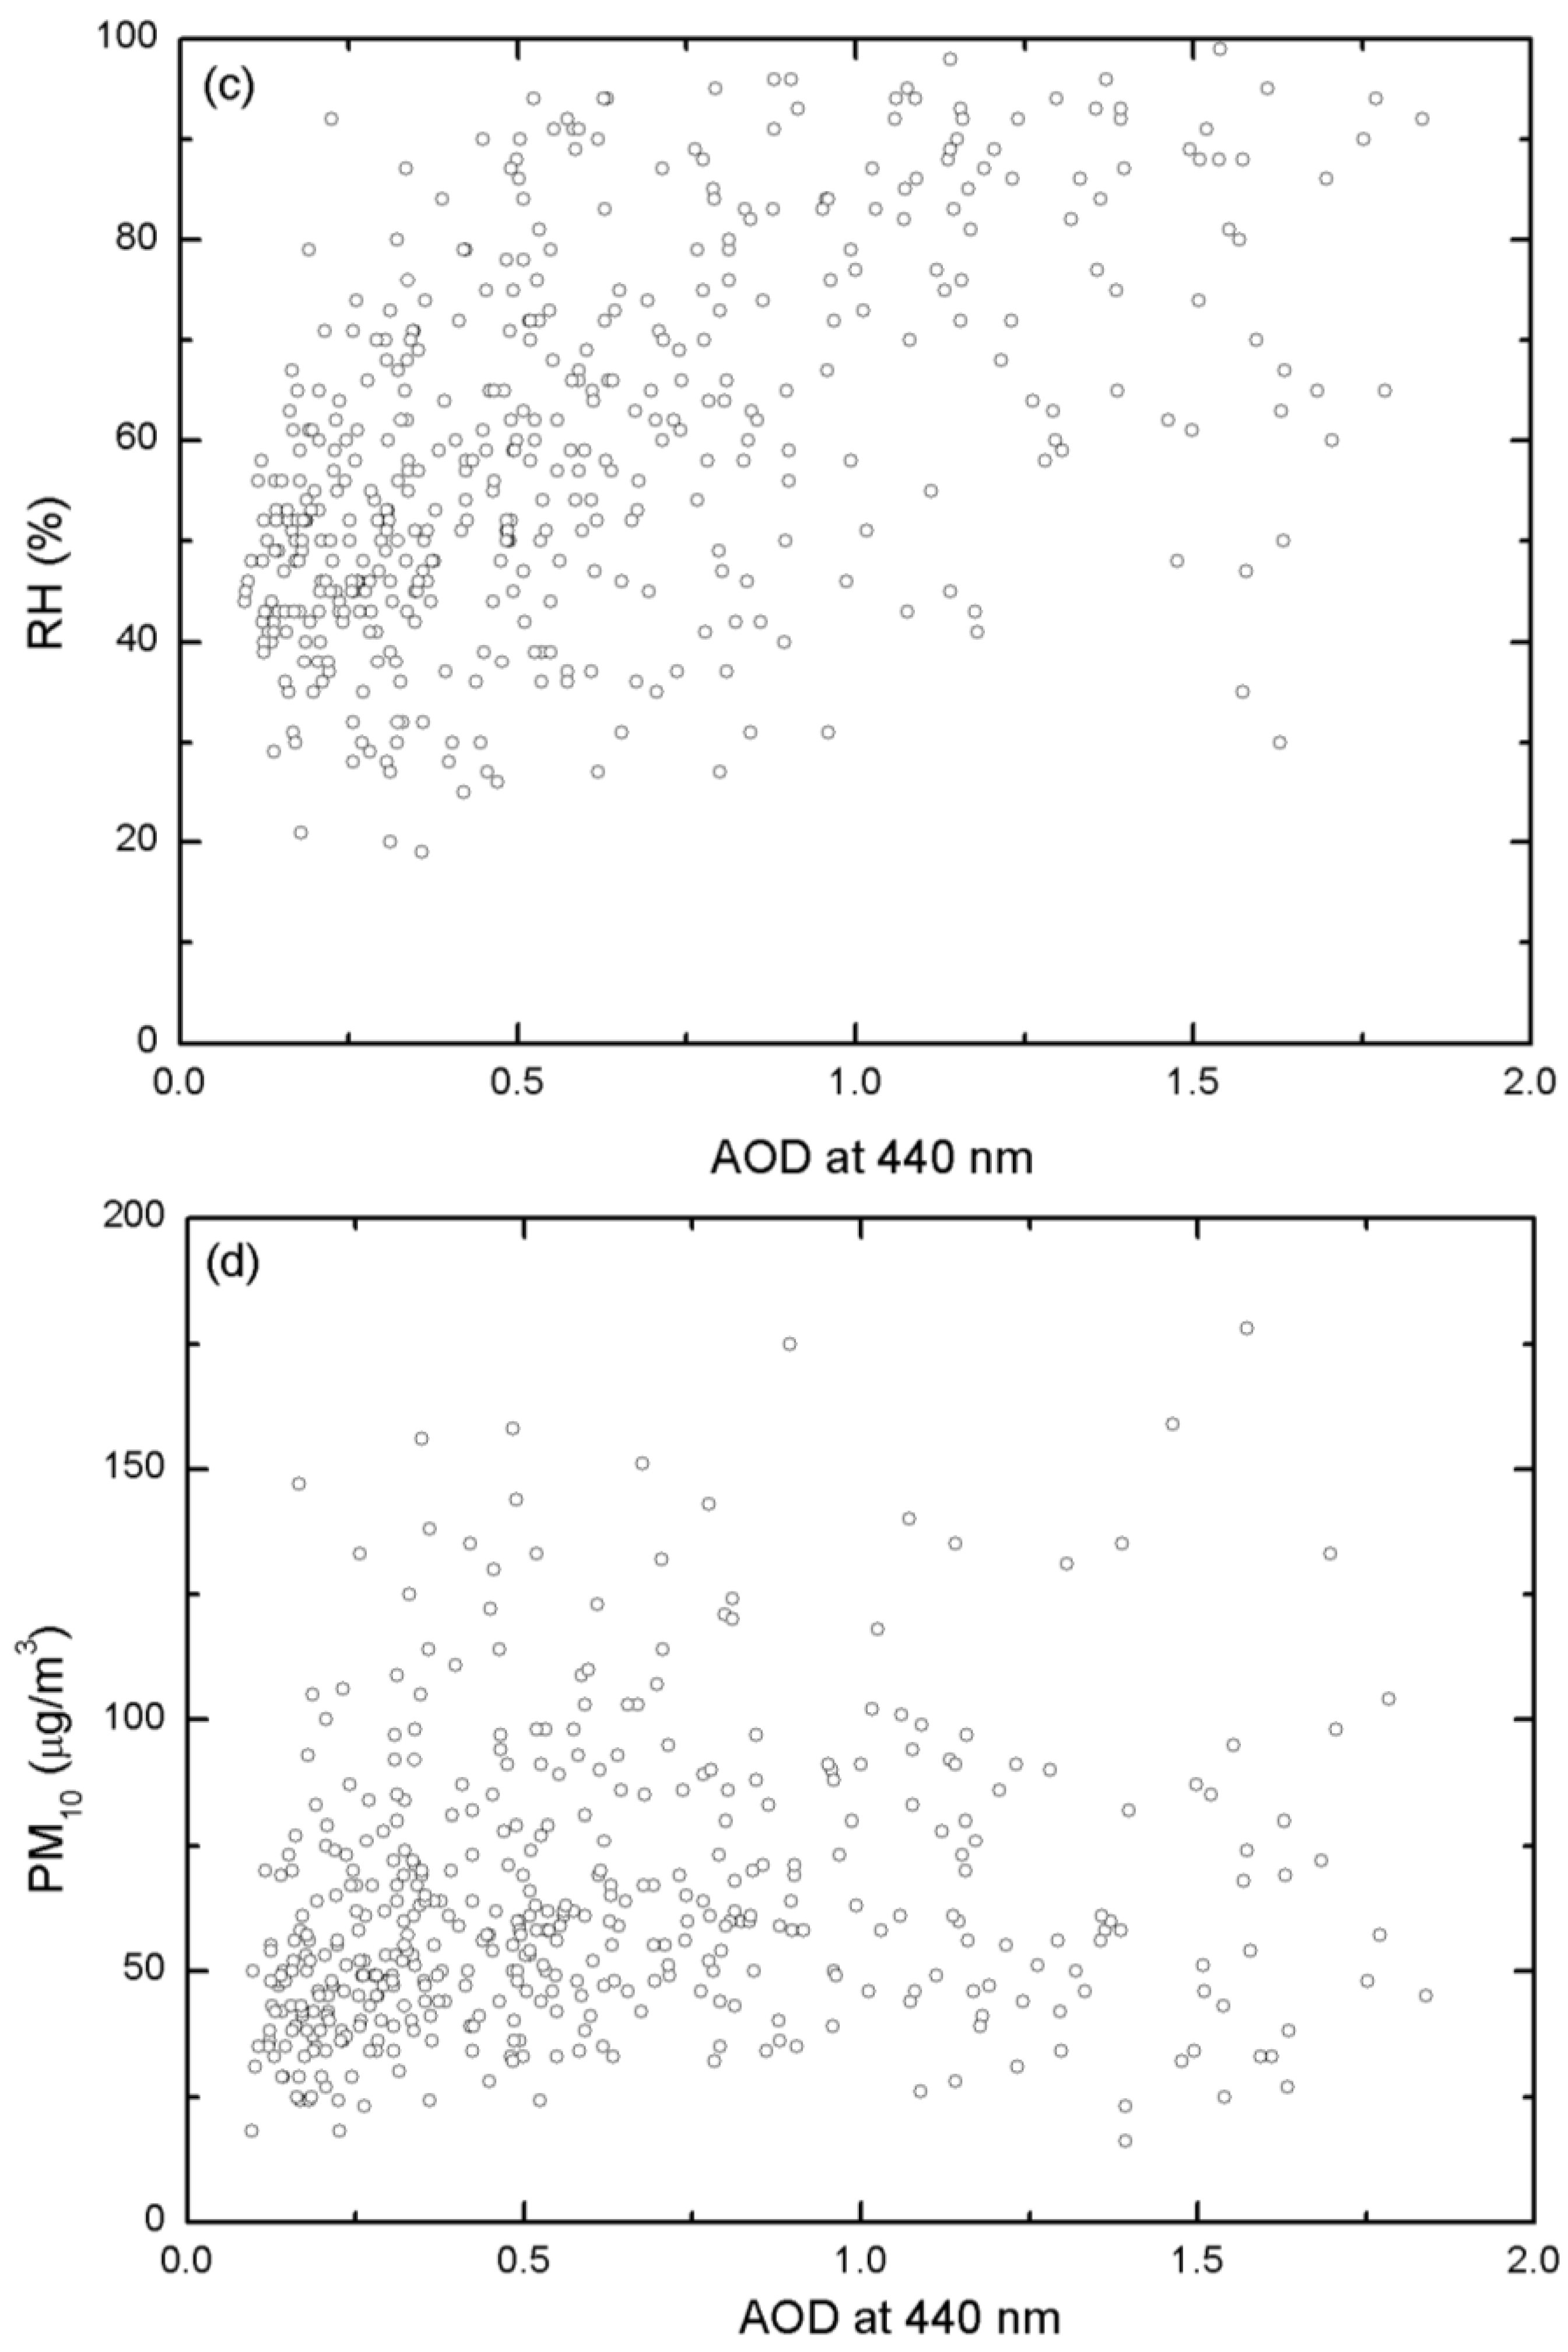
3.4. Relationship between AOD, Ångström Exponent, Meteorological Conditions and PM10

Figure 6a–d are scatter grams of the AOD440 nm and Ångström exponent (440–870 nm) values based on instantaneous data from different seasons. The open circles with error bars represent the average AOD for the following ranges of the Ångström exponent (440–870 nm): 0.00–0.30, 0.30–0.60, 0.60–0.90, 0.90–1.20, 1.20–1.50, and 1.50–2.00.
In spring, the increase in AOD440 nm with decreasing Ångström exponent (440–870 nm) values (in some instances <0.50) indicates that the radii of the particles were larger in this season, which supports the effect of dust aerosols (Figure 6a). The frequency with which dust is present in spring may have an impact on this relatively clean city and increase the concentration of particulate matter above the acceptable standard [58]. The scatter gram of aerosols in the summer was less clear than in other seasons (Figure 6b). The higher AOD may be characterized by the larger Ångström exponent (440–870 nm). Figure 6c shows that the correlation between AOD440 nm and the Ångström exponent (440–870 nm) was different in autumn than in other seasons. Higher AOD values (all >0.5) were observed as the Ångström exponent (440–870 nm) increased. This shows that fine particles play an important part in the optical properties of aerosols at Dalian monitoring station in autumn. The AOD440 nm increased with increasing values of the Ångström exponent (440–870 nm) from 0.50 to 1.50 in winter, except in the range 0.00–0.30 (Figure 6d), which also indicates an influence of the fine particles.
Figure 7a–d show the correlation of AOD440 nm with wind speed, temperature, relative humidity, and PM10, respectively, at Dalian monitoring station based on the instantaneous data. In general, the AOD440 nm values increased at lower wind speeds with the correlation coefficient about −0.11, which probably indicates the effect of the wind on the optical properties of aerosols [63] (Figure 7a). Figure 7b,c show similar variations in the AOD440 nm with changes in both temperature and relative humidity at Dalian monitoring station with the correlation coefficient about 0.34 and 0.51, respectively. This probably indicates that a higher aerosol loading may be related to increases in temperature and relative humidity, which may increase the size of aerosol particles through hygroscopic growth and aggregation as Chen [64] and Zhang [65] have mentioned. High concentrations of PM10 corresponded to larger values of AOD440 nm in Figure 7d, which has the similar variations in some Chinese cities according to Guo [66] and Qu [67]. The correlation coefficient is about 0.18 between the mass concentration of PM10 and AOD440 nm at Dalian monitoring station, which may be related to the weather conditions and requires further study.
Moreover, the averages of wind speed, temperature, RH and PM10 mass concentration within the different ranges of AOD440 nm about 0.00–0.15, 0.15–0.30, 0.30–0.40, 0.40–0.70, 0.70–1.00, 1.00–1.50 and 1.50–2.00 are presented in Table 2. When the AOD440 nm is lower than 0.30, the wind speed was almost >3.0 m/s and the average RH was less than 50% with the lower temperature about 3.0 °C. The corresponding PM10 mass concentration is about 50 µg/m3 during this range. When the value of AOD440 nm is increased, the wind speed was decreased below 3.0 m/s, while the temperature and RH was obviously increased. The PM10 mass concentration was also increased along with the AOD440 nm, and the higher PM10 mass concentration (73.6 ± 35.6 µg/m3) was observed in the range of 0.70–1.00 of AOD440 nm.

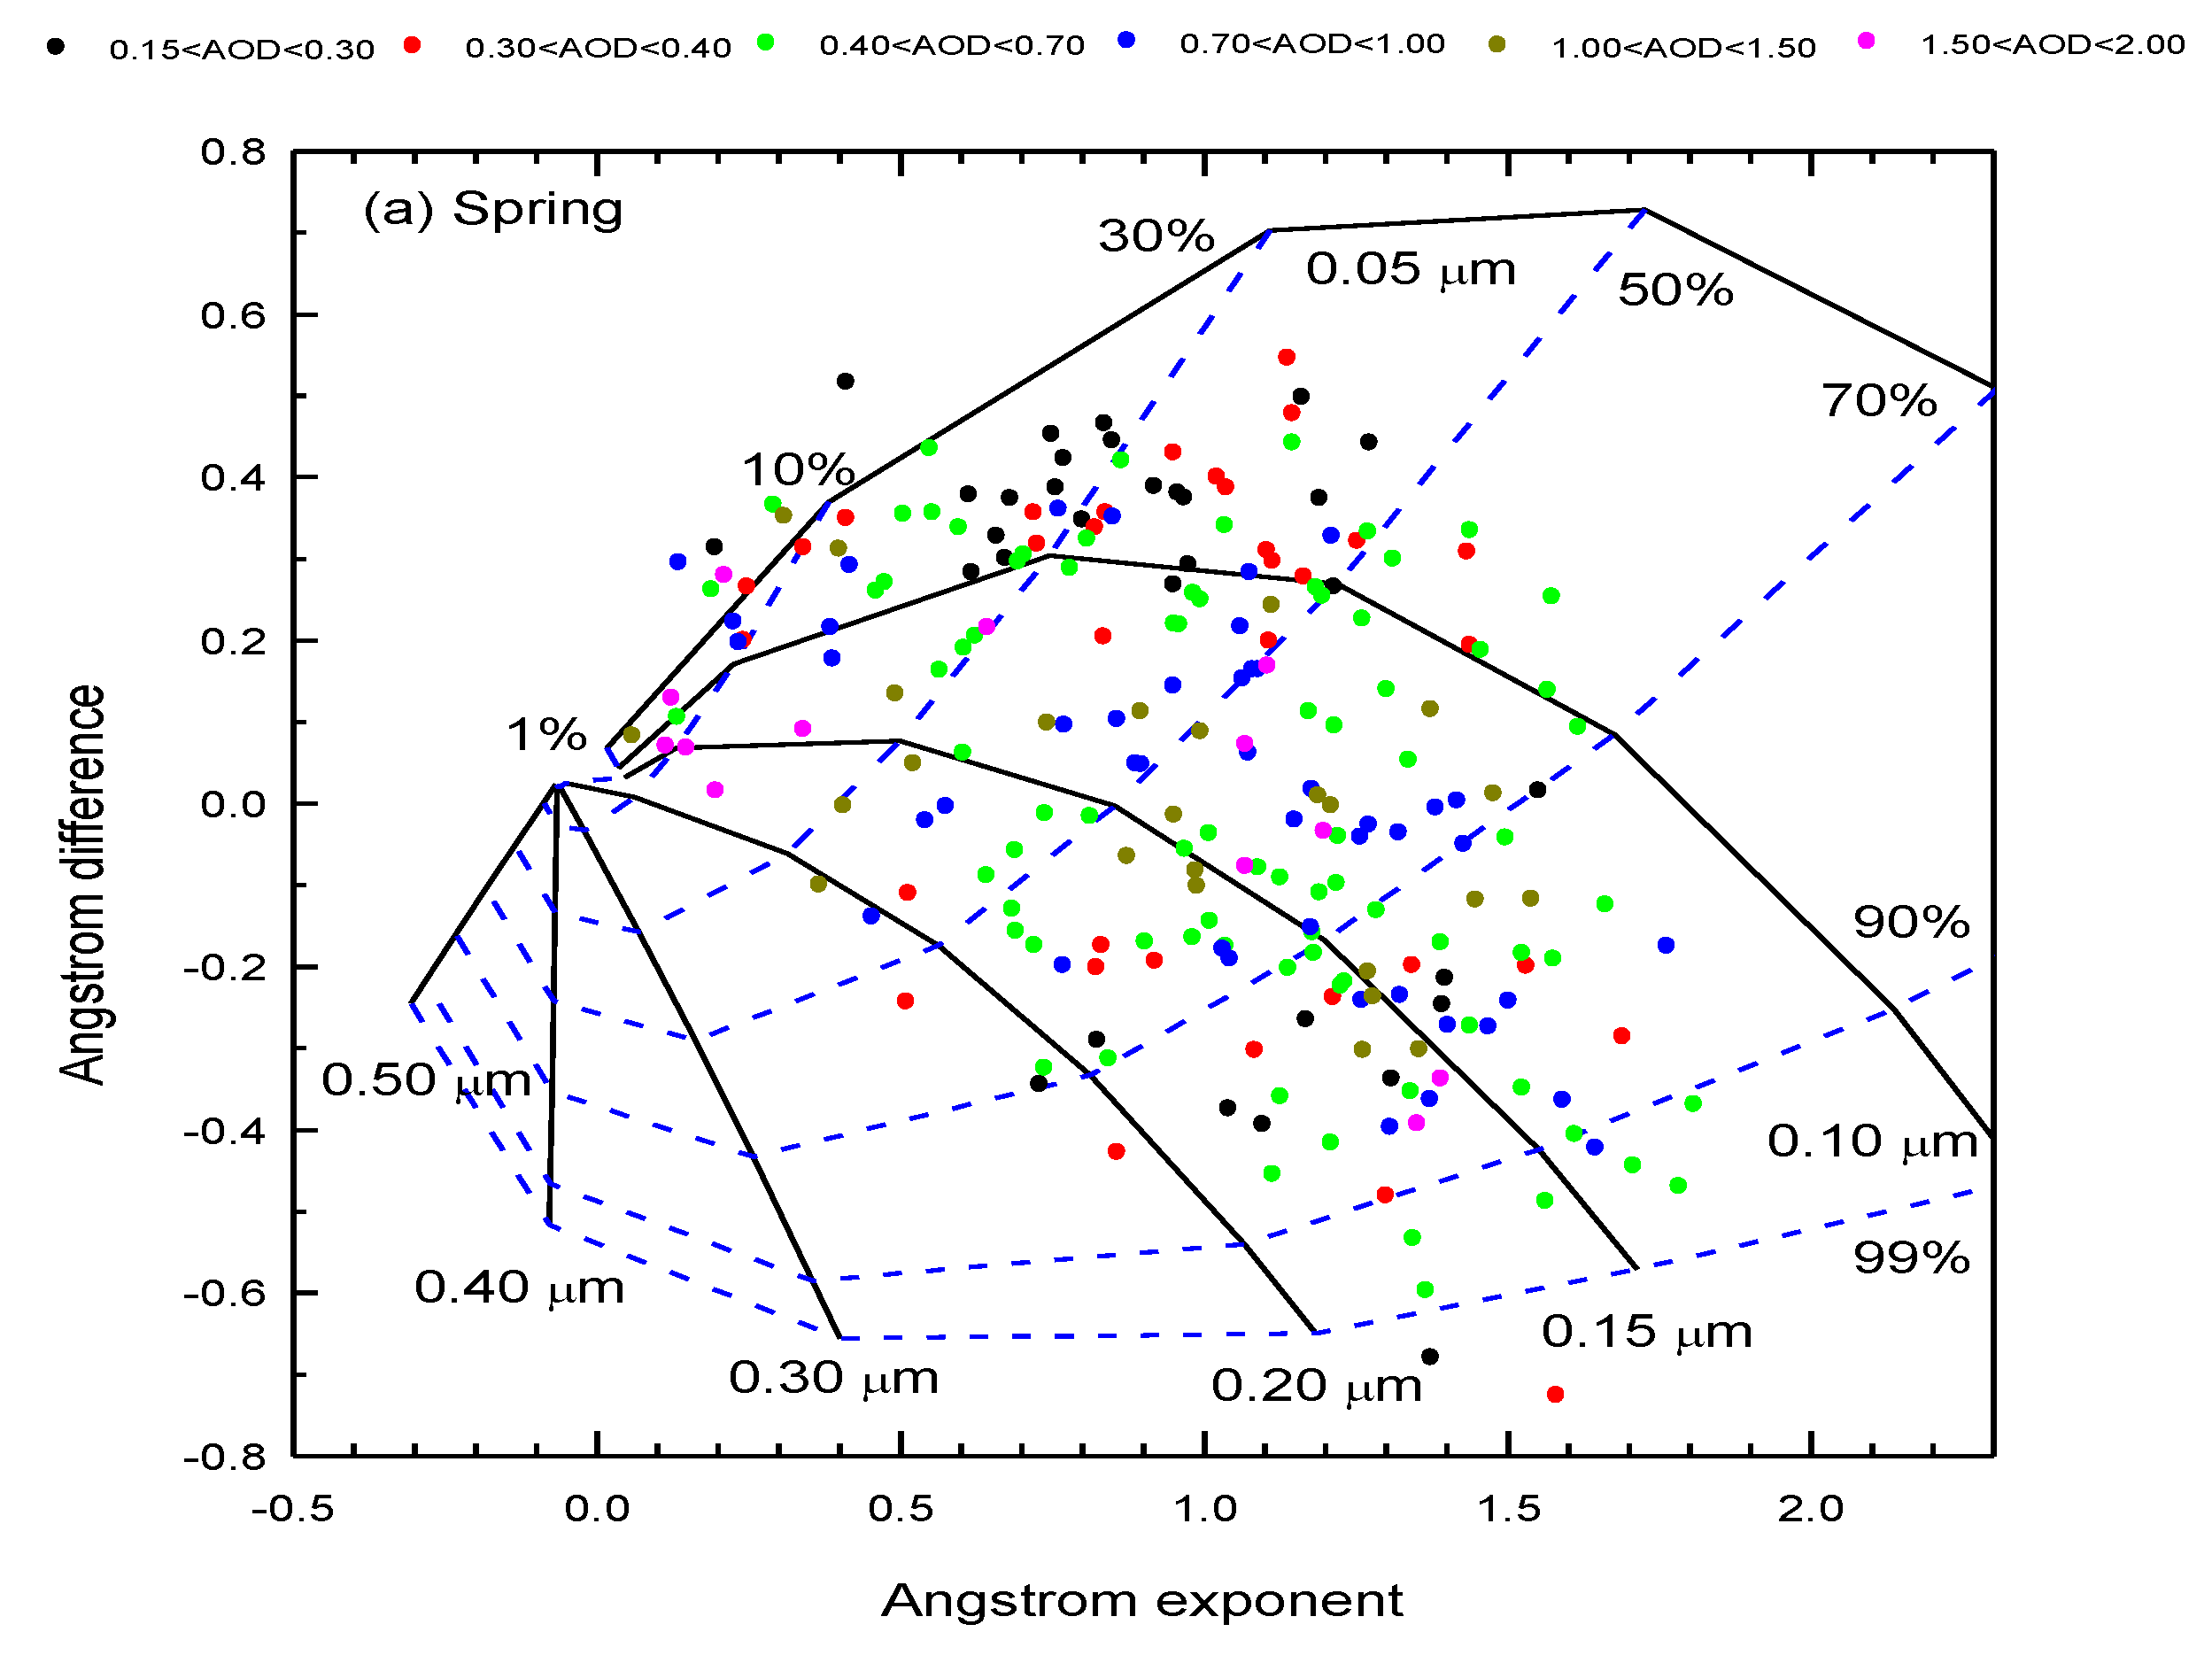
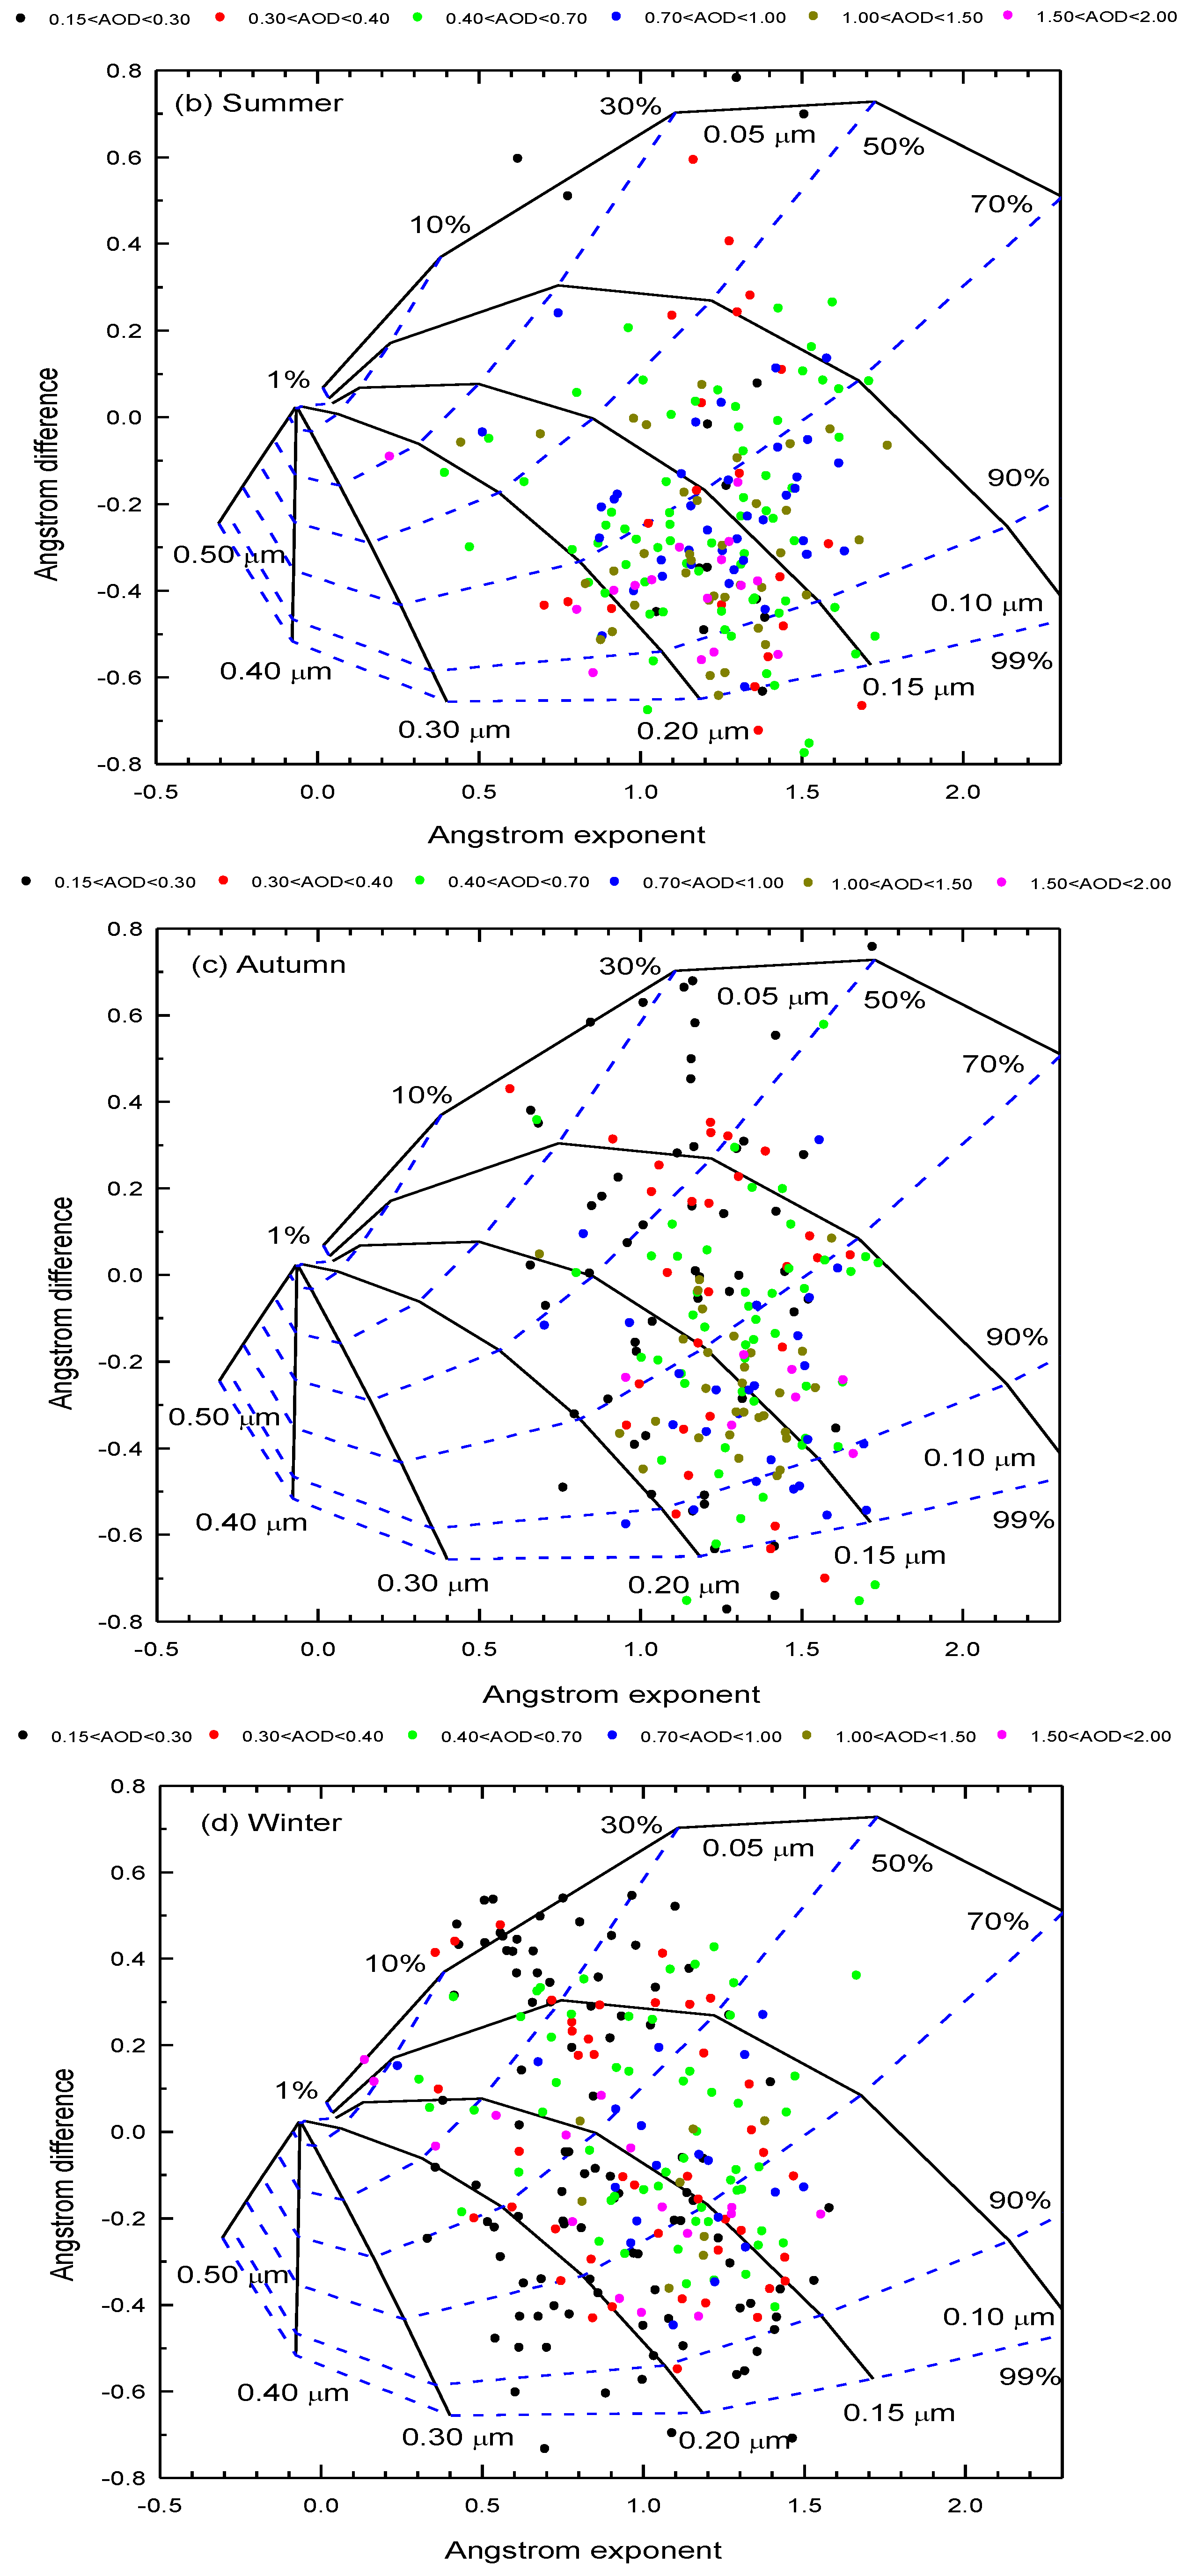
3.5. Aerosol Classification by AOD, Ångström Exponent and Ångström Exponent Difference (δα)

This graphic method can be used to separate the coarse mode aerosol growth from cloud contamination and the dominance of fine mode aerosols to the total AOD440 nm according to the spectral variation of Ångström exponent as Gobbi [54] and Schuster [68] depicted. The spectral difference in the Ångström exponent (α), defined as δα = α440–675 nm − α675–870 nm, was used to distinguish aerosol growth from cloud contamination and to examine aerosol humidification using instantaneous observational data. In this framework, Rf is the modal radius of the smaller mode of the size distribution, η is defined as the fractional contribution of fine mode aerosol to total AOD440 nm. The AOD440 nm data are represented by different colors in Figure 8. The black solid lines represent a fixed size of the fine mode Rf, and the dashed blue lines represent a fixed fraction contribution η of the fine mode to the total AOD440 nm. The Ångström difference is presented as a function of the Ångström exponent (440–870 nm) and the AOD440 nm values for bimodal log-normal size distributions with refractive indices of m = 1.40–0.001i based on Gobbi [54].The climatology of Dubovik [15] also indicates that this refractive index (m = 1.40–0.001i) is typical of urban and industrial aerosols compared with the mineral dust aerosols (m = 1.53–0.003i) and plus water droplets (m = 1.33–0.000i). Gobbi [54] illustrates that there is a weaker sensitivity of the η curves than the Rf with the refractive index in the different classification scheme, and the scheme is robust enough to provide an operational classification of the aerosol properties or size distribution parameters within this level of indetermination. A cloud contamination or a contribution of coarse aerosols to the AOD of more than 90% will be located at δα ~ 0. In the opposite direction, hydration leads to an increase in fine mode aerosols (Rf) and an increase in the fractional contribution (η) of the fine mode aerosols to the total AOD440 nm.
Figure 8a shows that higher AOD440 nm values (>1.50) were associated with coarse mode particles (δα ~ 0, η < 20%) in some typical examples, which were mainly a result of the dust events that occurred in spring. While in summer, the high AOD440 nm values were mainly due to the fine mode particle growth corresponding to the increasing contribution of the fine fraction (Rf~ 0.15–0.25μm, η ~ 70%–99%) (Figure 8b).The extension of the measurement data from Dalian monitoring station to higher AOD440 nm values in summer was mainly a result of the humidification and coagulation (aging) of fine mode aerosols. There was a weaker growth of the fine mode particles in autumn (Figure 8c) (Rf~ 0.15 μm, η ~ 70%–90%), together with a lower water vapor content in the atmosphere. The winter plot for Dalian monitoring station shows that the coarse mode contamination and fine mode growth were the two major factors affecting the optical properties of the aerosols in this region.
Although these results do not have distinct clusters in the figures, the seasonal trend is similar compared to those found in the regional background at Longfengshan and Xinglong station [42,69]. These characteristics demonstrate that the extinction seen at Dalian monitoring station was not as high as that seen in urban areas in China. The Cimel photometer at Dalian is not part of AERONET, and the deriving of coarse and fine mode fraction of aerosol is underway which will be discussed further more. Moreover, there is no available Lidar or ceilometer measurement in this site, and this gap of the present situation would be filled to distinguish the aerosols at the surface or is the average of several layers containing different aerosol types in the future.

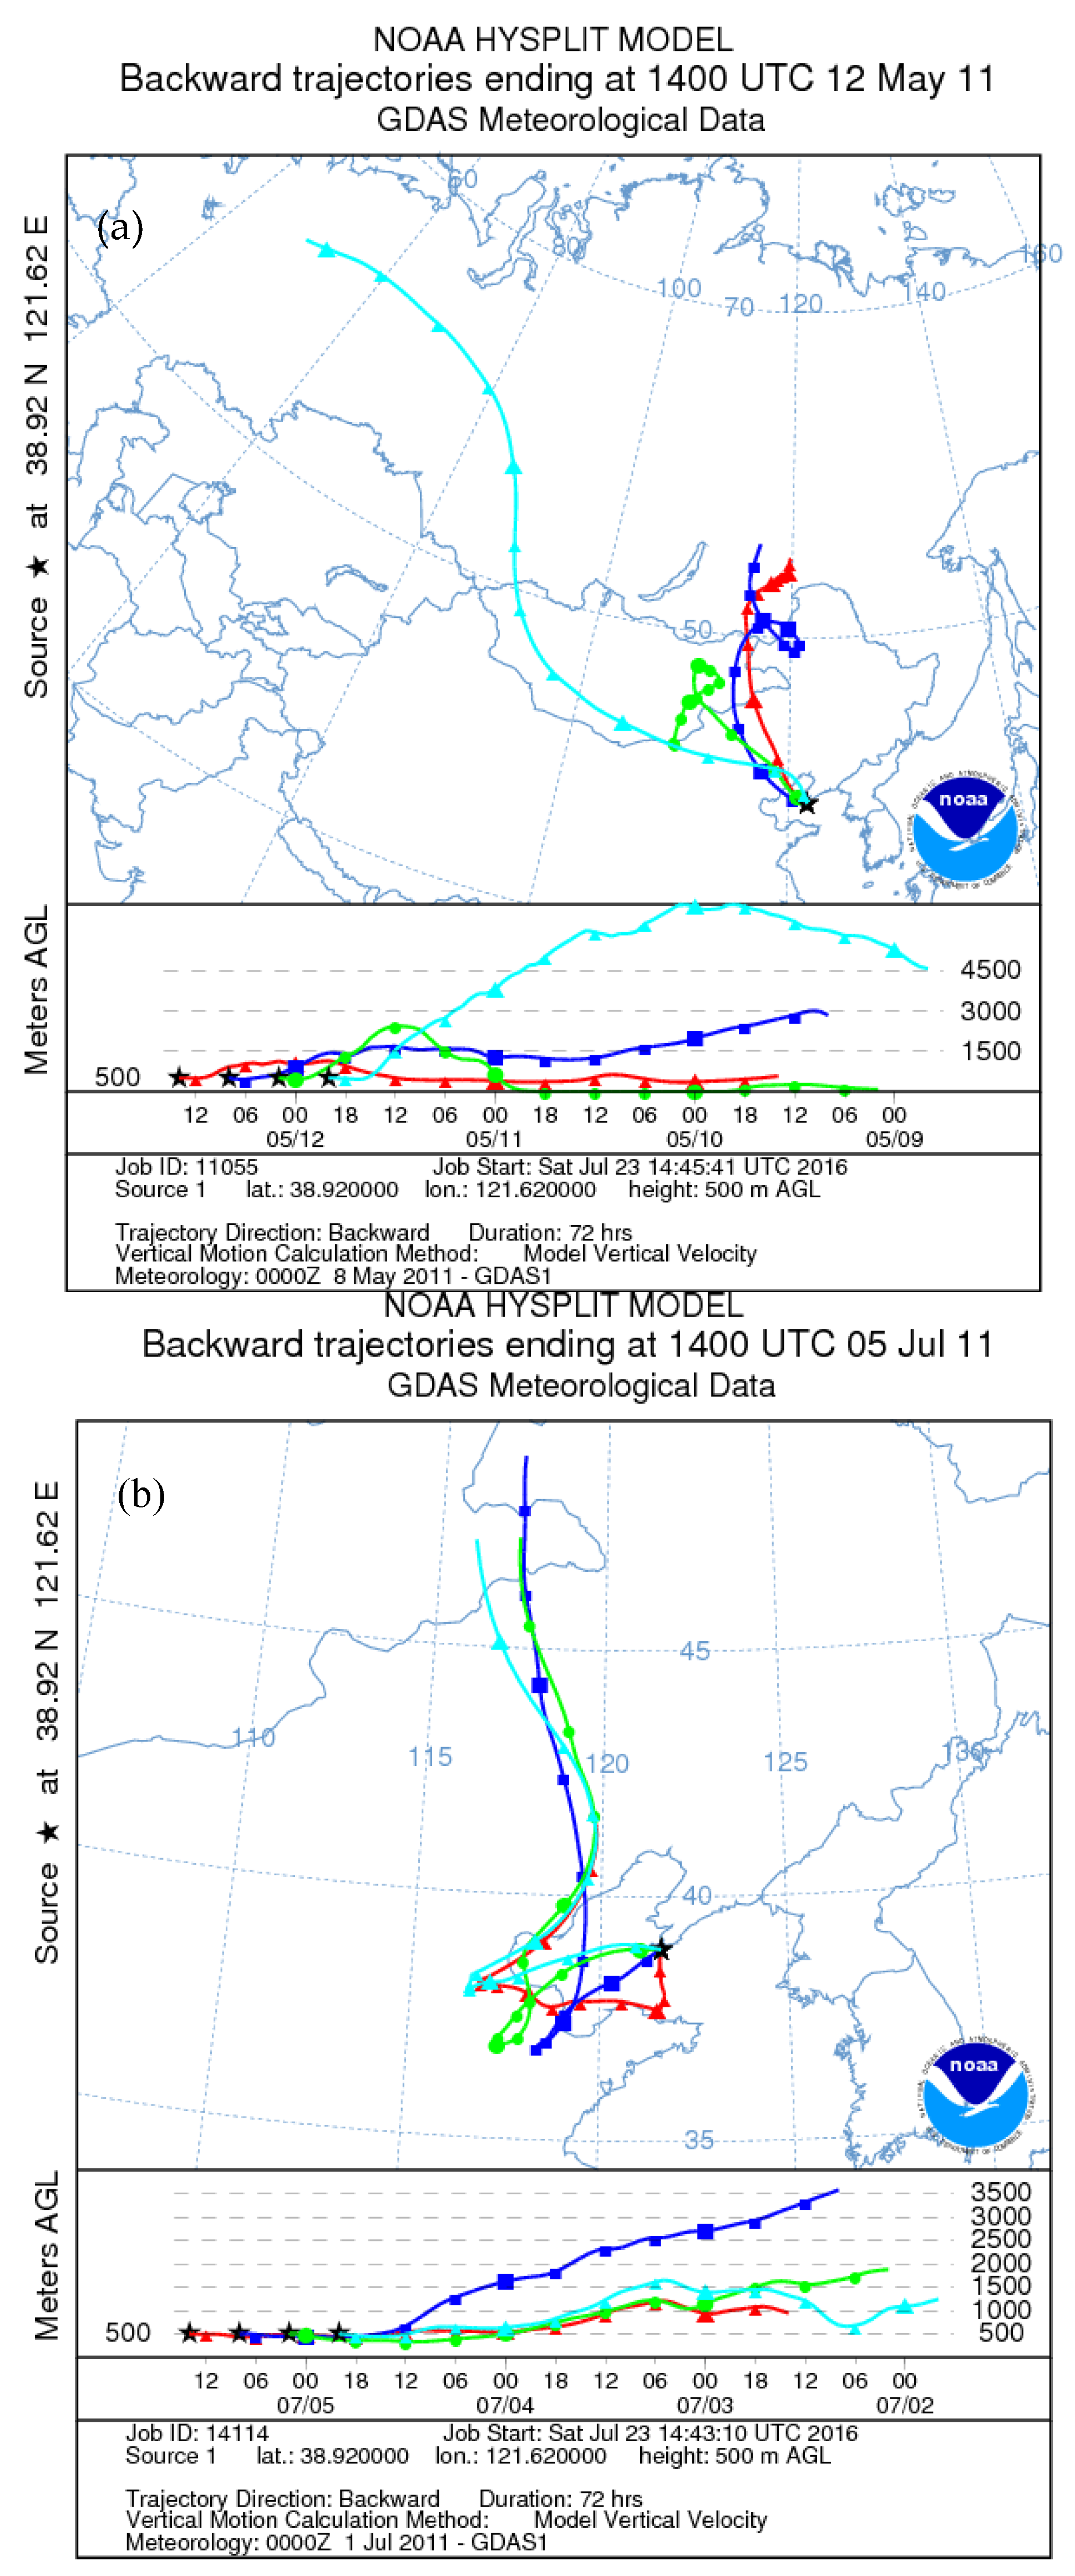
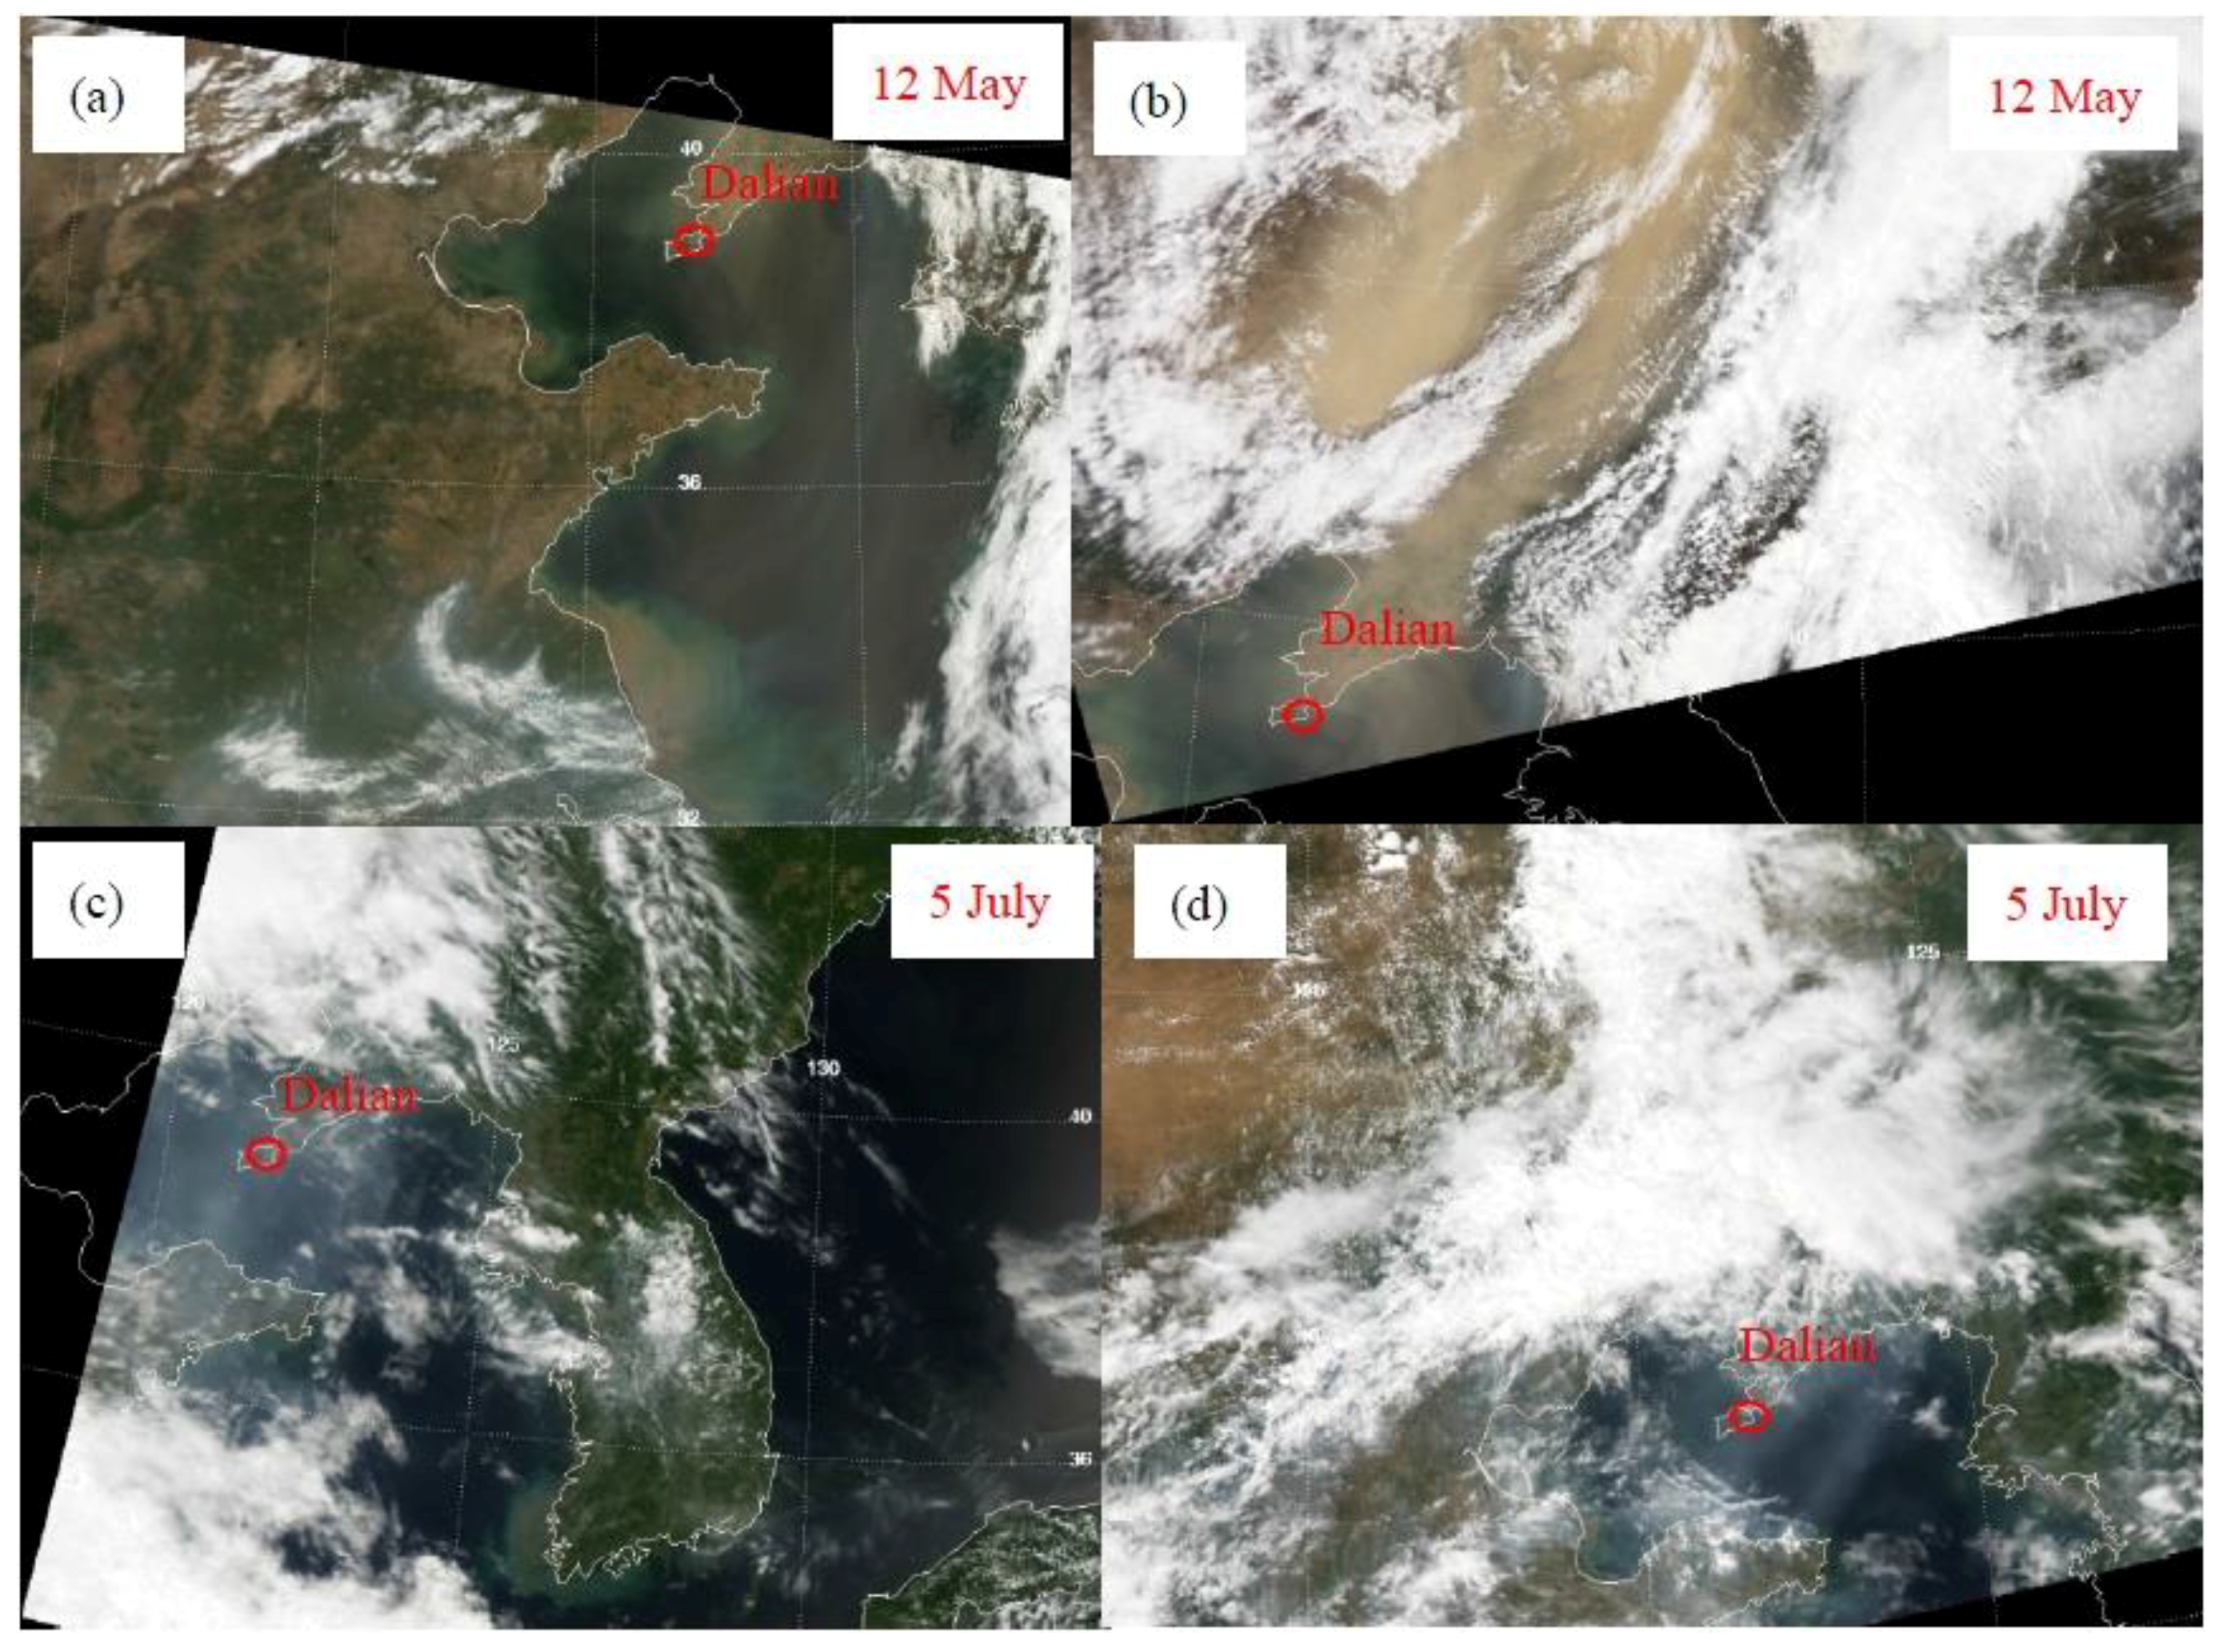
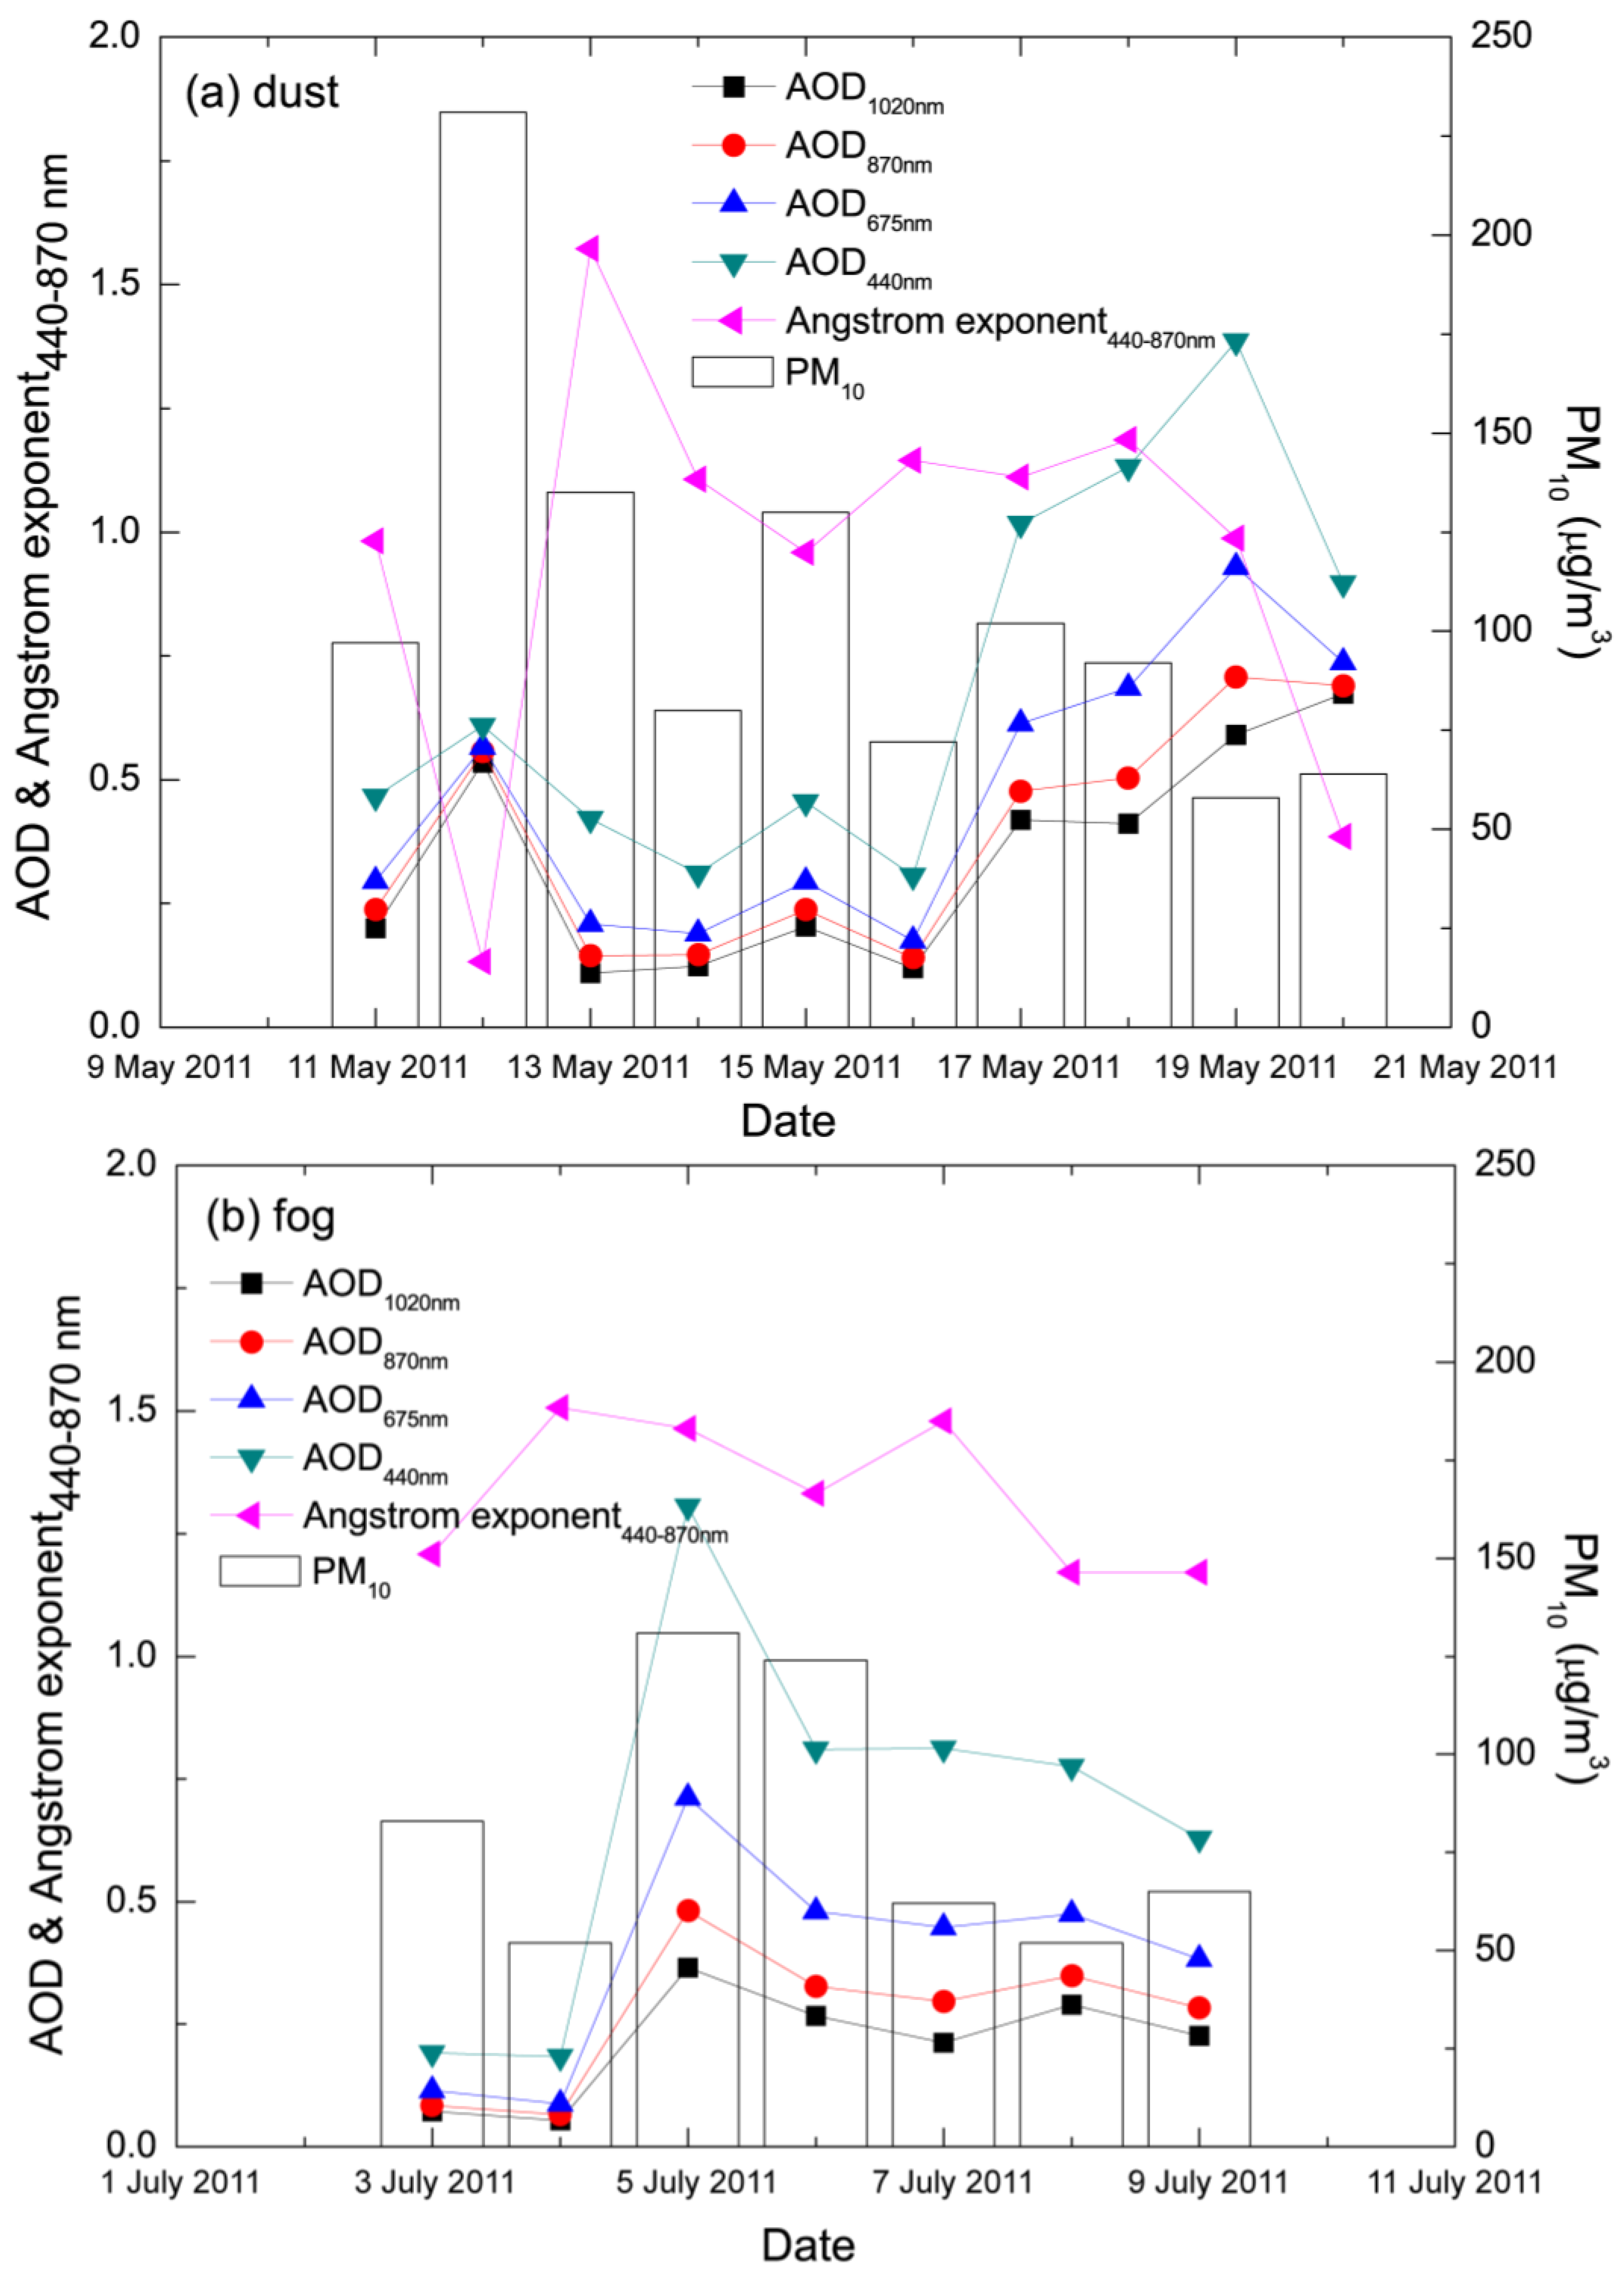
3.6.Variations in AOD and Ångström Exponent Values under Dust and Fog Conditions

Two typical examples of days with dust (12 May 2011) and fog (5 July 2011) conditions were selected based on satellite data and back-trajectory calculations to study the variations in the AOD and Ångström exponent values as well as the PM10 concentration during these weather events. The Terra satellite overpass at 10:30 (local time) and the Aqua satellite overpass at 13:30 (local time), respectively.
The MODIS satellite images in Figure 9a,b clearly show dust at Dalian monitoring station. The images in Figure 9c,d show fog either over or near to Dalian monitoring station. Figure 10a,b illustrate the transport of aerosol particles based on the NOAA HYSPLIT back-trajectory model analysis [70] of the dust and fog events, respectively.
The daily average values of AOD, Ångström exponent and PM10 for these two days are shown in Figure 11a,b. During the dust (12 May 2011) and fog (5 July 2011) events, the daily average AODs were 0.54, 0.56, 0.57, and 0.61 (dust) and 0.37, 0.48, 0.71, and 1.31 (fog) at 1020, 870, 675, and 440 nm, respectively. The AOD440 nm values on the foggy day were nearly 2.15 times larger than the values on the day with high levels of dust, which indicates a higher aerosol loading under foggy conditions. The Ångström exponent (440–870 nm) was about 0.13 on the day with high levels of dust and 1.46 on the foggy day. These values suggest that particles on the day with high levels of dust were dominated by coarse mode aerosols, whereas the fraction of fine mode particles was larger on the foggy day. The daily PM10 concentration was about 231 µg/m3 on the day with high levels of dust and 131 µg/m3 on the foggy day, which further suggests that coarse mode particles were dominant on the day with high levels of dust and exceeded China’s national ambient air quality standards [71] (150 µg/m3) (NAAQS, GB3095-2012) by 1.54 times.

4. Summary

This work analyzed the variations in the AOD and Ångström exponent retrieved from CE318 sun photometer data from April 2007 to April 2012 over the coastal area of Dalian in Northeast China. The results indicate that there is a lower aerosol loading and the particle size was smaller over Dalian compared with more urban regions of China.
The annual mean ± SD values of AOD440 nm and Ångström exponent (440–870 nm) at Dalian were about 0.58 ± 0.43, 0.60 ± 0.38, 0.69 ± 0.44, 0.56 ± 0.39 and 1.17 ± 0.30, 1.14 ± 0.30, 1.05 ± 0.33, 1.04 ± 0.36 in the years 2008, 2009, 2010, and 2011, respectively. The monthly mean ± SD values of AOD440 nm were higher in July (0.86 ± 0.45) and lower in January (0.42 ± 0.31). The monthly mean Ångström exponent (440–870 nm) increased from June to October and decreased to March. The variations in the AOD440 nm were higher in summer (0.76 ± 0.41) and lower in winter (0.45 ± 0.34). The fluctuation in the seasonal variations in the Ångström exponent (440–870 nm) showed a dominance of fine particles in the range 0.94–1.26 in this area. The frequency distributions of the AOD and Ångström exponent can be fitted to normal distributions with single peak values of about 0.26 and 1.06, respectively. The scatter grams of the instantaneous AOD and Ångström exponent at Dalian suggest different aerosol sizes in the spring and autumn, which are mostly populated with coarse and fine mode particles, respectively. The Ångström exponent curvature demonstrating the high extinction at Dalian shows that higher AOD (>1.00) values are associated with the addition of coarse mode particles (δα ~ 0, η < 20%) during dust events in spring and fine mode growth particles (δα < 0, η ~ 70%–99%) related to humidification and the growth of fine mode particles in summer by coagulation.
In this paper, there are also many other factors need further exploring as follows: (1) The coastal site Dalian is influenced by fog\cloud greatly which need the long term observation; (2) The observation of Lidar is needed to understand the vertical structure of aerosols; (3) The implementation of ceilometers is needed to assess the columnar aerosol measurements according to Wiegner [72]; (4) The water vapor absorption information in a spectral channel around 930–940 nm will be used to better understand the retrieved aerosol properties. Therefore, more works still need to be studied.

Acknowledgments

This work is financially supported by grants from the Project (41375153) supported by NSFC, the National Key Project of Basic Research (2014CB441201), the CAMS Basis Research Project (2014R17) and the Climate Change Special Fund of CMA (CCSF201504), the Project (2014IAE-CMA05) supported by Institute of Atmospheric Environment, the Special Project of Doctoral Research supported by Liaoning Provincial Meteorological Bureau (D201501). The authors gratefully acknowledge the NOAA Air Resources Laboratory (ARL) for the provision of the HYSPLIT transport and dispersion model and/or READY website used in this publication.

Author Contributions

Hujia Zhao wrote the article; Huizheng Che designed the experiments; Hujia Zhao, and Huizheng Che, performed the experiments; Yaqiang Wang, and Hong Wang analyzed the data; Yanjun Ma, Yangfeng Wang and Xiaoye Zhang helped perform the statistical analysis.

Conflicts of Interest

The authors declare no conflict of interest.

References

  1. Twomey, S.A.; Piepgrass, M.; Wolfe, T.L. An assessment of the impact of pollution on the global cloud Albedo. Tellus 1984, 36B, 356–366. [Google Scholar] [CrossRef]
  2. Hansen, J.; Sato, M.; Ruedy, R. Radiative forcing and climate response. J. Geophys. Res. 1997, 102, 6831–6864. [Google Scholar] [CrossRef]
  3. Hansen, J.; Sato, M.; Ruedy, R.; Lacis, A.; Oinas, V. Global warming in the twenty-first century: An alternative scenario. Proc. Nat. Acad. Sci. USA 2000, 97, 9875–9880. [Google Scholar] [CrossRef]
  4. Charlson, R.J.; Schwartz, S.E.; Hales, J.M.; Cess, D.; Coakley, J.A.; Hansen, J.E. Climate forcing by anthropogenic aerosols. Science 1992, 255, 423–430. [Google Scholar] [CrossRef] [PubMed]
  5. Watson, J.G. Visibility: Science and regulation. J. Air. Waste. Manag. Assoc. 2002, 52, 628–713. [Google Scholar] [CrossRef] [PubMed]
  6. Menon, S.; Hansen, J.E.; Nazarenko, L.; Luo, Y.F. Climate effects of black carbon aerosols in China and India. Science 2002, 297, 2249–2252. [Google Scholar] [CrossRef] [PubMed]
  7. Sharma, M.; Kaskaoutis, D.G.; Singh, R.P.; Singh, S. Seasonal variability of atmospheric aerosol parameters over Greater Noida using ground sun photometer observations. Aerosol Air Qual. Res. 2014, 14, 608–622. [Google Scholar]
  8. Myhre, G. Consistency between satellite-derived and modeled estimates of the direct aerosol effect. Science 2009, 325, 187–190. [Google Scholar] [CrossRef] [PubMed]
  9. Eck, T.F.; Holben, B.N.; Dubovik, O.; Smirnov, A.; Goloub, P.; Chen, H.B.; Chatenet, B.; Gomes, L.; Zhang, X.Y.; Tsay, S.C.; et al. Columnar aerosol optical properties at AERONET sites in central eastern Asia and aerosol transport to the tropical Mid-Pacific. J. Geophys. Res. 2005, 110. [Google Scholar] [CrossRef]
  10. Intergovernmental Panel on Climate Change (IPCC). Climate Change 2013. The Scientific Basis; Cambridge University Press: New York, NY, USA, 2013. [Google Scholar]
  11. Obregon, M.A.; Serrano, A.; Cancillo, M.L.; Cachorro, V.E.; Toledano, C. Aerosol radiometric properties at Western Spain (Caceres station). Int. J. Climatol. 2014, 35, 981–990. [Google Scholar] [CrossRef]
  12. Panicker, A.S.; Lee, D.I.; Kumkar, Y.V.; Kim, D.; Maki, M.; Uyeda, H. Decadal climatological trends of aerosol optical parameters over three different environments in South Korea. Int. J. Climatol. 2013, 33, 1909–1916. [Google Scholar] [CrossRef]
  13. Kaufman, Y.J.; Tanré, D.; Boucher, O. A satellite view of aerosols in the climate system. Nature 2002, 419, 215–223. [Google Scholar] [CrossRef] [PubMed]
  14. Holben, B.N.; Tanre, D.; Smirnov, A.; Eck, T.F.; Slutsker, I.; Abuhassan, N.; Newcomb, W.W.; Schafer, J.; Chatenet, B.; Lavenu, F.; et al. An emerging ground-based aerosol climatology: Aerosol optical depth from AERONET. J. Geophys. Res. 2001, 106, 12067–12097. [Google Scholar] [CrossRef]
  15. Dubovik, O.; Holben, B.N.; Eck, T.F.; Smirnov, A.; Kaufman, Y.J.; King, M.D.; Tanre, D.; Slutsker, I. Variability of absorption and optical properties of key aerosol types observed in worldwide locations. J. Atmos. Sci. 2002, 59, 590–608. [Google Scholar] [CrossRef]
  16. Russell, P.B.; Bergstrom, R.W.; Shinozuka, Y.; Clarke, A.D.; DeCarlo, P.F.; Jimenez, J.L.; Livingston, J.M.; Redemann, J.; Dubovik, O.; Strawa, A. Absorption angstrom exponent in AERONET and related data as an indicator of aerosol composition. Atmos. Chem. Phys. 2010, 10, 1155–1169. [Google Scholar] [CrossRef]
  17. Giles, D.M.; Holben, B.N.; Eck, T.F.; Sinyuk, A.; Smirnov, A.; Slutsker, I.; Dickerson, R.R.; Thompson, A.M.; Schafer, J.S. An analysis of AERONET aerosol absorption properties and classifications representative of aerosol source regions. J. Geophys. Res. 2012, 117, 1–16. [Google Scholar] [CrossRef]
  18. Kim, D.H.; Sohn, B.J.; Nakajima, T.; Takamura, T.; Choi, B.C.; Yoon, S.C. Aerosol optical properties over east Asia determined from ground-based sky radiation measurements. J. Geophys. Res. 2004, 109. [Google Scholar] [CrossRef]
  19. Holben, B.N.; Eck, T.F.; Slutsker, I.; Tanre, D.; Buis, J.P.; Setzer, A.; Vermote, E.; Reagan, J.A.; Kaufman, Y.; Nakajima, T.; et al. AERONET-A federated instrument network and data archive for aerosol characterization. Remote Sens. Environ. 1998, 66, 1–16. [Google Scholar] [CrossRef]
  20. Goloub, P.; Li, Z.; Dubovik, O.; Blarel, L.; Podvin, T.; Jankowiak, I.; Lecoq, R.; Deroo, C.; Chatenet, B.; Morel, J.P.; et al. PHOTONS/AERONET sun photometer network overview: Description, activities, results. Proc. SPIE 2007, 6936. [Google Scholar] [CrossRef]
  21. Bokoye, A.I.; Royer, A.; O’Neill, N.T.; Cliche, P.; Fedosejevs, G.; Teillet, P.M.; Mcarthur, L.J.B. Characterization of atmospheric aerosols across Canada from a Ground-based sun photometer network: Aerocan. Atmos. Ocean. 2001, 39, 429–456. [Google Scholar] [CrossRef]
  22. Takamura, T.; Nakajima, T. Overview of SKYNET and its activities. Opt. Puray. Apl. 2004, 37, 3303–3308. [Google Scholar]
  23. Pappalardo, G.; Amodeo, A.; Apituley, A.; Comeron, A.; Freudenthaler, V.; Linné, H.; Ansmann, A.; Bösenberg, J.; D’Amico, G.; Mattis, I.; et al. EARLINET: Towards an advanced sustainable European aerosol Lidar network. Atmos. Meas. Tech. 2014, 7, 2389–2409. [Google Scholar] [CrossRef] [Green Version]
  24. Che, H.Z.; Zhang, X.Y.; Chen, H.B.; Damiri, B.; Goloub, P.; Li, Z.Q.; Zhang, X.C.; Wei, Y.; Zhou, H.G.; Dong, F.; et al. Instrument calibration and aerosol optical depth validation of the China Aerosol Remote Sensing Network. J. Geophys. Res. 2009, 114. [Google Scholar] [CrossRef]
  25. Che, H.Z.; Zhang, X.Y.; Xia, X.A.; Goloub, P.; Holben, B.; Zhao, H.; Wang, Y.; Zhang, X.C.; Wang, H.; Blarel, L.; et al. Ground-based aerosol climatology of China: Aerosol optical depths from the China Aerosol Remote Sensing Network (CARSNET) 2002–2013. Atmos. Chem. Phys. 2015, 15, 7619–7652. [Google Scholar] [CrossRef]
  26. Gui, K.; Che, H.Z.; Chen, Q.L.; Yu, J.; Zheng, Y.; Lu, S.; Wang, H.; Wang, Y.Q.; Zhang, X.Y.; Shi, G.Y. Analysis of the error in retrievals of aerosol optical properties from sun photometer measurements of CARSNET due to a variety of objective factors. Atmosphere 2016, 7. [Google Scholar] [CrossRef]
  27. Xin, J.; Wang, Y.; Li, Z.; Wang, P.; Hao, W.; Nordgren, B.; Wang, S.; Liu, G.; Wang, L.; Wen, T.; et al. Aerosol optical depth (AOD) and angstrom exponent of aerosols observed by the Chinese Sun Hazemeter Network from August 2004 to September 2005. J. Geophys. Res. 2007, 112. [Google Scholar] [CrossRef]
  28. Cheng, Y.F.; Wiedensohler, A.; Eichler, H.; Su, H.; Gnacuk, T.E. Aerosol optical properties and related chemical apportionment at Xinken in Pearl River Delta of China. Atmos. Environ. 2008, 42, 6351–6372. [Google Scholar] [CrossRef]
  29. Che, H.; Shi, G.; Uchiyama, A.; Yamazaki, A.; Chen, H.; Goloub, P.; Zhang, X. Inter comparison between aerosol optical properties by a PREDE sky radiometer and CIMEL sun photometer over Beijing, China. Atmos. Chem. Phys. 2008, 8, 3199–3214. [Google Scholar] [CrossRef]
  30. Che, H.Z.; Xia, X.A.; Zhu, J.; Wang, H.; Wang, Y.Q.; Sun, J.Y.; Zhang, X.C.; Zhang, X.Y.; Shi, G.Y. Aerosol optical properties under the condition of heavy haze over an urban site of Beijing, China. Environ. Sci. Pollut. Res. 2015, 22, 1043–1053. [Google Scholar] [CrossRef] [PubMed]
  31. Xia, X.; Chen, H.; Goloub, P.; Zong, X.; Zhang, W.; Wang, P. Climatological aspects of aerosol optical properties in North China Plain based on ground and satellite remote-sensing data. J. Quant. Spectrosc. Radiat. Transf. 2013, 127, 12–23. [Google Scholar] [CrossRef]
  32. Zhuang, B.L.; Wang, T.J.; Li, S.; Liu, J.; Talbot, R.; Mao, H.T.; Yang, X.Q.; Fu, C.B.; Yin, C.Q.; Zhu, J.L.; et al. Optical properties and radiative forcing of urban aerosols in Nanjing, China. Atmos. Environ. 2014, 83, 43–52. [Google Scholar] [CrossRef]
  33. Gui, K.; Che, H.Z.; Chen, Q.L.; An, L.C.; Zeng, Z.L.; Guo, Z.Y.; Zheng, Y.; Wang, H.; Wang, Y.Q.; Yu, J.; et al. Aerosol optical properties based on ground and satellite retrievals during a serious haze episode in December 2015 over Beijing. Atmosphere 2016, 7. [Google Scholar] [CrossRef]
  34. Zheng, Y.; Che, H.Z.; Zhao, T.L.; Xia, X.X.; Gui, K.; An, L.C.; Qi, B.; Wang, H.; Wang, Y.Q.; Yu, J.; et al. Aerosol optical properties over Beijing during the World Athletics Championships and Victory Day Military Parade in August and September 2015. Atmosphere 2016, 7. [Google Scholar] [CrossRef]
  35. Zhang, M.; Ma, Y.Y.; Gong, W.; Zhu, Z.M. Aerosol optical properties of a haze episode in Wuhan based on ground-based and satellite observations. Atmosphere 2014, 5, 699–719. [Google Scholar] [CrossRef]
  36. Zhang, R.J.; Tao, J.; Ho, K.F.; Shen, Z.X.; Wang, G.H.; Cao, J.J.; Liu, S.X.; Zhang, L.M.; Lee, S.C. Characterization of atmospheric organic carbon and elemental carbon of PM2.5 in a typical semi-arid area of Northeastern China. Aerosol Air Qual. Res. 2012, 12, 792–802. [Google Scholar] [CrossRef]
  37. Cheng, T.T.; Liu, Y.; Lu, D.R.; Xu, Y.F.; Li, H.Y. Aerosol properties and radiative forcing in HunshanDakeDesert, northern China. Atmos. Environ. 2006, 40, 2169–2179. [Google Scholar] [CrossRef]
  38. Xia, X.; Chen, H.; Goloub, P.; Zhang, W.; Chatenet, B.; Wang, P. A compilation of Aerosol optical properties and calculation of direct radiative forcing over an urban region in northern China. J. Geophys. Res. 2007, 112. [Google Scholar] [CrossRef]
  39. Xia, X.; Chen, H.; Li, Z.; Wang, P.; Wang, J. Significant reduction of surface solar irradiance induced by aerosols in a suburban region in Northeastern China. J. Geophys. Res. 2007, 112. [Google Scholar] [CrossRef]
  40. Zhao, H.J.; Che, H.Z.; Ma, Y.J.; Xia, X.A.; Wang, Y.F.; Wang, P.; Wu, X.C. Temporal variability of the visibility, particulate matter mass concentration and aerosol optical properties over an urban site in Northeast China. Atmos. Res. 2015, 166, 204–212. [Google Scholar] [CrossRef]
  41. Zhao, H.J.; Che, H.Z.; Zhang, X.Y.; Ma, Y.J.; Wang, Y.F.; Wang, X.X.; Liu, C.; Hou, B.; Che, H.C. Aerosol optical properties over urban and industrial region of Northeast China by using ground-based sun-photometer measurement. Atmos. Environ. 2013, 75, 270–278. [Google Scholar] [CrossRef]
  42. Wang, P.; Che, H.Z.; Zhang, X.C.; Song, Q.L.; Wang, Y.Q.; Zhang, Z.H.; Dai, X.; Yu, D.J. Aerosol optical properties of regional background atmosphere in Northeast China. Atmos. Environ. 2010, 44, 4404–4412. [Google Scholar] [CrossRef]
  43. Wu, Y.; Zhu, J.; Che, H.; Xia, X.; Zhang, R. Column-integrated aerosol optical properties and direct radiative forcing based on sun photometer measurements at a semi-arid rural site in Northeast China. Atmos. Res. 2015, 157, 56–65. [Google Scholar] [CrossRef]
  44. Wu, Y.F.; Zhang, R.J.; Pu, Y.F.; Zhang, L.M.; Ho, K.F.; Fu, C.B. Aerosol optical properties observed at a semi-arid rural site in Northeastern China. Aerosol Air Qual. Res. 2012, 12, 503–514. [Google Scholar] [CrossRef]
  45. Wang, Y.; Shi, H.Q.; He, M.Y.; Huang, S.X. Distribution of atmospheric aerosol optical depth in Southeast China and coastland. Res. Environ. Sci. 2010, 23, 634–641. [Google Scholar]
  46. Luo, Y.F.; Li, W.L.; Zhou, X.J. Analysis of the 1980’ atmospheric aerosol optical depth over China. Acta Meteorol. Sin. 2001, 59, 77–87. [Google Scholar]
  47. Luo, Y.F.; Lv, D.R.; He, Q.; Wang, F. An analysis of direct solar radiation, visibility and aerosol optical depth in South China coastal area. Clim. Environ. Res. 2000, 5, 36–44. (In Chinese) [Google Scholar]
  48. Luo, Y.F.; Lv, D.R.; Zhou, X.J.; Li, W.L. Analyses on the spatial distribution of aerosol optical depth over China in recent 30 years. Chin. J. Atmos. Sci. 2002, 26, 721–730. (In Chinese) [Google Scholar]
  49. Xu, Q.; Zhu, X.H.; Henkelmann, B.; Schramm, K.; Chen, J.P.; Ni, Y.W.; Wang, W.; Pfister, G.; Mu, J.; Qin, S.T.; et al. Simultaneous monitoring of PCB profiles in the urban air of Dalian, China with active and passive samplings. J. Environ. Sci. 2013, 25, 133–143. [Google Scholar] [CrossRef]
  50. Zhang, X.Y.; Jiang, H.; Zhang, Q.X.; Zhang, X. Chemical characteristics of rainwater in Northeast China, a case study of Dalian. Atmos. Res. 2012, 116, 151–160. [Google Scholar] [CrossRef]
  51. Liu, W.; Jin, Y.H.; Quan, X.; Sasaki, K.; Saito, N.; Nakayama, S.; Sato, I.; Tsuda, S. Perfluorosulfonates and perfluorocarboxylates in snow and rain in Dalian, China. Environ. Int. 2009, 35, 737–742. [Google Scholar] [CrossRef] [PubMed]
  52. Tao, R.; Che, H.Z.; Chen, Q.L.; Wang, Y.Q.; Sun, J.Y.; Zhang, X.C.; Lu, S.; Guo, J.P.; Wang, H.; Zhang, X.Y. Development of an integrating sphere calibration method for Cimelsunphotometers in China aerosol remote sensing network. Particuology 2014, 13, 88–99. [Google Scholar] [CrossRef]
  53. Smirnov, A.; Holben, B.N.; Eck, T.F.; Dubovik, O.; Slutsker, I. Cloud screening and quality control algorithms for the AERONET data base. Remote Sens. Environ. 2000, 73, 337–349. [Google Scholar] [CrossRef]
  54. Gobbi, G.P.; Kaufman, Y.J.; Koren, I.; Eck, T.F. Classification of aerosol properties derived from AERONET direct sun data. Atmos. Chem. Phys. 2007, 7, 453–458. [Google Scholar] [CrossRef]
  55. Cao, X.C.; Shao, L.M.; Wang, X.X. Analysis of climate characteristics of low atmospheric visibility at Dalian. Mar. Forecast. 2011, 28, 44–49. (In Chinese) [Google Scholar]
  56. Guo, B.J.; He, Q.S.; Li, C.C.; Mao, J.T.; Xin, T.E.; Chen, X.Z.; Li, H.B.; Huang, T.; Song, Y. Remote sensing study of a dust event over Dalian. J. Nanjing Inst. Meteorol. 2008, 31, 624–632. (In Chinese) [Google Scholar]
  57. Song, Y.; Huang, T.; Cheng, X.K.; Li, D. Analysis on mechanism characteristic of sand-dust events affecting Dalian in 2006. Meteorol. Mon. 2008, 34, 34–39. (In Chinese) [Google Scholar]
  58. Yan, P.; Pan, X.L.; Tang, J.; Zhou, X.J.; Zhang, R.J.; Zeng, L.M. Hygroscopic growth of aerosol scattering coefficient: A comparative analysis between urban and suburban sites at winter in Beijing. Particuology 2009, 7, 52–60. [Google Scholar] [CrossRef]
  59. Bian, H.; Chin, M.; Rodriguez, J.M.; Yu, H.; Penner, J.E.; Strahan, S. Sensitivity of aerosol optical thickness and aerosol direct radiative effect to relative humidity. Atmos. Chem. Phys. 2009, 9, 2375–2386. [Google Scholar] [CrossRef]
  60. Li, W.J.; Shao, L.Y.; Buseck, P.R. Haze types in Beijing and the influence of agricultural biomass burning. Atmos. Chem. Phys. 2010, 10, 8119–8130. [Google Scholar] [CrossRef]
  61. Kroll, J.H.; Seinfeld, J.H. Chemistry of Secondary Organic Aerosol: Formation and Evolution of Low volatility Organics in the Atmosphere. Atmos. Environ. 2008, 42, 3593–3624. [Google Scholar] [CrossRef]
  62. Wan, X.L. Analysis on inorganic compositions of aerosol in Dalian urban. Environ. Monit. China 2005, 21, 21–23. (In Chinese) [Google Scholar]
  63. He, Q.; Li, C.; Geng, F.; Lei, Y.; Li, Y. Study on Long-term aerosol distribution over the land of East China using MODIS data. Aerosol Air Qual. Res. 2012, 12, 304–319. [Google Scholar] [CrossRef]
  64. Chen, Y.Z.; Zhao, D.; Chai, F.H.; Liang, G.X.; Xue, Z.G.; Wang, B.B.; Liang, Y.J.; Chen, Y.; Zhang, M. Correlation between the atmospheric visibility and aerosol fine particle concentrations in Guangzhou and Beijing. China Environ. Sci. 2010, 30, 967–971. (In Chinese) [Google Scholar]
  65. Zhang, H.; Shi, C.E.; Qiu, M.Y.; Xie, W. Long-term variation of haze phenomena in Hefei and its impact factors. Acta Sci. Circumst. 2010, 30, 714–721. (In Chinese) [Google Scholar]
  66. Guo, J.P.; Zhang, X.Y.; Che, H.Z.; Gong, S.L.; An, X.Q.; Cao, C.X.; Guang, J.; Zhang, H.; Wang, Y.Q.; Zhang, X.C.; et al. Correlation between PM concentrations and aerosol optical depth in Eastern China. Atmos. Environ. 2009, 43, 5876–5886. [Google Scholar] [CrossRef]
  67. Qu, W.J.; Arimoto, R.; Zhang, X.Y.; Zhao, C.H. Spatial distribution and inter annual variation of surface PM10 concentrations over eighty-six Chinese cities. Atmos. Chem. Phys. 2010, 10, 5641–5662. [Google Scholar] [CrossRef]
  68. Schuster, G.L.; Oleg, D.; Holben, B.N. Angstrom exponent and bimodal aerosol size distributions. J. Geophys. Res. 2006, 111, 1–14. [Google Scholar] [CrossRef]
  69. Zhu, J.; Che, H.Z.; Xia, X.A.; Chen, H.B.; Goloub, P.; Zhang, W.X. Column-integrated aerosol optical and physical properties at a regional background atmosphere in North China Plain. Atmos. Environ. 2014, 84, 54–64. [Google Scholar] [CrossRef]
  70. Draxler, R.R.; Rolph, G.D. Hybrid Single-Particle Lagrangian Integrated Trajectory; NOAA: Silver Spring, MD, USA, 2003.
  71. NAAQS. National Standard of the People’s Republic of China Ambient Air Quality Standard (GB3095-2012). Available online: http://kjs.mep.gov.cn/hjbhbz/bzwb/dqhjbh/dqhjzlbz/201203/t20120302_224165.htm (accessed on 5 August 2016).
  72. Wiegner, M.; Madonna, F.; Binietoglou, I.; Forkel, R.; Gasteiger, J.; Gaib, A.; Pappalardo, G.; Schäfer, K.; Thomas, W. What is the benefit of ceilometers for aerosol remote sensing? An answer from EARLINET. Atmos. Meas. Tech. 2014, 7, 1979–1997. [Google Scholar] [CrossRef]
Figure 1. Geographical location of Dalian monitoring station on the southern tip of Liaodong Peninsula, China.
Atmosphere 07 00103 g001
Figure 2. Annual variations with mean ± SD in the (a) AOD and (b) Ångström exponent at Dalian monitoring station.
Atmosphere 07 00103 g002
Figure 3. Monthly variations with mean ± SD in the (a) AOD440 nm and (b) Ångström exponent at Dalian monitoring station.
Atmosphere 07 00103 g003
Figure 4. Seasonal variations with mean ± SD in the (a) AOD and (b) Ångström exponent at Dalian monitoring station.
Atmosphere 07 00103 g004
Figure 5. Frequency of the daily values of the (a) AOD and (b) Ångström exponent at Dalian monitoring station.
Atmosphere 07 00103 g005
Figure 6. Scatter grams of the daily AOD and Ångström exponents at Dalian monitoring station in (a) spring; (b) summer; (c) autumn; and (d) winter.
Atmosphere 07 00103 g006aAtmosphere 07 00103 g006b
Figure 7. Scatter grams of the daily AOD and (a) wind speed; (b) temperature; (c) relative humidity (RH); and (d) PM10 at Dalian monitoring station.
Atmosphere 07 00103 g007aAtmosphere 07 00103 g007b
Figure 8. Ångström exponent difference (δα, α440–670 nm − α670–870 nm) as a function of the Ångström exponent440–870 nm and AOD440 nm. Only cloud-screened data with AOD > 0.15 were used. (a) Spring; (b) summer; (c) autumn; and (d) winter.
Atmosphere 07 00103 g008aAtmosphere 07 00103 g008b
Figure 9. MODIS satellite images at the time of the Terra satellite overpass at 10:30 (local time) and the Aqua satellite overpass at 13:30 (local time), respectively over Dalian monitoring station for dust events on 12 May 2011 of (a) Terra images and (b) Aqua images and for fog events on 5 July 2011 of (c) Terra images and (d) Aqua images.
Atmosphere 07 00103 g009
Figure 10. HYSPLIT back-trajectories on Dalian monitoring station for (a) dust and (b) fog events.
Atmosphere 07 00103 g010
Figure 11. Daily average values of AOD, Ångström exponent and PM10 at Dalian, China for (a) dust and (b) fog events.
Atmosphere 07 00103 g011
Table 1. Observation of numbers and days of level 1.5 sun direct data for AOD and Ångström exponent.
Number of DaysNumber of Instantaneous Data
200720082009201020112012200720082009201020112012
January 1226133016 292759149893199
February 152022320 34759716613422
March 92522820 175930151030337
April610222221530422986310810387
May106231226 31373894315727
June 14252021 192692732477
July 8221811 96383287218
August 11201413 121456370289
September1120141622 154237167365713
October513192714 97185343870422
November2017722 40245356524
December181917236 36544211846666
Table 2. The average values of AOD440 nm and meteorological parameters within different ranges of AOD440 nm.
Range of AOD440 nmAOD440 nmWind Speed (m/s)Temperature (°C)RH (%)PM10 (µg/m3)
0.00–0.150.13 ± 0.023.6 ± 1.23.1 ± 10.446 ± 744.4 ± 13.1
0.15–0.300.22 ± 0.043.2 ± 1.22.4 ± 10.649 ± 1252.3 ± 22.3
0.30–0.400.34 ± 0.032.9 ± 1.28.2 ± 11.052 ± 1666.1 ± 26.6
0.40–0.700.54 ± 0.082.9 ± 1.110.8 ± 10.561 ± 1768.7 ± 31.3
0.70–1.000.83 ± 0.083.0 ± 1.114.4 ± 9.266 ± 1873.6 ± 35.6
1.00–1.501.22 ± 0.132.8 ± 1.012.9 ± 10.877 ± 1668.5 ± 32.2
1.50–2.001.63 ± 0.093.0 ± 1.315.8 ± 8.374 ± 2067.7 ± 36.5

