Article

Comparative Analysis of Atmospheric Glyoxal Column Densities Retrieved from MAX-DOAS Observations in Pakistan and during MAD-CAT Field Campaign in Mainz, Germany

by
Muhammad Fahim Khokhar
*,
Syeda Ifraw Naveed
,
Junaid Khayyam Butt
and
Zain Abbas
Institute of Environmental Sciences and Engineering, National University of Sciences and Technology, Islamabad 44000, Pakistan
*
Author to whom correspondence should be addressed.
Atmosphere 2016, 7(5), 68; https://doi.org/10.3390/atmos7050068
Submission received: 14 February 2016 / Revised: 9 May 2016 / Accepted: 12 May 2016 / Published: 17 May 2016
(This article belongs to the Special Issue Air Pollution in the Asia-Pacific Region)

Abstract

:
Photolysis of glyoxal (CHOCHO) and other volatile organic compounds (VOC) in the presence of NOx results in tropospheric ozone and secondary organic pollutants formation. Glyoxal, with a relatively short lifetime, plays an important role in VOC formation in the planetary boundary layer. This study presents a comparative analysis of CHOCHO retrieval from mini MAX-DOAS observations at two different monitoring sites in Germany and Pakistan. Firstly, CHOCHO differential slant column densities (DSCDs) were retrieved by using differential optical absorption spectroscopy (DOAS) technique during a field campaign called MAD-CAT (Multi Axis DOAS-Comparison Campaign for Aerosols and Trace gases) from 18 June to 17 July 2013 in Mainz, Germany (49.965387°N, 8.242531°E). A second dataset was acquired from 18 June to 17 July 2015 at ground-based measurements taken with mini MAX-DOAS at IESE (Institute of Environmental Sciences and Engineering), NUST (National University of Sciences and Technology) Islamabad (33.6416°N, 72.9835°E), Pakistan. Tropospheric vertical column densities (VCDs) of CHOCHO were derived from measured DSCDs by using geometric air mass factor approach. Results show that CHOCHO emissions from biogenic sources are largely driven by actinic flux. Covariance of ambient temperature and relative humidity was also investigated at both sites. Significant correlation between actinic flux and CHOCHO VCDs (r > 0.8) along with similar diurnal variation was observed at both monitoring sites. Quantitative difference observed in CHOCHO VCDs is primarily triggered by the difference in actinic flux and vegetation profiles of both monitoring sites.

1. Introduction

An increasing world population is driving rapid urbanization, industrialization, and an increase in transportation. Consequently, this leads to rising urban air pollution and health problems. Large cities may offer better quality of life but at the cost of air quality degradation caused by tropospheric ozone and other chemically reactive gases [1,2]. Photochemical smog that hangs over various cities around the globe is produced by reactive carbon-containing compounds such as volatile organic compounds (VOC), and oxides of nitrogen (NO + NO2) in the presence of sunlight. A large number of different VOC species exists in Earth’s atmosphere with highly vacillating reactivity, but present in small mixing ratios in parts per billion (ppbv) or per trillion (pptv) [3]. VOCs with their chemical nature, can influence directly as well as indirectly, agriculture, [4] regional climate [5], and human health [6,7]. VOC oxidation produces the smallest and simplest α di-carbonyl known as glyoxal (CHOCHO). It is among the list of the most predominant carbonyl species in the troposphere [3,8]. It has a short chemical lifetime that largely depends on the photolysis rate and its reaction with OH radicals [9,10]. An average lifetime of 1–2 hours in the boundary layer and troposphere is determined by overhead sun conditions [2], and 2–3 hours worldwide [8,11] are reported. CHOCHO accounts for 45 Tg/a emissions globally, in which oxidation of biogenic hydrocarbons accounts for 55%, biomass burning 20%, biofuel 17%, and anthropogenic sources 8%, respectively [11]. Among biogenic sources, isoprene and monoterpenes are dominant sources of CHOCHO. Plants emit isoprene during photosynthesis and its emission rate increases with an increase in temperature [3]. In the troposphere, approximately 65%–70% total CHOCHO emissions [3,8,11] and 44% of total VOC flux make isoprene the dominant source of most existing non-methane VOC (NMVOC) [12]. The second-largest precursor of CHOCHO is acetylene, which is anthropogenic and contributes 20% with a lifetime of 18 days ([11]] and references therein).
CHOCHO is eliminated from the troposphere through many pathways. The most prominent removal is through photolysis [3,13,14]. Many researchers reported OH oxidation as second most critical removal mechanism of atmospheric CHOCHO [3,15]. Secondary organic aerosol (SOA) formation is another CHOCHO eliminator [3,16], while the rest include NO3 oxidation, dry and wet deposition [3,11].
Various studies reported the atmospheric monitoring of CHOCHO across the globe during the last decade. For instance, direct atmospheric CHOCHO measurements by using long path DOAS (LP-DOAS) was conducted as a part of the MCMA-2003 (Mexico City Metropolitan Area Field Campaign) field campaign in Mexico City and reported concentrations were up to 1.8 ppbV as second order photochemical products in roadside traffic emissions. However direct traffic emissions were reported to be smaller (<4%) [2]. A comparative study was done in Southeast Asian region by using LP-DOAS and MAX-DOAS in order to explore CHOCHO and formaldehyde photochemistry over the rainforests. They concluded that CHOCHO is more abundant over the forest canopy as compared to any rural environment and a majority of CHOCHO is found confined within the first 500 m of the boundary layer [10]. The most important pathway of CHOCHO production was isoprene oxidation by OH radical [10]. During the International Consortium for Atmospheric Research on Transport and Transformation (ICARTT) campaign in 2004, optical densities of CHOCHO were measured up to 350 ppt [17] and 0.4 ppb during the PRIDE-PRD campaign in the Pearl River Delta region (PRD), China [18]. Using CU GMAX-DOAS at a coastal site near Pensacola, Florida, CHOCHO was detected with average tropospheric vertical column densities of about 4 × 10¹⁴ molecules/cm2 [19]. Recent advancement has been made in satellite-based mnitoring of CHOCHO, spatial distributions [13,20,21,22], and its validation with ground based measurements [2,10,23,24,25,26,27].
This study presents a comparative analysis of atmospheric CHOCHO monitored during the MAD-CAT (Multi Axis DOAS-Comparison campaign for Aerosols and Trace gases) field campaign from June to July 2013 in Mainz, Germany and at recently-established monitoring site at the Institute of Environmental Sciences and Engineering Islamabad, Pakistan from June to July 2015. The MAD-CAT field campaign was organized by the satellite remote sensing group at the Max-Planck Institute for Chemistry in Mainz, Germany. Altogether, eleven institutes from Asia, Europe, and USA participated in the field campaign.
Although Pakistan is not a prominent contributor of global GHG emissions, it is very vulnerable to adverse impacts of climate change and extreme weather events such as devastating floods in 2010 [28,29], droughts [30], food security [31], health issues [32], causalities due to heat waves [33], and intense cold episodes [34]. In order to keep records of these changes, a continuous monitoring of the atmospheric composition of the Pakistan region is mandatory. However, economical constraints, geopolitical issues, and lack of research, air monitoring facilities, and strict environmental regulations exacerbate the environmental problems in this region. According to a report by an economic survey of Pakistan (2014–2015), not a single air quality monitoring station has been operational in the country since 2010. Therefore, in a country like Pakistan with no continuous air quality monitoring facility and a poor implementation of air quality regulations, this study may provide vital information about the monitoring of chemically-active trace gases like CHOCHO. The objective of the present study is to monitor the atmospheric CHOCHO and its behavior over both monitoring sites: in Pakistan and Germany during the summer months. Further emphasis is to explore the influence of metrological parameters such as solar irradiance, temperature, and humidity on glyoxal concentrations.

2. Datasets and Methodology

2.1. MAD-CAT Field Campaign

The MAD-CAT field campaign was conducted in Mainz, Germany from 17 June to 15 July 2013. The campaign includes global participation from world-renowned institutes in the field of atmospheric sciences from China, Belarus, India, USA, Belgium, Romania, Pakistan, and Germany (for details see [35]). All instruments (for trace gas, aerosol and meteorological parameters) were installed on the roof of the Max Planck Institute for Chemistry (MPI-Ch) building in Mainz (Germany) and collected data for the whole period.

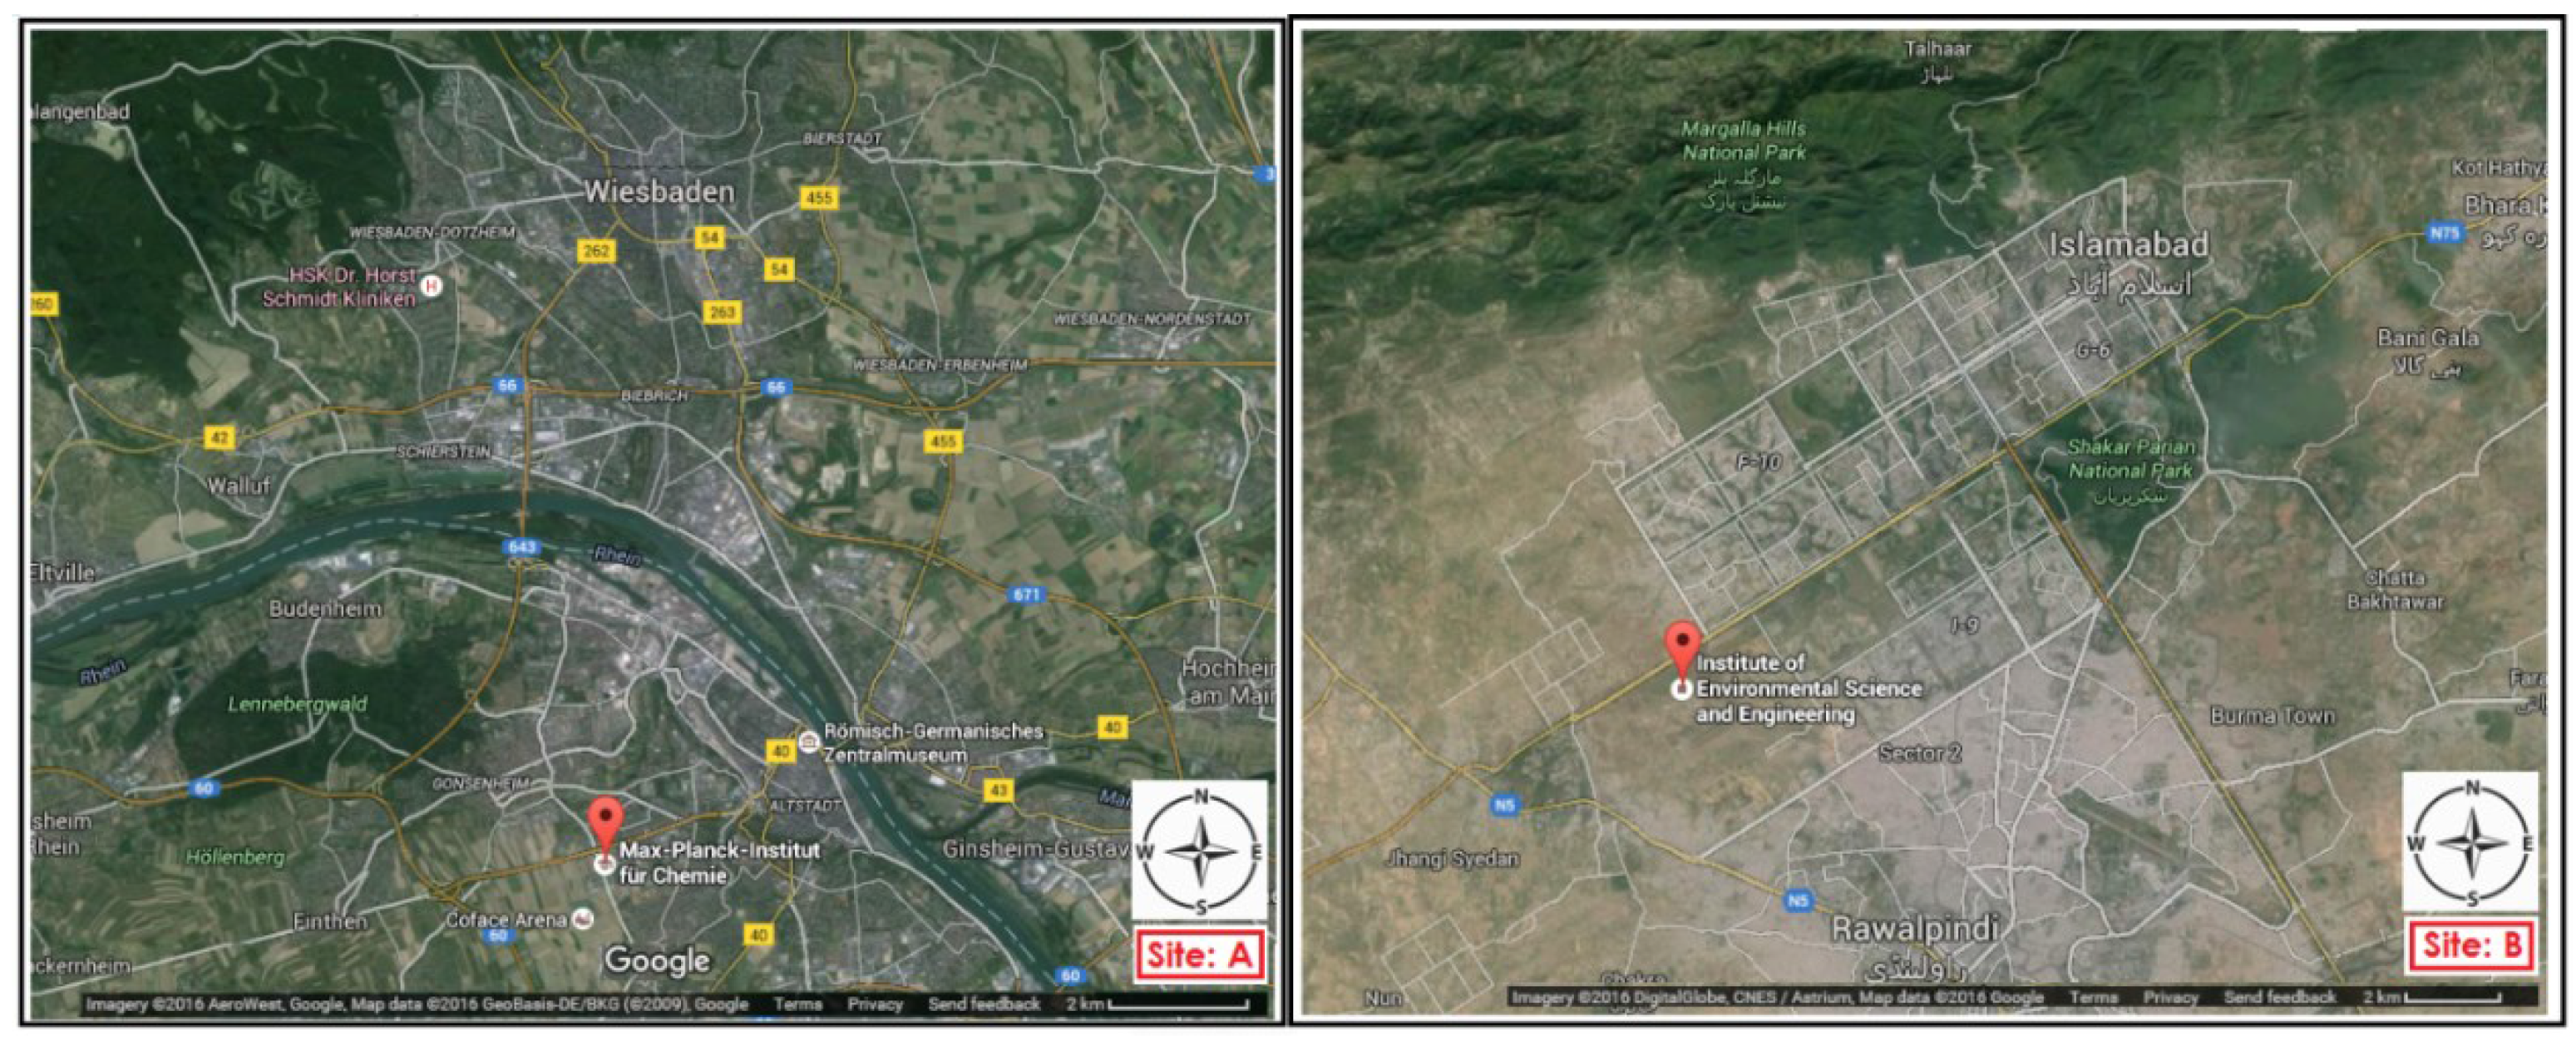
2.2. Site Description

Site A: MPI-Ch building is located (49.965387°N, 8.242531°E) in Mainz, Germany as indicated by a red balloon in Figure 1. The instrument was installed on the roof of the five levels building, at the intersection of Saar Strasse and Koblenzer Strasse. Dense population is located to its north (the city of Wiesbaden, with a population of 280,000 inhabitants), east, and south sides (the city of Mainz with, a population of 200,000 inhabitants), while open fields are present on the west side.
Site B: The Institute of Environmental Sciences and Engineering (IESE) building is located in (33.6416°N, 72.9835°E) in Islamabad, Pakistan. The instrument was installed on the roof of the two-level building (referred as IESE-NUST site in this study and indicated by a red balloon in Figure 1) pointing towards the south. The Kashmir Highway passes from its north, Grand Trunk road to the southwest, and the IJP road to the south. All of these roads result in a major flux of both heavy and light vehicles passing by and through the twin cities of Rawalpindi and Islamabad. The IESE-NUST site is situated in between the Rawalpindi and Islamabad cities which are, respectively, the fourth-most populated (2.16 million inhabitants) and tenth-most populated (0.9 million inhabitants) cities of Pakistan, with relatively poor air quality.

2.3. Mini MAX-DOAS Instrument
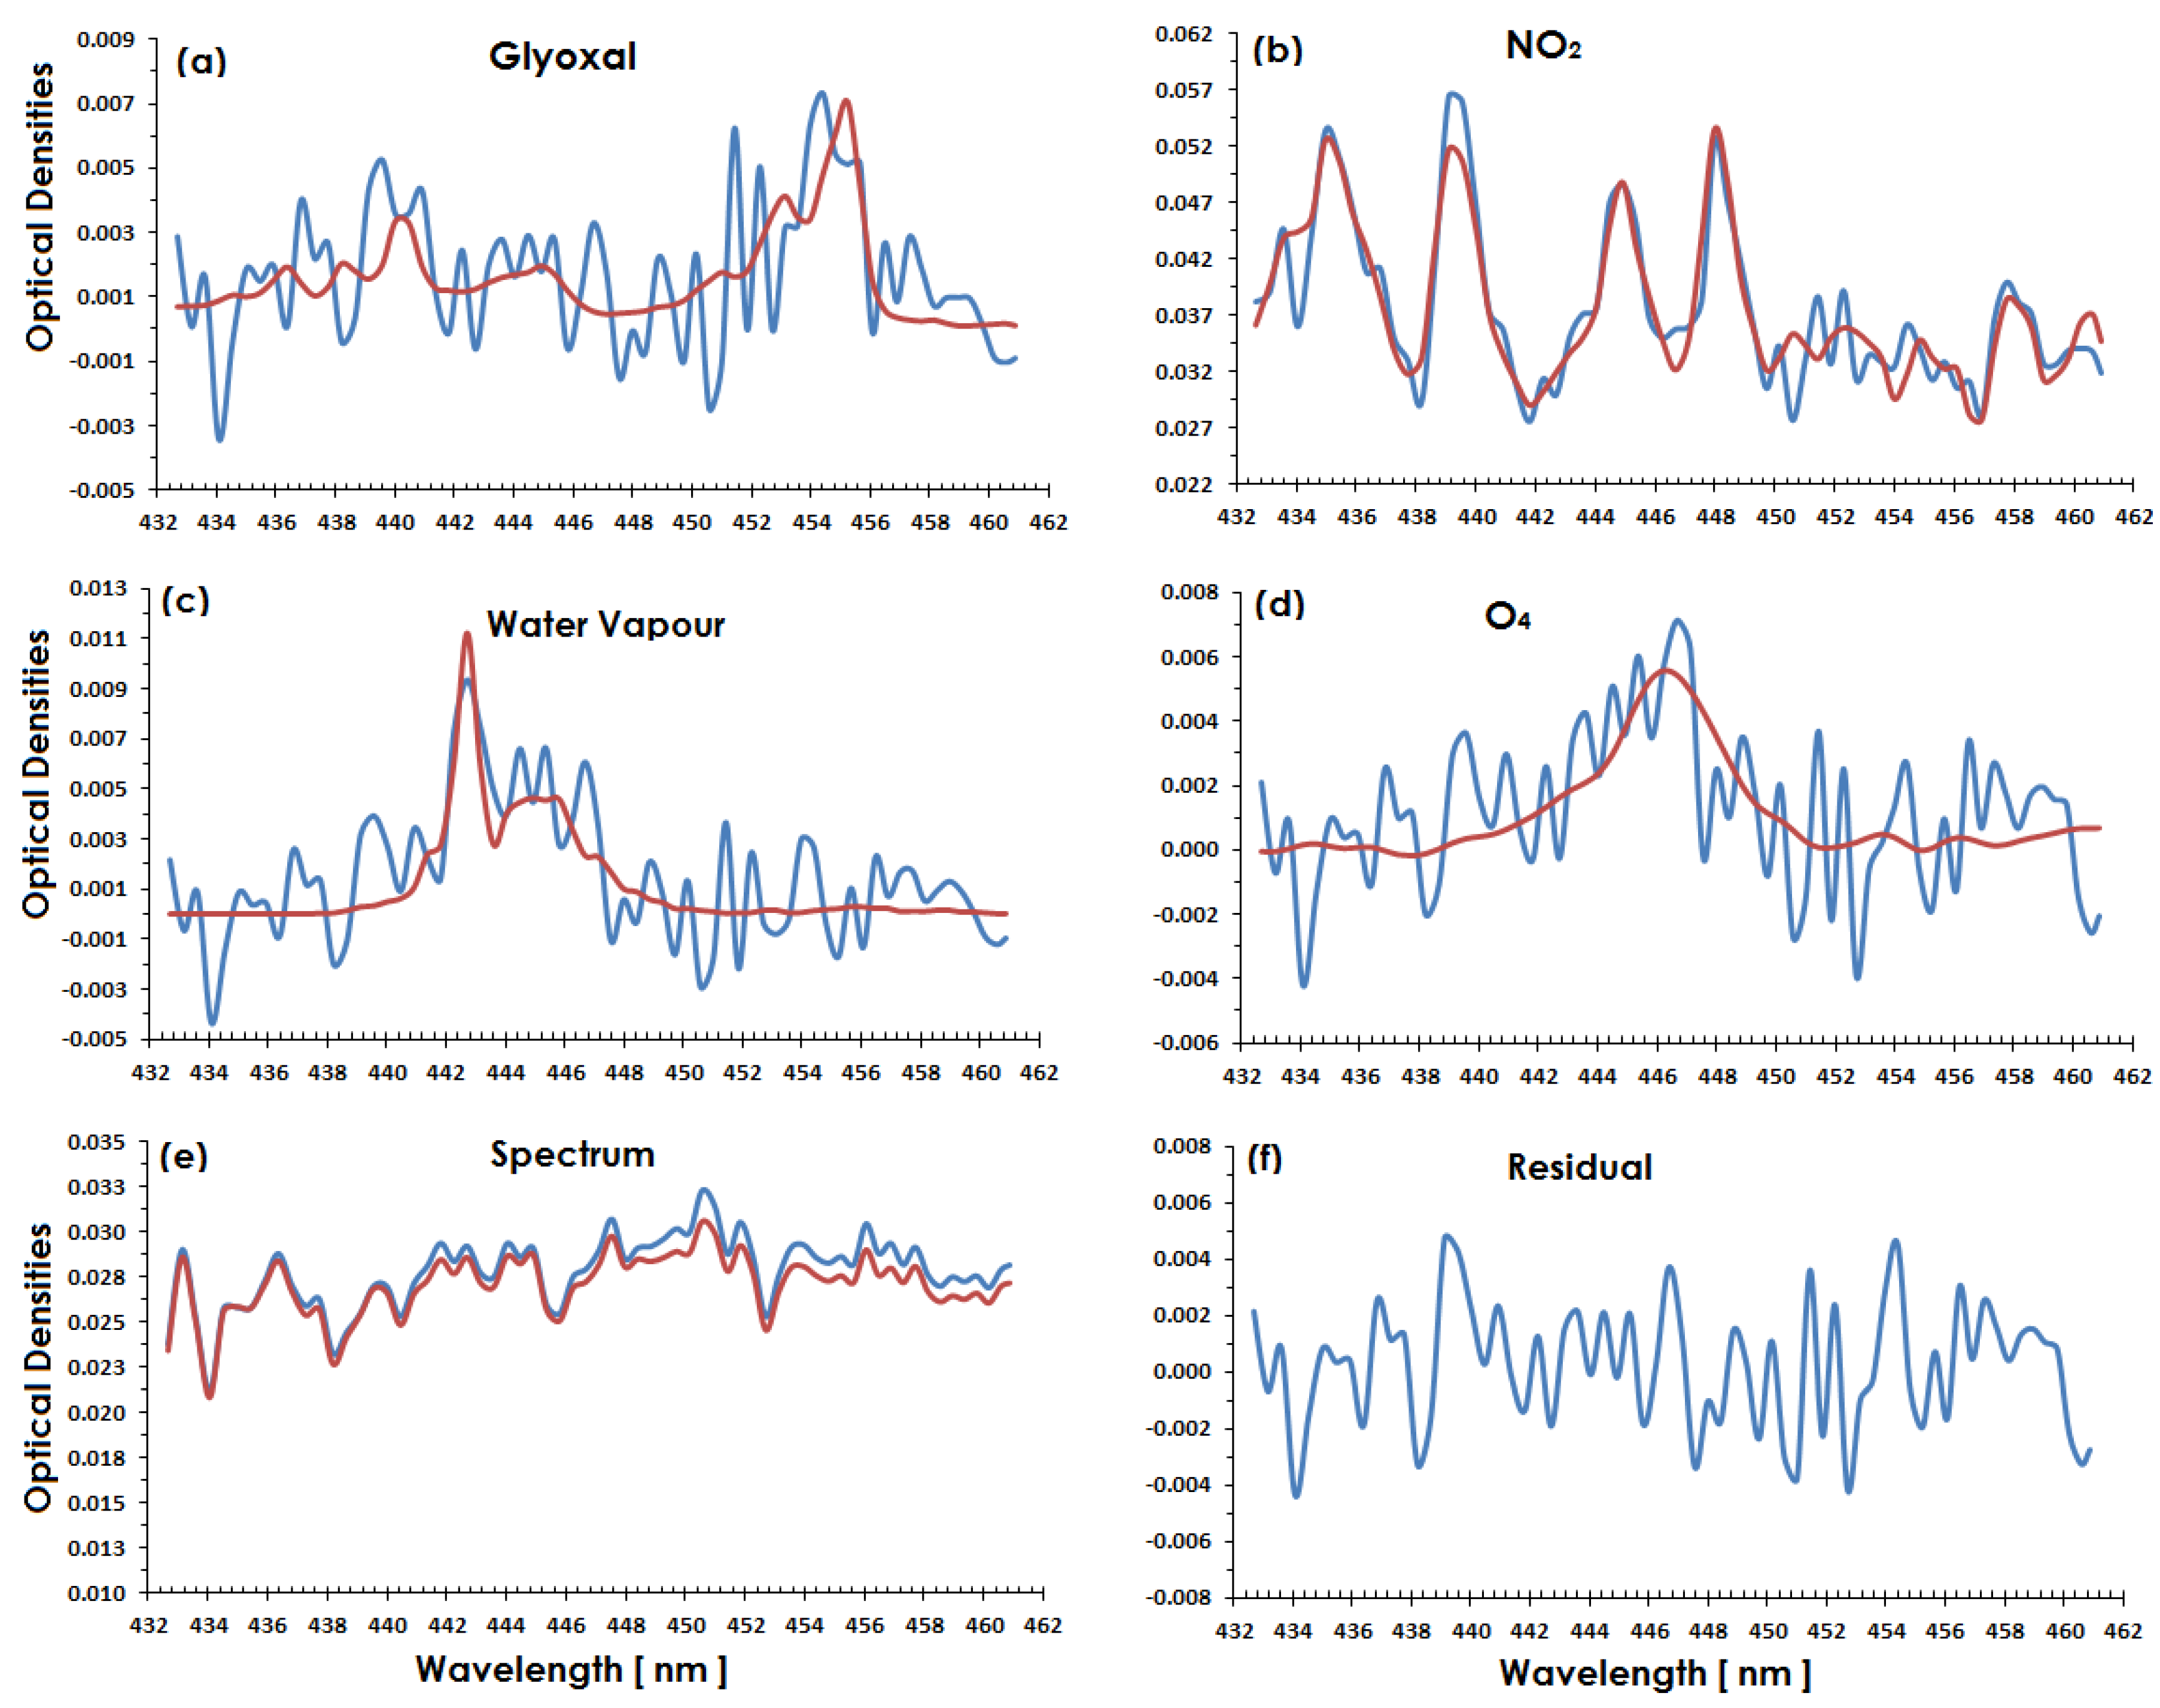
A compact version of Multi-Axis Differential Optical Absorption Spectroscopy (mini MAX-DOAS) is a ground-based passive remote sensing instrument that is used to measure tropospheric trace gases such as nitrogen dioxide (NO2), formaldehyde (HCHO), sulfur dioxide (SO2), glyoxal (CHOCHO), bromine oxide (BrO), and aerosols. MAX-DOAS instruments take spectral measurements of scattered sunlight in the ultraviolet (UV) and visible (VIS) parts of the electromagnetic spectrum [17,21,24,25,26,27,36,37,38]. From a MAX-DOAS scan (an ensemble of spectra measured at different elevation angles using identical azimuthal direction), specific trace gas profile information can be derived. From each elevation angle, the so called differential slant column densities (DSCDs), i.e., the concentrations of the gas along the line path, are retrieved using the DOAS technique [27,39].

2.4. DOAS Analysis

DOAS is a novel and widely used technique across the globe for the detection of trace gases in the atmosphere [39]. It is a self-calibrating technique and identifies the molecular absorption structures, thereby allowing the simultaneous retrieval of various trace gases within the selected wavelength interval. These spectral signatures are converted to slant column densities (SCDs) by taking into account the relevant absorption cross sections of each gas. In particular, MAX-DOAS technique was developed to retrieve information about relatively short lived trace gases (remains close to the ground) from the observations conducted at lower elevation angles [17,27,36,40,41,42,43].
The CHOCHO DSCDs were retrieved by applying DOAS fit [17,39] to the recorded spectral measurements by using the WinDOAS algorithm [23] developed at the Belgian Institute for Space Aeronomy, Brussels. DSCDs are the difference of the slant column densities (SCDs) measured at lower elevation angle (e.g., α = 5°) and a Fraunhofer reference spectrum (a spectrum taken at α = 90° at minimum solar zenith angle). The Fraunhofer reference spectrum is mandatory to correct the strong Fraunhofer absorption lines in the measured spectra. Various test runs of the CHOCHO DOAS fit were performed by all scientific teams participating in the MAD-CAT campaign and the best suitable settings (e.g., optimal wavelength range, selection of absorption cross-sections, degree of fitted polynomial, instrumental slit functions, etc.) for the glyoxal retrieval were suggested. The measured spectra were allowed to adjust (by applying shift and squeeze) against the fitted cross-sections and solar reference spectra. In particular, CHOCHO retrieval is largely impacted by the rotational Raman scattering on air molecules (ring structures). The impact is stronger towards the shorter wavelengths, and vice versa. Therefore, DOAS fit exhibited relatively good results for the selected wavelengths of 434 to 460 nm as compared to 415 to 460 nm. In this study, the measured spectrum was fitted with convoluted cross-sections of trace gases like NO2 at two different temperatures of 220 K and 298 K, O3, O4, CHOCHO, H2O, and two ring cross-sections were used within a fitting interval of 434–460 nm. Two NO2 absorption cross-sections were fitted in order to avoid the plausible error in CHOCHO DOAS fit caused by improper removal of NO2 absorptions. Indeed, as NO2 is a strong absorber in this wavelength interval, the temperature dependence of its absorption cross-sections and inaccurate wavelength calibration can lead to large bias in the CHOCHO retrieval. Furthermore, reference spectra for NO2 and O3 were corrected for the solar I0-effect. Several sensitivity runs for different wavelength intervals (between 415 and 460 nm), degree of polynomial (3 to 5), shift, and squeeze were performed in order to minimize the systematic error in the CHOCHO retrieval. However, the systematic error varied between 15% and 40% for all sensitivity tests, and is in line with the previously reported studies for retrieved CHOCHO DSCDs [17,18,27,36,39,40,41,42,43]. The optimal settings for CHOCHO DOAS fit is listed in Table 1, in addition to the settings used by various studies for retrievals of CHOCHO DSCDs. The retrieved differential slant column densities were filtered qualitatively by selecting only the data with root mean square (RMS) values smaller than 2.0 × 10⁻³ as mentioned in the Table 1. An example of CHOCHO DOAS fit retrieval is also shown in Figure 2.
The spectrum was measured on 26 June 2013 at 14:17 h with an elevation angle of 5° and SZA = 28° at MAD-CAT site. The reference absorption cross sections used in the retrieval process include CHOCHO [47], O3 (Bogumil et al. [45]), NO2 (Vandaele et al. [44]), O4 (Thalmand and Volkamer [46]), and water vapor (Rothman [48]). The red line depicts the scaled laboratory references along with sum of fitted optical densities and the residual (blue lines) as function of wavelength. The quality of the DOAS fit is exhibited by the root mean square variation of the residual (Figure 2). The calculated CHOCHO DSCDs for this measurement were 1.3 × 10¹⁶ molecule/cm2.
Analysis was performed using Fraunhofer reference spectra for each day around local noon times at the lowest SZA. Tropospheric CHOCHO VCDgeo were determined from the retrieved DSCDs by using a differential air mass factor (DAMF—the difference of air mass factor (AMF) between α = 90° and α ≠ 90°). The calculation of AMF by radiative transfer modelling depends upon various factors such as a priori profile of the trace absorber, cloud fraction, viewing geometry, aerosol loading, and surface albedo [54,55]. Information about all of these parameters are often not available. However, it can also be calculated by geometric approximation [17] given by Equation (1):
VCD geo = DSCD ( α ) DAMF ( α ) = DSCD ( α ) ( 1 / sin ( α ) 1 )
where (α) is the elevation angle and the uncertainties introduced by (mainly, aerosol load, spatial inhomogeneity of the absorber, etc.) this method are up to 20% for NO2 [37] and may not exceed in the case of CHOCHO, as well (we assume that because of the short lifetime it is mainly found in the boundary layer and CHOCHO concentrations in the peri-urban sites are almost homogeneously distributed).

3. Results and Discussions

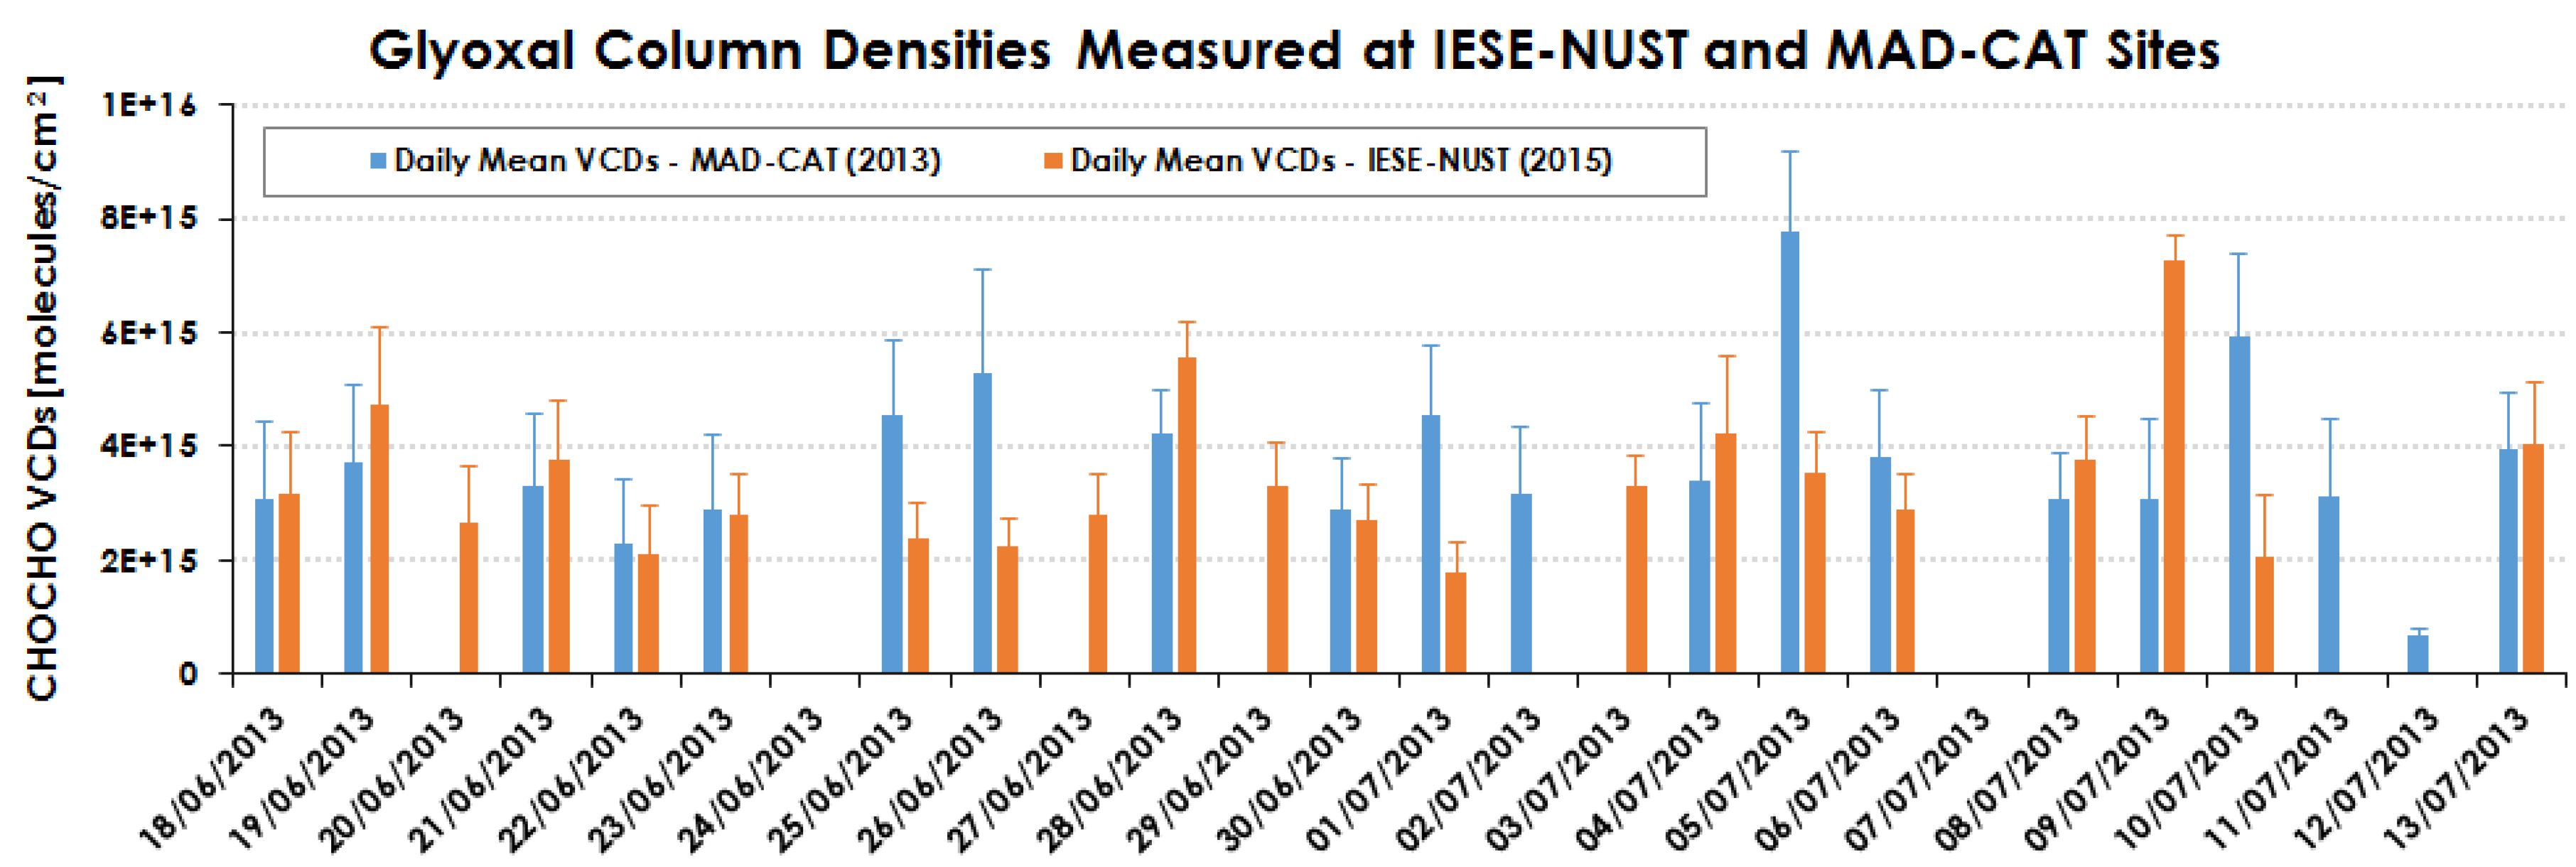
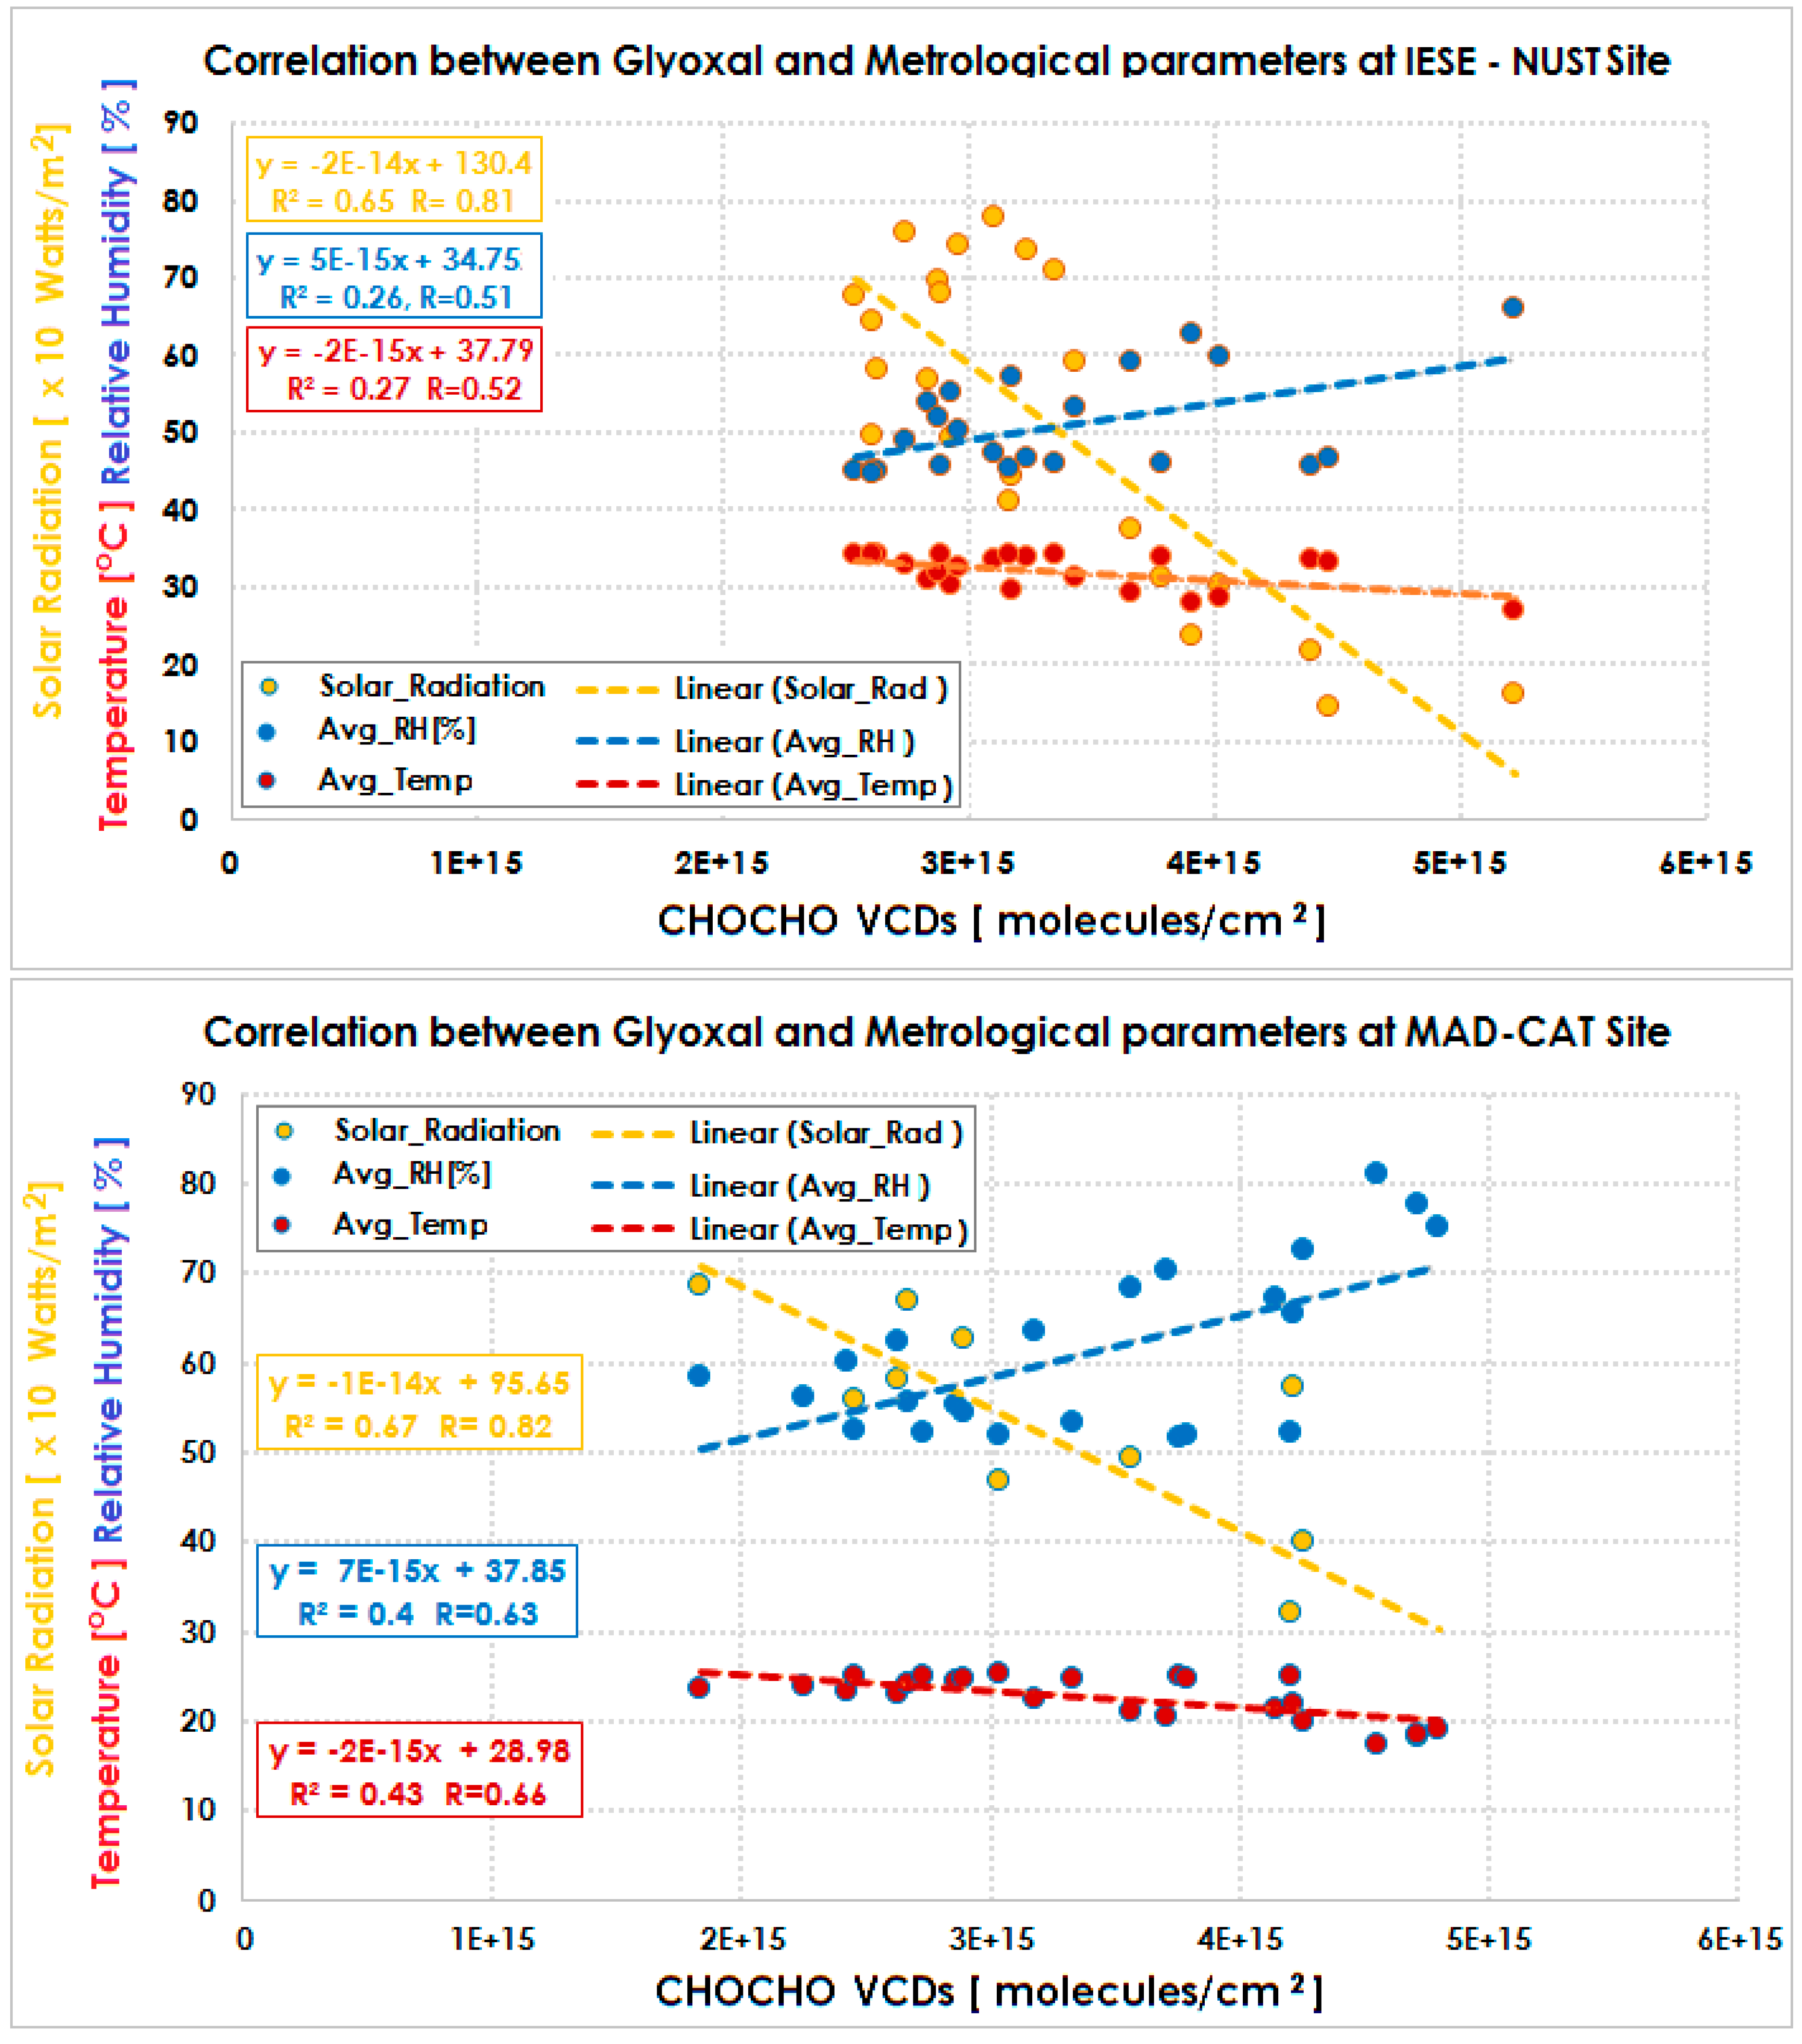
3.1. MAD-CAT Campaign 2013

The MAD-CAT campaign took place at the Max Planck Institute for Chemistry, a peri-urban area of Mainz, Germany. Although the field campaign mainly focused on monitoring of various trace gases, aerosols were also monitored with in situ systems, sun photometers, along with meteorological observations of temperature, relative humidity, precipitation, wind speed, and direction. Sixteen instruments from eleven institutes (CAS Hefei, China; CAMS Beijing, China; University Minsk, Belarus; IISER Mohali, India; University of Colorado Boulder, USA; BIRA/IASB Brussels, Belgium; University of Galati, Romania; University of Heidelberg, Germany; University of Bremen, Germany; NUST Islamabad, Pakistan; and MPIC Mainz, Germany), were installed and tested between 7 and 16 June 2013. A preliminary inter-comparison of retrieved CHOCHO DSCDs helped to finalize the instrument and DOAS fit settings for further analysis, as mentioned in Section 2.4. The measurements continued until 17 July 2013 with focusing on other species as well, such as NO2, HCHO, BrO, O4, etc. The goal of the preliminary inter-comparison was to characterize the current level of consistency of multi-axis instruments involved in the campaign. The scattered light spectra were recorded at a set of prescribed elevation angles (2, 4, 8, 15, 30, 45, 75, and zenith) with an integration time of 1–2 min. Measurements were generally obtained within 10–20 min for a sequence of all elevation angles.
Figure 3 depicts the CHOCHO VCDs (molecules/cm2) measured at a 30° elevation angle during the MAD-CAT field campaign for the period of 18 June to 18 July 2013. Time series covers almost a period of one month (days with rain and instrumental malfunction were excluded). In this study, only observations of mini MAX-DOAS instrument from institute of environmental sciences and engineering Islamabad, Pakistan are presented here. CHOCHO VCDs were averaged at an interval of half an hour and were also and then compared with the ambient temperature. It can be seen that variation in temperature is not correlated very much with the variation in the measured CHOCHO VCDs. In particular, large scatter is observed in CHOCHO column densities. Although, the main source of observed CHOCHO is dominated by the oxidation of biogenic emissions of non-methane volatile organic compounds (NMVOCs), such as isoprene/terpene, however, temperature is not the key factor in determining the diurnal variation in CHOCHO concentration. In particular, large CHOCHO columns (1.4 × 10¹⁶ molecules/cm2) are observed on 26 June 2013 for a relatively lower temperature. An interesting feature of enhanced CHOCHO VCDs were observed on various occasions mainly during the wind direction around 290°± 30° N but independent of temperature. It is further confirmed by Figure 1, that in the upward wind direction (280°N) a forested area, Lenneberg Wald, is located and acting as a source of observed CHOCHO VCDs at the MAD-CAT site. Metrological observation has shown that wind direction fluctuated between 245° and 320°N on most of the days during the MAD-CAT campaign.

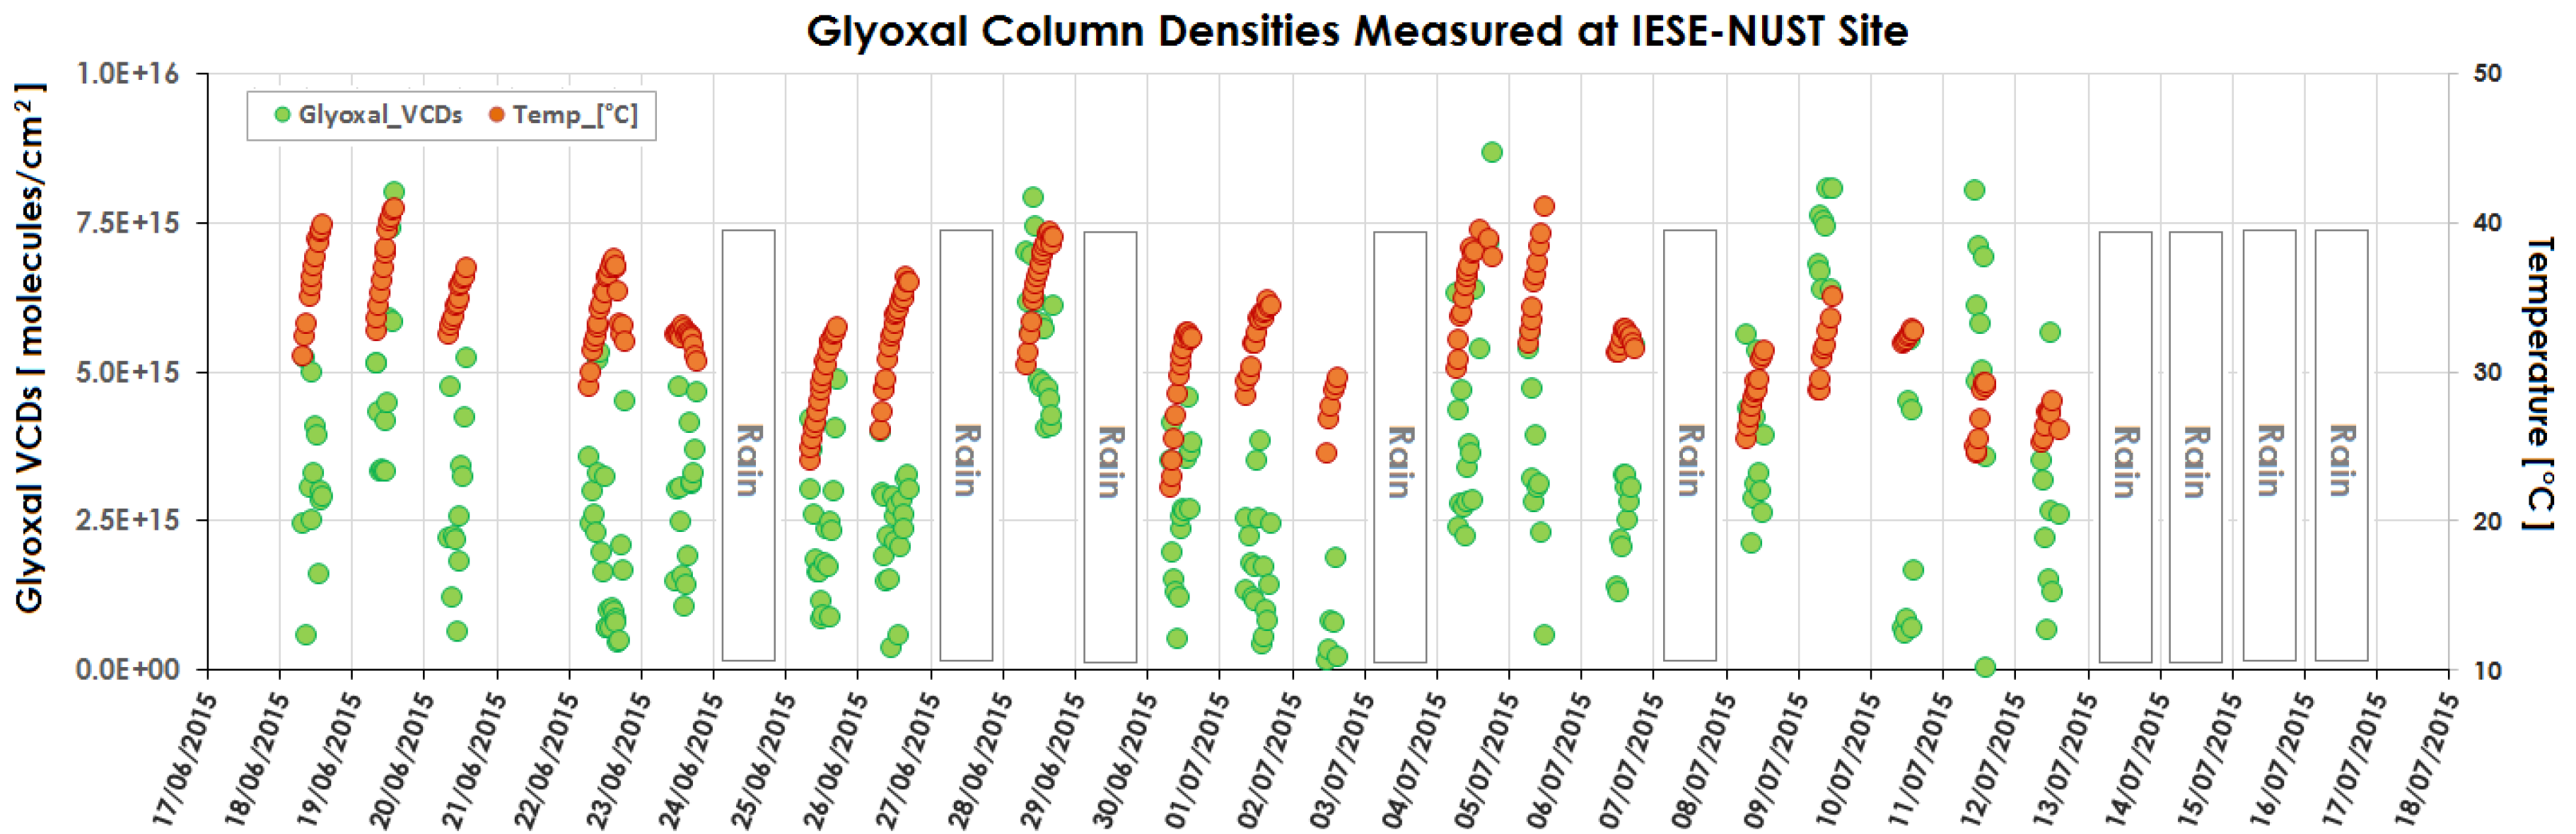
3.2. Atmospheric CHOCHO over the IESE-NUST Site in Pakistan

Figure 4 represents CHOCHO VCDs measured at a 30° elevation angle for the period of 18 June to 18 July 2015 at the IESE-NUST monitoring site in Pakistan. The same settings for DOAS fit analysis were used as mentioned in previous Section 2.4 and Table 1. Maximum CHOCHO VCDs of 7.81 × 10¹⁵ molecules/cm2 were measured on 4 July 2015. Wind direction was fluctuating between 80° and 220° N during the study period. In the summer the ambient temperature in Pakistan may soar up to 45 °C, or even more, at the IESE-NUST monitoring site. On other hand, daily mean values of CHOCHO VCDs calculated over the IESE-NUST site are lower than daily means VCDS from the MAD-CAT site, as shown in Figure 5. This can be explained by the fact that, at Mainz, the variation in ambient temperature is slightly larger (11 °C to 36 °C) in comparison to the IESE-NUST site in Islamabad (23 °C to 43 °C). Especially, the minimum temperature observed at the IESE-NUST site is 22.6 °C as compared to 11 °C at the MAD-CAT site. As a result, more biogenic emissions of isoprene and terpene are expected at the IESE-NUST site from the vegetation. As an increase in ambient temperature from 25 °C to 35 °C can cause enhanced emissions of isoprene and terpene [3] by a factor of 4 and 1.5, respectively [56]. However, due to less vegetation at the IESE-NUST site as compared to the MAD-CAT site (see Figure 1), and higher actinic flux (IESE-NUST (33.6°N) is located farther south than Mainz (49.9°N) and, thus, acquires more solar radiation for photochemical processes), relatively lower CHOCHO VCDs are observed. The role of solar radiation in diurnal variation of CHOCHO VCDs is discussed in the following section.

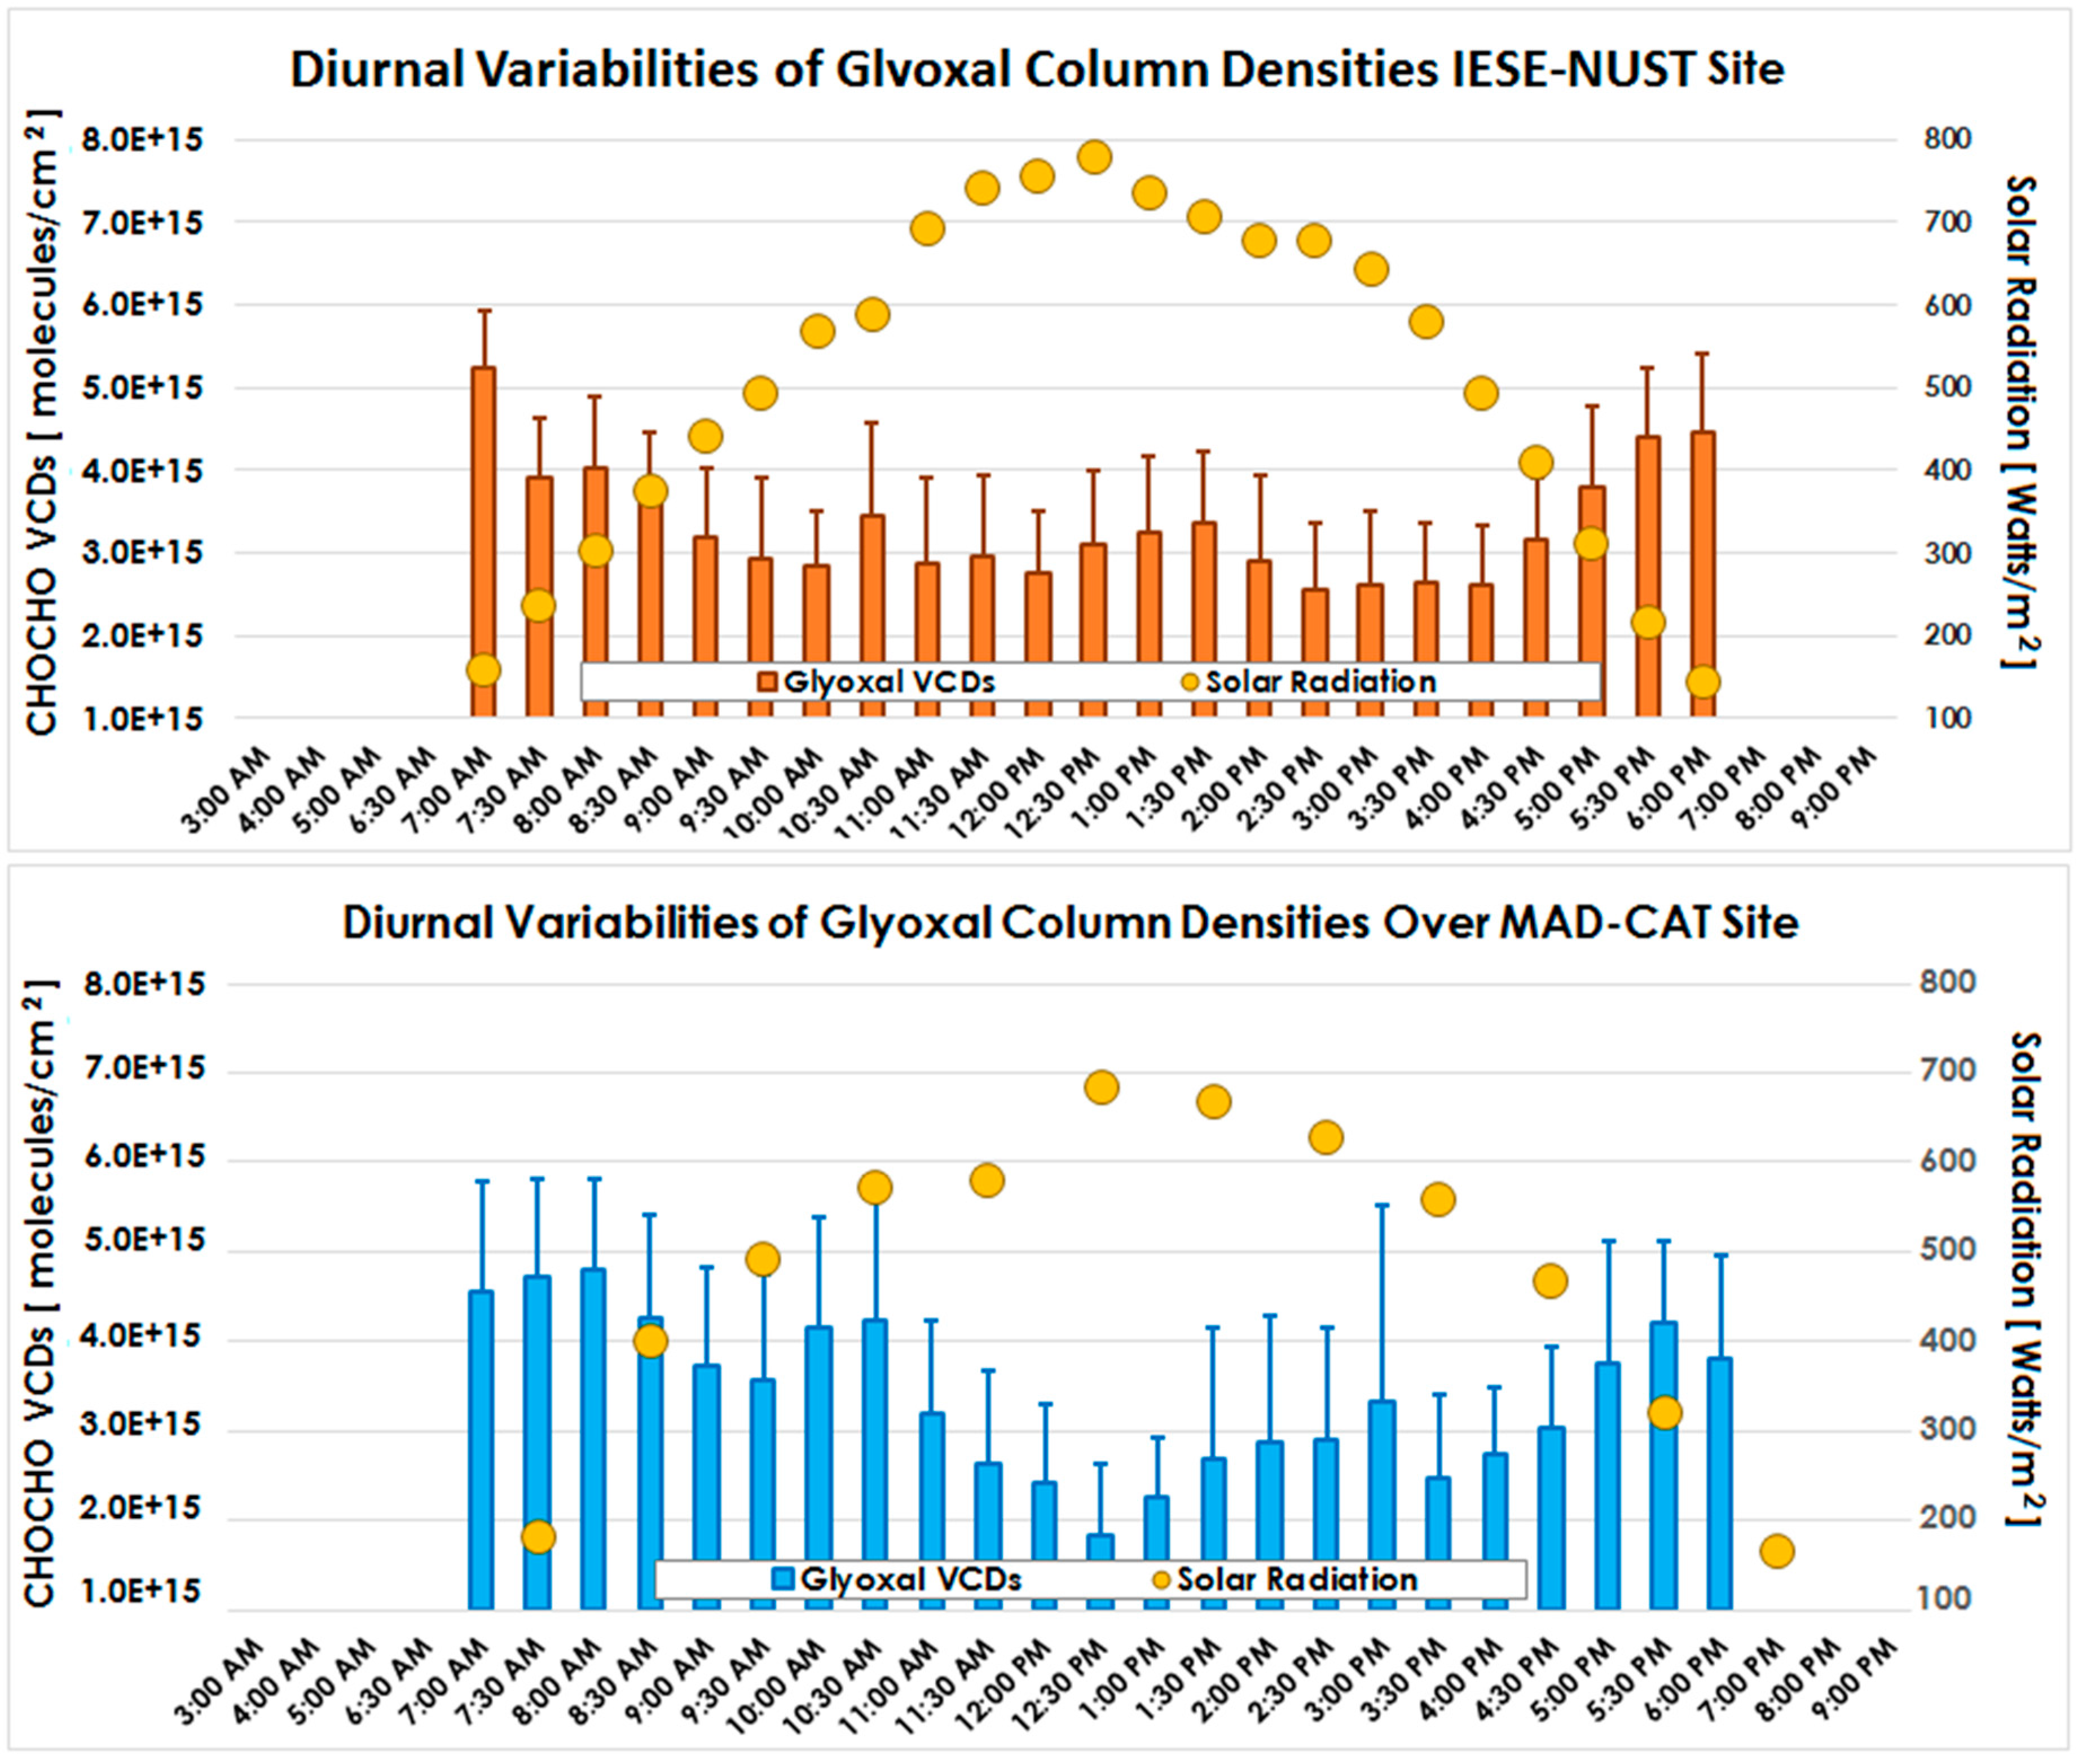
3.3. Diurnal Cycle in CHOCHO Emissions

Globally, enhanced levels of glyoxal are found over regions hosting biogenic and pyrogenic emissions of precursor VOCs [3,13,22], and uncertainties exist because the emissions are dependent on several parameters; temperature, humidity and plant type and condition [3,57]. Globally, emission of hydrocarbon from natural sources far exceed those of anthropogenic [3,11]. Major sink of glyoxal is photolysis followed by OH and secondary organic aerosol formation [58].
CHOCHO remains generally detectable for most of the day with a trend of decreasing concentration about one hour after sunrise. Due to higher photolysis rates a decreasing trend in CHOCHO emissions is observed [2] followed by the peaks during the evening hours [8]. A similar trend was observed in diurnal variations of CHOCHO column densities measured at the two different sites in Mainz, Germany and Islamabad, Pakistan (see Figure 6).
CHOCHO column densities measured during early hours of the day are referred mainly due to oxidation of isoprene/terpene and other VOCs by OH radicals available during the previous night [18]. Its concentration increases slightly around the hours of 9:00–10:00 and can be attributed to anthropogenic emissions added by the vehicles during morning rush hours. Near, and after, solar noon, it increases slightly mainly due to the increased rate of photo-oxidation of isoprene/terpenes [59]. While larger concentrations are observed during the evening hours and can be attributed to traffic emissions and decreased intensity of the sunlight [17].
Relative humidity depends on temperature (anti-correlated) and changes when temperature changes. Thus, the impact of actinic flux, temperature, and relative humidity over both sites are investigated. An interesting feature of positive correlation between CHOCHO VCDs and relative humidity, and anti-correlation with solar irradiance and temperature, are observed. Especially, correlation is significantly stronger over both sites for solar irradiance (r = −0.81 and r = −0.82), while for temperature (r = −0.66 and r = −0.52), and relative humidity (r = 0.51 and r = 0.63), are less correlated, as presented in Figure 7.
At both monitoring sites the months of June and July are the hottest months of the year; however, they differ in magnitude. The temperature difference is mainly due to the geographic location, topography, and vegetation type, which plays considerable role as temperature and photosynthesis trigger the biogenic emissions of CHOCHO precursor VOCs [3,10,13,22]. The difference observed in diurnal concentrations (magnitudes) of CHOCHO VCDs over Mainz and Islamabad can be attributed to differences in actinic flux and vegetation cover/type, mainly, and might be influenced by temperature and relative humidity to some extents in both places. Partially, difference can be attributed to anthropogenic emissions of both monitoring sites. Especially, in case of Pakistan, open solid waste burning, exhausts from vehicles not fitted with catalytic convertors, and the use of low grade fuel may also result in larger contributions in observed CHOCHO concentrations in Pakistan. This effect might be more clearly identified during the winter season when temperature is very low and biogenic emissions of NMVOC are minimal and observed CHOCHO emission are predominantly from anthropogenic sources.

4. Conclusions

This study provides valuable information regarding CHOCHO retrievals by using mini MAX-DOAS observations, as CHOCHO plays an important role in tropospheric chemistry. Especially, it can be considered as an important indicator for VOC photochemical reactions in the terrestrial boundary layer and a precursor for tropospheric ozone formation [2]. Comparative analysis of both sites showed that a similar trend was observed in the diurnal variation of CHOCHO column densities measured during the months of June and July in the respective years. The impact of solar irradiance (r > 0.8) and vegetation profile is significant on CHOCHO emissions over both sites, in comparison to temperature and relative humidity. The quantitative difference observed in CHOCHO VCDs is primarily triggered by the difference in actinic flux, temperature (to certain extents because of precursor emissions), and different vegetation profiles. Further research and extensive field campaigns are needed in order to draw concrete conclusions on the behavior of different emissions sources of glyoxal.

Acknowledgments

We acknowledge NUST Islamabad, Pakistan for providing financial support as MS research fund to conduct this study. Very special gratitude goes to Mejong Gu for performing the experiment at MAD-CAT site and satellite group of Max-Planck Institute for Chemistry Mainz, Germany for providing the mini MAX-DOAS instrument and inviting to be the part of MAD-CAT field campaign. Also, we acknowledge the co-operation of all the institutes who participated in MAD-CAT campaign. Further, we greatly acknowledge the ASAAQ2013 for providing publication fee for this article.

Author Contributions

Muhammad Fahim Khokhar conceived and designed the experiments; Syeda Ifraw Naveed, Zain Abbas and Junaid Khayyam Butt performed the experiments at IESE-NUST site and analyzed the data sets. Muhammad Fahim Khokhar wrote the paper and supervised this study.

Conflicts of Interest

The authors declare no conflict of interest.

References

  1. Finlayson-Pitts, B.J.; Pitts, J.N., Jr. Chemistry of the Upper and Lower Atmosphere: Theory, Experiments, and Applications; Academic Press: San Diego, CA, USA, 1999. [Google Scholar]
  2. Volkamer, R.; Molina, L.T.; Molina, M.J.; Shirley, T.; Brune, W.H. DOAS measurement of glyoxal as an indicator for fast VOC chemistry in urban air. Geophys. Res. Lett. 2005, 32, L08806. [Google Scholar] [CrossRef]
  3. Seinfeld, J.H.; Pandis, S.N. Atmospheric Chemistry and Physics: From Air Pollution to Climate Change; John Wiley & Sons: New York, NY, USA, 2012. [Google Scholar]
  4. Gregg, J.W.; Jones, C.G.; Dawson, T.E. Urbanization effects on tree growth in the vicinity of New York city. Nature 2003, 424, 183–187. [Google Scholar] [CrossRef] [PubMed]
  5. Ramanathan, V.; Li, F.; Ramana, M.; Praveen, P.; Kim, D.; Corrigan, C.; Nguyen, H.; Stone, E.A.; Schauer, J.J.; Carmichael, G. Atmospheric brown clouds: Hemispherical and regional variations in long-range transport, absorption, and radiative forcing. J. Geophys. Res.: Atmos. 2007, 112, S21. [Google Scholar] [CrossRef]
  6. Molina, L.T.; Molina, M.J. Air Quality in the Mexico Megacity: An Integrated Assessment; SciELO Chile: Santiago, Chile, 2002. [Google Scholar]
  7. Pope, C.A., III; Dockery, D.W. Health effects of fine particulate air pollution: Lines that connect. J. Air Waste Manag. Assoc. 2006, 56, 709–742. [Google Scholar] [CrossRef] [PubMed]
  8. Myriokefalitakis, S.; Vrekoussis, M.; Tsigaridis, K.; Wittrock, F.; Richter, A.; Brühl, C.; Volkamer, R.; Burrows, J.; Kanakidou, M. The influence of natural and anthropogenic secondary sources on the glyoxal global distribution. Atmos. Chem. Phys. 2008, 8, 4965–4981. [Google Scholar] [CrossRef]
  9. Atkinson, R. Atmospheric chemistry of VOCS and NO X. Atmos. Environ. 2000, 34, 2063–2101. [Google Scholar] [CrossRef]
  10. MacDonald, S.; Oetjen, H.; Mahajan, A.; Whalley, L.; Edwards, P.; Heard, D.; Jones, C.; Plane, J. DOAS measurements of formaldehyde and glyoxal above a South-East Asian tropical rainforest. Atmos. Chem. Phys. 2012, 12, 5949–5962. [Google Scholar] [CrossRef]
  11. Fu, T.M.; Jacob, D.J.; Wittrock, F.; Burrows, J.P.; Vrekoussis, M.; Henze, D.K. Global budgets of atmospheric glyoxal and methylglyoxal, and implications for formation of secondary organic aerosols. J. Geophys. Res. Atmos. 2008, 113, D15303. [Google Scholar] [CrossRef]
  12. Guenther, A.; Hewitt, C.N.; Erickson, D.; Fall, R.; Geron, C.; Graedel, T.; Harley, P.; Klinger, L.; Lerdau, M.; McKay, W. A global model of natural volatile organic compound emissions. J. Geophys. Res. Atmos. 1995, 100, 8873–8892. [Google Scholar] [CrossRef]
  13. Alvarado, L.; Richter, A.; Vrekoussis, M.; Wittrock, F.; Hilboll, A.; Schreier, S.; Burrows, J. An improved glyoxal retrieval from OMI measurements. Atmos. Meas. Tech. 2014, 7, 4133–4150. [Google Scholar] [CrossRef]
  14. Tadić, J.; Moortgat, G.K.; Wirtz, K. Photolysis of glyoxal in air. J. Photochem. Photobiol. A Chem. 2006, 177, 116–124. [Google Scholar] [CrossRef]
  15. Setokuchi, O. Trajectory calculations of OH radical-and CL atom-initiated reaction of glyoxal: Atmospheric chemistry of the HC(O)CO radical. Phys. Chem. Chem. Phys. 2011, 13, 6296–6304. [Google Scholar] [CrossRef] [PubMed]
  16. Volkamer, R.; San Martini, F.; Molina, L.T.; Salcedo, D.; Jimenez, J.L.; Molina, M.J. A missing sink for gas-phase glyoxal in Mexico city: Formation of secondary organic aerosol. Geophys. Res. Lett. 2007, 34, L19807. [Google Scholar] [CrossRef]
  17. Sinreich, R.; Volkamer, R.; Filsinger, F.; Frieß, U.; Kern, C.; Platt, U.; Sebastián, O.; Wagner, T. MAX-DOAS detection of glyoxal during ICARTT 2004. Atmos. Chem. Phys. 2007, 7, 1293–1303. [Google Scholar] [CrossRef]
  18. Li, X.; Brauers, T.; Hofzumahaus, A.; Lu, K.; Li, Y.; Shao, M.; Wagner, T.; Wahner, A. MAX-DOAS measurements of NO2, HCHO and CHOCHO at a rural site in Southern china. Atmos. Chem. Phys. 2013, 13, 2133–2151. [Google Scholar] [CrossRef]
  19. Coburn, S.; Dix, B.; Sinreich, R.; Volkamer, R. The CU ground MAX-DOAS instrument: Characterization of RMS noise limitations and first measurements near Pensacola, FL of BRO, IO, and CHOCHO. Atmos. Meas. Tech. 2011, 4, 2421–2439. [Google Scholar] [CrossRef]
  20. Lerot, C.; Stavrakou, T.; Smedt, I.D.; Müller, J.-F.; Roozendael, M.V. Glyoxal vertical columns from Gome-2 backscattered light measurements and comparisons with a global model. Atmos. Chem. Phys. 2010, 10, 12059–12072. [Google Scholar] [CrossRef]
  21. Vlemmix, T.; Piters, A.; Stammes, P.; Wang, P.; Levelt, P. Retrieval of tropospheric NO2 using the MAX-DOAS method combined with relative intensity measurements for aerosol correction. Atmos. Meas. Tech. 2010, 3, 1287–1305. [Google Scholar] [CrossRef]
  22. Vrekoussis, M.; Wittrock, F.; Richter, A.; Burrows, J. Temporal and spatial variability of glyoxal as observed from space. Atmos. Chem. Phys. 2009, 9, 4485–4504. [Google Scholar] [CrossRef]
  23. Fayt, C.; Van Roozendael, M. Windoas 2.1–Software User Manual; BIRA-IASB: Uccle, belgium, 2001. [Google Scholar]
  24. Irie, H.; Takashima, H.; Kanaya, Y.; Boersma, K.; Gast, L.; Wittrock, F.; Brunner, D.; Zhou, Y.; Roozendael, M.V. Eight-component retrievals from ground-based MAX-DOAS observations. Atmos. Meas. Tech. 2011, 4, 1027–1044. [Google Scholar] [CrossRef]
  25. Theys, N.; Van Roozendael, M.; Hendrick, F.; Yang, X.; De Smedt, I.; Richter, A.; Begoin, M.; Errera, Q.; Johnston, P.; Kreher, K. Global observations of tropospheric bro columns using Gome-2 satellite data. Atmos. Chem. Phys. 2011, 11, 1791–1811. [Google Scholar] [CrossRef] [Green Version]
  26. Wagner, T.; Beirle, S.; Brauers, T.; Deutschmann, T.; Frieß, U.; Hak, C.; Halla, J.; Heue, K.; Junkermann, W.; Li, X. Inversion of tropospheric profiles of aerosol extinction and HCHO and NO2 mixing ratios from MAX-DOAS observations in Milano during the summer of 2003 and comparison with independent data sets. Atmos. Meas. Tech. 2011, 4, 2685–2715. [Google Scholar] [CrossRef]
  27. Wittrock, F.; Oetjen, H.; Richter, A.; Fietkau, S.; Medeke, T.; Rozanov, A.; Burrows, J. MAX-DOAS measurements of atmospheric trace gases in NY-Ålesund-Radiative transfer studies and their application. Atmos. Chem. Phys. 2004, 4, 955–966. [Google Scholar] [CrossRef]
  28. Akhtar, M.; Ahmad, N.; Booij, M. The impact of climate change on the water resources of Hindukush–Karakorum–Himalaya region under different glacier coverage scenarios. J. Hydrol. 2008, 355, 148–163. [Google Scholar] [CrossRef]
  29. Parry, M.L.; Rosenzweig, C.; Iglesias, A.; Livermore, M.; Fischer, G. Effects of climate change on global food production under SRES emissions and socio-economic scenarios. Glob. Environ. Chang. 2004, 14, 53–67. [Google Scholar] [CrossRef]
  30. Le Houérou, H.N. Climate change, drought and desertification. J. Arid Environ. 1996, 34, 133–185. [Google Scholar] [CrossRef]
  31. Rosenzweig, C.; Parry, M.L. Potential impact of climate change on world food supply. Nature 1994, 367, 133–138. [Google Scholar] [CrossRef]
  32. McMichael, A.J. Globalization, climate change, and human health. N. Engl. J. Med. 2013, 368, 1335–1343. [Google Scholar] [CrossRef] [PubMed]
  33. Death Toll Climbs as Weather Experts Link Pakistan Heat Wave to Climate Change. Available online: http://ecowatch.com/2015/07/06/pakistan-heatwave-climate-change/ (accessed on 13 May 2016).
  34. Cases of Cold-Induced Injuries on the Rise. Available online: http://www.thenews.com.pk/print/84843-Cases-of-cold-induced-injuries-on-the-rise# (accessed on 13 May 2016).
  35. Mad-CAT. Available online: http://joseba.mpch-mainz.mpg.de/equipment.htm (accessed on 13 May 2016).
  36. Heckel, A.; Richter, A.; Tarsu, T.; Wittrock, F.; Hak, C.; Pundt, I.; Junkermann, W.; Burrows, J. MAX-DOAS measurements of formaldehyde in the Po-valley. Atmos. Chem. Phys. 2005, 5, 909–918. [Google Scholar] [CrossRef]
  37. Pikelnaya, O.; Hurlock, S.C.; Trick, S.; Stutz, J. Intercomparison of Multiaxis and long-path differential optical absorption spectroscopy measurements in the marine boundary layer. J. Geophys. Res. Atmos. 2007, 112. [Google Scholar] [CrossRef]
  38. Vlemmix, T.; Piters, A.; Berkhout, A.; Gast, L.; Wang, P.; Levelt, P. Ability of the MAX-DOAS method to derive profile information for NO2: Can the boundary layer and free troposphere be separated? Atmos. Meas. Tech. 2011, 4, 2659–2684. [Google Scholar] [CrossRef]
  39. Platt, U.; Stutz, J. Differential Absorption Spectroscopy; Springer: Berlin/Heidelberg, Germany, 2008. [Google Scholar]
  40. Frieß, U.; Monks, P.; Remedios, J.; Rozanov, A.; Sinreich, R.; Wagner, T.; Platt, U. MAX-DOAS O4 measurements: A new technique to derive information on atmospheric aerosols: 2. Modeling studies. J. Geophys. Res. Atmos. 2006, 111. [Google Scholar] [CrossRef]
  41. Hönninger, G.; Friedeburg, C.V.; Platt, U. Multi axis differential optical absorption spectroscopy (MAX-DOAS). Atmos. Chem. Phys. 2004, 4, 231–254. [Google Scholar] [CrossRef]
  42. Leser, H.; Hönninger, G.; Platt, U. MAX-DOAS measurements of bro and NO2 in the marine boundary layer. Geophys. Res. Lett. 2003, 30. [Google Scholar] [CrossRef]
  43. Van Roozendael, M.; Fayt, C.; Post, P.; Hermans, C.; Lambert, J. Retrieval of bro and NO2 from UV-Visible Observations. Sounding the Troposphere from Space: A New Era for Atmospheric Chemistry; Springer-Verlag: Heidelberg, Germany, 2003. [Google Scholar]
  44. Vandaele, A.C.; Hermans, C.; Simon, P.C.; Carleer, M.; Colin, R.; Fally, S.; Merienne, M.-F.; Jenouvrier, A.; Coquart, B. Measurements of the NO2 absorption cross-section from 42,000 cm−1 to 10,000 cm−1 (238–1000 nm) at 220 K and 294 K. J. Quant. Spectrosc. Radiat. Trans. 1998, 59, 171–184. [Google Scholar] [CrossRef]
  45. Bogumil, K.; Orphal, J.; Homann, T.; Voigt, S.; Spietz, P.; Fleischmann, O.; Vogel, A.; Hartmann, M.; Kromminga, H.; Bovensmann, H. Measurements of molecular absorption spectra with the sciamachy pre-flight model: Instrument characterization and reference data for atmospheric remote-sensing in the 230–2380 nm region. J. Photochem. Photobiol. A Chem. 2003, 157, 167–184. [Google Scholar] [CrossRef]
  46. Thalman, R.; Volkamer, R. Temperature dependent absorption cross-sections of O 2–O 2 collision pairs between 340 and 630 nm and at atmospherically relevant pressure. Phys. Chem. Chem. Phys. 2013, 15, 15371–15381. [Google Scholar] [CrossRef] [PubMed]
  47. Volkamer, R.; Spietz, P.; Burrows, J.; Platt, U. High-resolution absorption cross-section of glyoxal in the UV–VIS and IR spectral ranges. J. Photochem. Photobiol. A Chem. 2005, 172, 35–46. [Google Scholar] [CrossRef]
  48. Rothman, L.S. The evolution and impact of the HITRAN molecular spectroscopic database. J. Quant. Spectrosc. Radiac. Transf. 2010, 111, 1565–1567. [Google Scholar] [CrossRef]
  49. Rothman, L.S.; Jacquemart, D.; Barbe, A.; Benner, D.C.; Birk, M.; Brown, L.; Carleer, M.; Chackerian, C.; Chance, K.; Coudert, L.; et al. The HITRAN 2004 molecular spectroscopic database. J. Quant. Spectrosc. Radiac. Transf. 2005, 96, 139–204. [Google Scholar] [CrossRef]
  50. Voigt, S.; Orphal, J.; Burrows, J. The temperature and pressure dependence of the absorption cross-sections of no 2 in the 250–800 nm region measured by fourier-transform spectroscopy. J. Photochem. Photobiol. A Chem. 2002, 149, 1–7. [Google Scholar] [CrossRef]
  51. Voigt, S.; Orphal, J.; Bogumil, K.; Burrows, J. The temperature dependence (203–293 K) of the absorption cross sections of o 3 in the 230–850 nm region measured by fourier-transform spectroscopy. J. Photochem. Photobiol. A Chem. 2001, 143, 1–9. [Google Scholar] [CrossRef]
  52. Greenblatt, G.D.; Orlando, J.J.; Burkholder, J.B.; Ravishankara, A. Absorption measurements of oxygen between 330 and 1140 nm. J. Geophys. Res. Atmos. 1990, 95, 18577–18582. [Google Scholar] [CrossRef]
  53. Hermans, C. Measurement of Absorption Cross Sections and Spectroscopic Molecular Parameters: O2 and its Collisional Induced Absorption. Available online: http://spectrolab.aeronomie.be/o2.htm (accessed on 29 February 2015).
  54. Hendrick, F.; Roozendael, M.V.; Kylling, A.; Petritoli, A.; Rozanov, A.; Sanghavi, S.; Schofield, R.; Friedebufrg, C.V.; Wagner, T.; Wittrock, F. Intercomparison exercise between different radiative transfer models used for the interpretation of ground-based zenith-sky and multi-AXIS DOAS observations. Atmos. Chem. Phys. 2006, 6, 93–108. [Google Scholar] [CrossRef]
  55. Wagner, T.; Burrows, J.; Deutschmann, T.; Dix, B.; Friedeburg, C.V.; Frieß, U.; Hendrick, F.; Heue, K.-P.; Irie, H.; Iwabuchi, H. Comparison of box-air-mass-factors and radiances for multiple-axis differential optical absorption spectroscopy (MAX-DOAS) geometries calculated from different UV/Visible radiative transfer models. Atmos. Chem. Phys. 2007, 7, 1809–1833. [Google Scholar] [CrossRef]
  56. Lamb, B.; Guenther, A.; Gay, D.; Westberg, H. A national inventory of biogenic hydrocarbon emissions. Atmos. Environ. 1987, 21, 1695–1705. [Google Scholar] [CrossRef]
  57. Guenther, A.; Geron, C.; Pierce, T.; Lamb, B.; Harley, P.; Fall, R. Natural emissions of non-methane volatile organic compounds, carbon monoxide, and oxides of nitrogen from north America. Atmos. Environ. 2000, 34, 2205–2230. [Google Scholar] [CrossRef]
  58. Liggio, J.; Li, S.-M.; McLaren, R. Heterogeneous reactions of glyoxal on particulate matter: Identification of acetals and sulfate esters. Environ. Sci. Technol. 2005, 39, 1532–1541. [Google Scholar] [CrossRef] [PubMed]
  59. Huisman, A.; Hottle, J.; Galloway, M.; DiGangi, J.; Coens, K.; Choi, W.; Faloona, I.; Gilman, J.; Kuster, W.; Gouw, J.D. Photochemical modeling of glyoxal at a rural site: Observations and analysis from Bearpex 2007. Atmos. Chem. Phys. 2011, 11, 8883–8897. [Google Scholar] [CrossRef]
Figure 1. Red balloons show the locations of mini MAX-DOAS instruments installed at MPI-Ch Mainz, Germany during the MAD-CAT field campaign and at IESE-NUST monitoring site in Islamabad, Pakistan. Different levels of vegetation cover (MAD-CAT site with relatively more vegetation in the surrounding area) can be clearly identified from RGB images (adopted from Google earth).
Atmosphere 07 00068 g001
Figure 2. An example of CHOCHO DOAS fit applied to the measured spectrum on 26 June 2013 (MAD-CAT, Germany), 2:17 PM at 5° elevation angle and SZA = 28°. Red lines represent the optical densities of the measured cross-sections and blue lines shows the sum of measured cross-sections and residual as a function of wavelength, (a) for CHOCHO; (b) for NO2; (c) for water vapor; (d) for O4; (e) for spectrum; and (f) fit residual. CHOCHO DSCDs measured for this spectrum was 1.3 × 10¹⁶ molecules/cm2.
Atmosphere 07 00068 g002
Figure 3. Time series of CHOCHO VCDs (molecules/cm2) averaged over a period of half an hour and measured at an elevation angle of 30° during the MAD-CAT field campaign in Mainz, Germany from 18 June to 17 July 2013. Data during rainy days were excluded. Ambient temperature measurements (in degrees Celsius) are also plotted.
Atmosphere 07 00068 g003
Figure 4. Time series of CHOCHO VCDs (molecules/cm2) averaged over a period of half an hour and measured at an elevation angle of 30° at the IESE-NUST site in Islamabad, Pakistan from 17 June to 18 July 2015. Data during rainy days were excluded. Ambient temperature measurements (in degrees Celsius) are also plotted.
Atmosphere 07 00068 g004
Figure 5. Comparison of daily mean of CHOCHO VCDs (molecules/cm2) measured at IESE-NUST site in Islamabad, Pakistan (in brown) and during the MAD-CAT field Campaign at Mainz, Germany (in blue) during the months of June and July in respective years, as mentioned in the legend.
Atmosphere 07 00068 g005
Figure 6. Diurnal variations of CHOCHO in terms of vertical column densities over Islamabad, Pakistan (upper panel) and over Mainz, Germany (lower panel). CHOCHO VCDs were averaged for the months of June and July for the years 2015 and 2013, respectively. While golden dots in both images are representing the actinic flux at both sites during the respective time period.
Atmosphere 07 00068 g006
Figure 7. Correlation plots between daily mean CHOCHO VCDs and actinic flux (golden), ambient temperature (in red), and relative humidity (in blue) over both monitoring sites at the IESE-NUST site in Pakistan (upper panel) and at the MAD-CAT site in Germany (lower panel). Linear fits were applied and the respective correlation was calculated in each scenario.
Atmosphere 07 00068 g007
Table 1. List of few DOAS Fit settings and Residuals reported in Literature.
S. No.StudyDOAS Fit SettingsDOAS Fit Residual
Absorption Cross-SectionsReferencesWavelength Range
1This studyNO2 (220, 298 K)Vandaele et al. [44]434–460 nm8 × 10−4 to 5 × 10⁻³
O3 (223 K)Bogumil et al. [45]
O4Thalmanand and Volkamer, [46]
CHOCHOVolkamer et al. [47]
H2O (296 K)Rothman et al. [48]
RingRing_NDSC2003 [35]
2Li, et al., 2013 [18]CHOCHOVolkamer et al. [47]415–440 nm1 × 10−2 to 1 × 10⁻³
H2ORothman et al. [49]
NO2Voigt et al. [50]
O3 (280 K)Voigt et al. [51]
O4Greenblatt et al. [52]
3Coburn, et al., 2011 [19]O3 (223 K)Bogumil et al. [45]434–460 nm6 × 10−5 to 1.4 × 10⁻⁴
NO2 (294 K)Vandaele et al. [44]
O4Hermans [53]
CHOCHOVolkamer et al. [47]
H2ORothman et al. [49]
Ring
4Seinrich, et al., 2007 [17]NO2Vandaele et al. [44]420–460 nm1.4 × 10−3
O3 (223 K)Bogumil et al. [45]
O4Greenblatt et al. [52]
CHOCHOVolkamer et al. [47]
H2ORothman et al. [49]

