Article

Spatio-Temporal Characteristics in the Clearness Index Derived from Global Solar Radiation Observations in Korea

1
Department of Atmospheric Sciences, Yonsei University, Seoul 03722, Korea
2
Department of Atmospheric Sciences/Research Institute of Basic Sciences, Chungnam National University, Daejeon 34134, Korea
3
Department of Physics, University of Colorado, Boulder, CO 80309, USA
*
Author to whom correspondence should be addressed.
Atmosphere 2016, 7(4), 55; https://doi.org/10.3390/atmos7040055
Submission received: 8 March 2016 / Revised: 30 March 2016 / Accepted: 6 April 2016 / Published: 12 April 2016

Abstract

:
The spatio-temporal characteristics of the clearness index (KT) were investigated using daily global solar irradiance measurements (290–2800 nm) for the period of 2000–2014 at 21 sites in Korea, a complex region in East Asia with a distinct monsoon season and heavy aerosol loading year-round. The annual mean KT value for all sites is 0.46, with values of 0.63 and 0.25 for clear and overcast skies, respectively. The seasonal variations in monthly average KT show a minimum of 0.37 in July at all sites except for Jeju, where the value was 0.29 in January. The maximum value (KT = 0.51) is observed in October, followed by a secondary peak (KT = 0.49) during February–April. The lowest KT value (KT = 0.42) was observed at both the Seoul and Jeju sites, and the highest (KT = 0.48) in the southeastern regions. Increases in average KT exceeding 4% per decade were observed in the middle and southeastern regions, with the maximum (+8% per decade) at the Daegu site. Decreasing trends (<−4% per decade) were observed in the southwestern regions, with the maximum (−7% per decade) at the Mokpo site. Cloud amount, relative humidity, and aerosol optical depth together explained 57% of the variance in daily mean KT values. The contributions of these three variables to variations in KT are 42%, 9% and 6%, respectively. Thus, the variations in KT in Korea can be primarily attributed to the presence of clouds and water vapor, with relatively weak aerosol effects.

Graphical Abstract

1. Introduction

Solar radiation in the ultraviolet, visible, and near-infrared ranges is the major source of energy for the climate and ecosystems on Earth. Global solar radiation refers to the total amount of solar energy reaching the Earth’s surface, which varies dramatically over temporal and spatial scales due to varying atmospheric conditions above the surface. These variations can be attributed to the absorption and scattering of radiation by clouds, water vapor, aerosols, and other gases in the atmosphere, but are difficult to predict, primarily because of non-linear interactions in this complex system [1,2,3].
To quantify the extinction of solar radiation in the atmosphere, the combined contributions of various atmospheric parameters that affect incoming solar radiation need to be examined. While these extinction processes are complex, the estimation of sky conditions using incident solar radiation at a given location has been proposed as a simple approach. The ratio of the global solar radiation measured at the surface to the extraterrestrial solar radiation is defined as the clearness index (KT) [4,5,6,7,8]. The clearness index has been used as a general indicator of the combined effects of the various extinction processes, which determine the transmission of solar radiation through the atmosphere.
There have been many studies characterizing sky conditions and long-term trends of solar radiation using KT for a particular location [1,2,4,8,9]. The sky conditions at tropical stations in Nigeria were analyzed by the diurnal and seasonal variations of hourly and daily KT [2,8]. Based on the 40 years (1961–2000) of daily solar radiation and monthly sunshine duration from China, the significant decreasing trends in KT and global/direct radiation but increasing trend in diffuse radiation were evaluated [1]. Another approach is to develop empirical models for different wavelengths of radiation using sky conditions (i.e., KT) determined from the more commonly measured global solar radiation. These include models for ultraviolet radiation [10,11,12,13,14,15], erythemal ultraviolet radiation [16,17,18,19], photosynthetically active radiation (PAR) [20,21,22], and near-infrared radiation [23]. Using these models, the effects of several atmospheric parameters on the transmission of solar radiation have been assessed, including cloud cover [14,16,24,25], the presence of aerosols [9,26,27], and ozone concentration [12,19]. Additionally, studies of solar energy utilization systems and renewable energy have been performed in which regional KT values were examined to determine the level of solar radiation availability [28,29].
Large variations in KT occur on both temporal and spatial scales. The regional features of KT and the effects of atmospheric parameters on KT have not been sufficiently investigated over the Korean Peninsula where complex interactions of clouds, aerosols, and pollutants occur throughout the year, which includes a distinct monsoon season. Thus, the objective of this study is to evaluate spatio-temporal patterns in KT over a recent time period together with long-term trends in KT in Korea. Using a multiple regression model for KT, we also estimate the individual contributions of several atmospheric parameters influencing KT [30].
The remainder of this paper is organized as follows. Section 2 describes the data and methodology, and Section 3.1 and Section 3.2 present information on temporal and spatial variations in KT, respectively. Section 3.3 analyzes long-term trends in KT and Section 3.4 investigates the individual contributions of atmospheric parameters to KT variations. Finally, a summary and conclusions are given in Section 4.

2. Data and Methodology

The Korean Meteorological Administration (KMA) maintains 21 solar radiation measurement stations (Figure 1). The Gangneung site was established in January 2008, later than other sites. The KMA database provides hourly broadband global solar irradiance measurements. In this study, the daily irradiance data are used together with corresponding meteorological parameters measured at synoptic stations maintained by KMA over 15 years from January 2000 to December 2014 for all but one site (Gangneung). These sites are part of the World Meteorological Organization (WMO) network.

2.1. Instruments and Data

Global solar irradiance (GS, 290–2800 nm) was measured using a pyranometer (CMP-21, Kipp & Zonen, Delft, Netherlands) with an experimental error of 3%. The CMP-21 pyranometer has a non-linearity below 0.2% in the range of 100–1000 Wm−2, a directional response below 10 Wm−2 (up to 80° with a 1000 Wm−2 beam), and a temperature dependence below 1% (from −20 °C to 50 °C). The data were recorded as 1-minute average values using data loggers (CR21X, Campbell Scientific, Logan, UT, USA) and archived as hourly integrated values. The daily integrated values are the summation of 24 hourly measurements in units of Wm−2. In addition, meteorological variables such as Cloud Amount (CA), Relative Humidity (RH), and Aerosol Optical Depth (AOD) were used. The CA is observed visually by KMA and expressed as tenths of the sky covered by clouds according to WMO standards. The RH is measured by Automated Weather Stations (AWS) installed at respective stations. The daily CA and RH are calculated by averaging eight values per day (03:00–24:00 LST). These instruments were installed after proper calibration, certified from the manufacturer, and have been recalibrated regularly. Because the ground-based measurements of AOD were limited, AOD at 550 nm was obtained from the Moderate Resolution Imaging Spectroradiometer (MODIS) Terra Collection 5.1 for the period of March 2000–December 2014. Thus, the long-term trend in AOD from March 2000 was analyzed and a regression model for KT and meteorological variables was developed for the period covered by the AOD dataset.

2.2. Quality Assessment of Sample Data

The quality assessment of GS was based on two main criteria [31]. First, the observed surface GS should be less than the extraterrestrial GS in the same geographical area. Second, the observed surface GS should be larger than the minimum GS value under continuously overcast conditions. These criteria were used to identify outliers, which were removed from the data set. The KT values and their anomalies were then calculated. Less than 1% of all measurement data were eliminated by the quality assessment process. Routine maintenance and control work were performed on-site daily, reducing the number of outlying data points.

2.3. Clearness Index

KT is useful in characterizing the atmospheric transmission of radiation [4,5], and is defined as
K T = H H 0
where H is the global solar radiation measured on the horizontal surface and H0 is the extraterrestrial solar radiation. KT has also been expressed as the total solar transmissivity for UV-B [32] and PAR [33,34] attenuation, respectively.
Daily extraterrestrial solar radiation at the top of atmosphere, H0, is calculated as follows [5]:
H 0 = 24 π I s c E 0 [ ( π 180 ) ω s ( sin δ sin ϕ ) + ( cos δ cos ϕ sin ω s ) ]
where I s c is the solar constant (1367 Wm−2), E 0 is the eccentricity correction factor of the Earth’s orbit, ϕ is the latitude, δ is the solar declination angle, and ω s is the sunrise hour angle. E 0 is given by Duffie and Beckman [35] as follows:
E 0 = 1 + 0.033 cos [ 360 365 ( d n + 284 ) ]
where d n is the day of year. The term δ is calculated as follows [36]:
δ = 23.45 sin [ 360 365 ( d n + 284 ) ]
We also conducted multiple linear regressions and analyzed partial correlation coefficients in order to estimate the individual contributions of the parameters influencing KT [30].

3. Results and Discussion

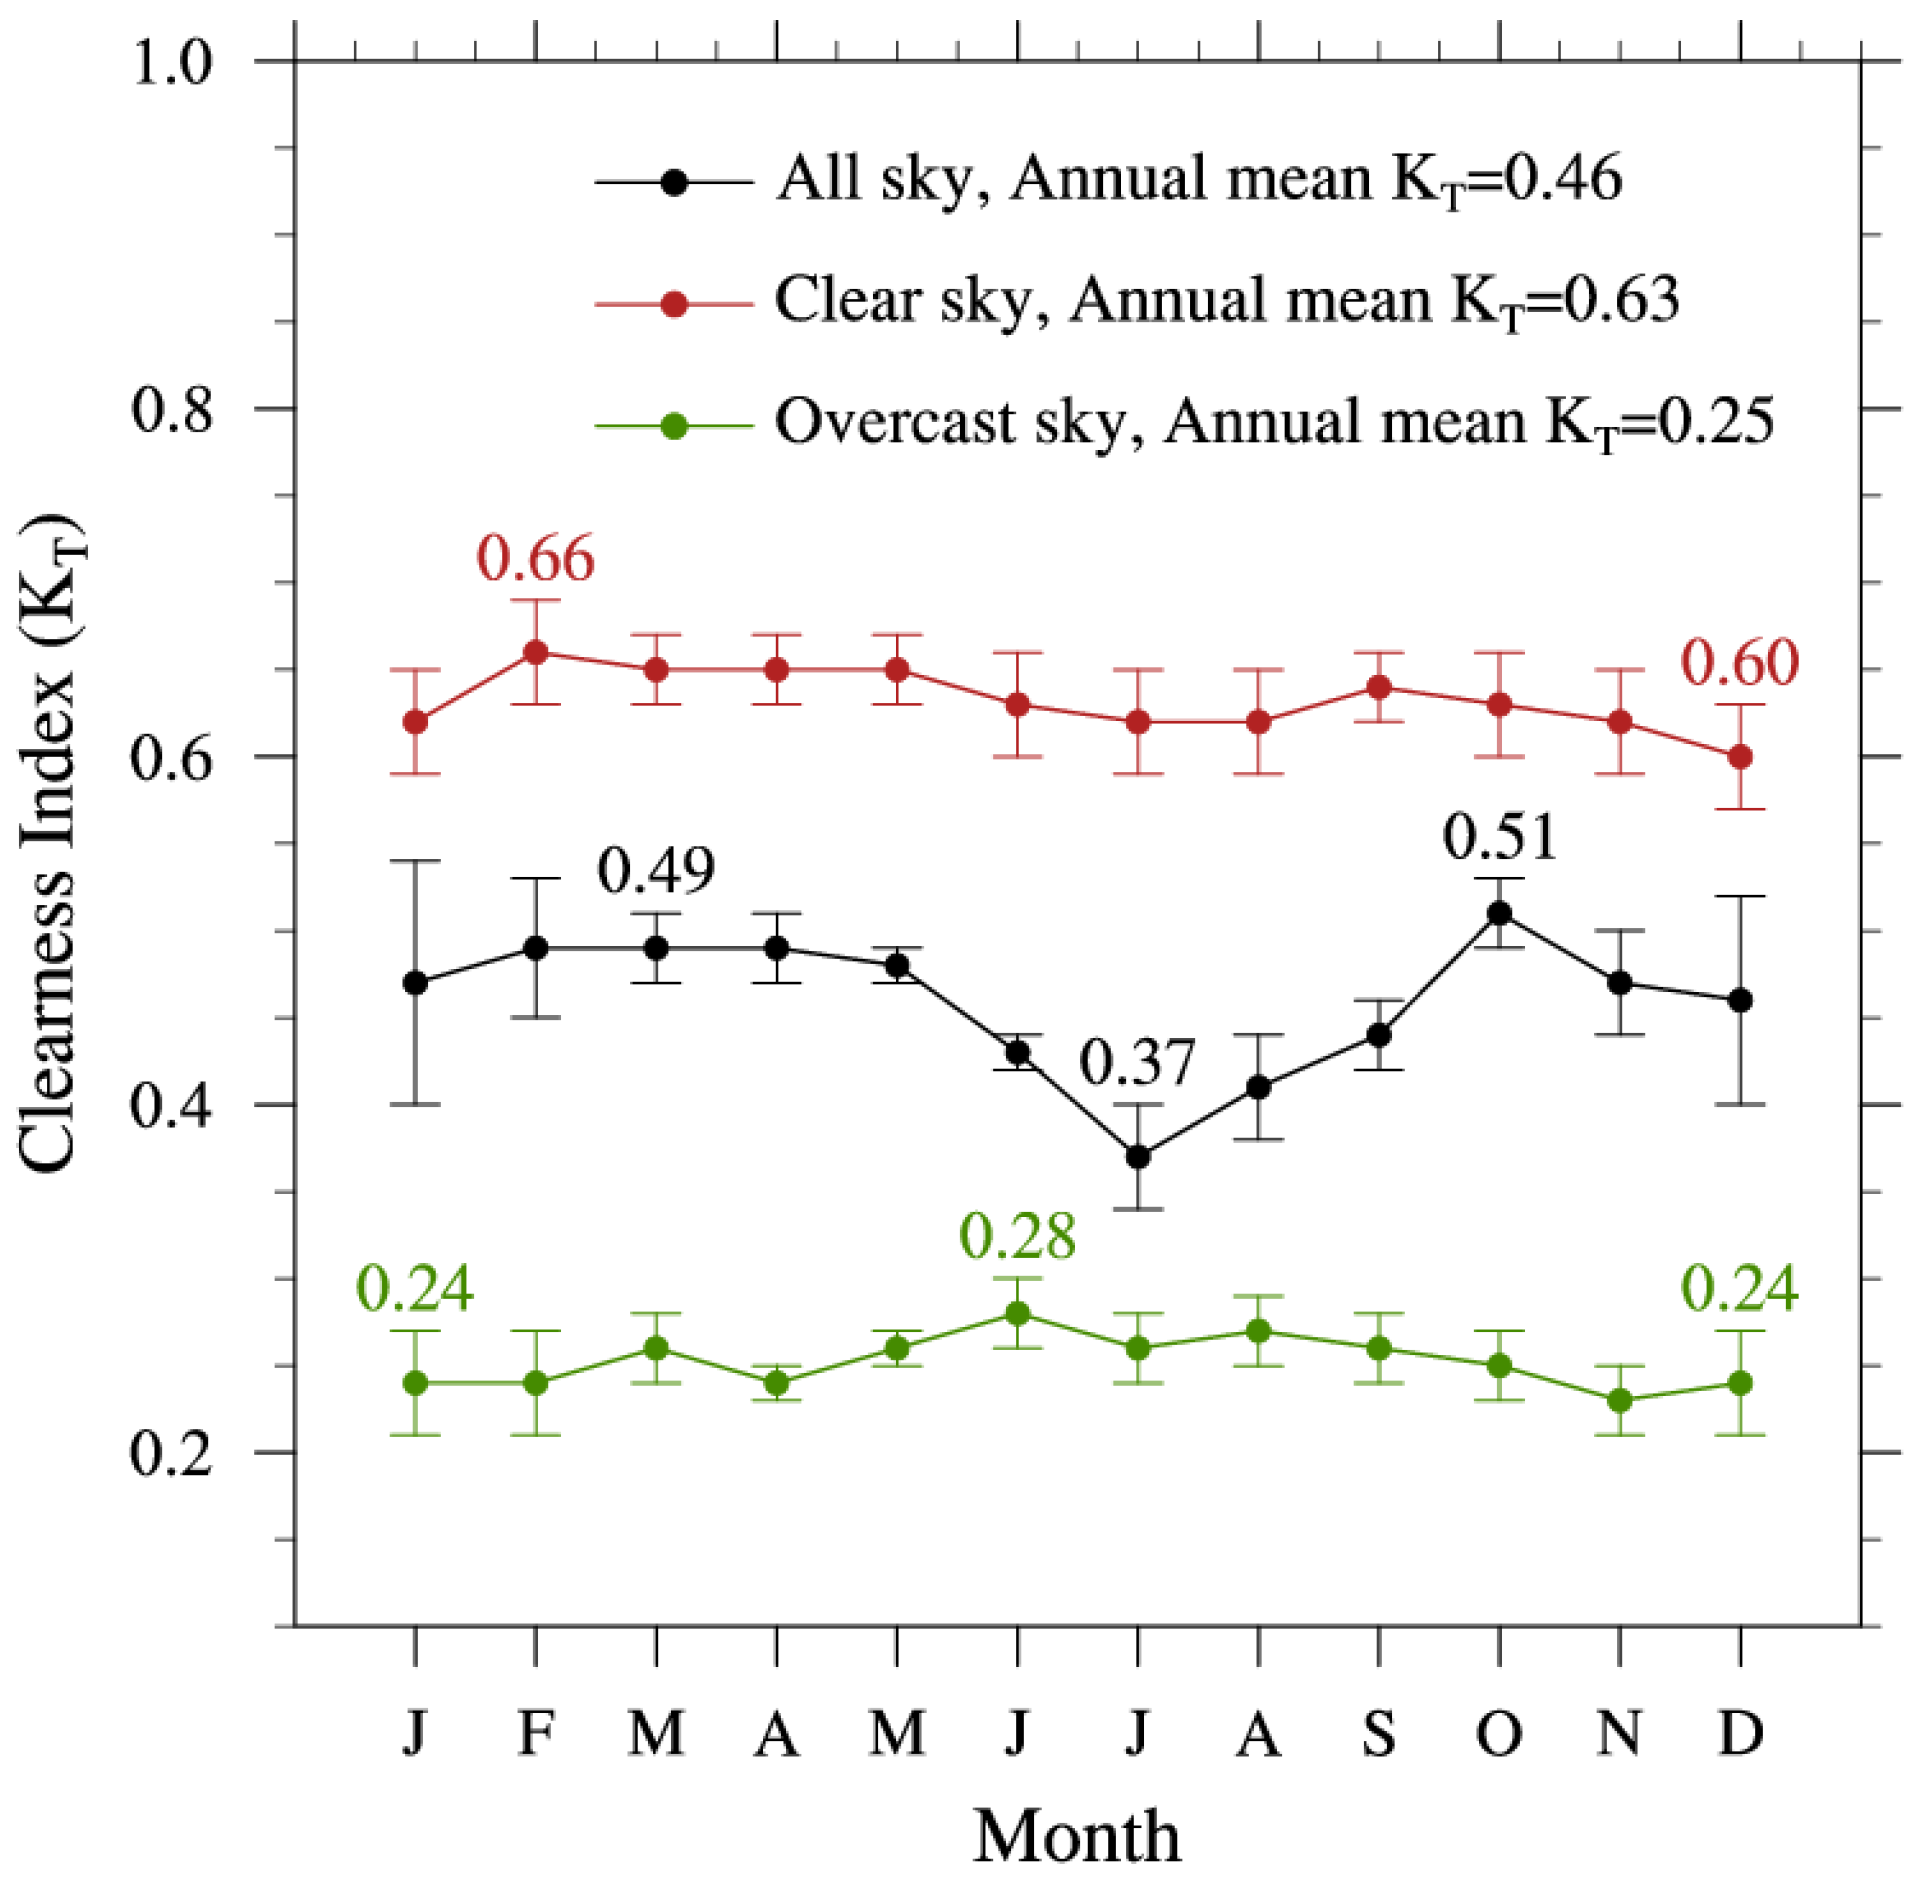
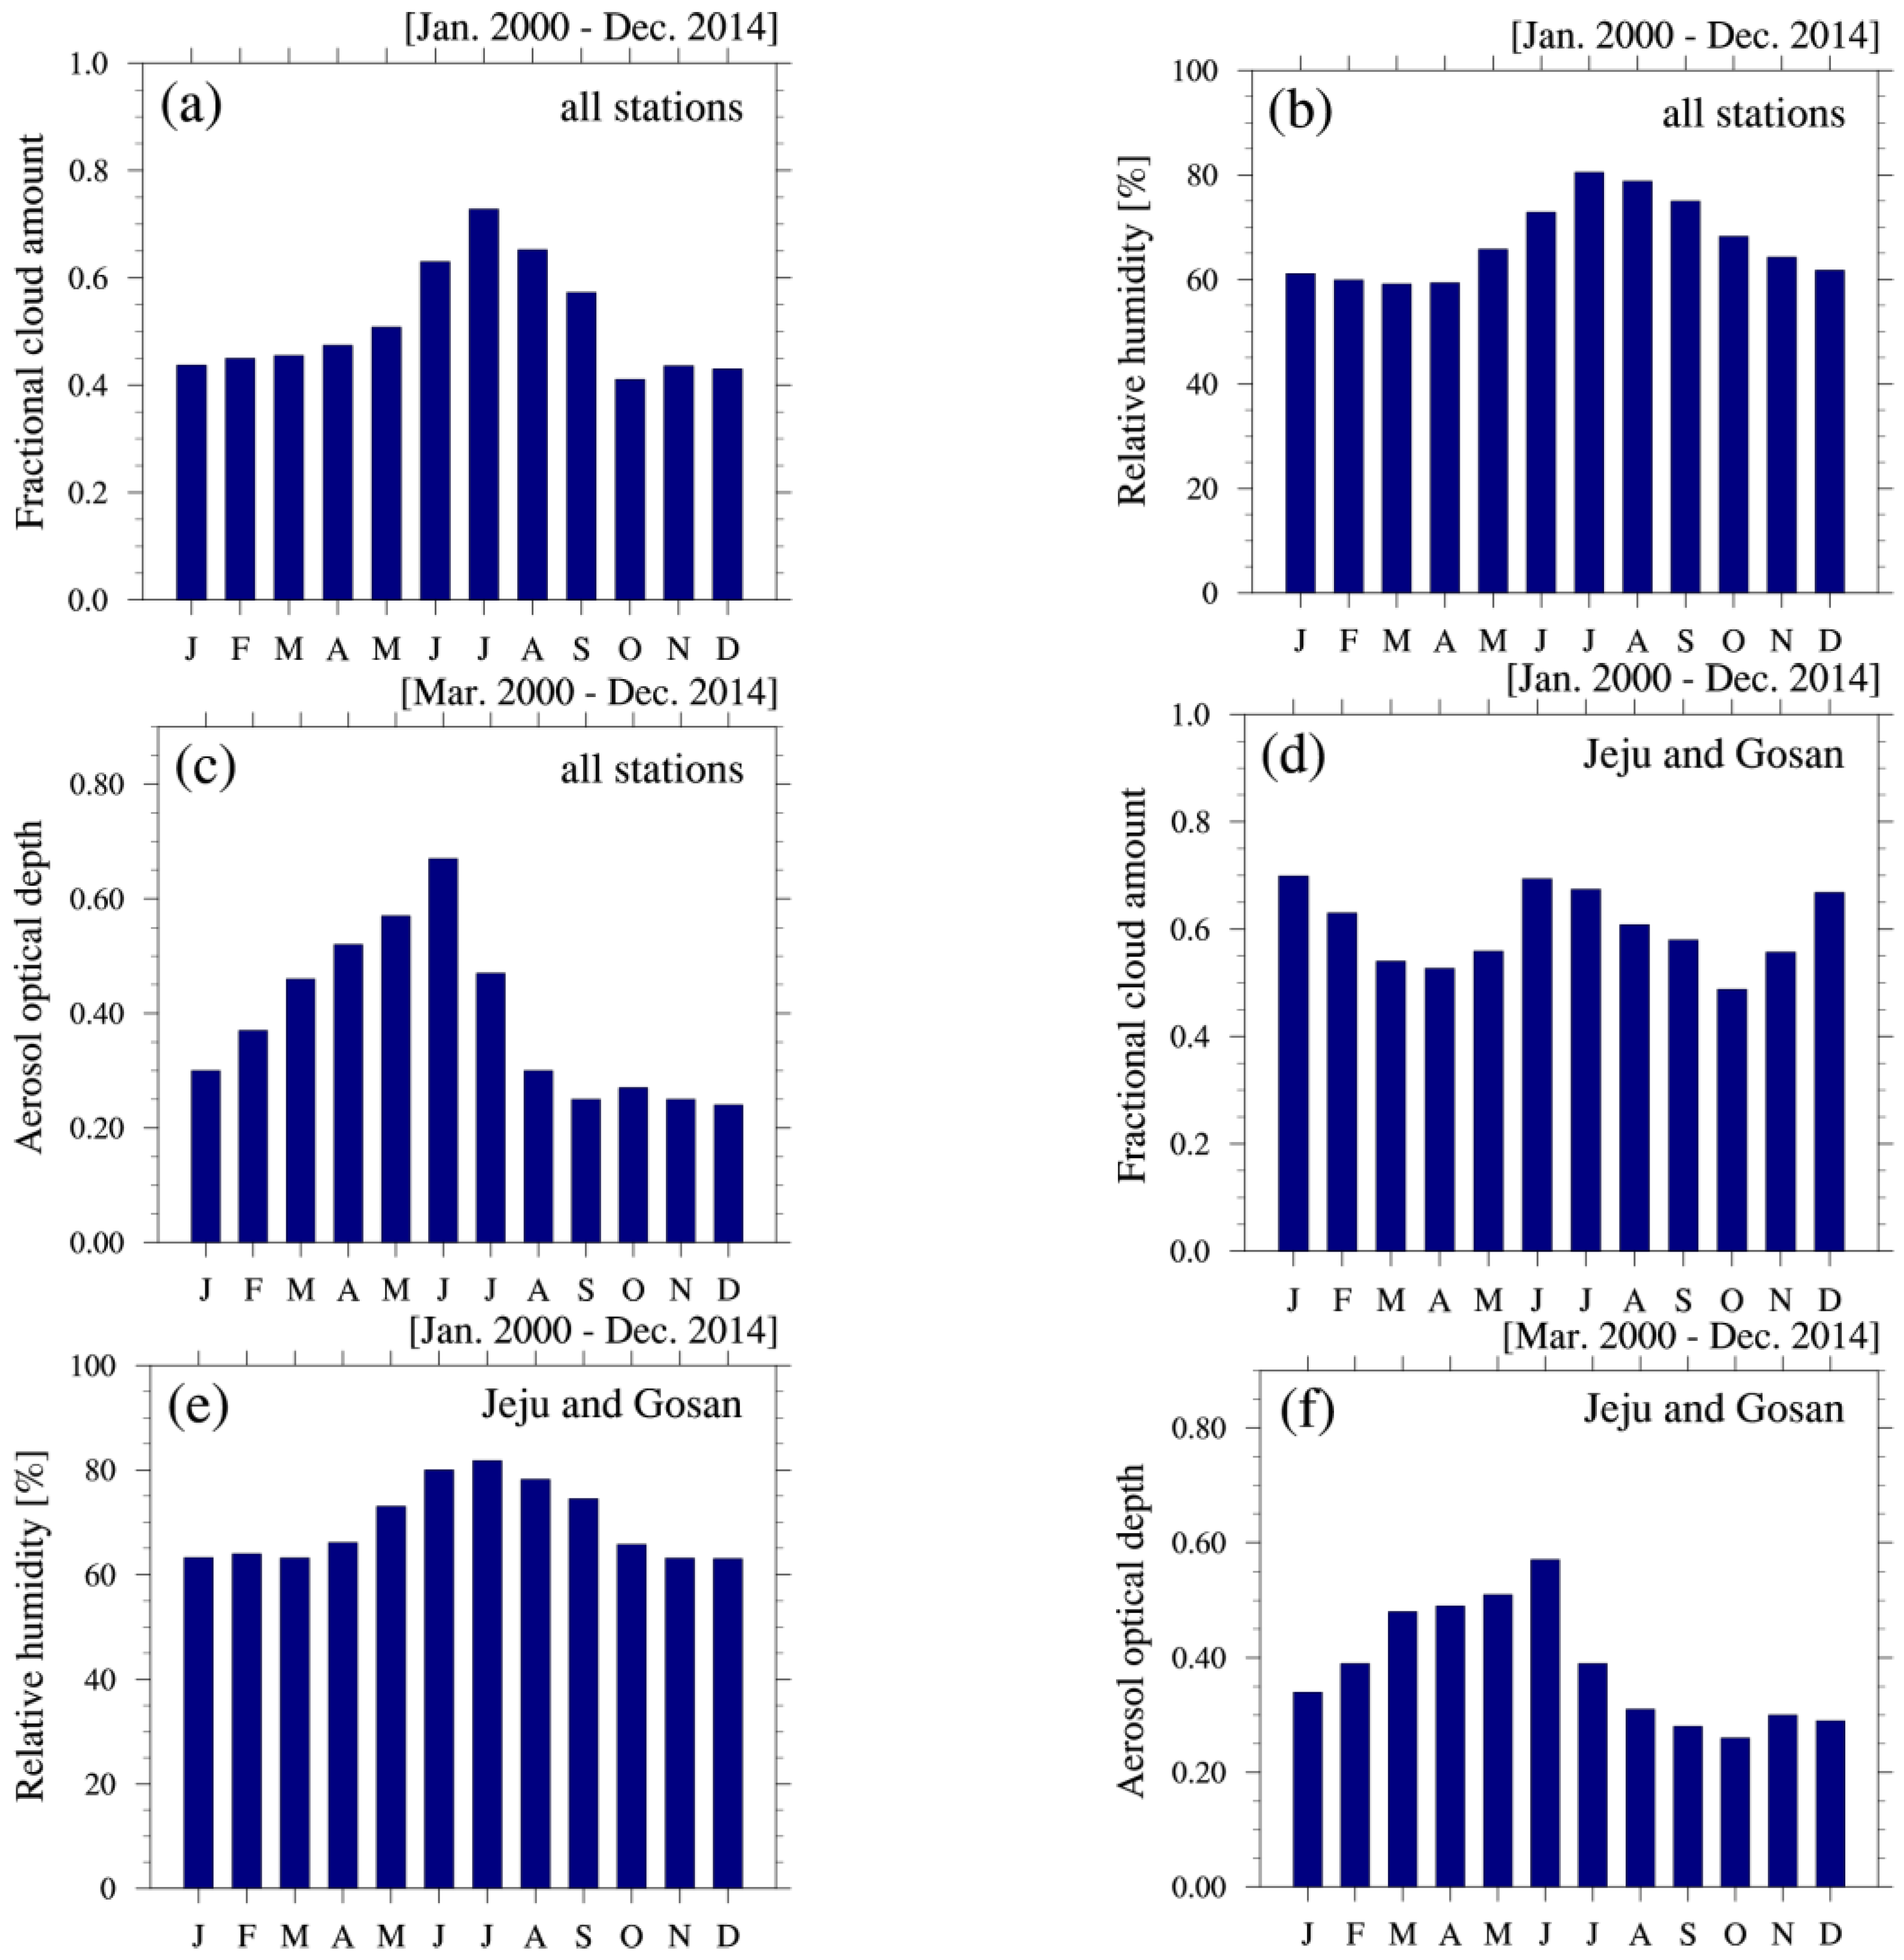
3.1. Temporal Variations

Figure 2 shows temporal variations in monthly mean KT values under three sky conditions (i.e., all, clear (fractional cloud cover values, N < 0.3), and overcast (N > 0.7) skies), averaged over the 21 sites for the period of 2000–2014. The monthly mean KT values under all-sky conditions at each site are summarized in Table 1. When averaged over all sites, the annual mean value of KT under all-sky conditions was 0.46, as shown in Figure 2 and Table 1. The monthly values show a maximum of 0.51 in October and a secondary maximum of 0.49 in February, March, and April. A minimum of 0.37 in July and secondary minimum of 0.41 in August are observed. Overall, there are higher values during autumn, winter, and spring, and lower values in the summer. Monthly variations in the meteorological variables (i.e., CA, RH, and AOD) that influence KT, are shown in Figure 3. Averaged over the 21 sites for the corresponding period, high values of both CA and RH are observed from June to September (Figure 3a,b), whereas higher AOD appears from March to June (Figure 3c). Considering the temporal variations in KT and the meteorological variables, the seasons with relatively high KT are characterized by more frequent clear skies due to a dominant high-pressure system in autumn, and strong northerly winds from the continent in winter. The decrease in KT during July and August can be explained by the attenuation effects of increased cloud and water vapor (RH) during the rainy season, caused by the “Changma” monsoon system. On the other hand, KT does not exhibit strong seasonal dependence, as shown in Figure 2. This can be attributed to the proximity of numerous sites to the sea, which further tends to dampen strong seasonal variations in the moisture content of the atmosphere as well as in the distribution of the cloud cover [37,38].
The general pattern of monthly average KT values over the 21 sites is not the same for all regions, particularly Jeju Island located in the South Sea, southwest of the Korean Peninsula. Minima of 0.29 in January and 0.33 in December/January are observed at Jeju and Gosan, respectively (Table 1). To explain this difference, the monthly distributions of CA, RH, and AOD for the Jeju and Gosan sites are presented in Figure 3d–f. Interestingly, the temporal variations in CA over Jeju Island are quite different to those at other sites (Figure 3a,d), while variations in RH and AOD are similar at all sites. For Jeju and Gosan, a relatively high CA occurs in December and January, indicating a different climate pattern between the mainland and the island. The decrease in KT over Jeju Island in December and January can be attributed to frequent overcast skies, due to the combined effects of strong northwest prevailing winds in winter and a geographical location adjacent to the sea. These results indicate that the monthly variations in KT are closely related to variations in cloudiness at the respective sites. The contribution of CA to KT variations is discussed further in Section 3.4. In addition, Ogunjobi et al. [9] analyzed the characteristics of KT using global solar radiation data for the period 1998–2000 at only two sites, Gwangju and Seoul, with similar results to this study.
Figure 2 also suggests that seasonal variations for both clear (N < 0.3) and overcast (N > 0.7) skies are much weaker than those for all-sky conditions due to cloudless skies or almost constant cloud effects over the whole year, with respective annual means of 0.63 and 0.25. The KT values under clear sky conditions range from 0.60 (December) to 0.66 (February), while the KT values under overcast skies range from 0.24 (December and January) to 0.28 (June). The annual mean KT of 0.63 for clear skies is consistent with the value of 0.62 for clear days, as reported by Jo and Kang [39] using monthly data at 16 sites in Korea from 1982 to 2005. Previous studies have also used threshold values of KT to characterize sky conditions: clear sky (KT > 0.65), cloudy sky (0.35 < KT < 0.65), and overcast sky (KT < 0.35) [23,40,41]. While the value of 0.65 for clear sky conditions is comparable to the KT of 0.63 in this study, the threshold for determining overcast skies (KT = 0.35) is higher than our data suggest (KT = 0.25). Classifying overcast sky conditions in Korea may therefore require a more detailed treatment.

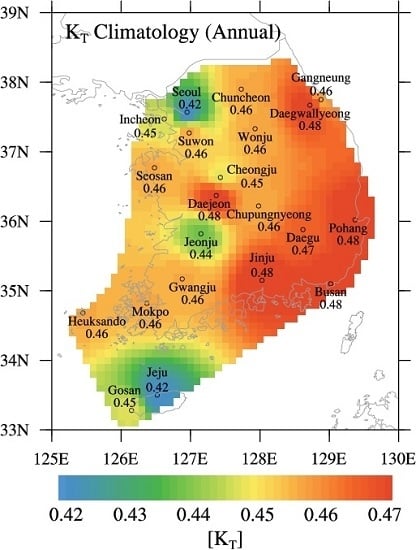
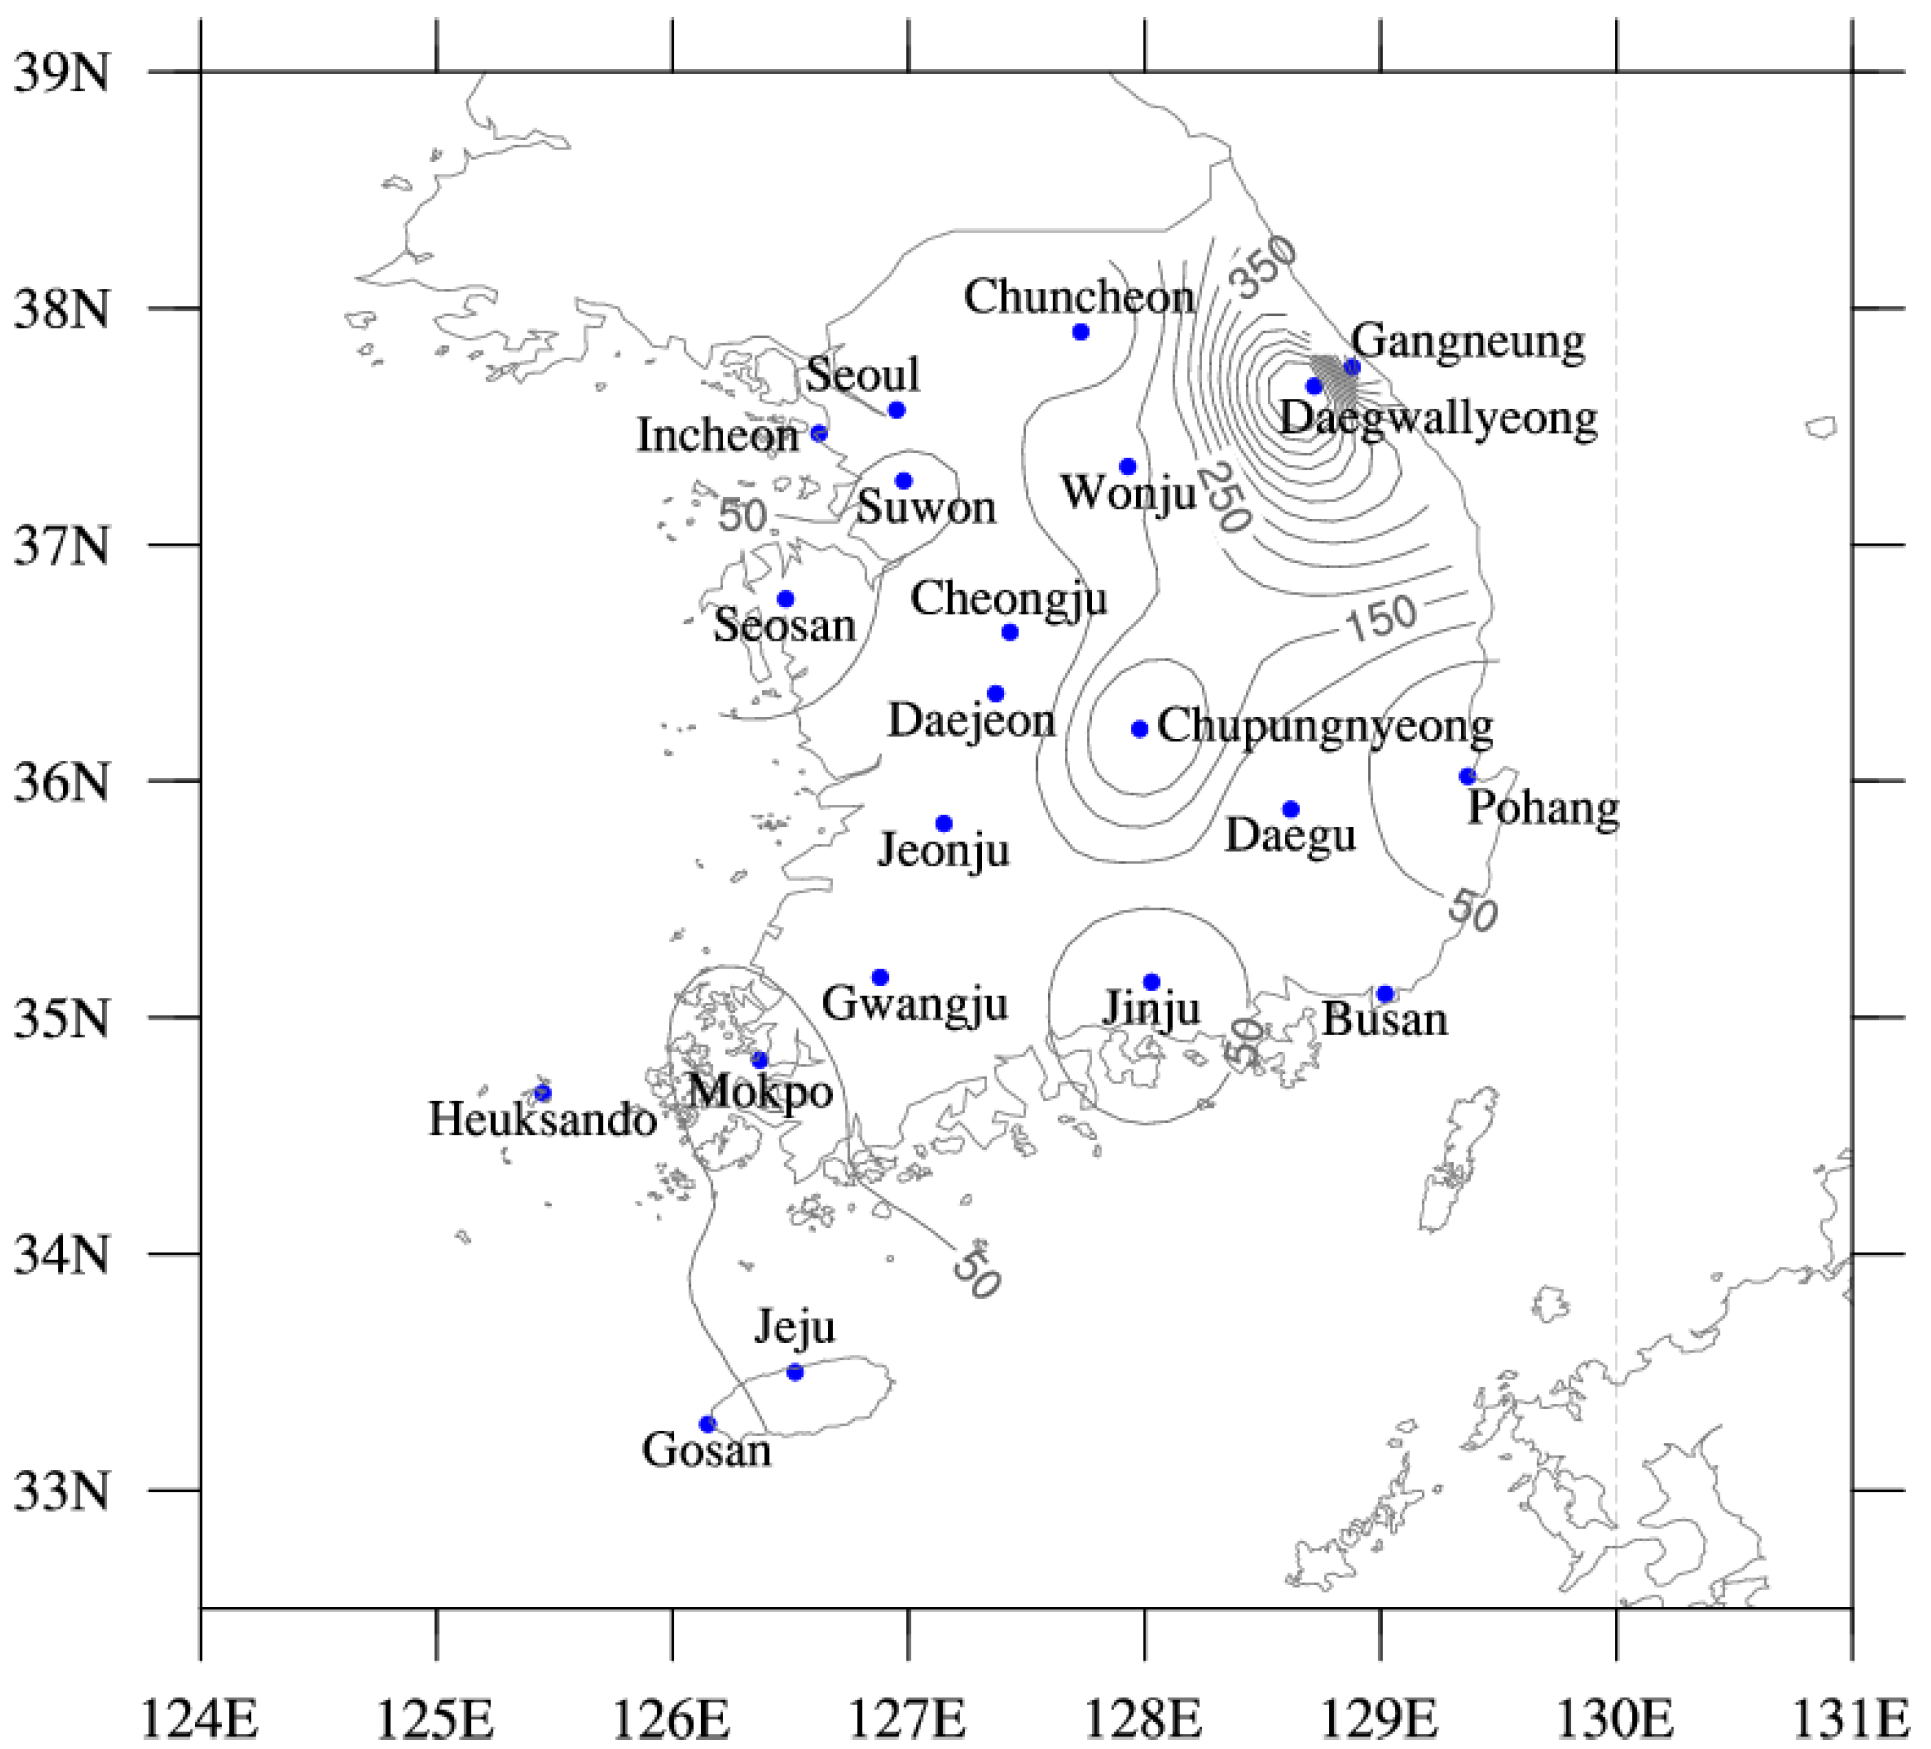
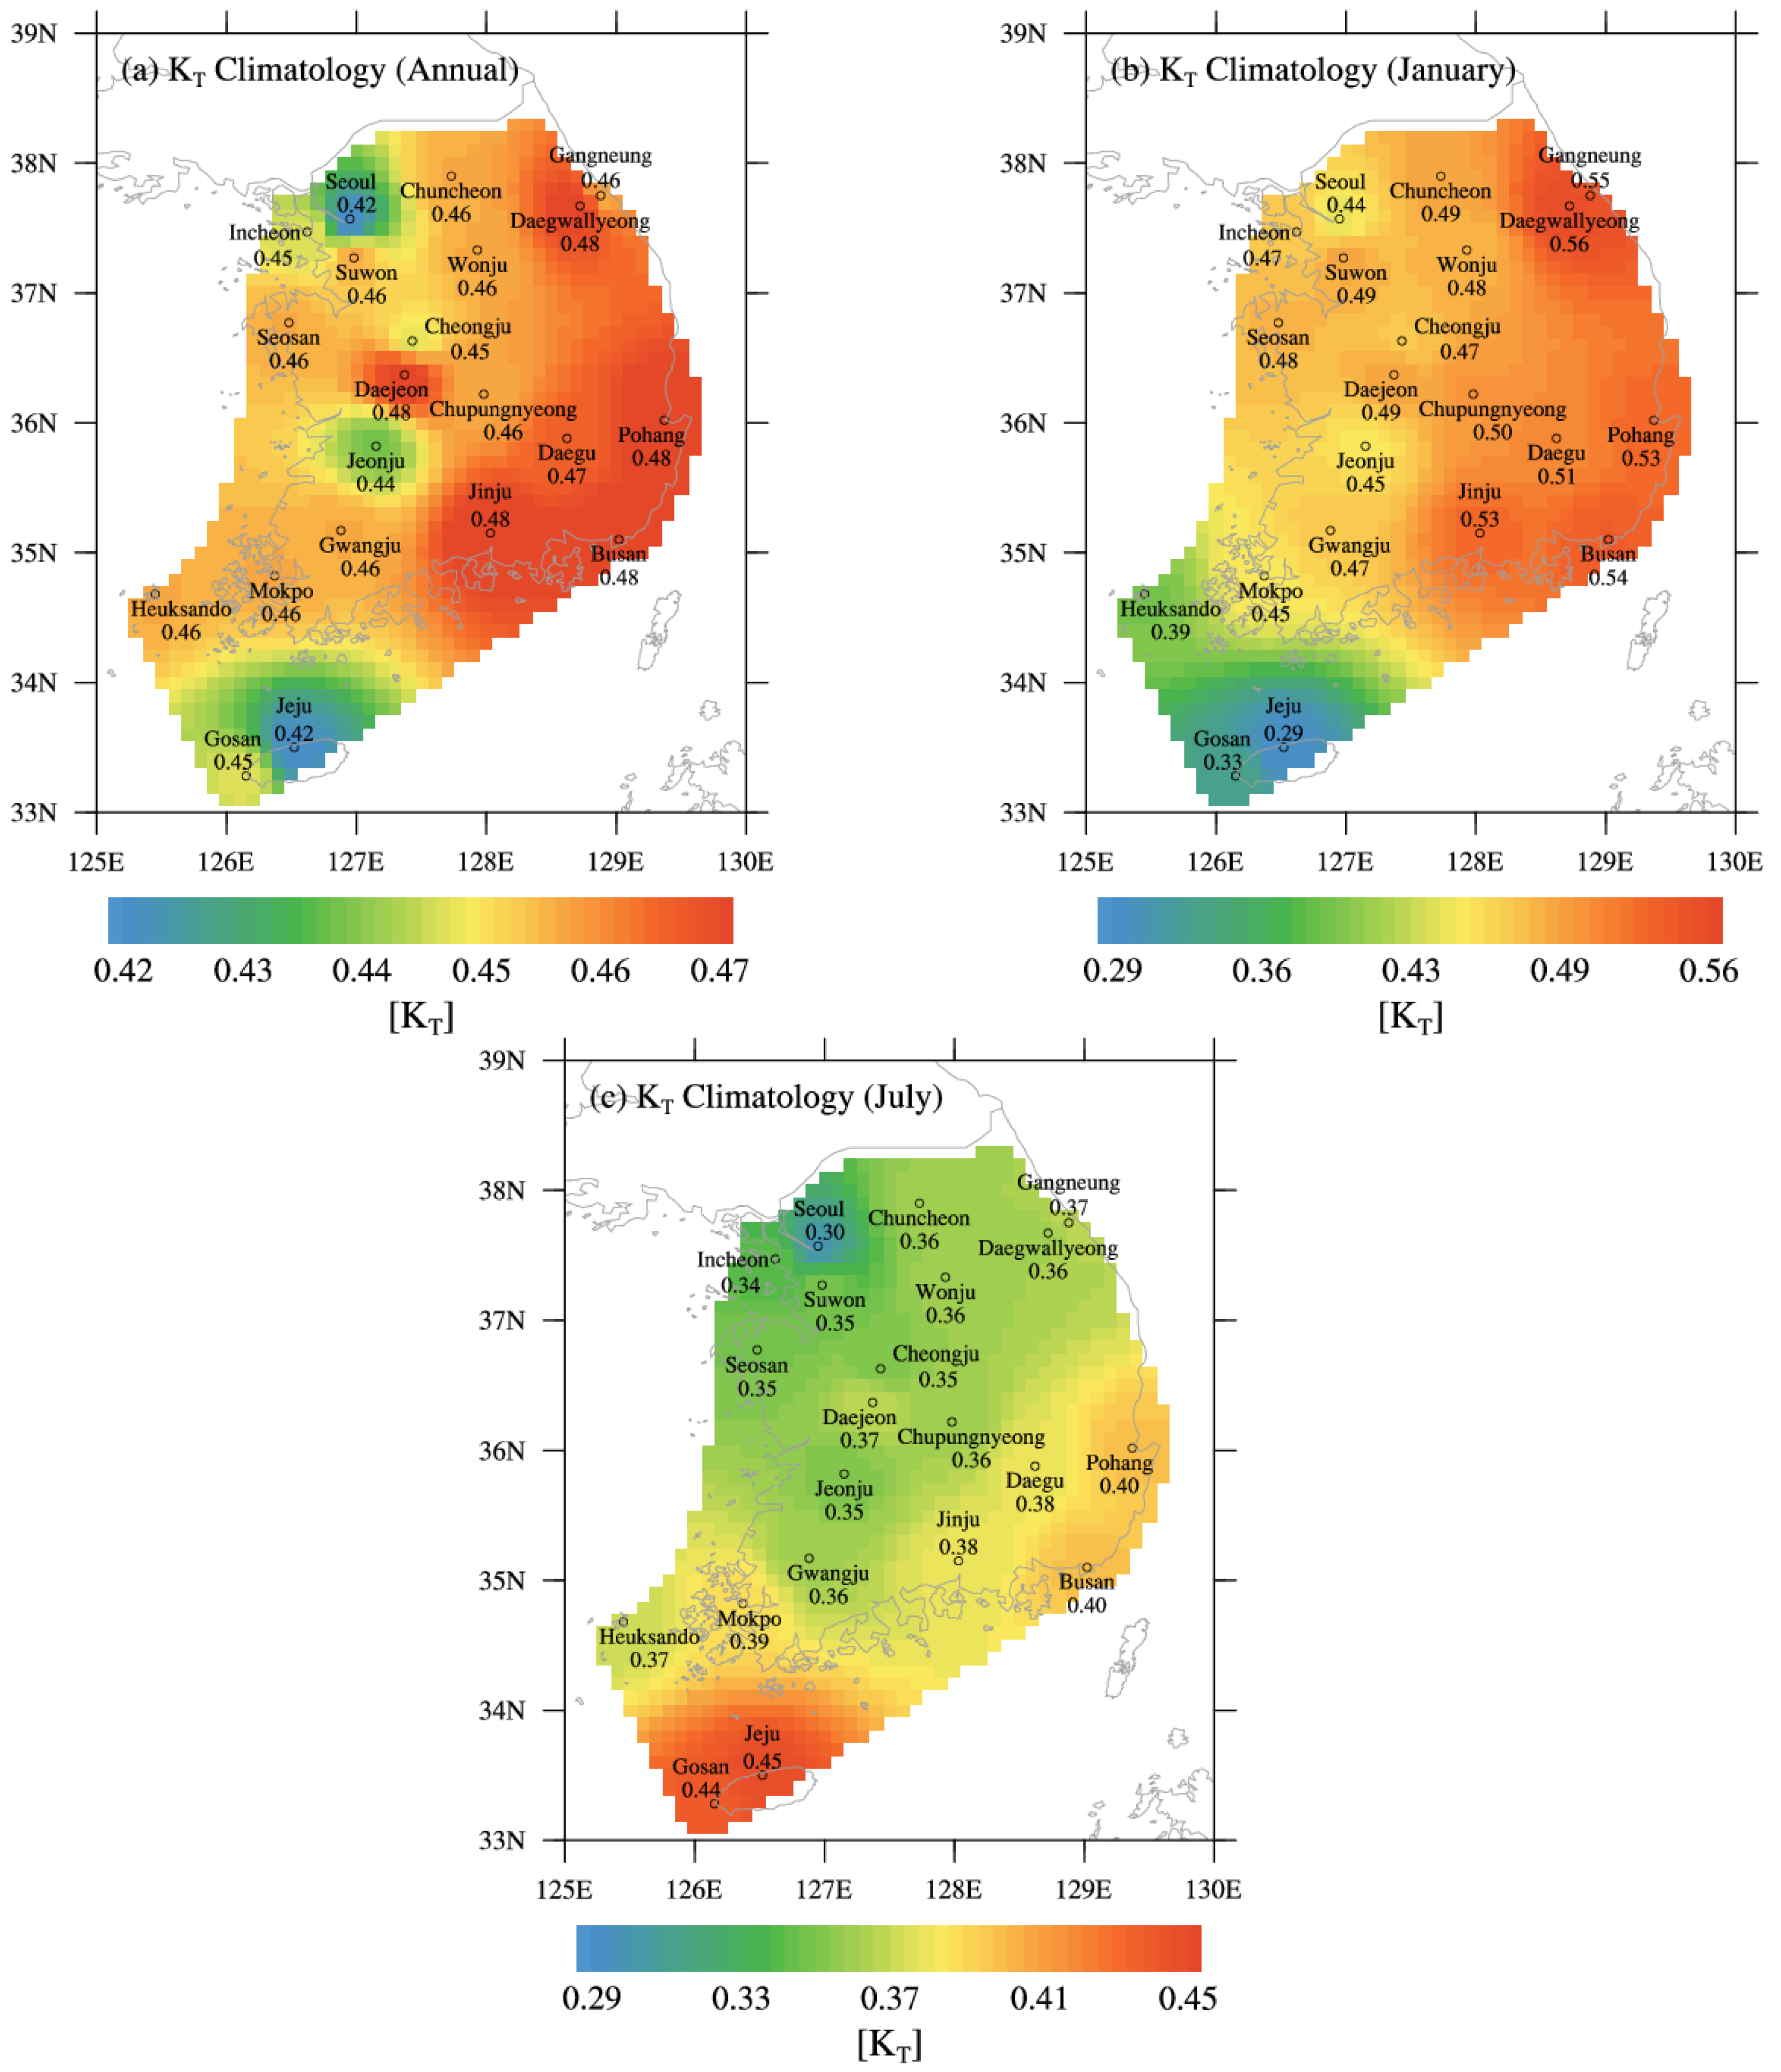
3.2. Spatial Distributions

The nationwide spatial distributions of annual and monthly KT climatology are shown in Figure 4a–c for the whole year, January (representing winter), and July (representing summer), respectively. In Figure 4a, the spatial distribution of annual climatology shows the highest KT values in the southeastern region covering five sites (Daegwallyeong, Daejeon, Jinju, Pohang, and Busan), with a total annual mean KT of 0.48. Lower KT values are found in the mid-west region covering the Seoul, Incheon, and Jeonju sites, and in the Jeju Island region that includes the Jeju and Gosan sites; these values are in the range of 0.42–0.45 with a minimum value of 0.42 at Seoul and Jeju. These relative regional differences can be attributed to local climate and environmental characteristics, as noted for the temporal variations. The annual climatology of AOD (0.52) for the period of 2000–2014 in Seoul and Incheon, covering the largest metropolitan area in Korea, is higher by 33% than that recorded at other sites (0.39). This result may reflect that the sky conditions at these two sites are relatively turbid, resulting in lower KT values due to enhanced attenuation effects. In Jeju and Gosan, the regional climate pattern shows a high frequency of cloud formation that may lead to lower KT values; the annual climatology of CA (6.02) at these two sites is 17% higher than that of other sites (5.14).
As shown in Figure 4b, the spatial distribution of January KT climatology is similar to the annual pattern. High KT values in the range of 0.51–0.56 appear in the eastern and southeastern regions covering the Daegwallyeong, Gangneung, Pohang, Daegu, Busan, and Jinju sites, whereas low KT values in the range of 0.29–0.45 are observed in the mid-west region covering the Seoul, Jeonju, and Mokpo sites and the southwest islands (i.e., Jeju, Gosan, and Heuksando). Of note, the sites with higher KT values in Figure 4a,b are located in eastern (i.e., the Yeongdong district) and southeastern (i.e., the Yeongnam district) regions of the Taebaek Mountains that stretch longitudinally along the eastern edge of the Korean Peninsula. This is the leeward side of the peninsula, which is characterized by clearer and drier conditions, which may result in higher atmospheric transmission of radiation. The spatial distribution of KT climatology in July (Figure 4c) is dissimilar to the annual and winter patterns. Higher KT values appear in the Jeju Island regions (Jeju and Gosan), while lower values are found in the northern region covering the Seoul, Incheon, Suwon, Seosan, and Cheongju sites, within the range of 0.30–0.35. The spatial pattern of KT climatology in July, which gradually increases from north to south, is different from that found in January. In addition, the KT minimum–maximum range for summer is lower than that for winter. These differences may be related to varying weather patterns between the winter and summer seasons, which are characterized by prevailing northwesterly and southeasterly winds, respectively. Based on the evident relationship between spatio-temporal distributions of KT and the changes of atmospheric compositions, the continuous monitoring of KT is necessary in determining the potential of solar power utilization in Korea.

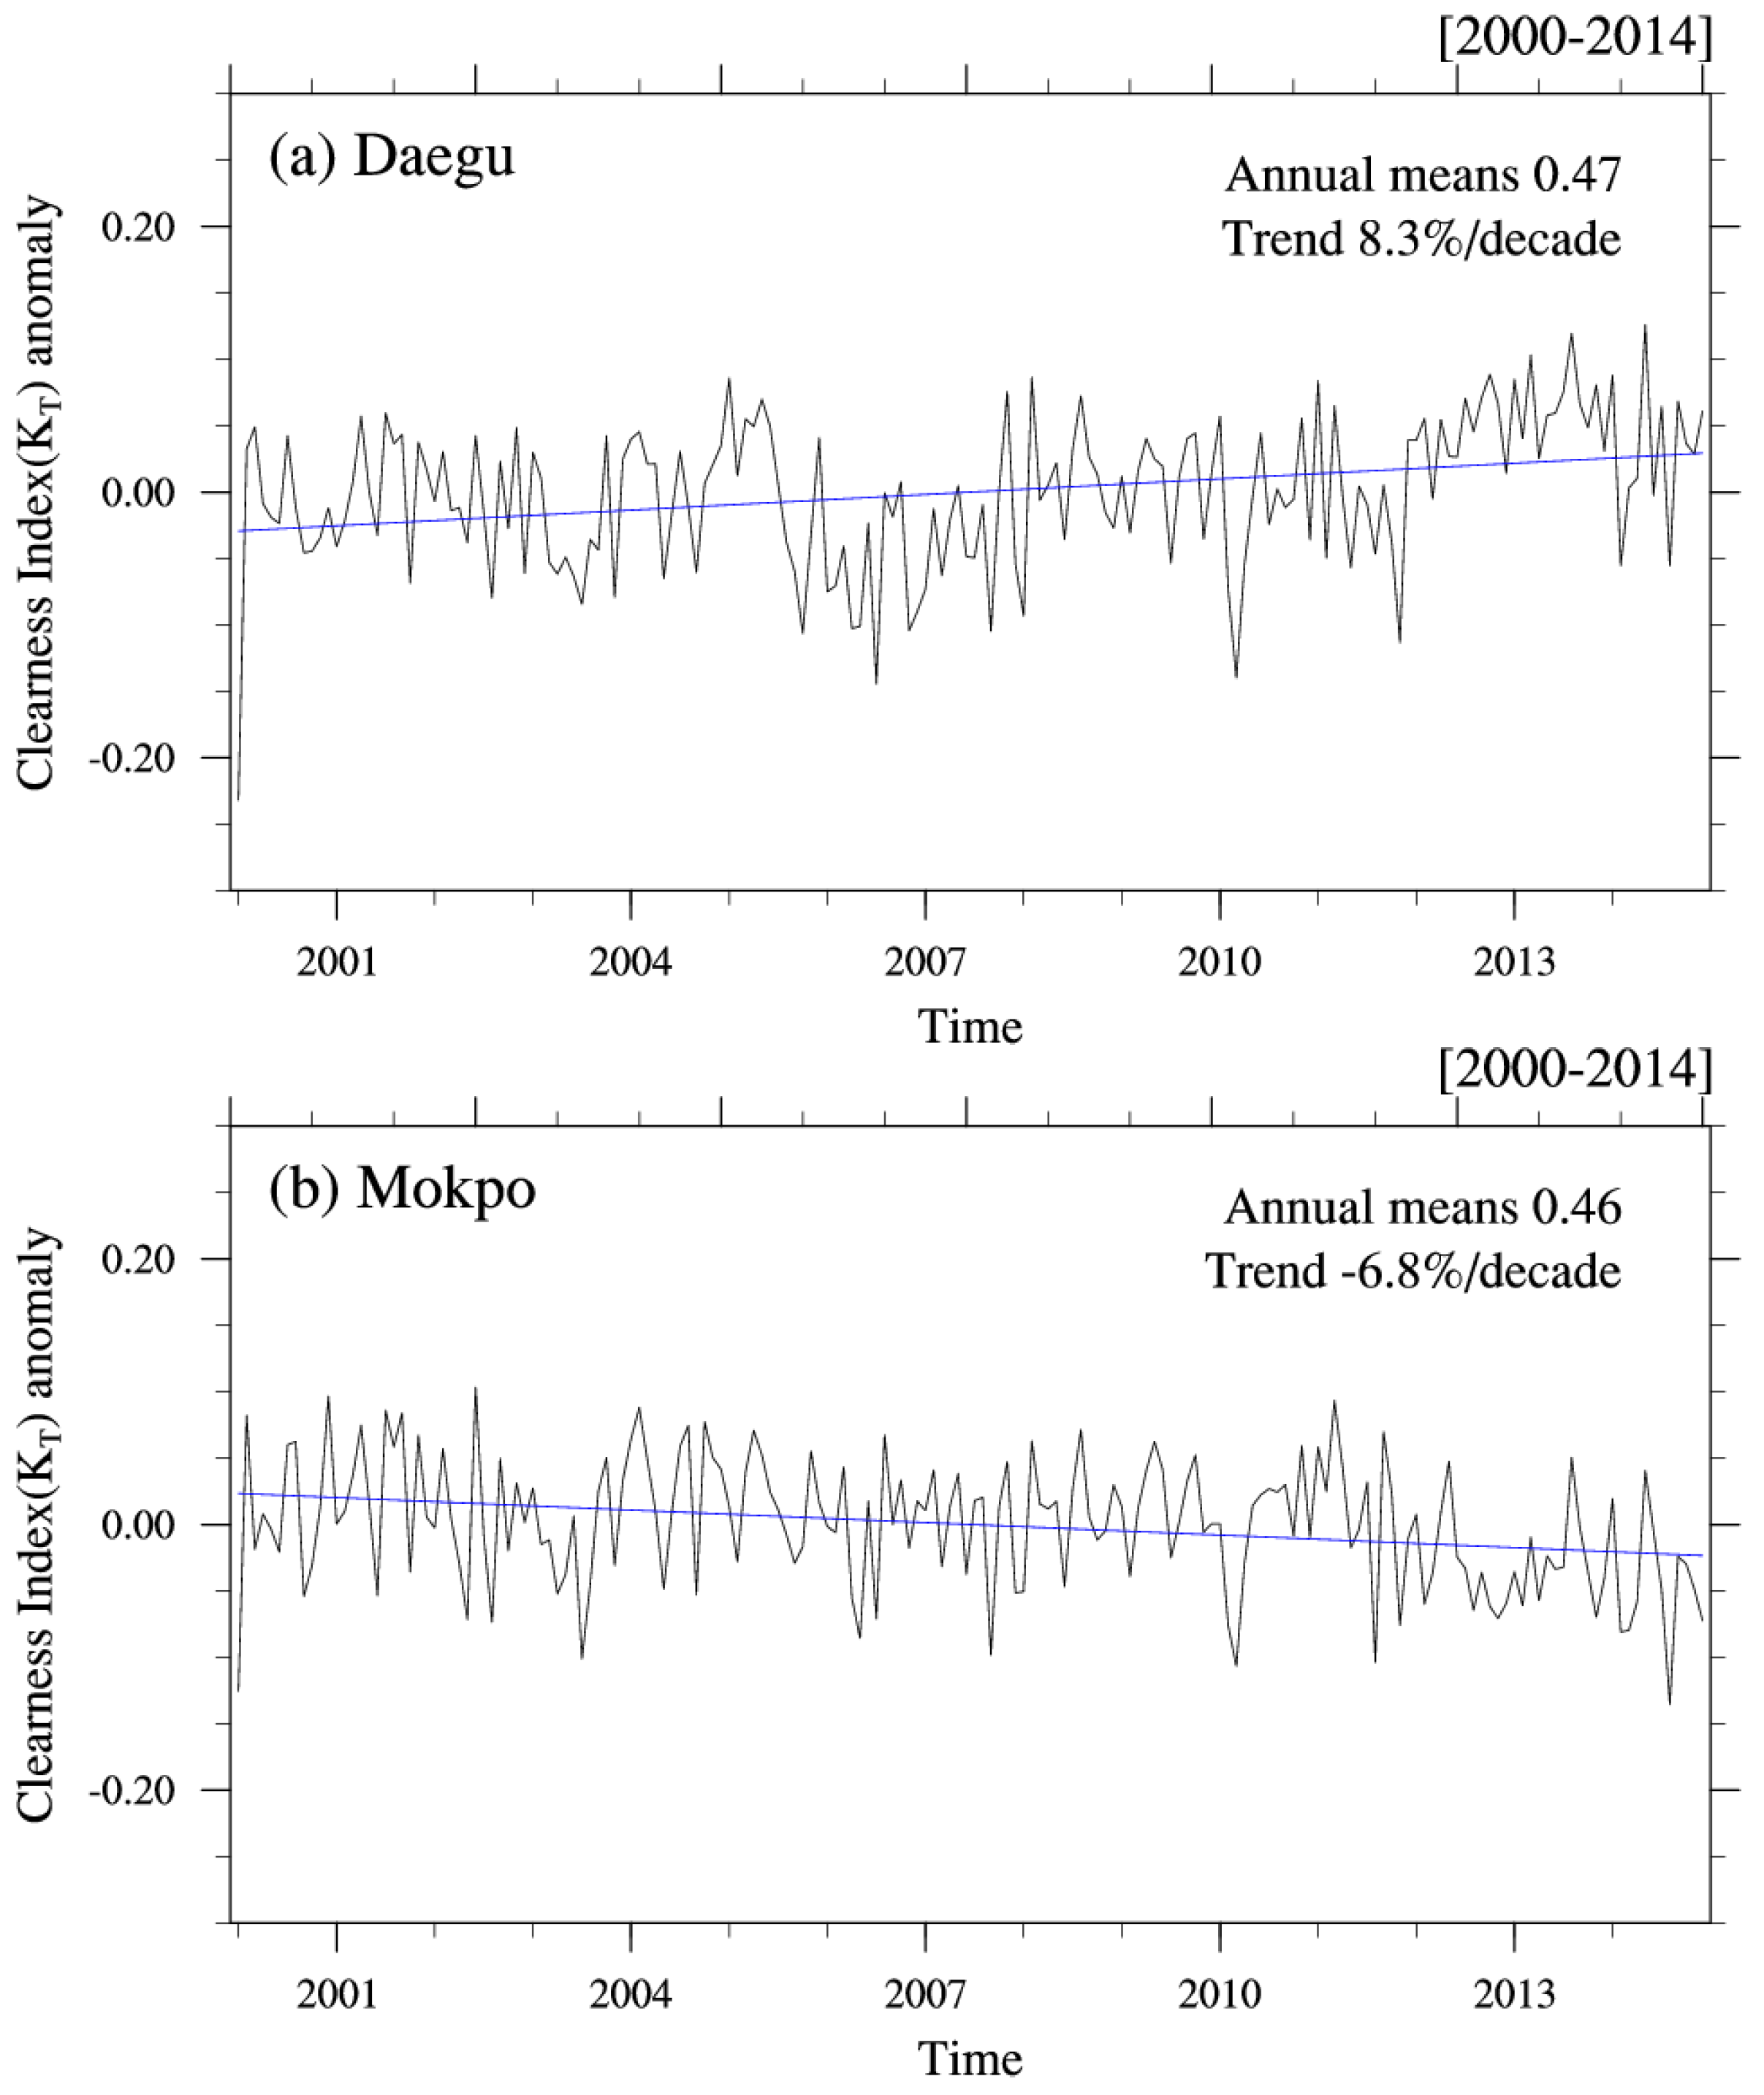
3.3. Long-Term Trends

A simple linear regression analysis of KT values was performed to evaluate long-term trends, using the slope of the linear regression fit, from the time series of deseasonalized monthly mean KT values for the 15 years from 2000 to 2014. The deseasonalized values were calculated with respect to climatological monthly means for the 15-year period. A similar method was used to analyze the long-term trends in CA, RH, and AOD. While the trends of KT, CA, and RH show regional differences, the relative values for the slope of the fit line averaged over the 21 sites were 0.65%, 1.24%, and 1.48% per decade, respectively, suggesting general increases in Korea. However, the AOD trend shows an overall decrease for all sites of less than −13% per decade at the Seosan, Daegu, Jeonju, and Jinju sites.
Table 2 summarizes trends in KT, CA, RH, and AOD for two sets of measurement sites: those for which KT is increasing (termed “brightening”) and those for which KT is decreasing (termed “dimming”). The sites with strongly increasing KT values (>4% per decade in Table 2) are generally in the middle and the southeastern regions of the Korean Peninsula, and include the Daegwallyeong, Seoul, Daejeon, Daegu, and Jinju sites. The highest positive trend (+8.30% per decade) is found at the Daegu site (Figure 5a). The strong increase in KT at the Daegu site is caused by the decreasing trends in RH of −3.83% per decade and AOD of −13.79% per decade (Table 2). The sites with strongly decreasing KT values (<−4% per decade in Table 2) are located in the southwestern regions covering Seosan, Cheonju, and Mokpo, with the strongest negative trend (−6.76% per decade) at the Mokpo site (Figure 5b). The strong decreasing trend in KT at the Mokpo site can be related to increasing trends in CA of +3.53% per decade and RH of +10.31% per decade even though a decreasing trend in AOD is observed (Table 2).
Overall, the trends in meteorological parameters such as CA, RH, and AOD were difficult to relate to trends in KT. The variations in KT may be caused by the combined effects of the three variables, or their contributions influencing KT may be relatively different. As mentioned above, the Seoul site recorded the lowest annual KT value (0.42) in Korea, but with a significant brightening trend (+4.08% per decade). In terms of long-term trends, Ohmura and Lang [42] reported that decadal fluctuations in global solar radiation at 24 sites in Europe were attributed to a change in cloud conditions. Liepert et al. [43] concluded that variations in global solar radiation in Germany were related mainly to aerosols. Ohmura [44] reported that a 20-year dimming phase from 1960 to 1980 and a 15-year brightening phase from 1990 to 2005 were observed in Europe and Japan, concluding that these trends were related to variations in the aerosol content of the atmosphere. Considering these previous findings, it can be suggested that the long-term KT trends depend on temporal and spatial variability of atmospheric properties. In this study, the regional dimming and brightening trends are attributed mainly to the meteorological parameters prevailing over the respective regions.

3.4. Contributions of CA, RH, and AOD to KT Variations

To determine the respective contributions of CA, RH, and AOD to KT, multiple linear regression analyses of the three variables with respect to KT were performed using daily mean data measured at each of the 21 sites. The partial correlation coefficients of CA, RH, and AOD with KT are given in Table 3. KT is negatively correlated with CA, RH, and AOD, and the mean values of partial correlation coefficients averaged over all sites are −0.72 (range, −0.66 to −0.80), −0.45 (−0.13 to −0.58), and −0.37 (−0.19 to −0.49), respectively (Table 3). This result suggests that all three variables significantly affect KT and that CA is the most influential.
Cho et al. [30] developed a multiple regression model to evaluate the effects of three variables on downward longwave radiation using daily temperature, specific humidity, and cloud amount at King Sejong Station, Antarctica. Similarly, in this study we have developed multiple regression models to evaluate the individual contributions of clouds, water vapor, and aerosols to KT variations for the 15 years from 2000 to 2014, using the coefficients of partial correlation (r) and the beta coefficients (β) from the statistical equation, R2 = β 1 r 11 + β 2 r 12 + β 3 r 13 + β 4 r 14 (cf. [45]). Table 3 presents the total and individual contributions of the three variables to KT variations. The multiple regression models show that, on average, CA, RH, and AOD together explained 57.1% (R2 = 0.57) of the KT variations under all-sky conditions. Of the total contribution of 57.1%, the individual contributions of CA, RH, and AOD are 42.1%, 8.8%, and 6.2%, respectively. Thus, the cloud effect was the dominant contributor, and the aerosol effect was the least important in explaining KT variations in Korea.

4. Summary and Conclusions

This study examined seasonal variations in, and the spatial distribution of, the clearness index (KT) using ground-based measurements of global solar irradiance for the 15-year period of 2000–2014 at 21 sites in Korea. The annual mean KT value averaged over all sites was 0.46, with values of 0.63 and 0.25 for clear and overcast skies, respectively. A monthly minimum value for KT of 0.37 occurred in July at all sites except for Jeju, where the minimum occurred in January (KT = 0.29), and Gosan, where the minimum occurred in December/January (KT = 0.33). The relatively low KT values in July were attributed mainly to enhanced attenuation effects by increased water vapor and clouds during the rainy season, which is caused by the “Changma” monsoon system. The low KT values over Jeju Island in December and January can be attributed to frequent cloudy conditions due to the strong northwest prevailing winds in winter and a geographical location surrounded by the sea. The monthly maximum KT value was 0.51 in October, with a secondary maximum of 0.49 in February, March, and April. The highest annual KT value was 0.48, as recorded at the Daegwallyeong, Daejeon, Jinju, Pohang, and Busan sites, all of which are in the southeastern region. The lowest KT value of 0.42 was found at the Seoul site, but showed an increasing long-term trend. The highest positive trends in KT (>+4% per decade) occurred in the middle and southeastern regions, with the largest brightening trend of +8.30% per decade occurring at the Daegu site. The largest negative trends in KT (<−4% per decade) were recorded in the southwestern regions and the largest dimming trend of −6.76% per decade was recorded at the Mokpo site. Multiple linear regression models for KT using daily data for cloud amount, relative humidity, and aerosol optical depth were developed to evaluate their contributions to KT variations. The three variables together explain 57% of the variance in daily mean KT, of which 42% is explained by cloudiness, 9% by relative humidity, and 6% by aerosol optical depth. Thus, the KT variations were affected mainly by clouds with relatively weak aerosol effects in Korea, despite heavy aerosol loading throughout the year. This finding may indicate an indirect effect of aerosol particles on cloud microphysics. However, an evaluation of the indirect aerosol effects on clouds, and thus KT, would require a detailed investigation using comprehensive models and a diverse measurement dataset.

Acknowledgments

This work was funded by “Geostationary Environment Monitoring Spectrometer (GEMS) Program (2012000160002)” of the Korea Ministry of Environment and the Korea Meteorological Administration Research and Development Program under Grant KMIPA 2015-5170. The authors acknowledge Hi Ku Cho for invaluable suggestions.

Author Contributions

Yeonjin Jung, Jaemin Kim, and Yun Gon Lee conceived and designed this research; Hana Lee, Jaemin Kim, and Youngbum Cho analyzed the data and provided main materials of this paper; Yeonjin Jung and Yun Gon Lee wrote the paper.

Conflicts of Interest

The authors declare no conflict of interest.

References

  1. Che, H.; Shi, G.; Zhang, X.; Arimoto, R.; Zhao, J.; Xu, L.; Wang, B.; Chen, Z. Analysis of 40 years of solar radiation data from China, 1961–2000. Geophys. Res. Lett. 2005, 32. [Google Scholar] [CrossRef]
  2. Okogbue, E.; Adedokun, J.; Holmgren, B. Hourly and daily clearness index and diffuse fraction at a tropical station, Ile-Ife, Nigeria. Int. J. Climatol. 2009, 29, 1035–1047. [Google Scholar] [CrossRef]
  3. Bano, T.; Singh, S.; Gupta, N.; John, T. Solar global ultraviolet and broadband global radiant fluxes and their relationships with aerosol optical depth at New Delhi. Int. J. Climatol. 2013, 33, 1551–1562. [Google Scholar] [CrossRef]
  4. Liu, B.Y.; Jordan, R.C. The interrelationship and characteristic distribution of direct, diffuse and total solar radiation. Sol. Energy 1960, 4, 1–19. [Google Scholar] [CrossRef]
  5. Iqbal, M. An Introduction to Solar Radiation; Academic Press: San Diego, CA, USA, 1983; p. 390. [Google Scholar]
  6. Ideriah, F.; Suleman, S. Sky conditions at Ibadan during 1975–1980. Sol. Energy 1989, 43, 325–330. [Google Scholar] [CrossRef]
  7. Elhadidy, M.; Abdel-Nabi, D.; Kruss, P. Ultraviolet solar radiation at Dhahran, Saudi Arabia. Sol. Energy 1990, 44, 315–319. [Google Scholar] [CrossRef]
  8. Udo, S. Sky conditions at Ilorin as characterized by clearness index and relative sunshine. Sol. Energy 2000, 69, 45–53. [Google Scholar] [CrossRef]
  9. Ogunjobi, K.; Kim, Y.; Adedokun, J.; Ryu, S.; Kim, J. Analysis of sky condition using solar radiation data at Kwangju and Seoul, South Korea and Ile-Ife, Nigeria. Theor. Appl. Climatol. 2002, 72, 265–272. [Google Scholar] [CrossRef]
  10. Foyo-Moreno, I.; Vida, J.; Alados-Arboledas, L. A simple all weather model to estimate ultraviolet solar radiation (290–385 nm). J. Appl. Meteorol. 1999, 38, 1020–1026. [Google Scholar] [CrossRef]
  11. Cañada, J.; Pedrós, G.; López, A.; Boscá, J. Influences of the clearness index for the whole spectrum and of the relative optical air mass on UV solar irradiance for two locations in the Mediterranean area, Valencia and Cordoba. J. Geophys. Res. 2000, 105, 4759–4766. [Google Scholar] [CrossRef]
  12. Adam, M. Atmospheric modulations of the ratio of UVB to broadband solar radiation: Effect of ozone, water vapour, and aerosols at Qena, Egypt. Int. J. Climatol. 2014, 34, 2477–2488. [Google Scholar] [CrossRef]
  13. Adam, M.E.-N. Determination of daily total ultraviolet-B in a subtropical region (Upper Egypt): An empirical approach. Atmos. Res. 2015, 153, 1–9. [Google Scholar] [CrossRef]
  14. Wang, L.; Gong, W.; Lin, A.; Hu, B. Measurements and cloudiness influence on UV radiation in Central China. Int. J. Climatol. 2014, 34, 3417–3425. [Google Scholar] [CrossRef]
  15. Wang, L.; Gong, W.; Luo, M.; Wang, W.; Hu, B.; Zhang, M. Comparison of different UV models for cloud effect study. Energy 2015, 80, 695–705. [Google Scholar] [CrossRef]
  16. Alados-Arboledas, L.; Alados, I.; Foyo-Moreno, I.; Olmo, F.; Alcántara, A. The influence of clouds on surface UV erythemal irradiance. Atmos. Res. 2003, 66, 273–290. [Google Scholar] [CrossRef]
  17. Foyo-Moreno, I.; Alados, I.; Alados-Arboledas, L. Adaptation of an empirical model for erythemal ultraviolet irradiance. Ann. Geophys. 2007, 25, 1499–1508. [Google Scholar] [CrossRef]
  18. Antón, M.; Serrano, A.; Cancillo, M.; García, J. Relationship between erythemal irradiance and total solar irradiance in South-Western Spain. J. Geophys. Res. 2008, 113. [Google Scholar] [CrossRef]
  19. Antón, M.; Serrano, A.; Cancillo, M.; García, J. An empirical model to estimate ultraviolet erythemal transmissivity. Ann. Geophys. 2009, 27, 1387–1398. [Google Scholar] [CrossRef]
  20. Udo, S.; Aro, T. Global PAR related to global solar radiation for central Nigeria. Agric. For. Meteorol. 1999, 97, 21–31. [Google Scholar] [CrossRef]
  21. Wang, L.; Gong, W.; Ma, Y.; Hu, B.; Zhang, M. Photosynthetically active radiation and its relationship with global solar radiation in Central China. Int. J. Biometeorol. 2014, 58, 1265–1277. [Google Scholar] [CrossRef] [PubMed]
  22. Wang, L.; Gong, W.; Li, C.; Lin, A.; Hu, B.; Ma, Y. Measurement and estimation of photosynthetically active radiation from 1961 to 2011 in Central China. Appl. Energy 2013, 111, 1010–1017. [Google Scholar] [CrossRef]
  23. Escobedo, J.F.; Gomes, E.N.; Oliveira, A.P.; Soares, J. Modeling hourly and daily fractions of UV, PAR and NIR to global solar radiation under various sky conditions at Botucatu, Brazil. Appl. Energy 2009, 86, 299–309. [Google Scholar] [CrossRef]
  24. Wang, L.; Gong, W.; Li, J.; Ma, Y.; Hu, B. Empirical studies of cloud effects on ultraviolet radiation in Central China. Int. J. Climatol. 2014, 34, 2218–2228. [Google Scholar] [CrossRef]
  25. Adam, M.E.-N.; Ahmed, E.A. Comparative analysis of cloud effects on ultraviolet-B and broadband solar radiation: Dependence on cloud amount and solar zenith angle. Atmos. Res. 2016, 168, 149–157. [Google Scholar] [CrossRef]
  26. Ogunjobi, K.; Kim, Y. Ultraviolet (0.280–0.400 μm) and broadband solar hourly radiation at Kwangju, South Korea: Analysis of their correlation with aerosol optical depth and clearness index. Atmos. Res. 2004, 71, 193–214. [Google Scholar] [CrossRef]
  27. Adam, M.E.-N. Sensitivity analysis of aerosols’ effect in UVB transmission to solar zenith angle at subtropical location (Qena, Egypt). Atmos. Environ. 2013, 71, 311–318. [Google Scholar] [CrossRef]
  28. Dervishi, S.; Mahdavi, A. Computing diffuse fraction of global horizontal solar radiation: A model comparison. Sol. Energy 2012, 86, 1796–1802. [Google Scholar] [CrossRef]
  29. Duzen, H.; Aydin, H. Sunshine-based estimation of global solar radiation on horizontal surface at Lake Van region (Turkey). Energy Convers. Manag. 2012, 58, 35–46. [Google Scholar] [CrossRef]
  30. Cho, H.K.; Kim, J.; Jung, Y.; Lee, Y.G.; Lee, B.Y. Recent changes in downward longwave radiation at King Sejong Station, Antarctica. J. Clim. 2008, 21, 5764–5776. [Google Scholar] [CrossRef]
  31. Geiger, M.; Diabaté, L.; Ménard, L.; Wald, L. A web service for controlling the quality of measurements of global solar irradiation. Sol. Energy 2002, 73, 475–480. [Google Scholar] [CrossRef]
  32. Estupiñán, J.G.; Raman, S.; Crescenti, G.H.; Streicher, J.J.; Barnard, W.F. Effects of clouds and haze on UV-B radiation. J. Geophys. Res. 1996, 101, 16807–16816. [Google Scholar] [CrossRef]
  33. Spitters, C.; Toussaint, H.; Goudriaan, J. Separating the diffuse and direct component of global radiation and its implications for modeling canopy photosynthesis Part I. Components of incoming radiation. Agric. For. Meteorol. 1986, 38, 217–229. [Google Scholar] [CrossRef]
  34. Jacovides, C.; Tymvios, F.; Assimakopoulos, V.; Kaltsounides, N. The dependence of global and diffuse PAR radiation components on sky conditions at Athens, Greece. Agric. For. Meteorol. 2007, 143, 277–287. [Google Scholar] [CrossRef]
  35. Duffie, J.A.; Beckman, W.A. Solar Engineering of Thermal Processes, 4th ed.; John Wiley & Sons Inc.: Hoboken, NJ, USA, 1980. [Google Scholar]
  36. Cooper, P. The absorption of radiation in solar stills. Sol. Energy 1969, 12, 333–346. [Google Scholar] [CrossRef]
  37. Erbs, D.; Klein, S.; Duffie, J. Estimation of the diffuse radiation fraction for hourly, daily and monthly-average global radiation. Sol. Energy 1982, 28, 293–302. [Google Scholar] [CrossRef]
  38. Jacovides, C.; Hadjioannou, L.; Pashiardis, S.; Stefanou, L. On the diffuse fraction of daily and monthly global radiation for the island of Cyprus. Sol. Energy 1996, 56, 565–572. [Google Scholar] [CrossRef]
  39. Jo, D.-K.; Kang, Y.-H. A study on the analysis of global dimming appearances using the solar radiation measurement in Korean major cities (focused on atmospheric clearness analysis). J. Korean Sol. Energy Soc. 2007, 27, 45–52. [Google Scholar]
  40. Igawa, N.; Koga, Y.; Matsuzawa, T.; Nakamura, H. Models of sky radiance distribution and sky luminance distribution. Sol. Energy 2004, 77, 137–157. [Google Scholar] [CrossRef]
  41. Wang, L.; Gong, W.; Ma, Y.; Hu, B.; Wang, W.; Zhang, M. Analysis of ultraviolet radiation in Central China from observation and estimation. Energy 2013, 59, 764–774. [Google Scholar] [CrossRef]
  42. Ohmura, A.; Lang, H. Secular variation of global radiation in Europe. In Proceedings of the 1989 International Radiation Symposium, Lille, France, 18–24 August 1989; pp. 298–301.
  43. Liepert, B. Solar radiation in Germany: Observed trends and their causes. In Proceedings of the 1994 A & WMA International Specialty Conference on Climate Change, Phoenix, AZ, USA, 5–8 April 1994; Air and Waste Management Association: Pittsburgh, PA, USA, 1994. [Google Scholar]
  44. Ohmura, A. Observed decadal variations in surface solar radiation and their causes. J. Geophys. Res. 2009, 114, D00D05. [Google Scholar] [CrossRef]
  45. Overall, J.E. Applied Multivariate Analysis; McGraw-Hill: New York, NY, USA, 1972. [Google Scholar]
Figure 1. Spatial distribution of the global solar radiation network in Korea. An isoline contour at 50-m intervals represents the elevation.
Atmosphere 07 00055 g001
Figure 2. Temporal variations in monthly mean KT values averaged over all 21 sites. Data are shown for all sky (black circles), clear sky (red circles), and overcast sky (green circles).
Atmosphere 07 00055 g002
Figure 3. Temporal variations in monthly mean (a) CA; (b) RH; and (c) AOD, averaged over all 21 sites; (df) Same as (ac) but for the Jeju and Gosan sites.
Atmosphere 07 00055 g003
Figure 4. Spatial distributions of KT climatology in Korea: (a) annual; (b) January; and (c) July.
Atmosphere 07 00055 g004
Figure 5. Long-term trend in the deseasonalized KT anomaly for the (a) Daegu and (b) Mokpo sites.
Atmosphere 07 00055 g005
Table 1. Monthly climatology of KT under all-sky conditions at the 21 measurement sites.
SiteJanuaryFebruaryMarchAprilMayJuneJulyAugustSeptemberOctoberNovemberDecemberAnnual
Daegwallyeong0.560.560.520.490.480.430.360.370.400.500.500.530.48
Chuncheon0.490.510.490.470.480.460.360.410.450.490.450.460.46
Gangneung0.550.480.470.480.470.420.370.380.440.500.490.510.46
Seoul0.440.470.460.450.450.400.300.350.420.480.430.440.42
Incheon0.470.500.490.470.460.420.340.390.440.490.450.450.45
Wonju0.480.490.480.470.480.450.360.400.450.500.450.470.46
Suwon0.490.510.500.480.480.440.350.400.440.510.460.470.46
Seosan0.480.510.500.490.480.430.350.410.450.500.450.450.46
Cheongju0.470.480.490.480.480.430.350.400.440.490.440.440.45
Daejeon0.490.520.510.510.510.450.370.420.460.530.480.470.48
Chupungnyeong0.500.500.500.490.470.420.360.380.420.500.480.480.46
Pohang0.530.510.500.500.480.440.400.400.410.480.520.540.48
Daegu0.510.510.510.500.490.430.380.390.430.500.490.510.47
Jeonju0.450.460.480.480.470.420.350.390.440.500.450.430.44
Gwangju0.470.500.510.500.490.410.360.400.450.530.490.460.46
Busan0.540.520.500.500.480.430.400.430.440.500.520.530.48
Mokpo0.450.480.500.500.480.420.390.440.470.530.480.420.46
Heuksando0.390.460.520.520.490.430.370.460.490.540.470.390.46
Jeju0.290.380.450.490.480.420.450.450.440.480.400.300.42
Gosan0.330.440.490.510.490.410.440.490.500.530.430.330.45
Jinju0.530.520.520.500.480.410.380.410.450.540.520.540.48
AVERAGE0.470.490.490.490.480.430.370.410.440.510.470.460.46
Table 2. Long-term trends (Unit: %/decade, 15 years: 2000–2014) in KT, CA, RH, and AOD at sites in two regions, grouped by increasing and decreasing trends in KT. The analysis period at the site marked by an asterisk (*) was 7 years (2008–2014).
Increasing KT Trend (>+4.0%/Decade)
SiteKTCARHAOD
Seoul4.08−0.18−3.21−7.43
Daegwallyeong4.264.35−1.30−4.32
Jinju4.550.040.88−13.79
Daejeon5.57−1.224.03−9.10
Daegu8.300.94−3.83−13.79
Decreasing KT Trend (<−4.0%/Decade)
SiteKTCARHAOD
Cheongju−4.54−2.58−0.11−9.10
Seosan−6.25−6.205.35−13.41
Mokpo−6.763.5310.31−11.22
Gangneung *−10.498.82−7.87−4.32
Table 3. Partial correlation coefficients of CA, RH, and AOD with KT variations, and combined (R2) and individual contributions to variations in KT.
SiteR2Partial Correlation Coefficients (γ1n)Individual Contribution (%)
γ12 (CA)γ13 (RH)γ14 (AOD)CARHAOD
Daegwallyeong0.59−0.75−0.56−0.3147.19.02.8
Chuncheon0.57−0.71−0.48−0.4536.611.19.7
Gangneung0.64−0.80−0.55−0.3657.33.73.4
Seoul0.60−0.71−0.58−0.4136.416.56.8
Incheon0.47−0.66−0.43−0.3935.36.25.8
Wonju0.58−0.71−0.46−0.4339.310.18.2
Suwon0.54−0.69−0.50−0.3736.612.74.9
Seosan0.60−0.69−0.52−0.4335.115.88.6
Cheongju0.51−0.66−0.49−0.3631.713.36.4
Daejeon0.59−0.72−0.43−0.4241.59.28.6
Chupungnyeong0.59−0.73−0.48−0.3941.510.27.6
Pohang0.56−0.72−0.52−0.3942.37.66.0
Daegu0.53−0.67−0.52−0.4430.313.79.4
Jeonju0.59−0.71−0.48−0.3639.413.16.4
Gwangju0.59−0.71−0.53−0.3439.414.35.2
Busan0.55−0.72−0.45−0.4144.44.46.2
Mokpo0.54−0.69−0.41−0.3141.68.54.3
Heuksando0.61−0.76−0.28−0.3554.80.45.6
Jeju0.63−0.79−0.26−0.1963.3−1.00.7
Gosan0.55−0.73−0.13−0.2653.9−1.22.4
Jinju0.55−0.69−0.41−0.4936.96.512.1
Average0.57−0.72−0.45−0.3742.18.86.2

