Article

Exposure to Particle Matters and Hazardous Volatile Organic Compounds in Selected Hot Spring Hotels in Guangdong, China

1
School of Environment and Safety, Taiyuan University of Science and Technology, Taiyuan 030024, China
2
Guangdong Meteorological Observatory, Guangzhou 510080, China
3
State Key Laboratory of Organic Geochemistry, Guangzhou Institute of Geochemistry, Chinese Academy of Sciences, Guangzhou 510640, China
*
Author to whom correspondence should be addressed.
Atmosphere 2016, 7(4), 54; https://doi.org/10.3390/atmos7040054
Submission received: 17 February 2016 / Revised: 27 March 2016 / Accepted: 29 March 2016 / Published: 11 April 2016

Abstract

:
In Guangdong province, many hot springs were exploited and developed into popular places for tourist. In addition, hotels have been set up near hot spring sites to attract people, including local citizens, to spend their spare time inside these so-called “spring hotels”. In our study, indoor air quality was investigated in four hot spring hotels in Guangdong province, China. Measured indoor pollutants included CO2, CO, PM10, PM2.5 and Volatile Organic Compounds (VOCs). As the result show, high concentrations of carbon dioxide might be attributed to poor ventilation; and the variations of indoor PM10, PM2.5 concentrations were related to occupants’ activities. Alpha-pinene and toluene were the most common VOC species in the hot spring hotels other than monocyclic aromatic hydrocarbons like Benzene, Toluene, Ethylbenzene and Xylenes (BTEX), which were at medium levels among the reported indoor pollutants. High cancer risk of benzene in the newly decorated rooms should be seriously taken into consideration in the future. Indoor to Outdoor air concentration ratios (I/O) for CO2 and VOCs were higher than 1, indicating their strong indoor sources. Negative correlations were found between indoor CO2 and all the other compounds, and VOCs were shown to be significantly correlated (p < 0.01) to each other, including aromatic hydrocarbons and mono-terpenes. For indoor and outdoor air compounds, correlation coefficients among all compounds did not show a significant correlation, which indicated that these pollutants had different sources. Principal components analysis by SPSS showed that indoor materials, inhabitants’ activities and respiration, cleaning products and outdoor sources were the main sources of indoor detected pollutants in hot spring hotels.

Graphical Abstract

1. Introduction

Attention to Indoor Air Quality (IAQ) has not decreased in recent years. The detected levels of indoor air pollutants like some Volatile Organic Compound (VOC) species, CO2, and particulate matter often exceed outdoor levels by up to 5 times [1,2], and most individuals spend most of their time in indoor environments [3]. Pollutants in indoor microenvironments easily accumulate due to various emissions and poor ventilation [4,5,6], and thus cause adverse health effects, like some chronic diseases of sensory irritation, asthma, rhinitis and even some cancers such as leukemia [2,7]. Statistics from 2008 showed that 36% of lower respiratory diseases and 22% of chronic obstructivepulmonary disease were caused by indoor air pollution [8].
Previous studies focused on the pollutant levels and their sources in living, working and public environments like houses, offices and shopping malls. Except for outdoor air travelling inside, the most common source of indoor pollutants, like CO, CO2, PM and VOCs, include building materials (e.g., floor and wall coverings, carpet), combustion processes (e.g., smoking, cooking, home heating), consumer products (e.g., cleaners, air fresheners, mothballs), human activity (e.g., moving, and house work) and some other sources [1,9,10,11,12]. Benzene, toluene, ethyl-benzene, xylene (BTEX), as the main compounds of VOCs in indoor air with a concentration range from 1 to several hundredµg·m−3, are usually emitted from building materials and furniture, or are usually used as solvents during wood processing, printing and other daily usage [2,12,13,14,15]. Since BTEX are one typical kind of harmful VOCs, the health risks and source analysis of BTEX in indoor air have attracted extensive attention [3,15]. Mono-terpenes, highly reactive kinds of VOCs, could result in secondary pollution in indoor microenvironments, and originate mainly from cleaning products, personal hygiene articles and building sources [13,16].
There is abundant hot spring resources around the world, and many of them have been exploited and developed into popular places for recreation and therapeutic uses for rheumatism and other ailments. In addition, hotels have been set up near hot spring sites to attract people, including local citizens, to spend their spare time inside these so-called “spring hotels”. VOCs and other pollutants except radon in spring hotels have not been reported in China and other countries [17]. In China, Guangdong province, especially the Pearl River Delta (PRD) region, is an important economic zone; poor air quality accompanying rapid urbanization and industrialization may pose serious health risks. High levels of particulate matters, VOCs, ozone and other pollutants in urban air and indoor microenvironments like residential buildings and shopping malls have been reported in PRD including Guangzhou, Hong Kong and Macao [18,19,20,21]. In this study, four spring hotels were selected in rural sites and their CO, CO2, PM2.5, PM10 and VOCs levels and sources were studied based on simultaneous indoor/outdoor sampling.

2. Sampling and Analytic Methods

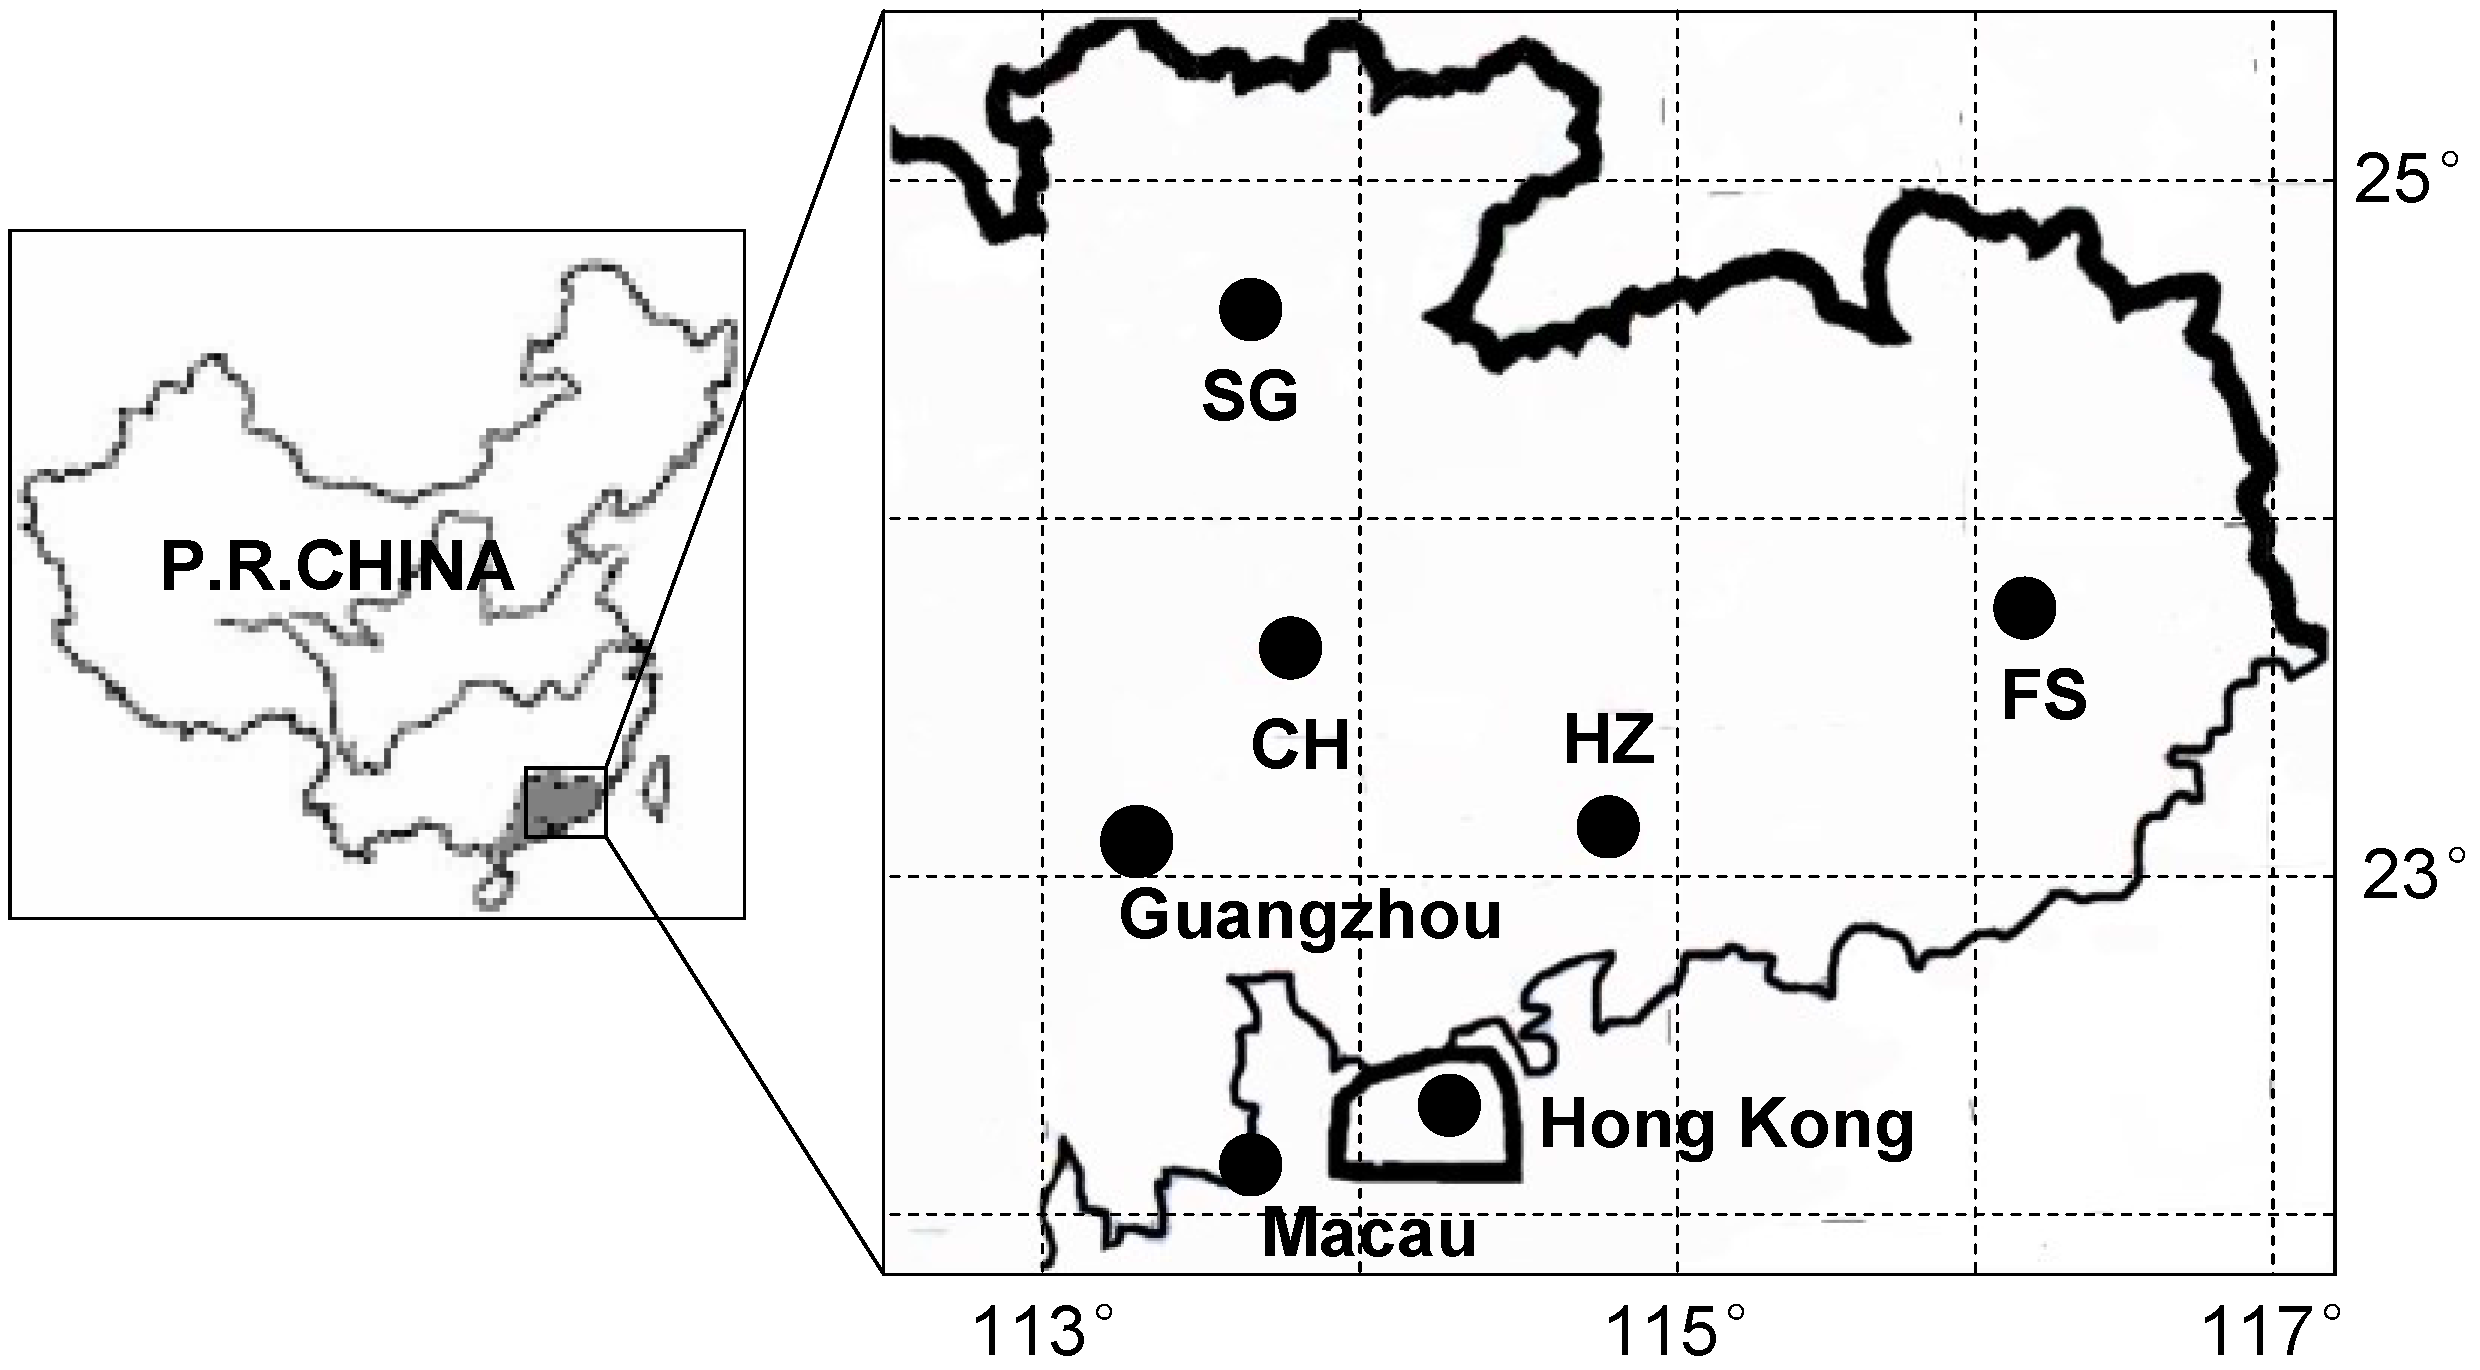
2.1. Site Description

Four typical hot spring hotels in Guangdong province were selected for air sampling, and their locations are shown in Figure 1. Three of the spring hotels are buildings with three floors located in a rural area, including CH (on the edge of a forest), HZ (in a spacious valley) and SG (1000 m away from a county). FS has 6 floors and is located in the center of a county which has a population of more than 140,000. Two rooms on different floors in each hotel were selected for sampling, and the age of which exceeded 5 years. The layout of the hotel rooms was previously described [17]. Table 1 depicts the location of the hot spring hotels and indoor and outdoor air parameters in the sampling rooms. During the sampling periods, the room was occupied by one or two people and their activities were documented in detail. They were free to go outside and open windows in the hotel rooms, just like tourists.

2.2. Field Sampling

Air sampling in this study occurred from July to September 2013 (two samplings in all hotels during this period). The compounds included CO, CO2, PM2.5, PM10, and VOCs, and the field sampling was conducted simultaneously inside and outside of the hot spring hotels for 1.5 h in a 3-h period from 12:00 a.m. Eight samples were collected per day per room, over a period of 3 consecutive days. Indoor air samples were collected at a height of 1.5m in the center of the room. Identical methods were used for outdoor air sampling, i.e., 1.5 m above the ground or1.5 m above the floor of the corresponding veranda. VOCs were collected using “7×1/4” Tekmar stainless-steel multi-sorbent tubes. A portable sampling pump (Air-Check-52, SKC Inc., Eighty Four, Pennsylvania, USA) drew an air sample through the tubes, and the flow was set to 100 mL/min and in the sampling periods, a portable digital flow meter (DC-LITE, BIOS, Butler, New Jersey, USA) monitored and recorded the flow (<5.0%). While sampling VOCs, PM10 and CO, CO2 was simultaneously measured directly by portable analyzers. CO2 and CO concentrations were monitored by two portable Q-Trak monitors (Model 8551, TSI Inc. Shoreview, Minnesota, USA), and PM2.5 and PM10 by two Dust-Trak air monitors (Model 8520, TSI Inc. Shoreview, Minnesota, USA). Before sampling, the Q-Trak was calibrated with a known concentration of CO2 gas and the Dust-Trak air monitors were operated based on pre- and post-zero checking. These portable analyzers took a reading every 15 s, and data were recorded and retrieved on a personal computer using TSI TrakPro software. Measurements of PM10 and CO during each sampling of VOCs were averaged as the corresponding exposure levels.

2.3. VOC Analysis

According to the EPA method To-17, VOCs were analyzed by a thermal desorption system coupled to a HP 6890 gas chromatograph/5973 mass selective detector. Firstly, the sampling tubes were thermally desorbed for 20 min at 225 °C with a flow (40 mL·min−1) of helium (99.999%) passing through and carrying the desorbed VOCs to a pre-concentration trap at 40°C. Following the tube desorption, the trap was thermally desorbed at 225 °C for 4 min, and finally VOCs were transferred to GC/MSD for determination. An HP-VOC capillary column (60 m × 0.32 mm, id × 1.8 mm) was used with helium as the carrier gas and an initial oven temperature of 35 °C for 2 min, increased at a rate of 5 °C·min−1 to 230 °C for 10 min. The major MSD conditions included ionization by EI, data acquisition mode of SCAN and a mass range of 35–300 amu, manual tuning using perfluorotributylamine, and m/z of 69, 219, 502. Compounds were identified by their retention times and their mass spectra. Standard gas mixtures (1.0 ppm) were first dynamically diluted with zero air, then sampled and analyzed using identical conditions to those for the field samples. Then, 7-point calibration (0.0, 1.0, 5.0, 10.0, 20.0, 40.0, 50.0 ppbv) was performed for quantifying the VOCs in the air samples. The correlation coefficient for all calibration plots exceeded 0.99, the Relative Standard Deviation (RSD) of the target VOCs was less than 15%, and the Limits Of Detection (LOD) were <0.20 µg·m−3.

3. Results and Discussion

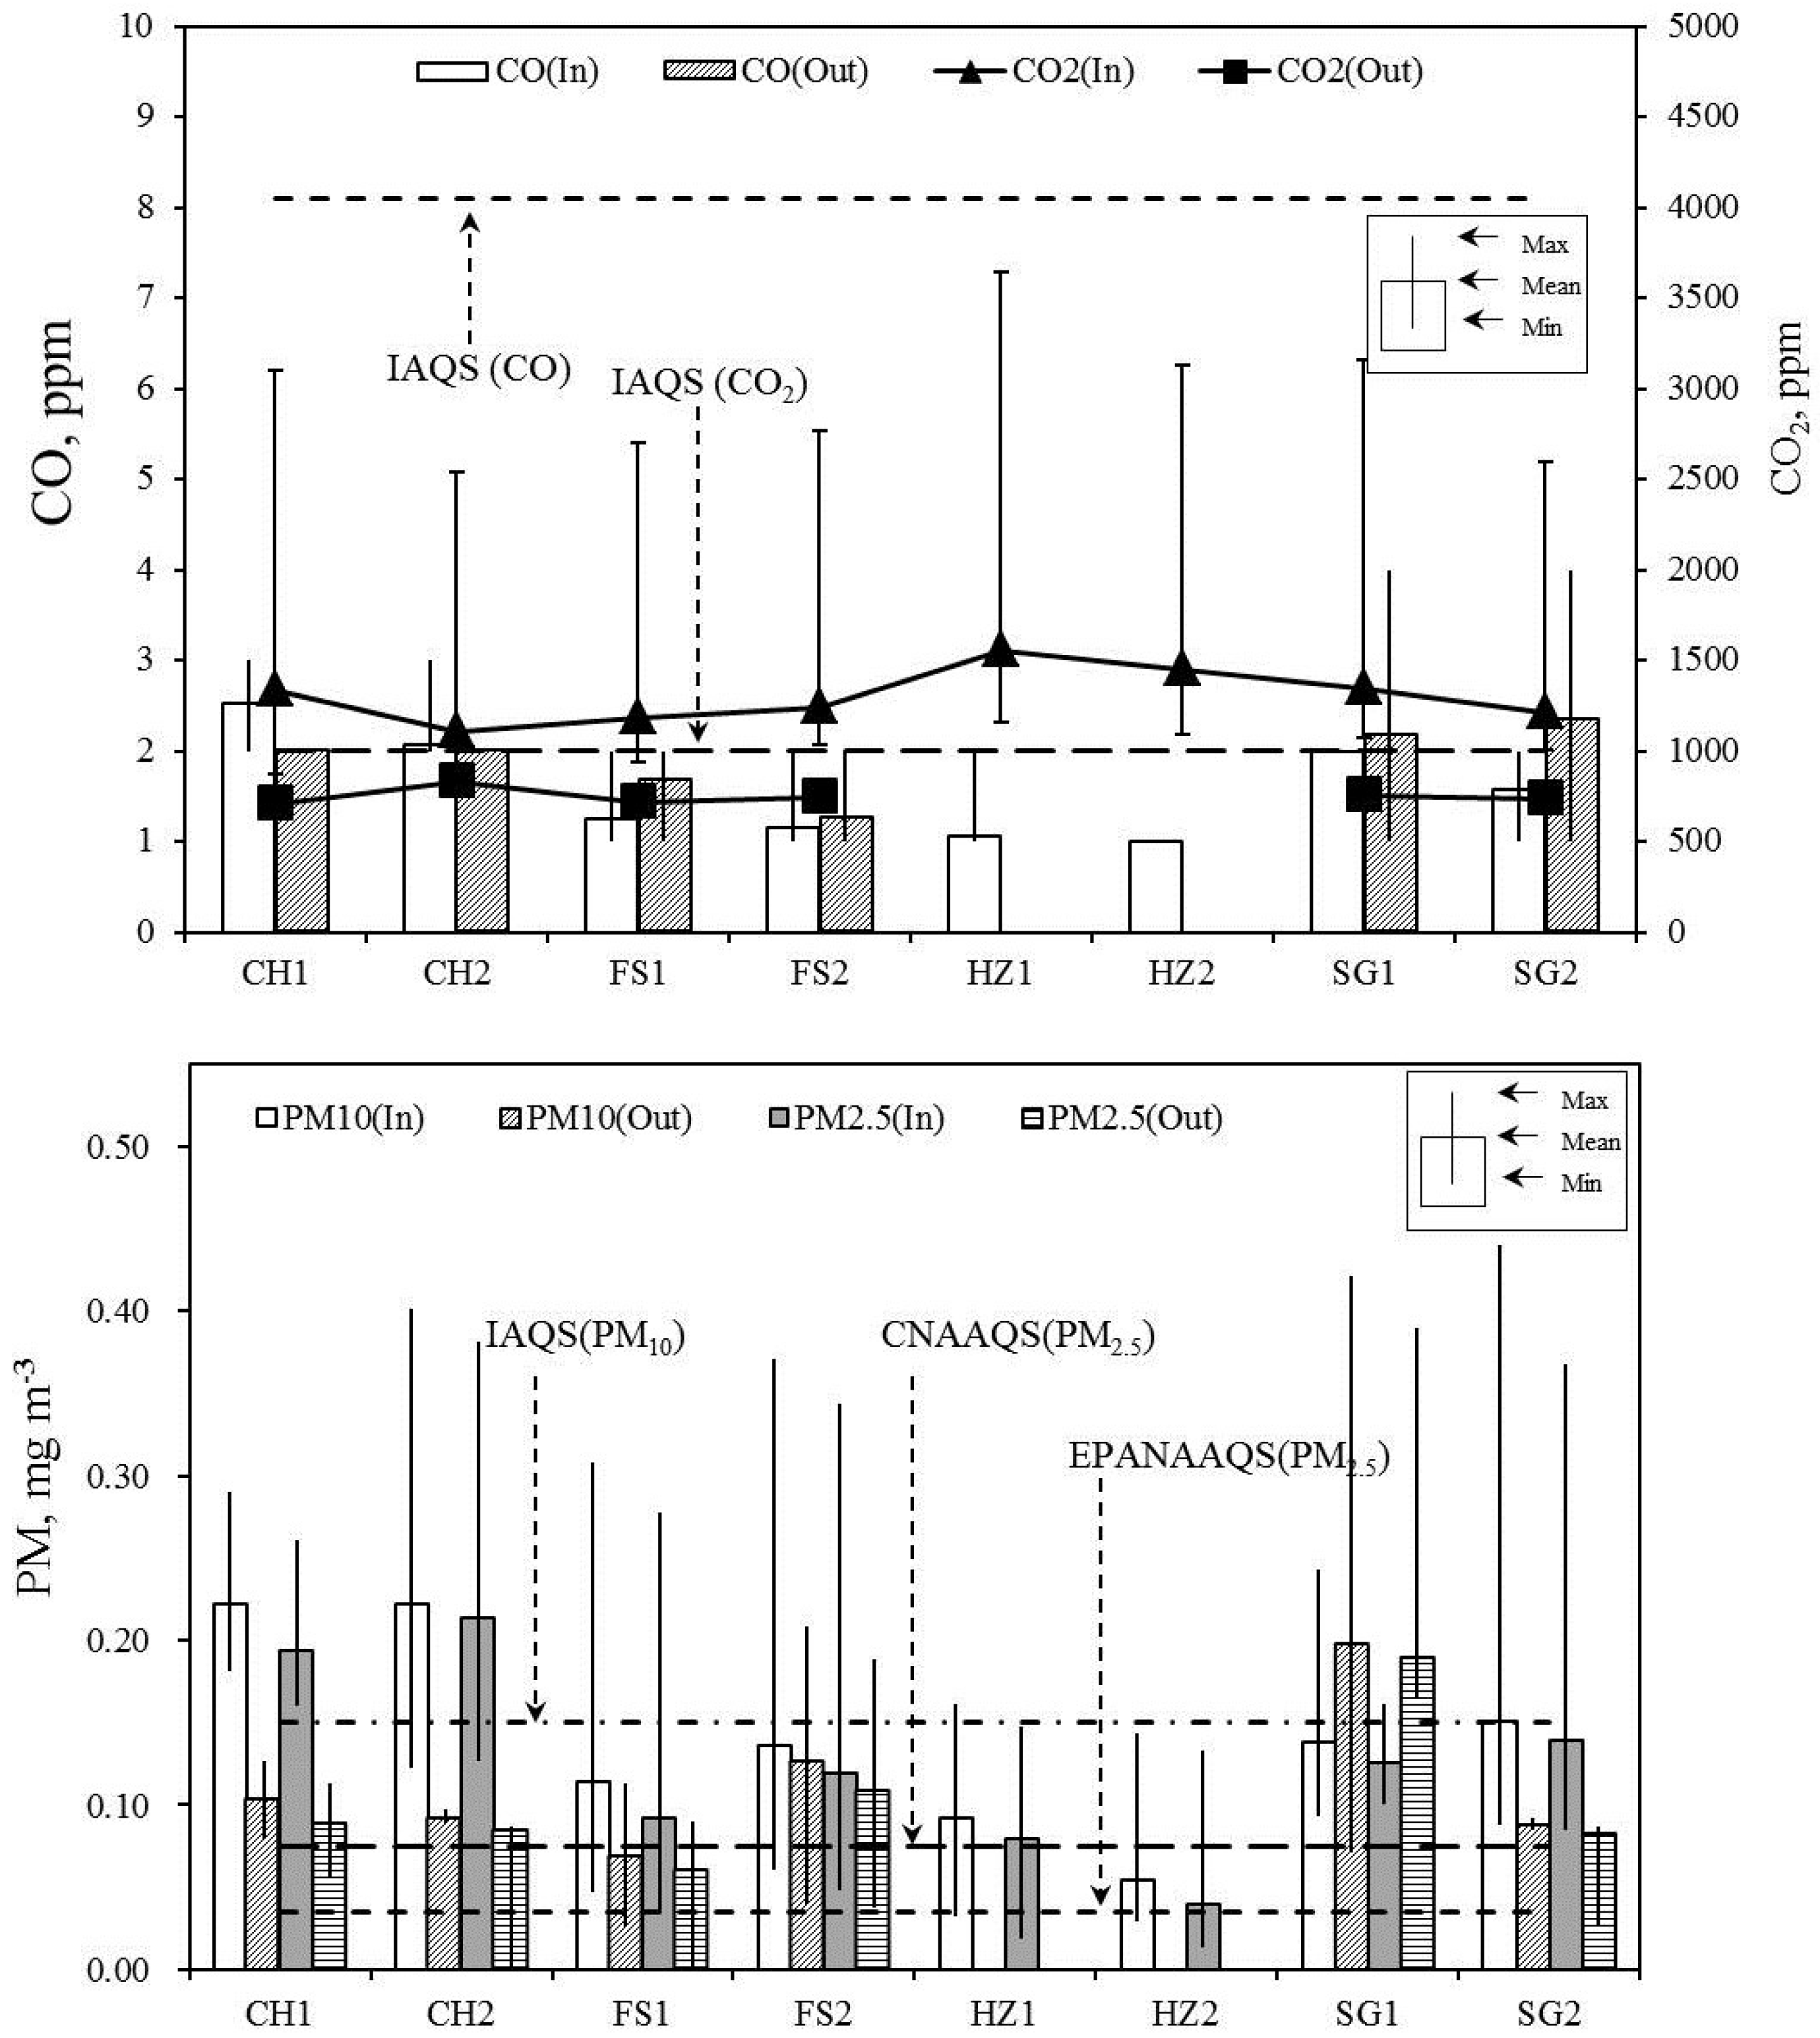
3.1. CO, CO2, PM2.5 and PM10

Figure 2 shows the indoor and outdoor arithmetic mean concentrations of CO, CO2, PM2.5 and PM10 in four spring hotels. CO concentrations, which ranged from 1.0–4.0 ppm in both indoor and outdoor air, were significantly lower than the 1-h period limitation of 8.11 ppm (10 mg·m−3), i.e., the Chinese indoor air quality standard (IAQS) [22], which might be related to non-smoking in the room and no strong CO emission sources outside of the hotels. The mean CO2 concentrations were much higher in indoor than outdoor air and the daily limitation of 1000 ppm based on IAQS. The mean concentration of CO2 (1319 ppm) was higher in the spring hotels than some indoor microenvironments, like schools (502 ppm [4]; 1216 ppm [23]). The concentration of CO2 was more strongly related to the respiration of the people inside the rooms rather than the intrusion of CO2 from outdoor air. Previous studies showed that indoor CO2 concentrations were similar to and higher than the American Society of Heating and Refrigerating and Air-conditioning Engineers (ASHRAE) Standard of 1000 ppm [24], depending on both internal sources and external background concentration, coupled with low air exchange rate [4,5]. The CO2 concentration is widely used as an indicator of indoor ventilation effectiveness, and high CO2 values in the spring hotels indicated insufficient ventilation [6]. During the sampling time, when the windows were closed due to high air temperatures, the air conditioner could only cool the air and did not introduce fresh air into the room. The indoor CO2 concentration was initially constant despite frequent opening of the door when the occupants entered the room, followed by a steady increase from sleeping to wakening and then a decrease after the occupants got up or left the room. This trend indicated that the excessive CO2 was mainly from occupants’ breath and the ventilation was the key factor maintaining the indoor and outdoor CO2 concentration balance.
For indoor PM10, more than 86.81% (72.64%–96.20%) was fine particles (PM2.5) in all studied rooms, though their mean levels were less than the limit of 0.15 mg·m−3 based on the China indoor air quality standard (IAQS) except in CH and SG [22]. In the rooms in the four hotels, the indoor PM2.5 concentrations ranged from 0.014 to 0.440 mg·m−3 and the mean concentrations were significantly higher than the24-h period limitation value stated in the National Ambient Air Quality Standard issued by the Environmental Protection Agency [25]. Except in SG2, the levels of PM10 and PM2.5 in the rooms were higher than outside, which meant there might be a major PM source in the hotel room microenvironment. Compared with previous results (Table 2), the mean levels of indoor PM10 (0.135 mg·m−3) in spring hotels was higher than that in schoolrooms, residential rooms, office buildings, care centers and station waiting rooms [4,9,26,27,28]. The PM2.5 mean concentrations (0.121 mg·m−3) in spring hotels were higher than in residential rooms, station waiting rooms, offices, supermarkets and classrooms, but lower than commercial offices [4,10,27,29,30]. Mean concentrations of PM10 and PM2.5 outside spring hotels were lower than those reported in urban area of the PRD like Hong Kong and Guangzhou because they were in rural areas and there was a low density of human activities nearby [18,19]. Indoor PM increased rapidly when occupants entered the room, slept and got up, then fell slowly after sleeping until they arose the next day. This was strongly related to the activities and movement of the occupants, which led to re-suspension of previously deposited particles or their delayed deposition or settling [31].

3.2. VOCLevels

VOCS detected in all samples were mainly composed of monocyclic aromatic hydrocarbons and mono-terpenes like alpha-pinene, beta-pinene and 1-limonene. Table 3 lists the statistical result of each VOC in indoor and outdoor air of spring hotels. Alpha-pinene, toluene, ethyl-benzene, and o-xylene were the most abundant species in indoor air. BTEX, including benzene, toluene, ethyl-benzene, m,p-xylene, and o-xylene, occupied 56% of the total VOC concentration of 210.41 µg·m−3. Compared with BTEX, other aromatic hydrocarbons like styrene, 1,3,5-trimethyl-benzene and 1,2,4-trimethyl-benzene were lower.
A comparison of indoor BTEX concentrations among various cities around the world is shown in Table 4. BTEX pollutions in spring hotels were at the middle level among the reported sites, higher than offices and primary schools, and lower than a photocopy shop, drugstore, schoolroom, hospital, hotel and hotel guest rooms [1,2,3,12,15,32,33]. The difference in pollutants levels between hot spring hotel rooms and previously reported rooms was due to the decoration and furniture materials used in the room, and high toluene levels were found in Hotel 1 in southern China due to the usage of poor quality carpet fitted in the room [12,15,33]. In general, BTEX could be found in new and refurbished buildings during the decoration because some BTEX were commonly used as solvents for carpet adhesive [2,12,14]. High concentrations of BTEX could be attributed to the usage of plywood furniture, wardrobes and carpets fitted in the hotel rooms [12]. Otherwise, BTEX could also invade rooms from outdoor emission sources such as vehicles and ETS in such microenvironments. Heavily trafficked roadside microenvironments and service stations might be considered as the representative worst case for air pollution. In the corresponding outdoor air, BTEX concentrations were slightly less than those of the indoor air, and much lower than those of urban air like Guangzhou, Hong Kong [20,21]. This might be related to the situations that these hotels were in rural areas and there were no strong emission sources other than a few traffic vehicles.
Mono-terpenes, in particular d-limonene in indoor air, might be related to the commonly used household cleaning products and personal hygiene articles, while alpha-pinene has been suggested to be mainly emitted by building sources such as building materials, decorations and surface coatings [13,16]. Alpha-pinene and d-limonene were the main components of mono-terpenes in the indoor air of spring hotels, and were much greater in FS and SG than CH and HZ, with mean concentrations of 70.0 and 137.0 μg·m−3, and 29.9 and 1.2 μg·m−3, respectively, which might because the rooms were newly decorated and refurbished in FS and SG. High limonene levels meant that the application of cleaning agents could elevate the VOC concentrations in the hotels [12]. High indoor levels of alpha-pinene and 1-limonene could also be found in some previous studies, like restaurants and supermarkets [13,34]. The diurnal variation of alpha-pinene and 1-limonene showed a constant increase at night and after cleaning, and a decrease in the day because of the usage of human cleaning products. Monoterpenes are highly reactive and easily undergo free-radical addition with O3 or degrade by photochemical reactions, yielding low volatility compounds that readily form organic secondary aerosols [35]. Furthermore, these reactions deteriorate indoor air quality and more attention should be paid to the high mono-terpenes concentrations in the spring hotels.

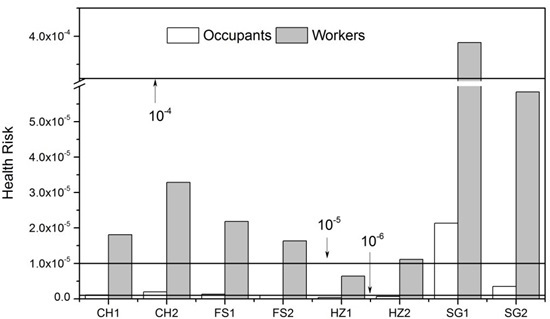
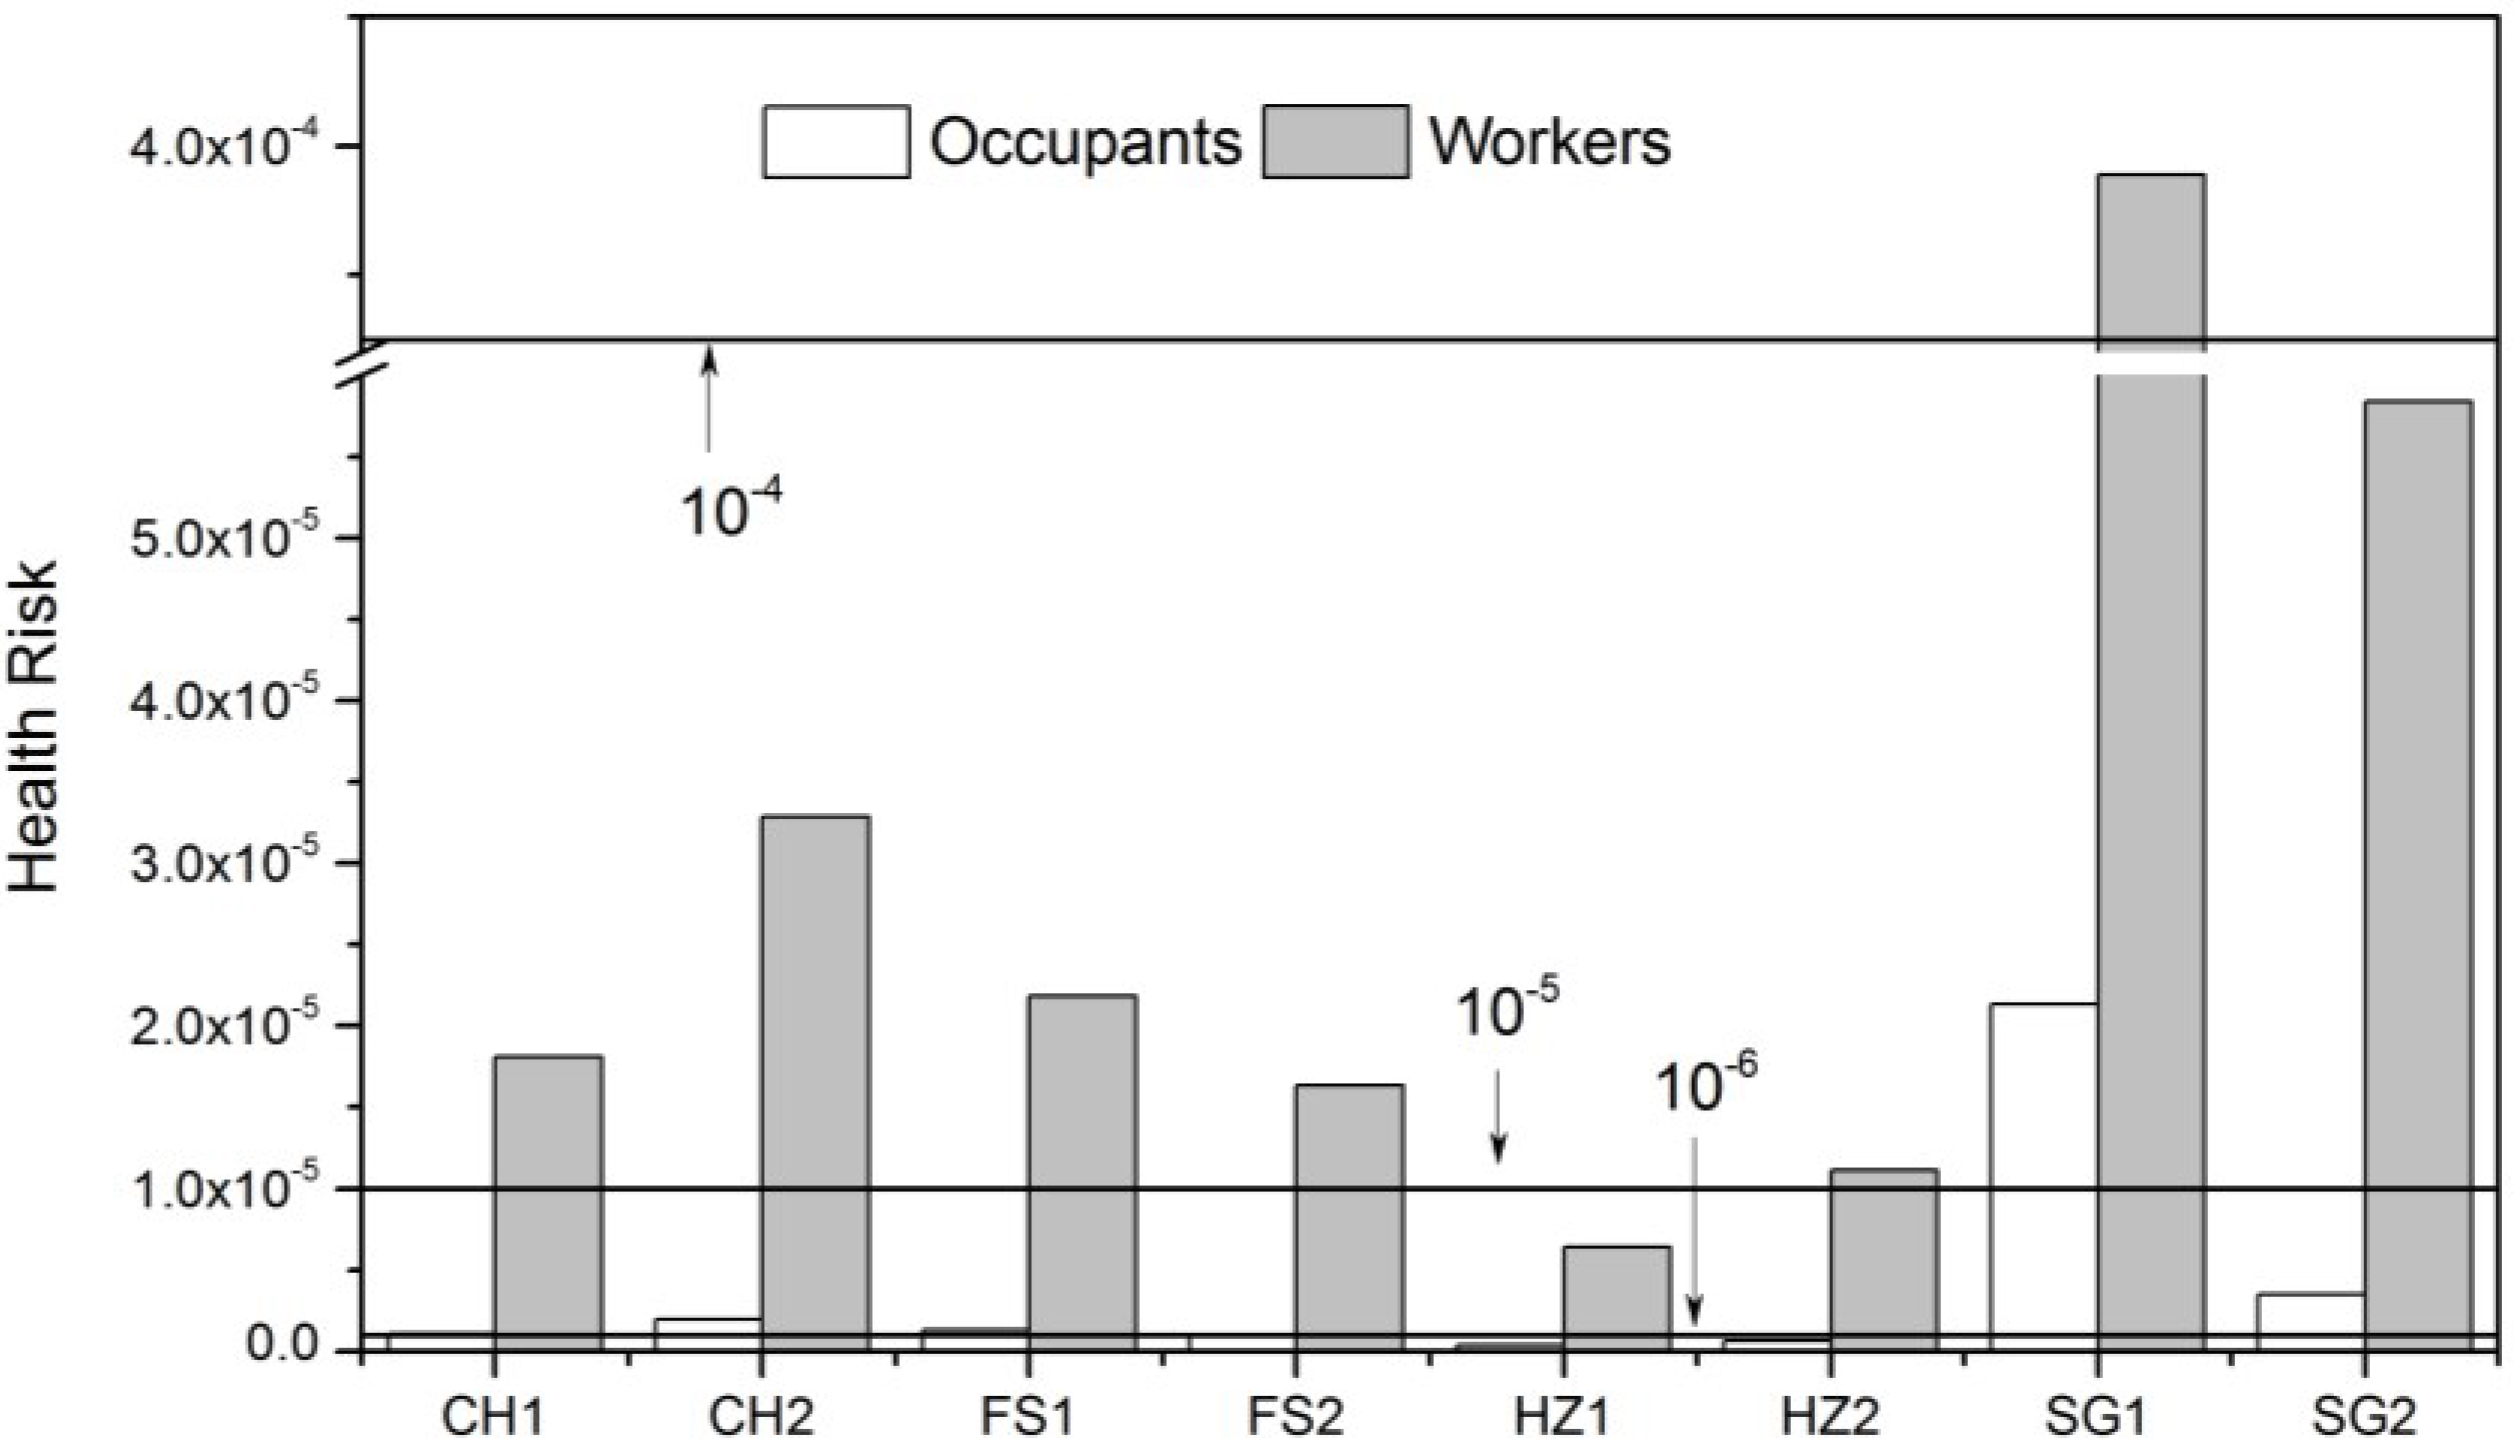
3.3. Health Risk Assessment

Risk assessment is a world-wide accepted procedure to quantify the potential carcinogen risk (for benzene) [3].The cancer risks were calculated using Equations (1) and (2) based on the exposure to benzene from inhalation [3,36].
Cancer risk = LADD × SF
LADD = (C × InhR × IAF × ET × LRF × EF × ED)/(LT × BW × 365 (day per year))
where LADD and SF represent the lifetime average dose (mg/kg/day) and the slope factor (benzene, 0.1 kg·day·mg−1, [37]), respectively; C is the benzene concentrations in inhalation (mg·m−3); InhR is the inhalation rate (0.83 m3·h−1); IAF is the inhalation intake adjustment factor (1 in this study); ET is the average exposure time, 12 h·day−1 for occupants and 8 h·day−1 for workers; LRF is the lung retention factor (1 in this study); EF and ED are the average exposure frequencies (10 day·year−1 for occupants and 250 day·year−1 for workers) and working exposure duration (35 year), respectively; LT and BW are the lifetime (72 year) and the body weight (70 kg), respectively. Some parameters used above were obtained from previous studies [3,15].
In general, compounds with an attributable cancer risk of >10−4 were labeled as “definite risk”, between 10−5 and 10−4 as “probable risk”, and between 10−5 and 10−6 as “possible risk”. In this study, the LCRs of most compounds were less than 10−6, suggesting exposure safety at the current levels [38]. The results (Figure 3) showed that cancer risk values of benzene at SG2 for occupants and HZ1 for workers ranged between than 10−5 and 10−6, indicating a possible risk for all, while at SG1 for occupants, and CH1, CH2, FS1, FS2, HZ2 and SG2 for workers, the values ranged between 10−5 and 10−4, suggesting probable risk. There is concern that the cancer risk of benzene at SG1 for workers was higher than 10−4, meaning a definite risk during contact with the microenvironment. A high cancer risk of benzene at SG1, resulting from newly decorated rooms, was not negligible and should seriously be taken into consideration in the future.

3.4. Characteristics of Indoor Air Compounds

The Indoor to Outdoor air concentration ratio (I/O) is an indicator of indoor air quality, and I/O is bigger than 1 when the indoor pollutants is mainly from indoor sources, otherwise I/O is smaller than 1 [11]. As the result shows, I/O ratios for CO2 and VOCs (except benzene) were higher than 1, while smaller than 1 for CO, but close to 1 for PM (PM10 and PM2.5) and benzene. This suggested indoor CO2 and VOC sources and impacts of outdoor infiltration for CO, benzene and PM. For BTEX, their I/O ratios were close to 1 except in FS3 (newly decorated) and SG rooms. I/O ratios for alpha-pinene and limonene were higher than 1, indicating their strong indoor sources. These characteristics revealed that there were strong CO2 and VOC (except benzene) emission sources in the indoor environment; while CO, particulate matter and benzene were controlled by the outdoor air.
Pollutants displayed significant correlations between indoor and outdoor levels such that a source relationship was implied. Table 5 lists the correlation coefficients for each compound between the indoor and outdoor compounds in four spring hotels. CO and particulate matter were significantly correlated (r > 0.6) at the 0.01 level. For all VOCs, indoor concentrations were shown to be significantly correlated (p < 0.01), including aromatic hydrocarbons and mono-terpenes. Distinctively, indoor CO2 was negatively correlated with all other compounds, and particulate matter and VOCs were less correlated. These results revealed that CO2 had an obvious indoor emission source different from aromatic hydrocarbons and mono-terpenes. For indoor and outdoor air compounds, correlation coefficients among all compounds did not show a significant correlation, which indicated that these pollutants had different sources in the indoor and outdoor air.
According to the compositions and relationships between VOCs, indoor VOCs in the spring hotels rooms could be strongly determined by the indoor emission strength, outdoor concentrations and human activities. Principal Component Analysis (PCA) was used to identify the possible sources of indoor pollutants. The analysis was performed using the combined datasets of VOC concentrations in the rooms in each hotel. Results with loadings > 0.5 were considered to be statistically significant. Five components were extracted in applying PCA (Table 6). The high loadings for some VOCs, i.e., to have more than one factor, indicate that there was more than one source for those chemicals. The five factors identified in spring hotels explained 87.26% of the total variance. The first factor, which was highly associated with the aromatic hydrocarbons (except styrene), might be related to building source, including building material, insulation, decoration, surface coatings, furniture and other sources [12]. Factor 2 was associated with benzene, toluene, styrene, 1,3,5-TMB, and beta-pinene, which could be considered as outdoor sources, such as traffic emission and biogenic emission [11]. The third factor was highly associated with CO, PM10 and PM2.5, which could be suggested as the source of human activities. The fourth factor correlated with cleaning products pollutants such as limonene [13]. Finally, the last factor was only associated with CO2, which indicated that the last source should be human respiration.

4. Conclusions and Implications

Exposure to particle matters and hazardous volatile organic compounds was conducted by field sampling in selected hot spring hotels in Guangdong, China. High carbon dioxide concentrations might be attributed to poor ventilation, and the variations in indoor PM10, PM2.5 concentrations were related to occupants’ activities. Alpha-pinene, toluene, ethyl-benzene, and o-xylene were the most abundant species in indoor air. BTEX pollutions in spring hotels were at a medium level among the reported indoor sites. Alpha-pinene and d-limonene were the main indoor components of mono-terpenes; the diurnal variation showed a consistent increase at night and after cleaning and a decrease in the day. The high cancer risk of benzene for workers in spring hotels, especially in newly decorated rooms, was not negligible and should be seriously considered in the future. I/O ratios for CO2 and VOCs (except benzene) were higher than 1, while for CO were smaller than 1, and for PM (PM10 and PM2.5) and benzene were close to 1, which revealed indoor CO2 and VOC sources, and impacts of outdoor infiltration for CO, benzene and PM. CO and particulate matter were significantly correlated, while indoor VOC concentrations were shown to be significantly correlated, and indoor CO2 was negatively correlated with all other compounds. Principal Component Analysis (PCA) showed that building materials, outdoor sources, human activities, cleaning products and human respiration were the main sources of detected pollutants in spring hotels rooms. Further, the weather conditions like air temperature, humidity, wind speed, solar radiation may impact the indoor air quality and should be discussed in a subsequent study.

Acknowledgments

The work was supported by the National Natural Science Foundation of China (No. 41472311, 41172316), China Special Fund for Meteorological Research in the Public Interest (GYHY201406031) and the Key projects of Ministry of Education of the People’s Republic of China (201126). We gratefully acknowledge the partial support from the One-hundred talent program supported by The Organization Department of Shanxi Province Committee.

Author Contributions

Qiusheng He and Xinming Wang designed the research theme and finished the manuscript. Qi Song and Yulong Yan synthesized the data, and wrote parts of the manuscript. Zhichun Wang and Lili Guo collected and analyzed the air samples.

Conflicts of Interest

The authors declare no conflict of interest.

References

  1. Almeida-Silva, M.; Faria, T.; Saraga, D.; Maggos, T.; Wolterbeek, H.T.; Almeida, S.M.; Bari, M.A.; Kindzierski, W.B.; Wheeler, A.J.; Heroux, M.E.; et al. Source apportionment of indoor and outdoor volatile organic compounds at homes in Edmonton, Canada. Build. Environ. 2015, 90, 114–124. [Google Scholar]
  2. Madureira, J.; Paciência, I.; Rufo, J.; Severo, M.; Ramos, E.; Barros, H.; de Oliveira Fernandes, E. Source apportionment of CO2, PM10 and VOCs levels and health risk assessment in naturally ventilated primary schools in Porto, Portugal. Build. Environ. 2016, 96, 198–205. [Google Scholar] [CrossRef]
  3. Kumar, A.; Singh, B.P.; Punia, M.; Singh, D.; Kumar, K.; Jain, V.K. Assessment of indoor air concentrations of vocs and their associated health risks in the library of Jawaharlal Nehru University, New Delhi. Environ. Sci. Pollut. Res. Int. 2014, 21, 2240–2248. [Google Scholar] [CrossRef] [PubMed]
  4. Razali, N.Y.Y.; Latif, M.T.; Dominick, D.; Mohamad, N.; Sulaiman, F.R.; Srithawirat, T. Concentration of particulate matter, CO and CO2 in selected schools in Malaysia. Build. Environ. 2015, 87, 108–116. [Google Scholar] [CrossRef]
  5. Persily, A. Challenges in developing ventilation and indoor air quality standards: The story of ashrae standard 62. Build. Environ. 2015, 91, 61–69. [Google Scholar] [CrossRef]
  6. Mahyuddin, N.; Awbi, H.B. A review of CO2 measurement procedures in ventilation research. Int. J. Vent. 2012, 10, 353–370. [Google Scholar]
  7. World Health Organization (WHO). Health and Environment in Europe: Progress Assessment; Report No.: EUR/55934/BD/1; WHO Regional Office for Europe: Copenhagen, Denmark, 2010. [Google Scholar]
  8. Merrill, M. Environmental Epidemiology: Principles and Methods; Jones & Bartlett Publishers: Burlington, MA, USA, 2008. [Google Scholar]
  9. Xu, J.; Bai, Z.P.; You, Y.; Zhou, J.; Zhang, J.F.; Niu, C.; Liu, Y.T.; Zhang, N.; He, F.; Ding, X. Residential indoor and personal PM10 exposures of ambient origin based on chemical components. J. Expo. Sci. Environ. Epidemiol. 2014, 24, 428–436. [Google Scholar] [CrossRef] [PubMed]
  10. Dong, C.; Yang, L.X.; Yan, C.; Yuan, Q.; Yu, Y.C.; Wang, W.X. Particle size distributions, PM2.5 concentrations and water-soluble inorganic ions in different public indoor environments: A case study in Jinan, China. Front. Environ. Sci. Eng. 2013, 7, 55–65. [Google Scholar] [CrossRef]
  11. Ohura, T.; Amagai, T.; Shen, X.Y.; Li, S.A.; Zhang, P.; Zhu, L.Z. Comparative study on indoor air quality in Japan and China: Characteristics of residential indoor and outdoor VOCs. Atmos. Environ. 2009, 43, 6352–6359. [Google Scholar] [CrossRef]
  12. Chan, C.S.; Lee, S.C.; Chan, W.C.; Ho, K.F.; Tian, L.W.; Lai, S.C.; Li, Y.S.; Huang, Y. Characterization of volatile organic compounds at hotels in southern China. Indoor Built. Environ. 2011, 20, 420–429. [Google Scholar] [CrossRef]
  13. Bruno, P.; Caselli, M.; de Gennaro, G.; Iacobellis, S.; Tutino, M. Monitoring of volatile organic compounds in non-residential indoor environments. Indoor Air 2008, 18, 250–256. [Google Scholar] [CrossRef] [PubMed]
  14. Amodio, M.; Dambruoso, P.R.; de Gennaro, G.; de Gennaro, L.; Loiotile, A.D.; Marzocca, A.; Stasi, F.; Trizio, L.; Tutino, M. Indoor Air Quality (IAQ) assessment in a multistorey shopping mall by high-spatial-resolution monitoring of Volatile Organic Compounds (VOC). Environ. Sci. Pollut. Res. 2014, 21, 13186–13195. [Google Scholar] [CrossRef] [PubMed]
  15. Peng, Y.; Zhang, Y.; Wang, X.; Chen, D.; Cao, X. Sources and health risk assessment of aromatic hydrocarbons in the indoor of Guangzhou hotels. China Environ. Sci. 2012, 32, 787–794. (In Chinese) [Google Scholar]
  16. Mickael, D.; Bruno, B.; Valerie, C.; Murielle, L.; Cecile, P.; Jacques, R.; Severine, K. Indoor air quality and comfort in seven newly built, energy-efficient houses in France. Build. Environ. 2014, 72, 173–187. [Google Scholar]
  17. Song, G.; Wang, X.; Zhang, B.; He, Q. Studies on PM10, PM2.5, CO2 and 222Rn in the hot spring hotel rooms. China Environ. Sci. 2004, 24, 650–653. (In Chinese) [Google Scholar]
  18. Chang, S.Y.; Chou, C.C.K.; Liu, S.; Zhang, Y.H. The characteristics of PM2.5 and its chemical compositions between different prevailing wind patterns in Guangzhou. Aerosol Air Qual. Res. 2013, 13, 1373–1383. [Google Scholar] [CrossRef]
  19. Wang, Y.; Li, J.; Cheng, X.; Lun, X.X.; Sun, D.Z.; Wang, X.Z. Estimation of PM10 in the traffic-related atmosphere for three road types in Beijing and Guangzhou, China. J. Environ. Sci. China 2014, 26, 197–204. [Google Scholar] [CrossRef]
  20. Zou, Y.; Deng, X.J.; Zhu, D.; Gong, D.C.; Wang, H.; Li, F.; Tan, H.B.; Deng, T.; Mai, B.R.; Liu, X.T.; et al. Characteristics of 1 year of observational data of VOCs, NOx and O-3 at a suburban site in Guangzhou, China. Atmos. Chem. Phys. 2015, 15, 6625–6636. [Google Scholar] [CrossRef]
  21. Ou, J.M.; Guo, H.; Zheng, J.Y.; Cheung, K.; Louie, P.K.K.; Ling, Z.H.; Wang, D.W. Concentrations and sources of non-methane hydrocarbons (NMHCs) from 2005 to 2013 in Hong Kong: A multi-year real-time data analysis. Atmos. Environ. 2015, 103, 196–206. [Google Scholar] [CrossRef]
  22. Ministry of Environmental Protection (MEP). Chinese Indoor Air Quality Standard (GB/T 18883–2002); Standards Press of China: Beijing, China, 2002. (In Chinese)
  23. Tran, D.T.; Alleman, L.Y.; Coddeville, P.; Galloo, J.C. Indoor-outdoor behavior and sources of size-resolved airborne particles in French classrooms. Build. Environ. 2014, 81, 183–191. [Google Scholar] [CrossRef]
  24. American Society of Heating and Refrigerating and Air-conditioning Engineers (ASHRAE). ASHRAE Standards 62–1999, Ventilation for Acceptable Indoor Air Quality. Available online: https://www.ashrae.org/ (accessed on 1 January 2016).
  25. US Environmental Protection Agency (USEPA). Environmental Protection Agency National Ambient Air Quality Standard; USEPA: Washington, DC, USA, 2007. [Google Scholar]
  26. Almeida-Silva, M.; Faria, T.; Saraga, D.; Maggos, T.; Wolterbeek, H.T.; Almeida, S.M. Source apportionment of indoor PM10 in Elderly Care Centre. Environ. Sci. Pollut. Res. 2016. [Google Scholar] [CrossRef] [PubMed]
  27. Cheng, Y.H.; Chang, H.P.; Yan, J.W. Temporal variations in airborne particulate matter levels at an indoor bus terminal and exposure implications for terminal workers. Aerosol Air Qual. Res. 2012, 12, 30–38. [Google Scholar] [CrossRef]
  28. Oh, H.J.; Jeong, N.N.; Chi, W.B.; Seo, J.H.; Jun, S.M.; Sohn, J.R. Characterization of particulate matter concentrations and bioaerosol on each floor at a building in Seoul, Korea. Environ. Sci. Pollut. Res. 2015, 22, 16040–16050. [Google Scholar] [CrossRef] [PubMed]
  29. Sangiorgi, G.; Ferrero, L.; Ferrini, B.S.; Lo Porto, C.; Perrone, M.G.; Zangrando, R.; Gambaro, A.; Lazzati, Z.; Bolzacchini, E. Indoor airborne particle sources and semi-volatile partitioning effect of outdoor fine PM in offices. Atmos. Environ. 2013, 65, 205–214. [Google Scholar] [CrossRef] [Green Version]
  30. Massey, D.; Kulshrestha, A.; Masih, J.; Taneja, A. Seasonal trends of PM10, PM5.0, PM2.5&PM1.0 in indoor and outdoor environments of residential homes located in north-central India. Build. Environ. 2012, 47, 223–231. [Google Scholar]
  31. Alves, C.A.; Urban, R.C.; Pegas, P.N.; Nunes, T. Indoor/outdoor relationships between PM10 and associated organic compounds in a primary school. Aerosol Air Qual. Res. 2014, 14, 86–98. [Google Scholar] [CrossRef]
  32. Lü, H.X.; Cai, Q.Y.; Wen, S.; Chi, Y.G.; Guo, S.J.; Sheng, G.Y.; Fu, J.M.; Katsoyiannis, A. Carbonyl compounds and btex in the special rooms of hospital in Guangzhou, China. J. Hazard. Mater. 2010, 178, 673–679. [Google Scholar] [CrossRef] [PubMed]
  33. Chan, W.; Lee, S.C.; Chen, Y.; Mak, B.; Wong, K.; Chan, C.S.; Zheng, C.; Guo, X. Indoor air quality in new hotels’guest rooms of the major world factory region. Int. J. Hosp. Manag. 2009, 28, 26–32. [Google Scholar] [CrossRef]
  34. Cometto-Muniz, J.E.; Abraham, M.H. Compilation and analysis of types and concentrations of airborne chemicals measured in various indoor and outdoor human environments. Chemosphere 2015, 127, 70–86. [Google Scholar] [CrossRef] [PubMed]
  35. Zhao, D.F.; Kaminski, M.; Schlag, P.; Fuchs, H.; Acir, I.H.; Bohn, B.; Haseler, R.; Kiendler-Scharr, A.; Rohrer, F.; Tillmann, R.; et al. Secondary organic aerosol formation from hydroxyl radical oxidation and ozonolysis of monoterpenes. Atmos. Chem. Phys. 2015, 15, 991–1012. [Google Scholar] [CrossRef]
  36. Yang, W.B.; Chen, W.H.; Yuan, C.S.; Yang, J.C.; Zhao, Q.L. Comparative assessments of VOC emission rates and associated health risks from wastewater treatment processes. J. Environ. Monit. 2012, 14, 2464–2474. [Google Scholar] [CrossRef] [PubMed]
  37. California Environmental Protection Agency (CalEPA). OEHHA Toxicity Criteria Database. Available online: http://www.oehha.ca.gov/ (accessed on 1 January 2016).
  38. De Gennaro, G.; de Gennaro, L.; Mazzone, A.; Forcelli, F.; Tutino, M. Indoor air quality in hair salons: Screening of volatile organic compounds and indicators based on health risk assessment. Atmos. Environ. 2014, 83, 119–126. [Google Scholar] [CrossRef]
Figure 1. Location of sampling sites and the main cities in the Pearl River Delta in South China.
Atmosphere 07 00054 g001
Figure 2. Mean concentrations of CO, CO2, PM2.5 and PM10 in indoor and outdoor air of four spring hotels.
Atmosphere 07 00054 g002
Figure 3. Cancer risk of benzene in indoor air of four spring hotels.
Atmosphere 07 00054 g003
Table 1. General description of hot spring hotel locations and indoor/outdoor air parameters.
SitesFloorT °C(I/O)RH%(I/O)Location
CH1/2 a26.1/27.2 b67.0/64.1 cOn the edge of a forest, northeastern region, 75 km from Guangzhou city
HZ1/225.2/31.955.6/67.4In a spacious valley, 5 km from Huizhou city
FS3/626.7/30.855.8/66.8Ina county east of Guangdong province
SG1/225.8/35.460.0/55.91 km away from a county in northern Guangdong
1/220.1/28.555.3/51.5
a floor of the measured room; b and c arithmetic mean value of all measured temperature and relative humidity values.
Table 2. Comparison of PM10 and PM2.5 in the different indoor environments.
SitePM10SitePM2.5
Schoolroom [4]0.031Schoolroom [4]0.018
Residential Room [9]0.044–0.074Supermarket [10]0.102
Care Center [26]0.026–0.029Station Waiting Room [27]0.026
Station Waiting Room [27]0.037Office [29]0.018–0.022
Office Building [28]0.070–0.087Residential Room [30]0.109–0.161
Hot Spring Hotel a0.135Hot Spring Hotel a0.121
a this study.
Table 3. The main compounds of VOCs in the indoor and outdoor air of hot spring hotels, µg·m−3.
CompoundsIndoorOutdoorI/O a
MaxMinMeanMedianS.D.MaxMinMeanMedianS.D.
Benzene74.330.558.734.3611.3740.400.968.616.3710.311.01
Toluene319.630.2945.6416.5170.1161.162.8521.1916.5016.302.15
Ethyl-benzene182.68ND23.685.0344.9420.08ND4.462.544.785.32
m,p-xylene134.61ND17.817.8928.9940.140.146.473.439.272.75
Styrene262.74ND14.201.5142.076.15ND1.440.761.859.87
O-xylene199.24ND22.785.6045.2422.36ND4.112.694.965.54
1,3,5-TMB b188.87ND8.530.2728.301.73ND0.500.470.4517.18
1,2,4-TMB139.05ND9.680.9424.723.38ND0.860.401.0111.31
Alpha-pinene202.22ND47.5131.4853.2621.080.248.058.275.275.90
Beta-pinene21.10ND2.871.304.1410.38ND1.120.182.312.56
d-limonene68.96ND8.986.5611.509.69ND2.550.873.303.53
a The mean I/O ratio; b TMB, trimethyl-benzene; ND, Not detected.
Table 4. Comparison of the mean concentrations of indoor BTEX in different indoor microenvironments, µg·m−3.
LocationSiteB bT cE dM,p-X eO-X fBTEX g
Edmonton, Canada [1]Home, Winter1.27.61.54.61.516.4
Home, Summer0.636.10.892.40.7710.79
Porto, Portuga [2]Primary schools2.215.1NA17.73.938.9
New Delhi, India [3]Schoolroom, Winter7.29410.128.713.1153.1
Schoolroom, Summer12.266.713.922.29.4124.4
Southern China [12]Hotel13101151813159
Bari, Italy [13]Photocopy shop13.124351.326511.7584.1
Offices7.917.84.113.64.848.2
Drugstore14.8303.850.8359180.5908.9
Bari, Italy [14]Storehouse2.420.31.55.4NA h29.6
Supermarket1.813.53.69.7NA28.6
Restaurants2.518.44.911.31552.1
Guangzhou [15]Hotel22.9151.646.429.631.0281.5
PRD, China [33]Hotel guest rooms9.9081.4215.7615.8411.16134.08
Guangdong, China aSpring hotel8.7345.6423.6817.8122.78118.64
a This study; b Benzene; c Toluene; d Ethyl-benzene; e m,p-xylene; f O-xylene; g total concentrations of BTEX; h not available.
Table 5. Relative analysis of indoor compounds measured in four hot spring hotels.
Correlation-123456789101112131415
CO11.00--------------
CO22−0.071.00-------------
PM2.530.64 #−0.241.00------------
PM1040.61 #−0.260.98 #1.00-----------
Benzene50.24 *−0.060.34 #0.45 #1.00----------
Toluene60.22 *−0.110.140.26 #0.60 #1.00---------
Ethyl-benzene70.16−0.060.040.120.57 #0.85 #1.00--------
m,p-xylene80.22 *−0.110.070.140.57 #0.86 #0.95 #1.00-------
Styrene90.170.0270.170.36 #0.57 #0.77 #0.71 #0.70 #1.00------
O-xylene100.06−0.16−0.020.050.44 #0.82 #0.86 #0.83 #0.51 #1.00-----
1,3,5-TMB110.05−0.030.120.24 *0.42 #0.72 #0.64 #0.52 #0.65 #0.55 #1.00----
1,2,4-TMB120.190.010.030.110.53 #0.80 #0.87 #0.91 #0.75 #0.62 #0.58 #1.00---
Alpha-pinene130.09−0.280.130.190.52 #0.70 #0.75 #0.77 #0.49 #0.77 #0.53 #0.63 #1.00--
Beta-pinene140.31 #−0.140.25 *0.35 #0.48 #0.83 #0.73 #0.76 #0.78 #0.68 #0.63 #0.70 #0.64 #1.00-
1-Limonene150.30 #−0.110.44 #0.50 #0.39 #0.35 # 0.37 #0.46 #0.38 #0.22 *0.140.46 #0.49 #0.43 #1.00
Indoor & outdoor-−0.200.06−0.47*−0.47 *-0.200.250.330.47 *0.290.46−0.140.360.180.320.52 *
# correlation is significant at the 0.01 level; * correlation is significant at the 0.05 level.
Table 6. Results of factor analysis by principal component analysis.
Compound12345
CO--0.92--
CO2-- -0.96
PM10--0.86--
PM2.5--0.83--
Benzene-0.57---
Toluene0.790.53---
Ethyl-benzene0.91----
m,p-xylene0.96----
Styrene-0.86---
O-xylene0.89----
1,3,5-TMB a-0.79---
1,2,4-TMB0.83----
Alpha-pinene0.73----
Beta-pinene0.640.50---
1-limonene---0.88-
% of variance35.717.616.99.67.5
a TMB, trimethyl-benzene.

