3.1. Temporal Variability
Daily concentrations of PM
10 at Mount Lu ranged from 33.60 to 193.74 μg/m
3 and 4.55 to 231.46 μg/m
3, with an average of 97.87 μg/m
3 and 73.40 μg/m
3 in spring and autumn, respectively (
Table 1). The concentrations of carbonaceous species showed pronounced temporal variability during the study period (August–September, 2011 and March–May, 2012). The maximum-to-minimum ratios for PM
10 were 145.54 and 13.45 for OC and EC, respectively. The higher variability for OC concentrations may be attributed to different emission sources [
15]. According to the previous studies, the average OC concentration emitted from coal combustion and biomass burning was 4.79 and 1.38 μg/m
3, respectively. While the contribution of motor vehicle exhaust to OC can vary from 0.08 μg/m
3 to 22.25 μg/m
3 [
16,
17]. In this study, concentrations of PM
10, OC and EC in the samples collected in spring (average temperature: 12.13 °C) were 1.33, 1.5 and 1.07 times as high as those in the samples collected during fall (average temperature: 19.8 °C), indicating higher concentrations of carbon aerosols during the colder months. This pattern is consistent with our previous findings that higher concentrations of carbon aerosols were always found in the colder months. This phenomenon might be attributed to enhanced biomass burning, gasoline fuel and typical meteorological conditions (less efficient photochemical decomposition and lower inversion height) [
5].
Carbonaceous aerosol concentrations at Mount Lu were compared with other background sites (
Table 2), and the results showed that the EC concentrations in PM
10 at Mount Lu were generally higher than that reported in Kathmandu, Nepal (1.5 μg/m
3) [
18], Nagarkot, Nepal (0.94 μg/m
3) [
18], Zhuzhang, China (0.34 μg/m
3) [
19] and Shangri-La, China (0.34 μg/m
3) [
20]. In contrast, they were lower than those in Kaohsiung, Taiwan (6.1 μg/m
3) [
21] and Hangzhou, China (4.06 μg/m
3) [
22].
The OC levels decreased in the order of Hangzhou, China (21.41 μg/m3), Kaohsiung, Taiwan (14.5 μg/m3), Nagarkot, Nepal (14.375 μg/m3), Kathmandu, Nepal (14.37 μg/m3), Mount Lu, China (10.58 μg/m3), Zhuzhang, China (3.13 μg/m3), Shangri-La, China (3.1 μg/m3) and Puy de Dome, France (2.4 μg/m3). Although the analytical methods of carbonaceous aerosols in these studies are different, the results could still provide an overall picture to compare carbonaceous aerosols distributions in different regions.
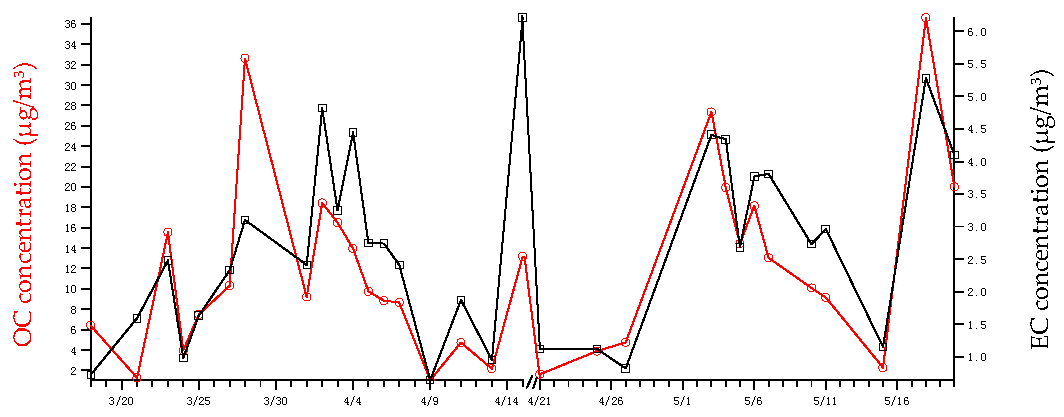
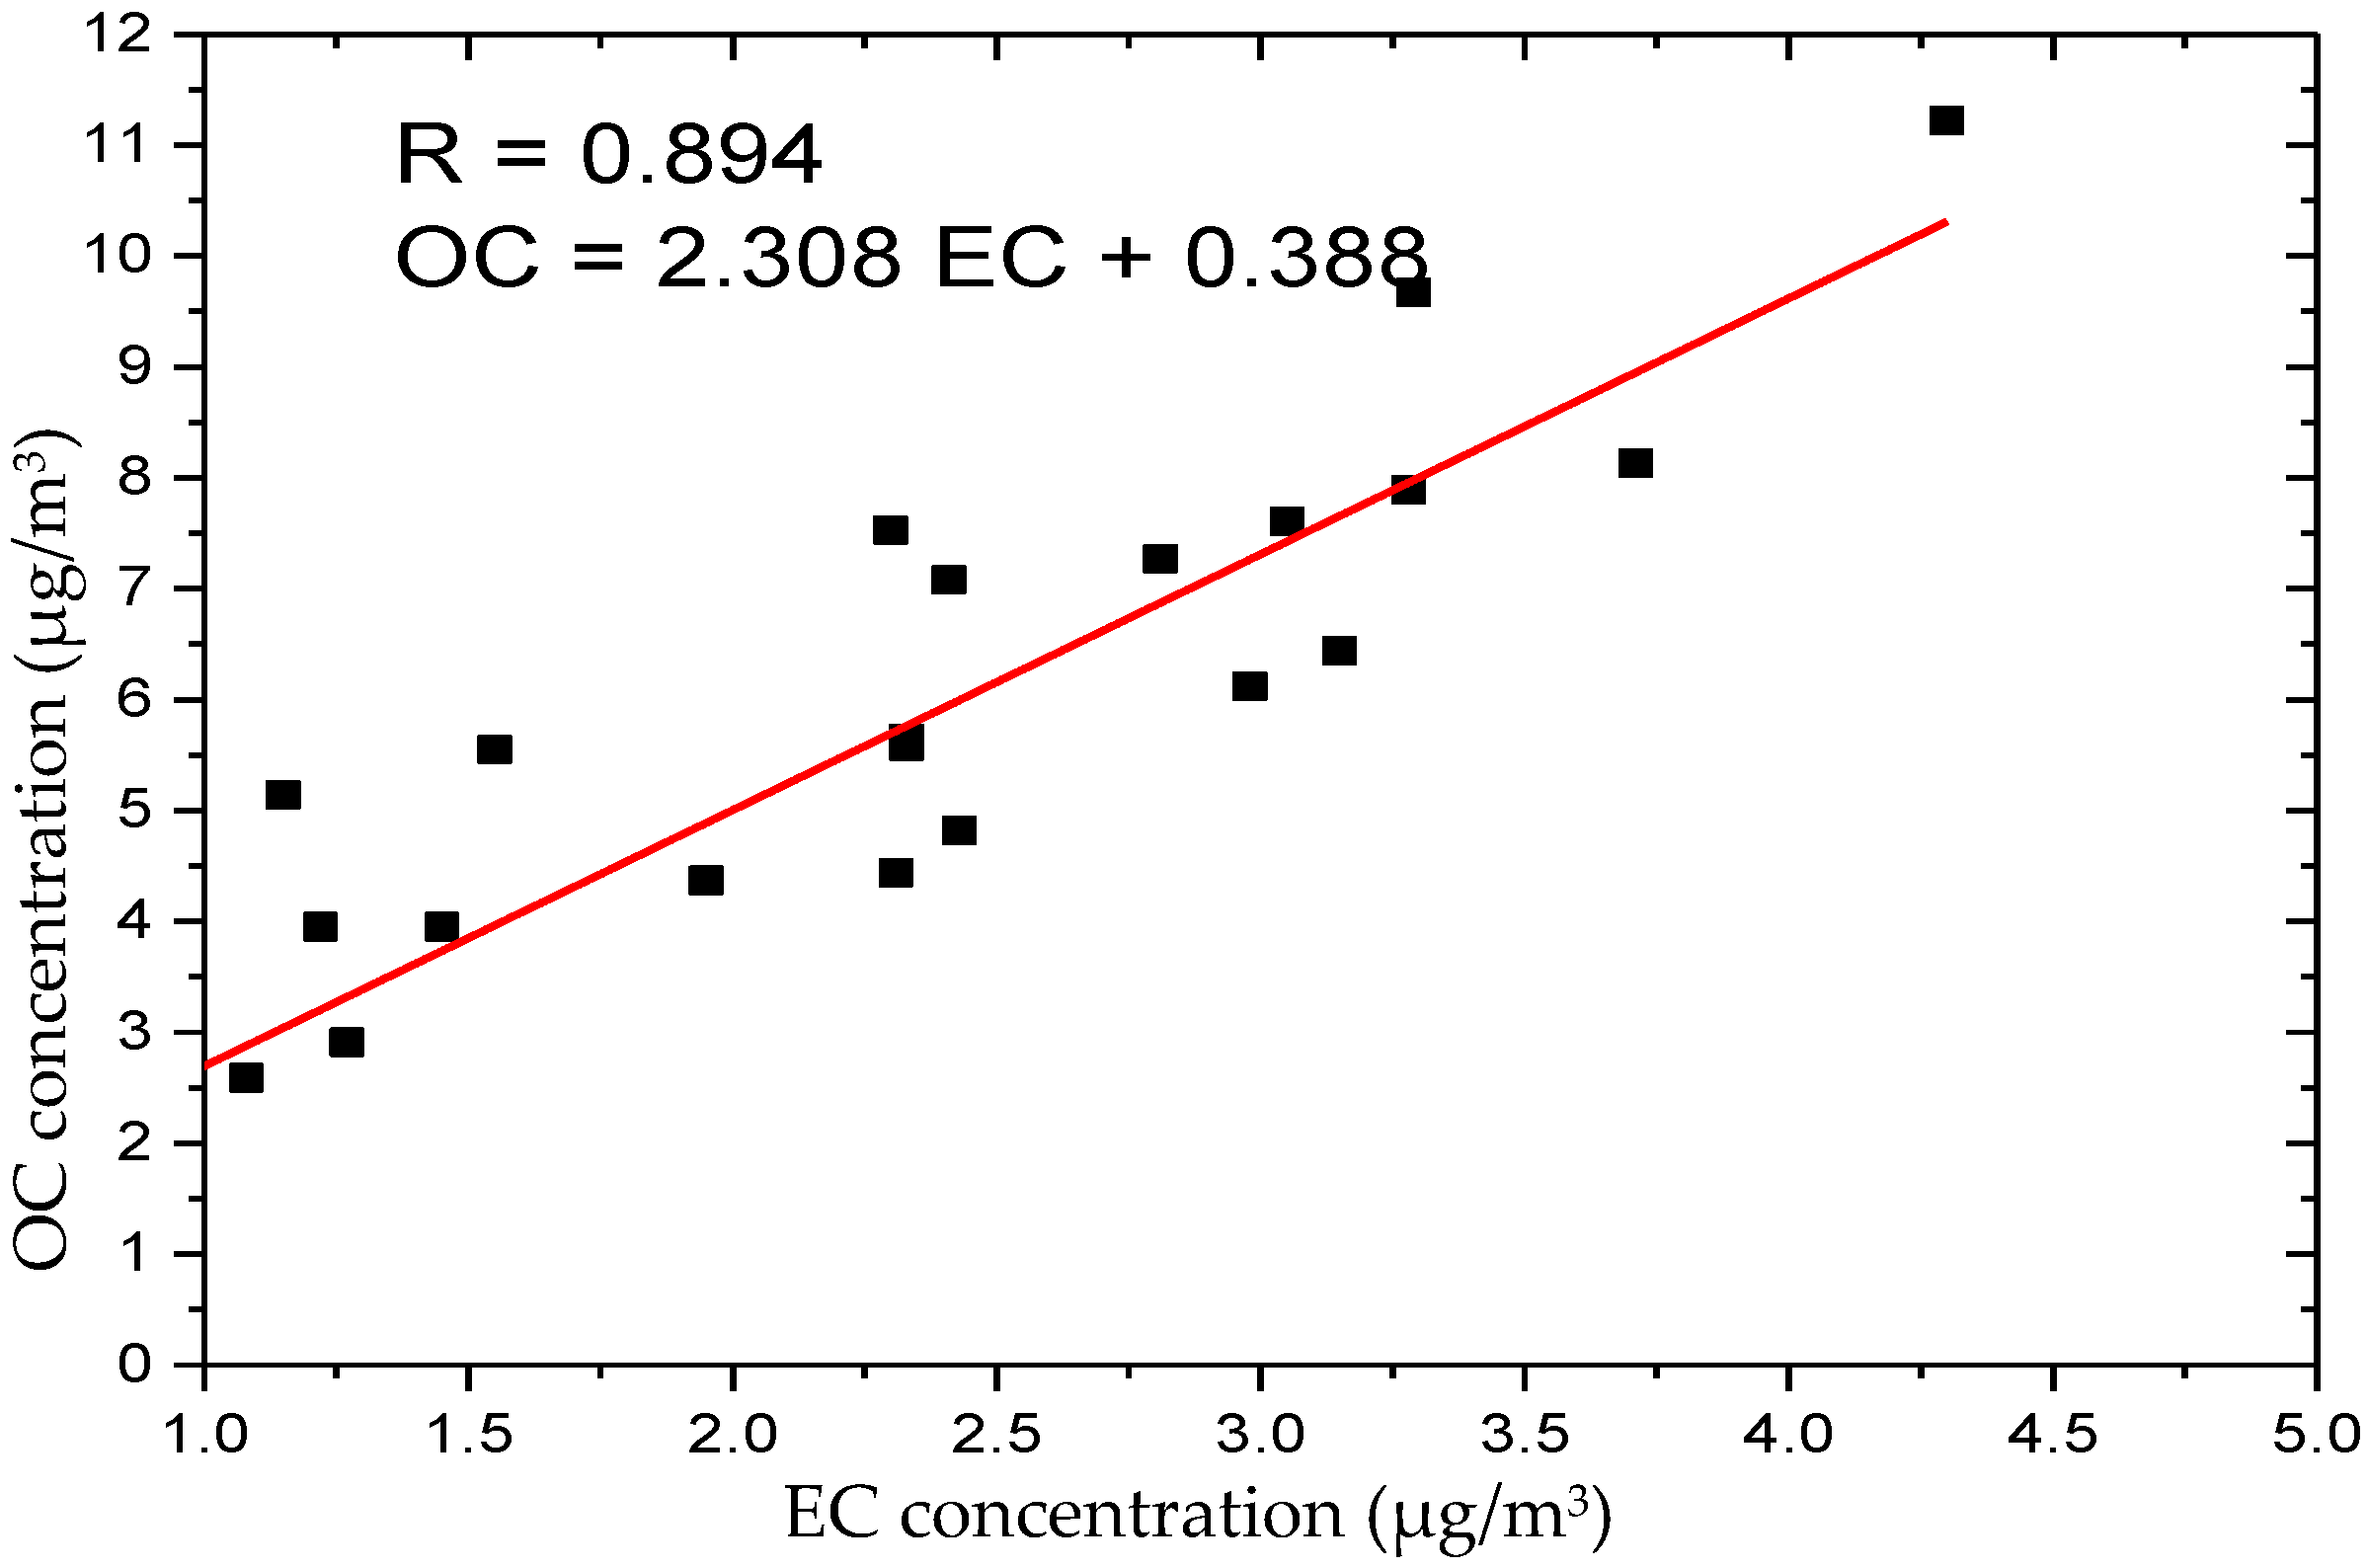
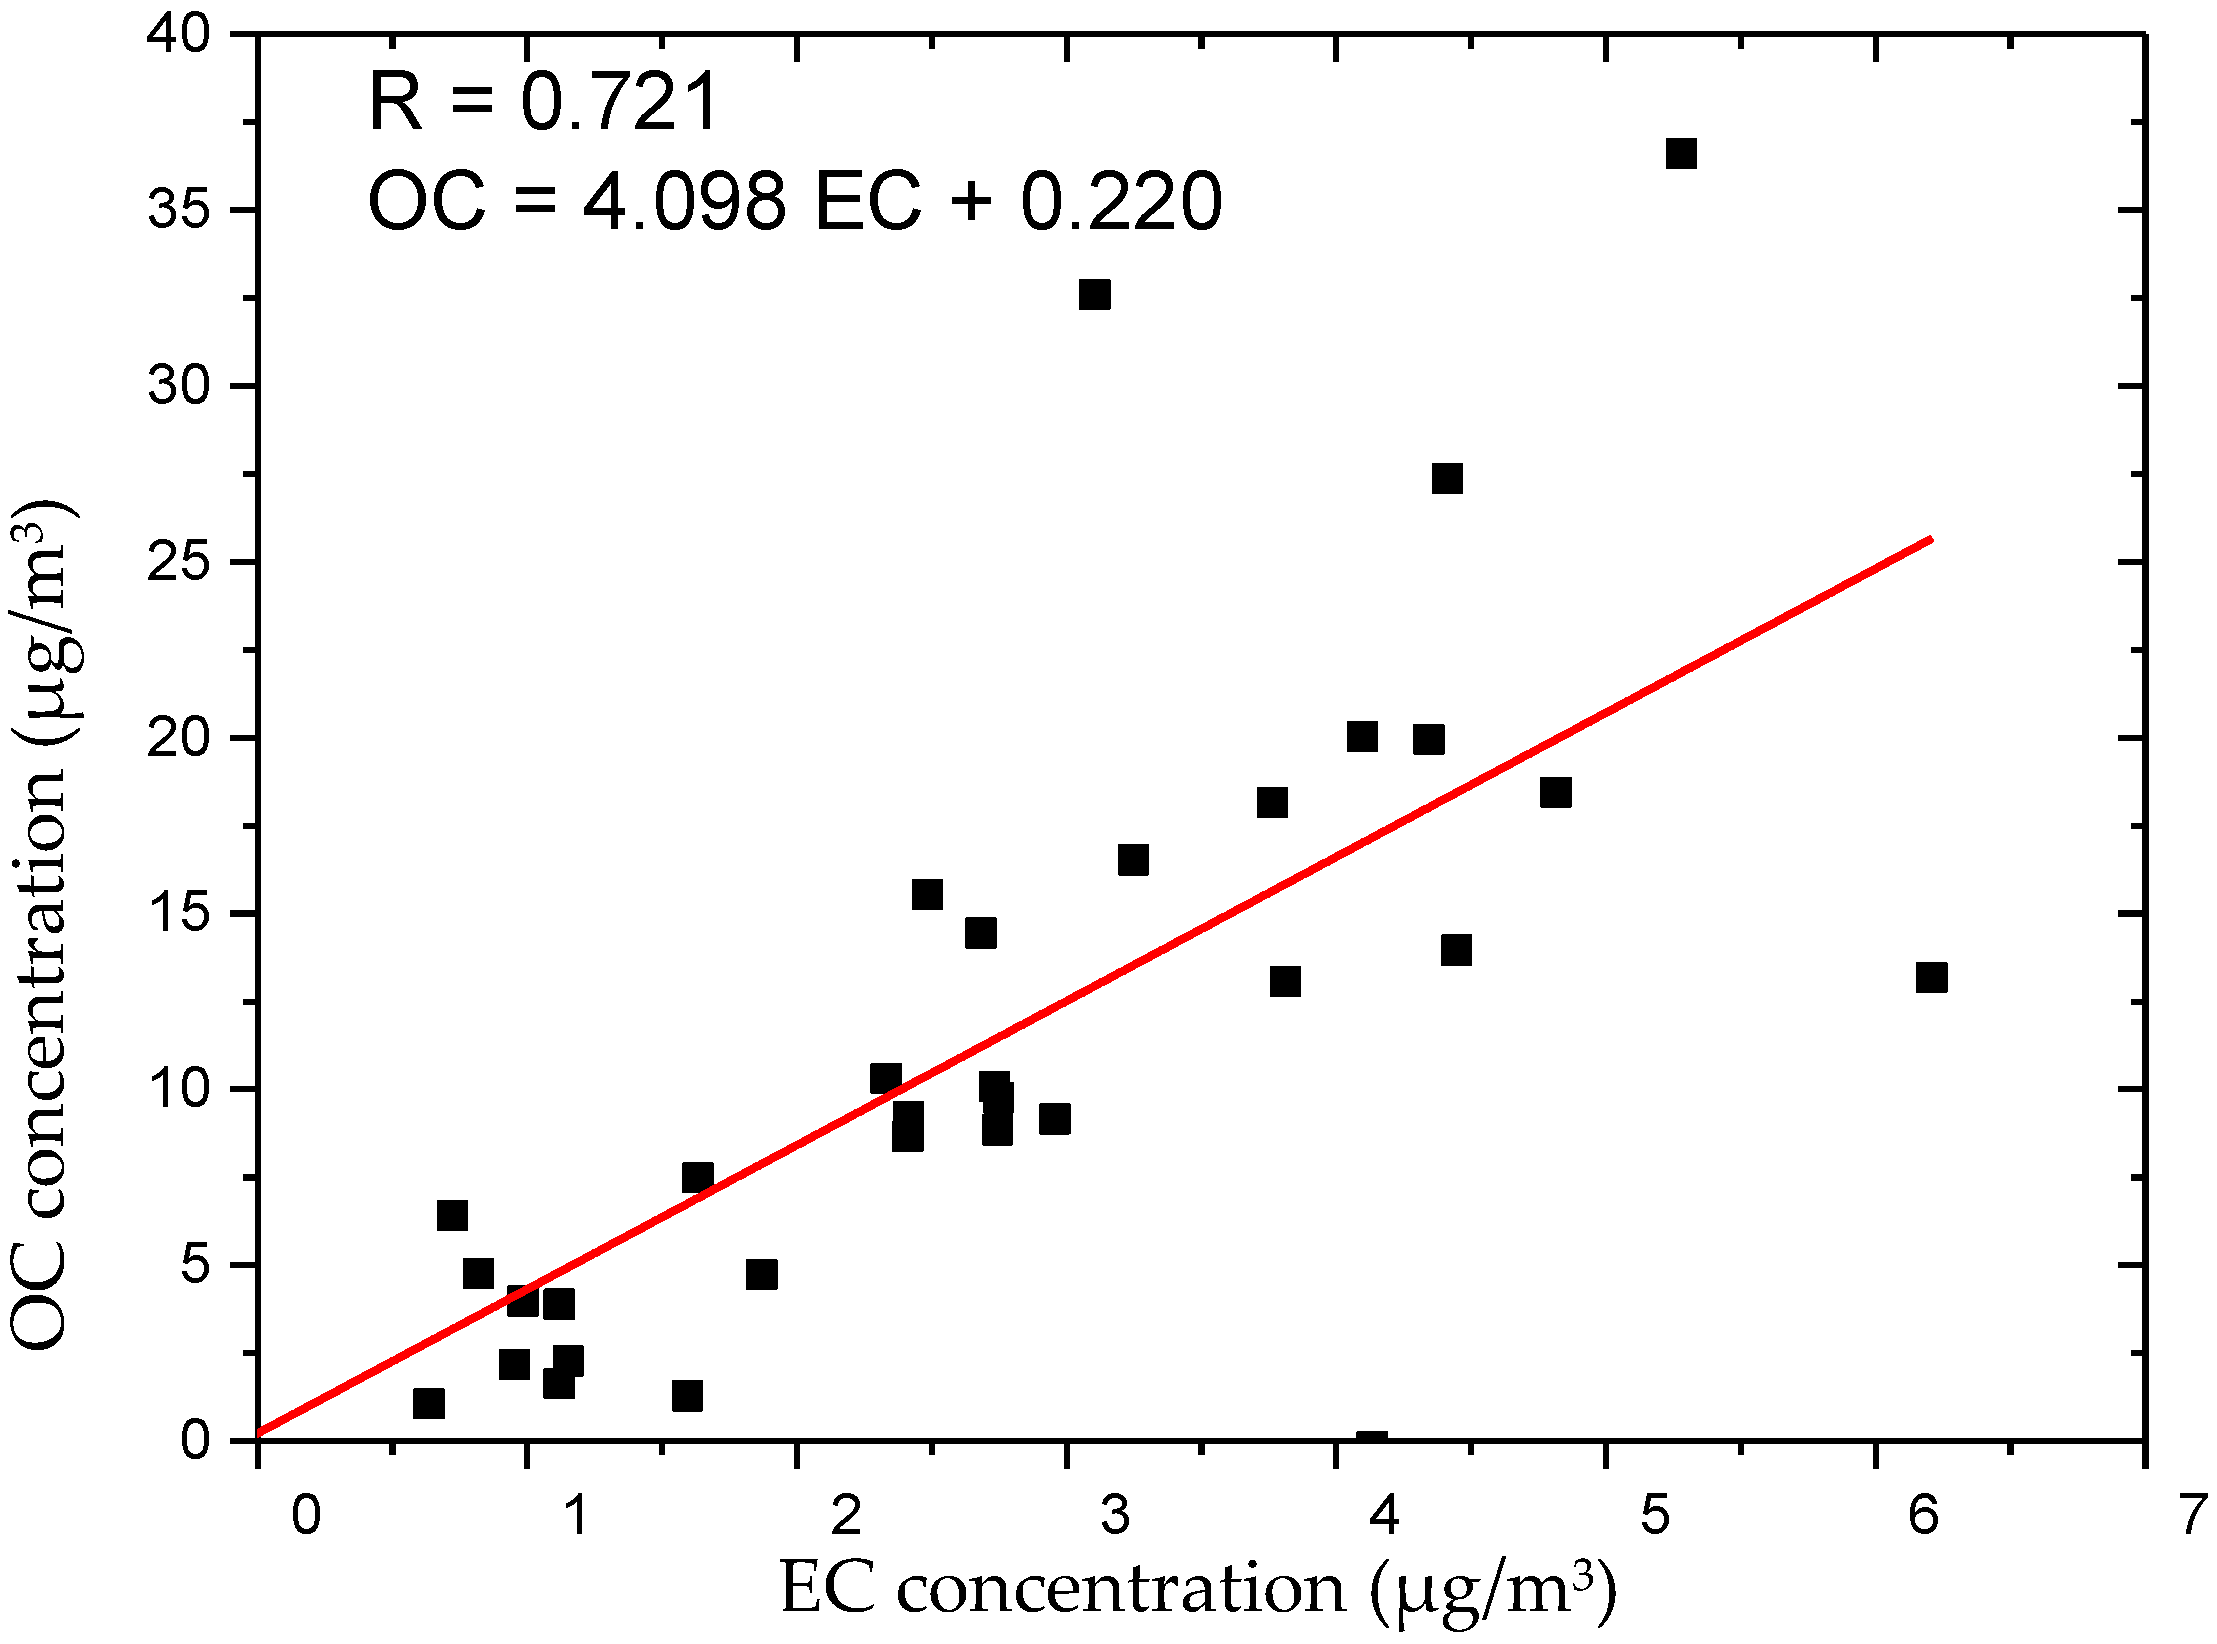
The origin of carbonaceous aerosols can be reflected by the relationship between OC and EC [
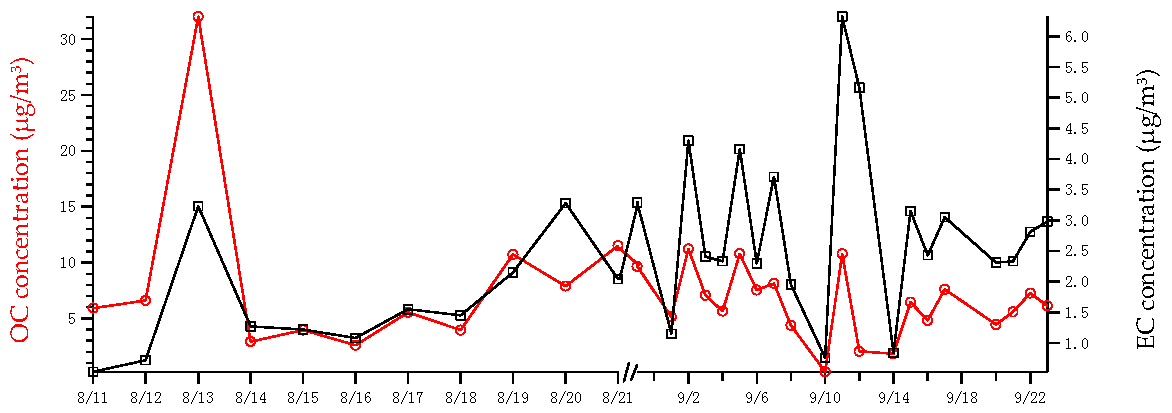
23]. In this study, OC and EC had similar temporal variations (
Figure 2 and
Figure 3) and were well related to each other (
Figure 4 and
Figure 5), indicating common emission sources and similar atmospheric processes shared by OC and EC during the observation period. It has been previously reported that an OC/EC ratio exceeding 2 or 2.2 indicated the presence of secondary organic aerosol [
2,
24]. In this study, the average OC/EC ratios in PM
10 at Mount Lu were 3.91 and 3.27 in spring and autumn, respectively (
Table 1), and these values were comparable to the OC/EC ratio in other sites listed in
Table 2 and higher than 2.2, suggesting that SOC may have contributed largely to the carbonaceous aerosols at Mount Lu. The OC/EC ratios in this study were also higher than those observed in urban areas in China including Beijing (a ratio of 2.9), Shanghai (a ratio of 2.5) and PRDR (a ratio of 2.4) [
13,
25].
3.2. Estimation of SOC Concentrations
EC is relatively inert regarding its chemical reactions in atmosphere, and it is solely derived from primary emissions. Unlike EC, OC can be derived from both primary emissions and the chemical reactions occurring between gaseous organic precursor species and by the oxidation of volatile organic compounds [
8]. The direct measurement of SOC is unlikely to be carried out because they are derived from not only the various physical processes but also the chemical transformation processes. The EC-tracer method has been applied to estimate different fractions of SOC for various environments, such as rural, semi-urban and urban environments to evaluate the mass concentrations of SOC [
23,
27,
28], and it is therefore adopted in the present study. The equation is as follows:
where OC
sec is the SOC; OC
tot is the total organic carbon; and (OC/EC)
pri is the primary ratio. The primary OC/EC ratios can be affected by many factors including temporal fluctuations, fluctuations in emissions, meteorology conditions, and thus the ratios vary among different sources. Therefore, the determination of the primary OC/EC values is crucial. In previous studies, the ratio of OC/EC in the lowest 5%–10% or below the threshold of 2.9 from the least-squares regression analysis was applied [
29,
30,
31]. In this study, the regression of the selected data suggested a primary OC/EC ratio of 2.06 and 3.08 in autumn and spring, respectively, which was comparable with the ratio (OC/EC = 2.19) at Mount Tai in northern China [
32]. The estimated SOC concentrations varied from 0.10 to 25.38 μg/m
3, with an average of 2.93 μg/m
3 in autumn and from 0.11 to 22.11 μg/m
3, with an average of 4.77 μg/m
3 in spring. The average proportion of SOC to the total OC was 31% and 28% in the autumn and spring, respectively. Compared with SOC proportion in PM
2.5 samples (45.0%) in the same area, the average proportion for PM
10 in autumn was lower [
2], indicating that SOC mainly enriched in fine particles.
As an important characteristic of particles, aerosol acidity can alter the uptake of precursors and the partitioning of volatile and semi-volatile compounds between the particle and gas phases, thereby affecting aerosol phase relations [
2]. In general, [H
+]
strong (calculated as 2 × SO
42− + NO
3− − NH
4+) was suggested to be an indicator of aerosol acidity. For PM
2.5 samples at Mount Lu in autumn, the average concentration of [H
+]
strong was 52.7 nmol/m
3, indicating that a general acidic state of the fine particles at Mount Lu. Furthermore, a good correlation between [H
+]
strong and SOC suggested a dominant role of aerosol acidity in the formation of SOAs [
2].
In this study, the data obtained during the special climate events like cloud/fog events and dust storms were excluded in the analysis of acidity. The concentrations of [H
+]
strong ranged from 0.10 to 29.21 nmol/m
3 (with the mean of 4.57 nmol/m
3) in autumn and from 0.01 to 53.35 nmol/m
3 (with the mean value of 5.05 nmol/m
3) in spring. These values were 10 times lower than those in PM
2.5 samples, suggesting that the acidic material was mainly associated with fine particles. In addition, the correlation between SOC and [H
+]
strong in this study was not as strong as that for PM
2.5, indicating that reactions catalyzed by heterogeneous acid may have contributed to the formation of SOA in fine particles rather than coarse particles [
8].
3.3. Source Apportionment of Carbonaceous Species
The ratio of EC/TC can differentiate the dominant contributors among fossil fuel burning and biomass burning. An EC/TC ratio between 0.1 and 0.2 indicates the source of carbonaceous species contributed by biomass burning, while a higher ratio (~0.5) suggests the source coming from fossil fuel combustion [
33,
34,
35,
36]. In this study, the average EC/TC ratios of PM
10 were 0.18 and 0.25 in spring and autumn at Mount Lu, respectively, indicating that biomass burning was the main source of carbonaceous aerosols at the observation site. Similarly, in previous studies, biomass burning in open fire and residential consumption was suggested as one of the most important carbonaceous emission sources in China [
2,
12].
However, because of great variations in emission patterns in different countries, these ratios may not accurately reflect emission characteristics. Therefore, principal component analysis (PCA) was conducted for eight carbon fractions to further characterize the possible emission sources of carbonaceous aerosols at the observation site.
Results of PCA for samples collected in autumn and spring are summarized in
Table 3 and
Table 4. For PM
10 autumn samples, and two factors accounted for 75.75% of the total variance in the data. Factor 1, explaining 46.12% of the variance, presented high loading for OC2, OC3, OC4, EC1 and OPC. Among these fractions, OC2 and OPC originated from coal combustion, and OC3, OC4 and EC1 represented gasoline-motor-vehicle exhaust. This factor appears to represent gasoline motor vehicle exhaust and coal combustion [
37]. Factor 2, which explained 29.63% of the variance, showed high loadings for OC1, EC2 and EC3. The high loading of OC1 in factor 2 reflected the contribution of biomass burning, and EC2 and EC3 were enriched in diesel-vehicle exhaust. Thus, factor 2 represented diesel vehicle exhaust and biomass burning.
In spring, three factors accounted for 87.07% of the total variance. Among these factors, factor 1 explained 47.51% of the variance, and it had high loading for OC2, OC3, OC4, EC1 and OPC. Similar to the fall results, Factor 1 in spring represents gasoline motor vehicle exhaust and coal combustion. Factor 2, which explained 20.48% of the variance, showed high loadings for EC2, EC3, from which the diesel-vehicle exhaust sources could be inferred [
5]. As for factor 3, the high loading of OC1 reflected the main contribution from biomass burning.
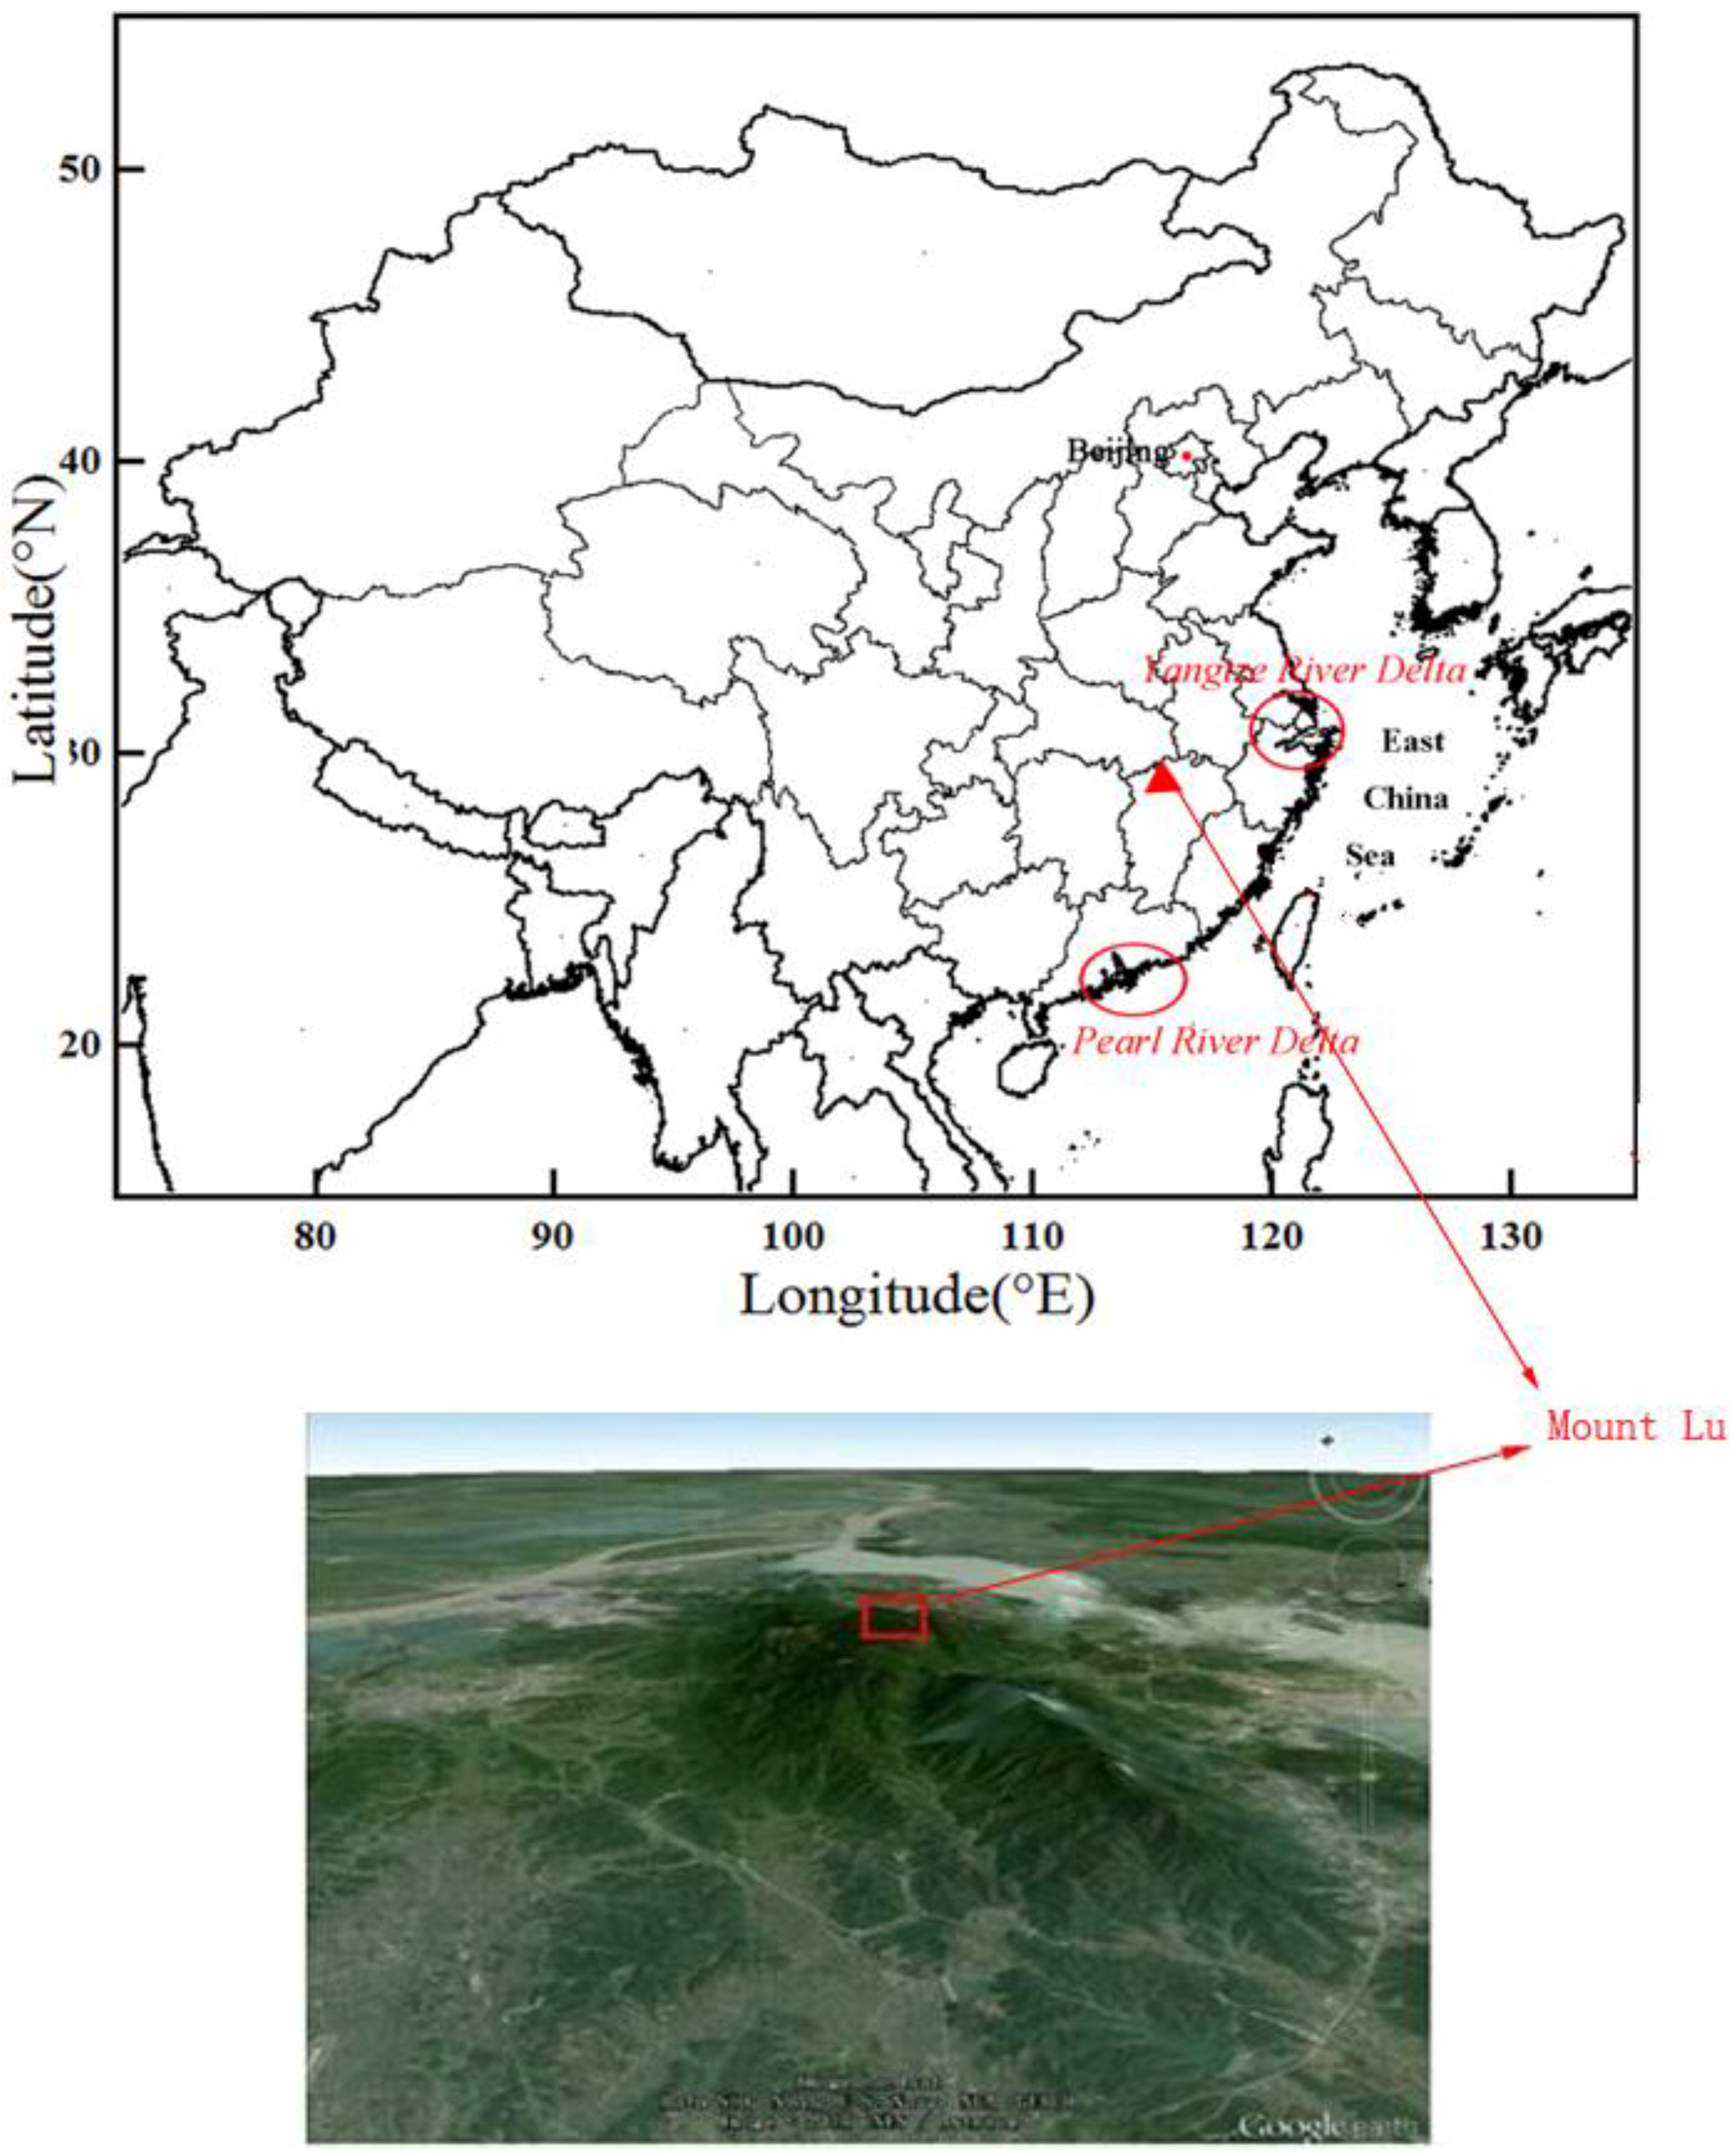
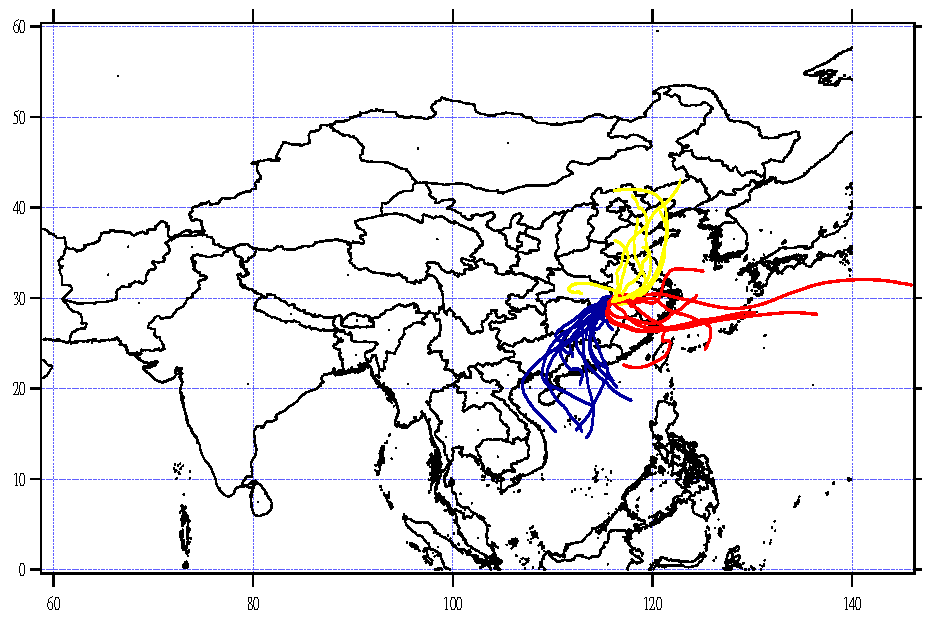
3.4. Long-Range Transport of Carbonaceous Aerosol
To better elucidate the origin and transport patterns for air mass samples, 72 h back trajectory was analyzed by the Hybrid Single Particle Lagrangian Integrated Trajectory (HYSPLIT) model with FNL (final analysis data) meteorological datasets at a height of 1165 m A.S.L. (above sea level) (
Figure 6 and
Figure 7). Owing to the occurrence of scavenging in fog or cloud conditions, the trajectory analysis did not include the samples collected during fog or cloud periods.
In autumn, all the air masses can be classified into three categories, namely N/NE-air (north/northeast of China) masses, S-air (south of China) masses and E-air (east of China) masses. Among the three trajectory categories, the N/NE-air masses that originate from continental areas in northern and northeastern China crossed the Beijing–Tianjin–Hebei region and the Shandong province and finally reached the station; the S-air masses came from coastal areas in southern China and then crossed Guangdong before finally reaching the station; the E-air masses originated from coastal areas in the east part of China and then traveled to the station across Zhejiang and Fujian provinces. It is noteworthy that this paper has omitted the air masses associated with trajectory that passed over two regions.
As can be seen from
Table 5, S occupied the dominant position, accounting for 43.75% of the total, while E-air masses and N/NE-air masses happened less frequently, accounting for 31.25% and 25%, respectively. Compared with E-air masses and S-air masses whose PM
10 concentrations were 70.52 μg/m
3 and 66.58 μg/m
3, respectively, N/NE-air masses had a relatively higher PM
10 concentration of 92.33 μg/m
3, due to the influence of dust storm events in this region. In addition, the sequence of OC concentrations among the three categories in descending order was S-air masses (8.01 μg/m
3) > N/NE-air masses (6.81 μg/m
3) > E-air masses (6.11 μg/m
3), and the sequence of EC concentrations in descending order was E-air masses (3.01 μg/m
3) > N/NE-air masses (2.70 μg/m
3) > S-air masses (1.99 μg/m
3). The fact beyond expectation is that S–air masses had the highest OC concentration, which was an average of 8.01 μg/m
3. As they always came from the sea and were relatively clean, their EC concentration was the lowest. However, compared with the YRDR and northern China, the rapidly developing PRDR situated in the air mass pathway owns a different industrial structure, and the famous ozone and NO
X pollution there could favor the formation of SOA [
2,
38], and the highest SOC concentration was found in the S-air masses category.
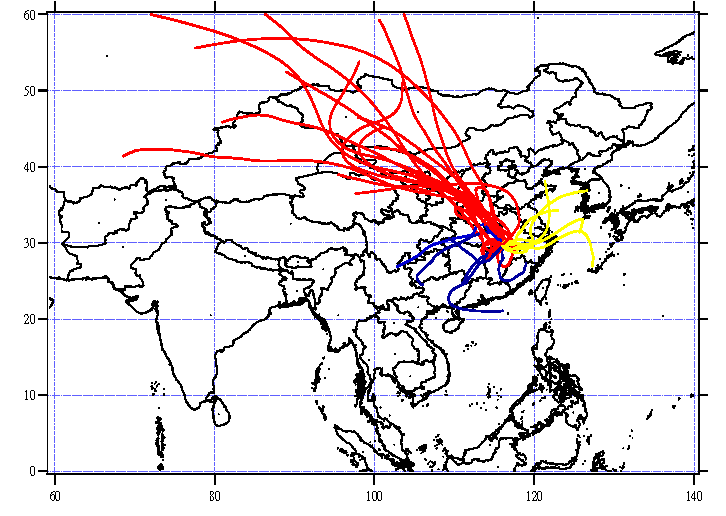
Figure 6 shows the derived three trajectory clusters in the spring. The three clusters were classified according to directions as south of China (S), Northwest China (NW), and coastal areas in the east of China (E). Among the three identified trajectory clusters, NW took the dominant position, accounting for 62.5% of the total, while S and E happened less frequently, accounting for 18.75% and 18.75%, respectively. The summary of statistical analysis for carbonaceous concentrations of each transport cluster is listed in
Table 6. Carbonaceous areole concentration sequences of the three clusters in descending order were E (OC: 20.22 μg/m
3, EC: 3.92 μg/m
3) > S (OC: 13.98 μg/m
3, EC: 2.67 μg/m
3) > NW (OC: 7.77 μg/m
3, EC: 2.28 μg/m
3). OC/EC ratio sequences of the three clusters in descending order were E (4.89) > S (4.39) > NW (3.77) (
Table 3). The air masses originating from relatively clean northwest areas [
8] were linked to lowest OC and EC concentrations, which were 7.77 and 2.28 μg/m
3, respectively.
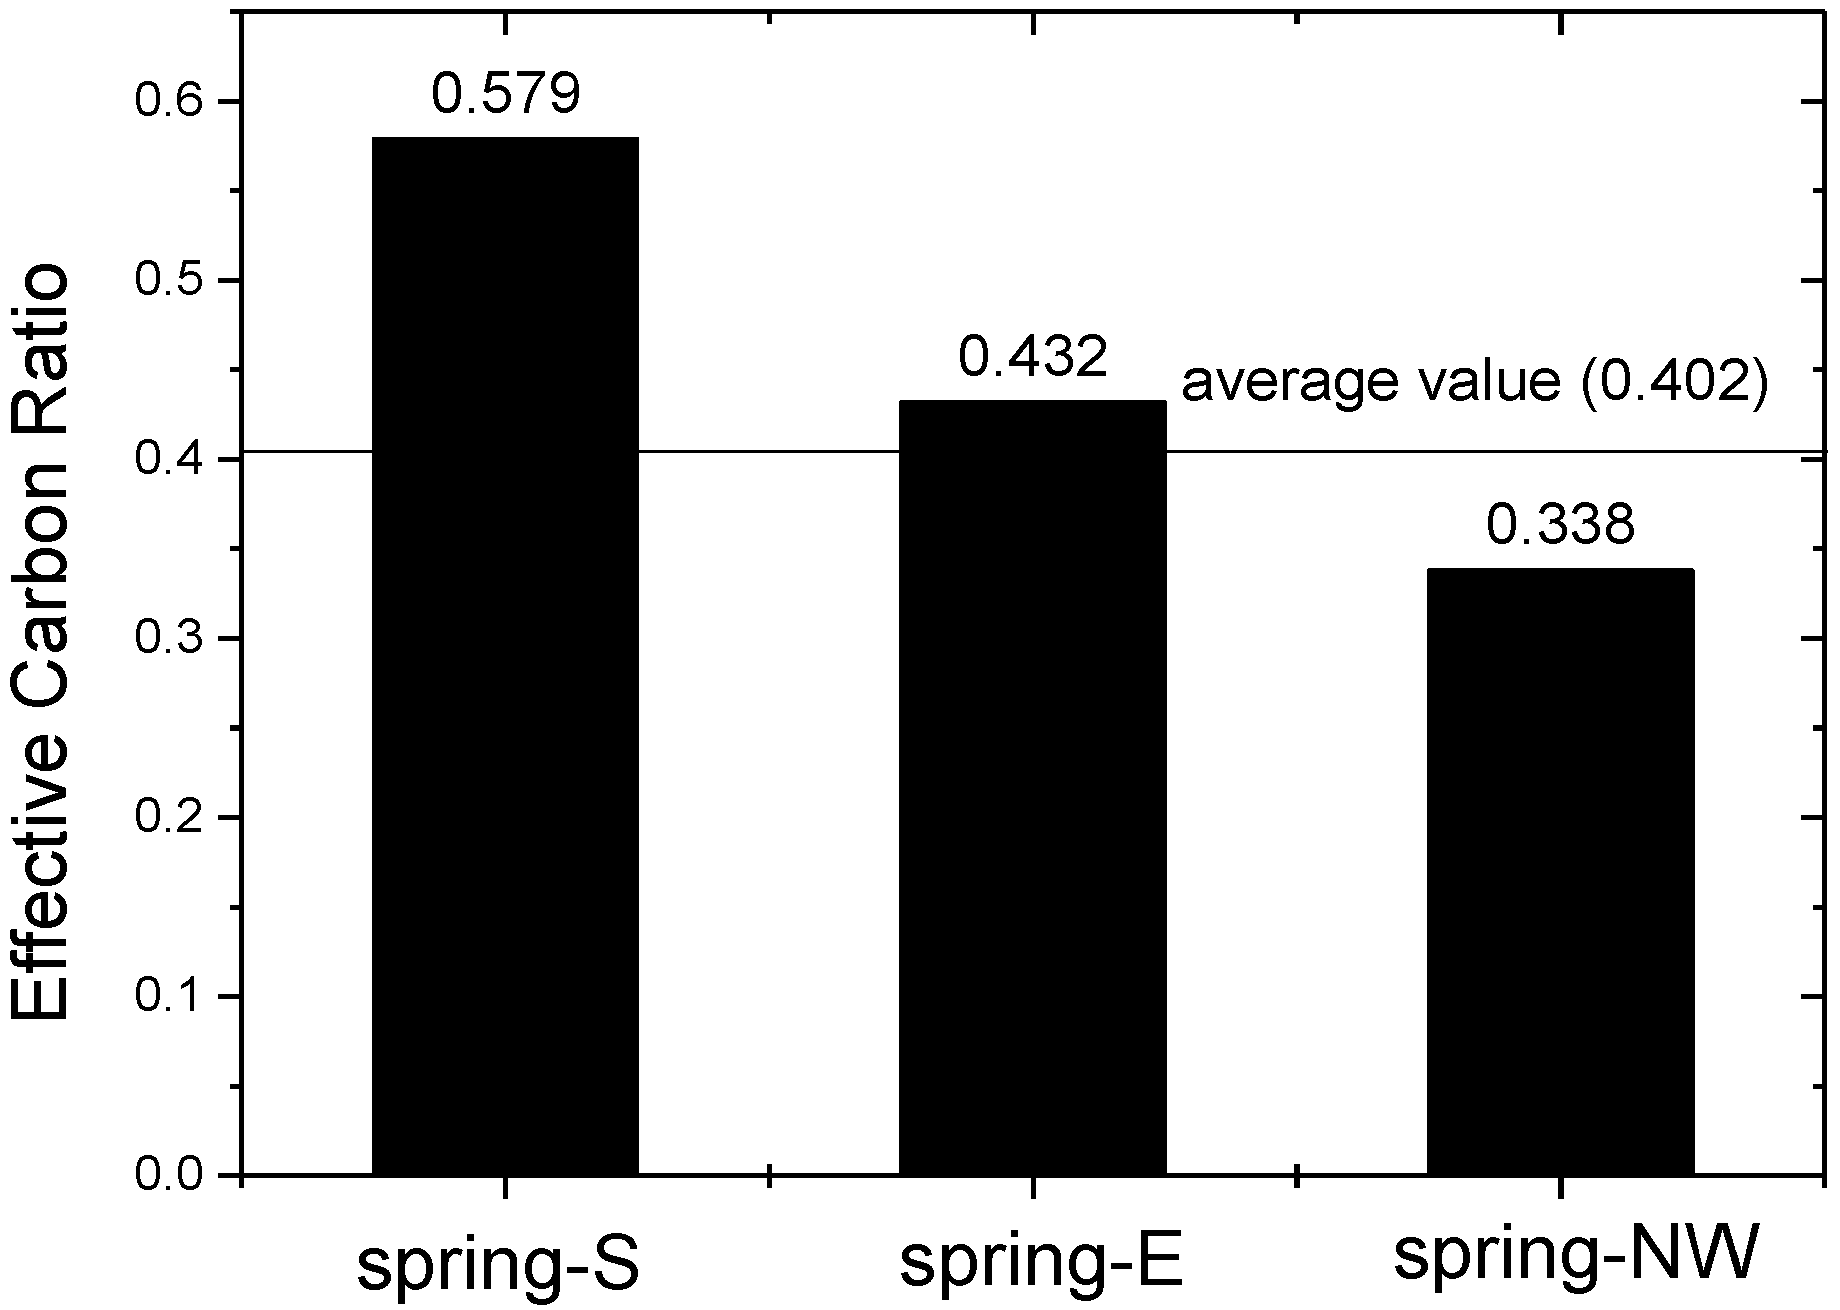
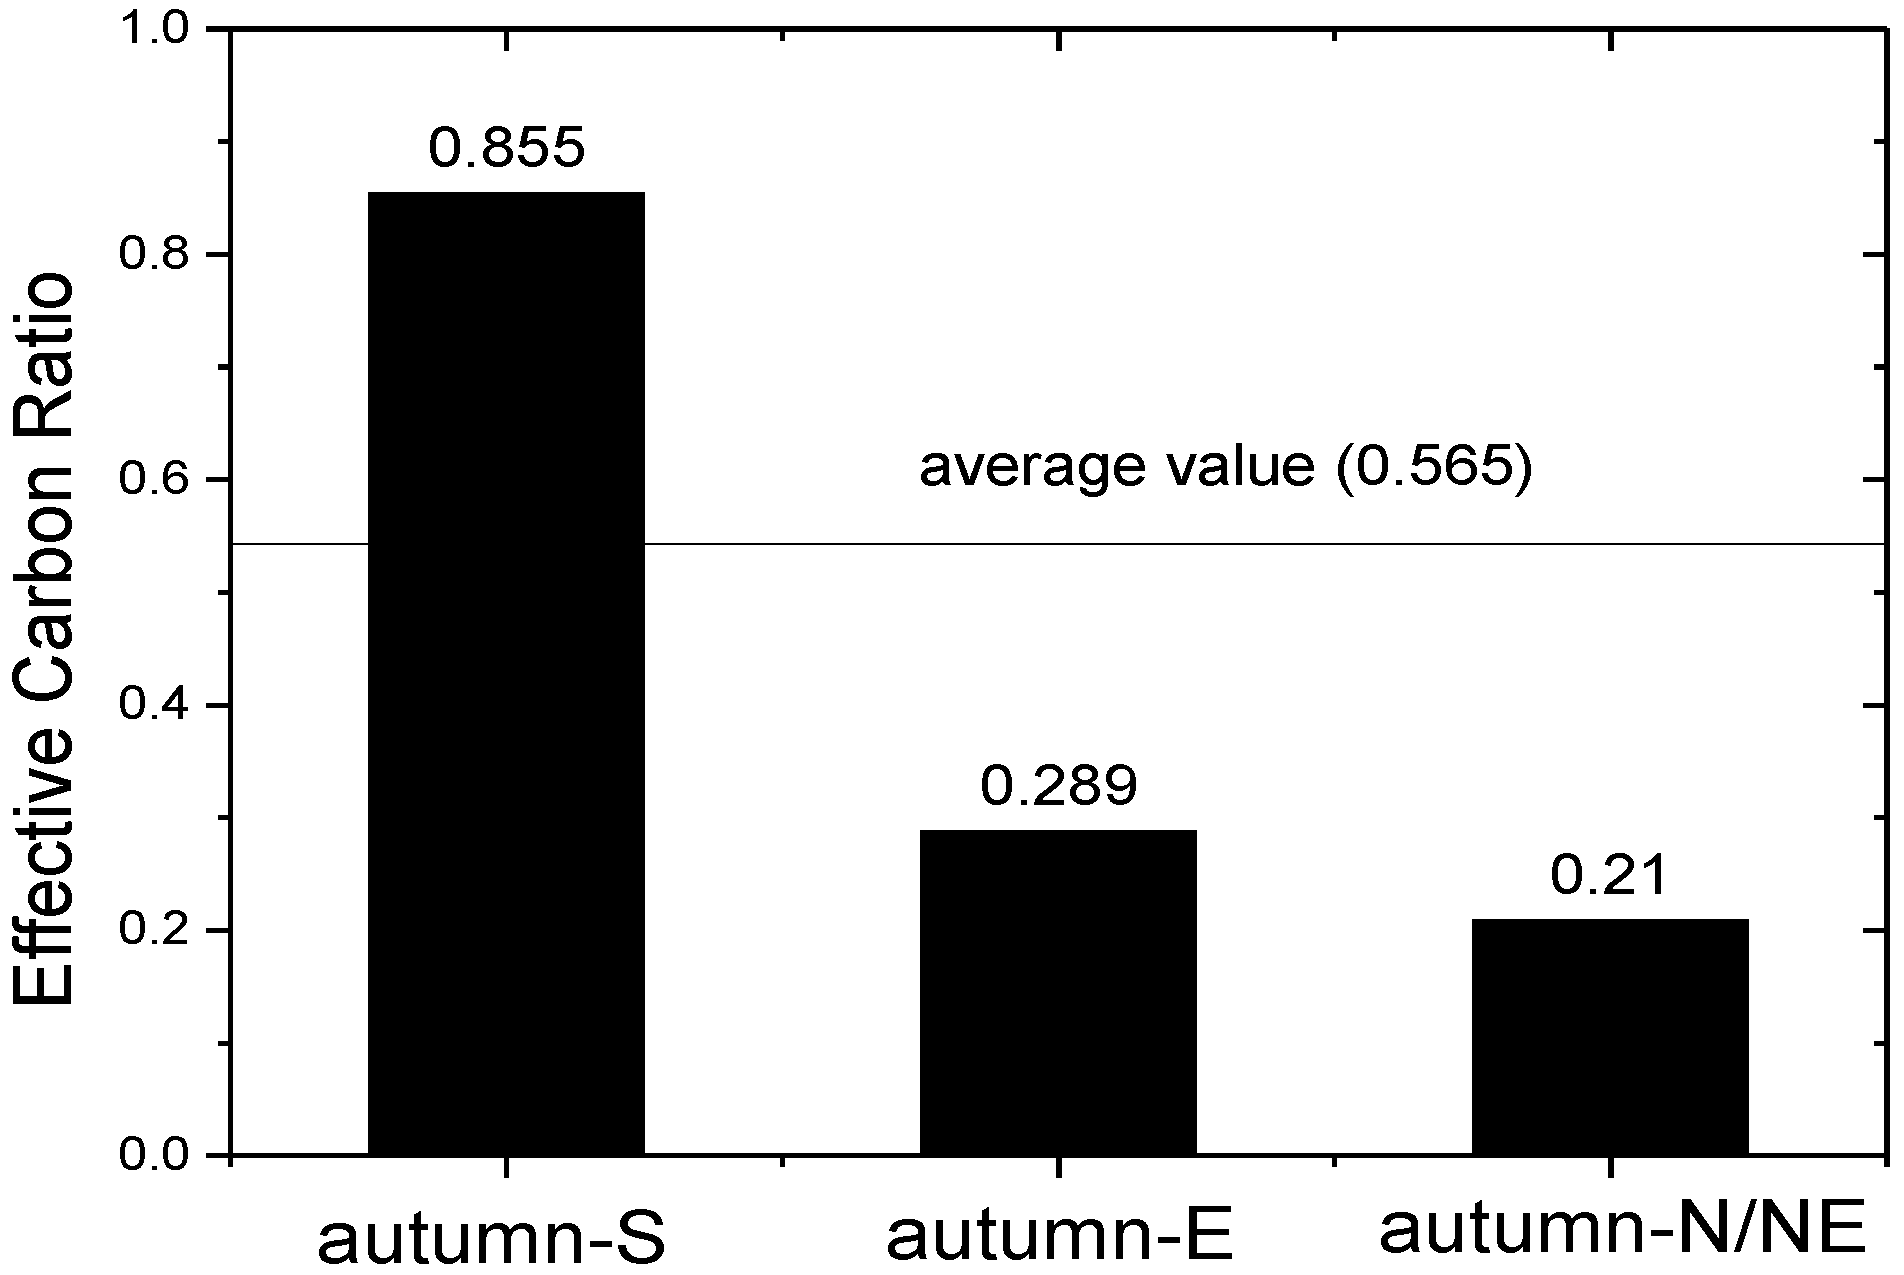
Since the chemical and optical properties of OC and EC were different, their influence on the atmosphere was different. Solar radiation can be scattered by OC and directly absorbed by EC. Meanwhile, following CO
2, EC acted as the second most important component causing global warming [
24]. Effective carbon ratio (ECR, calculated as SOC/ (POC + EC)) was proposed by Safai, Raju [
6], and it can be applied to assess the influence of carbonaceous aerosols on climate. Higher ECR value indicates lower EC and POC concentrations, which may result in a decreasing level of atmospheric warming effect. According to the study results, the ECR value of the N/NE-air masses (an average of 0.210) was much lower than that of the S-air masses (an average of 0.855) and similar to that of the E-air masses (an average of 0.289) in autumn. In spring, the ECR value of the S-air masses (an average of 0.579) was a little higher than that of the E-air masses (an average of 0.338) and NW-air masses (an average of 0.432) (
Figure 8 and
Figure 9).


 ,
, 


