
Characterization, Long-Range Transport and Source Identification of Carbonaceous Aerosols during Spring and Autumn Periods at a High Mountain Site in South China

 ,
, 


Abstract
:1. Introduction
2. Methodology
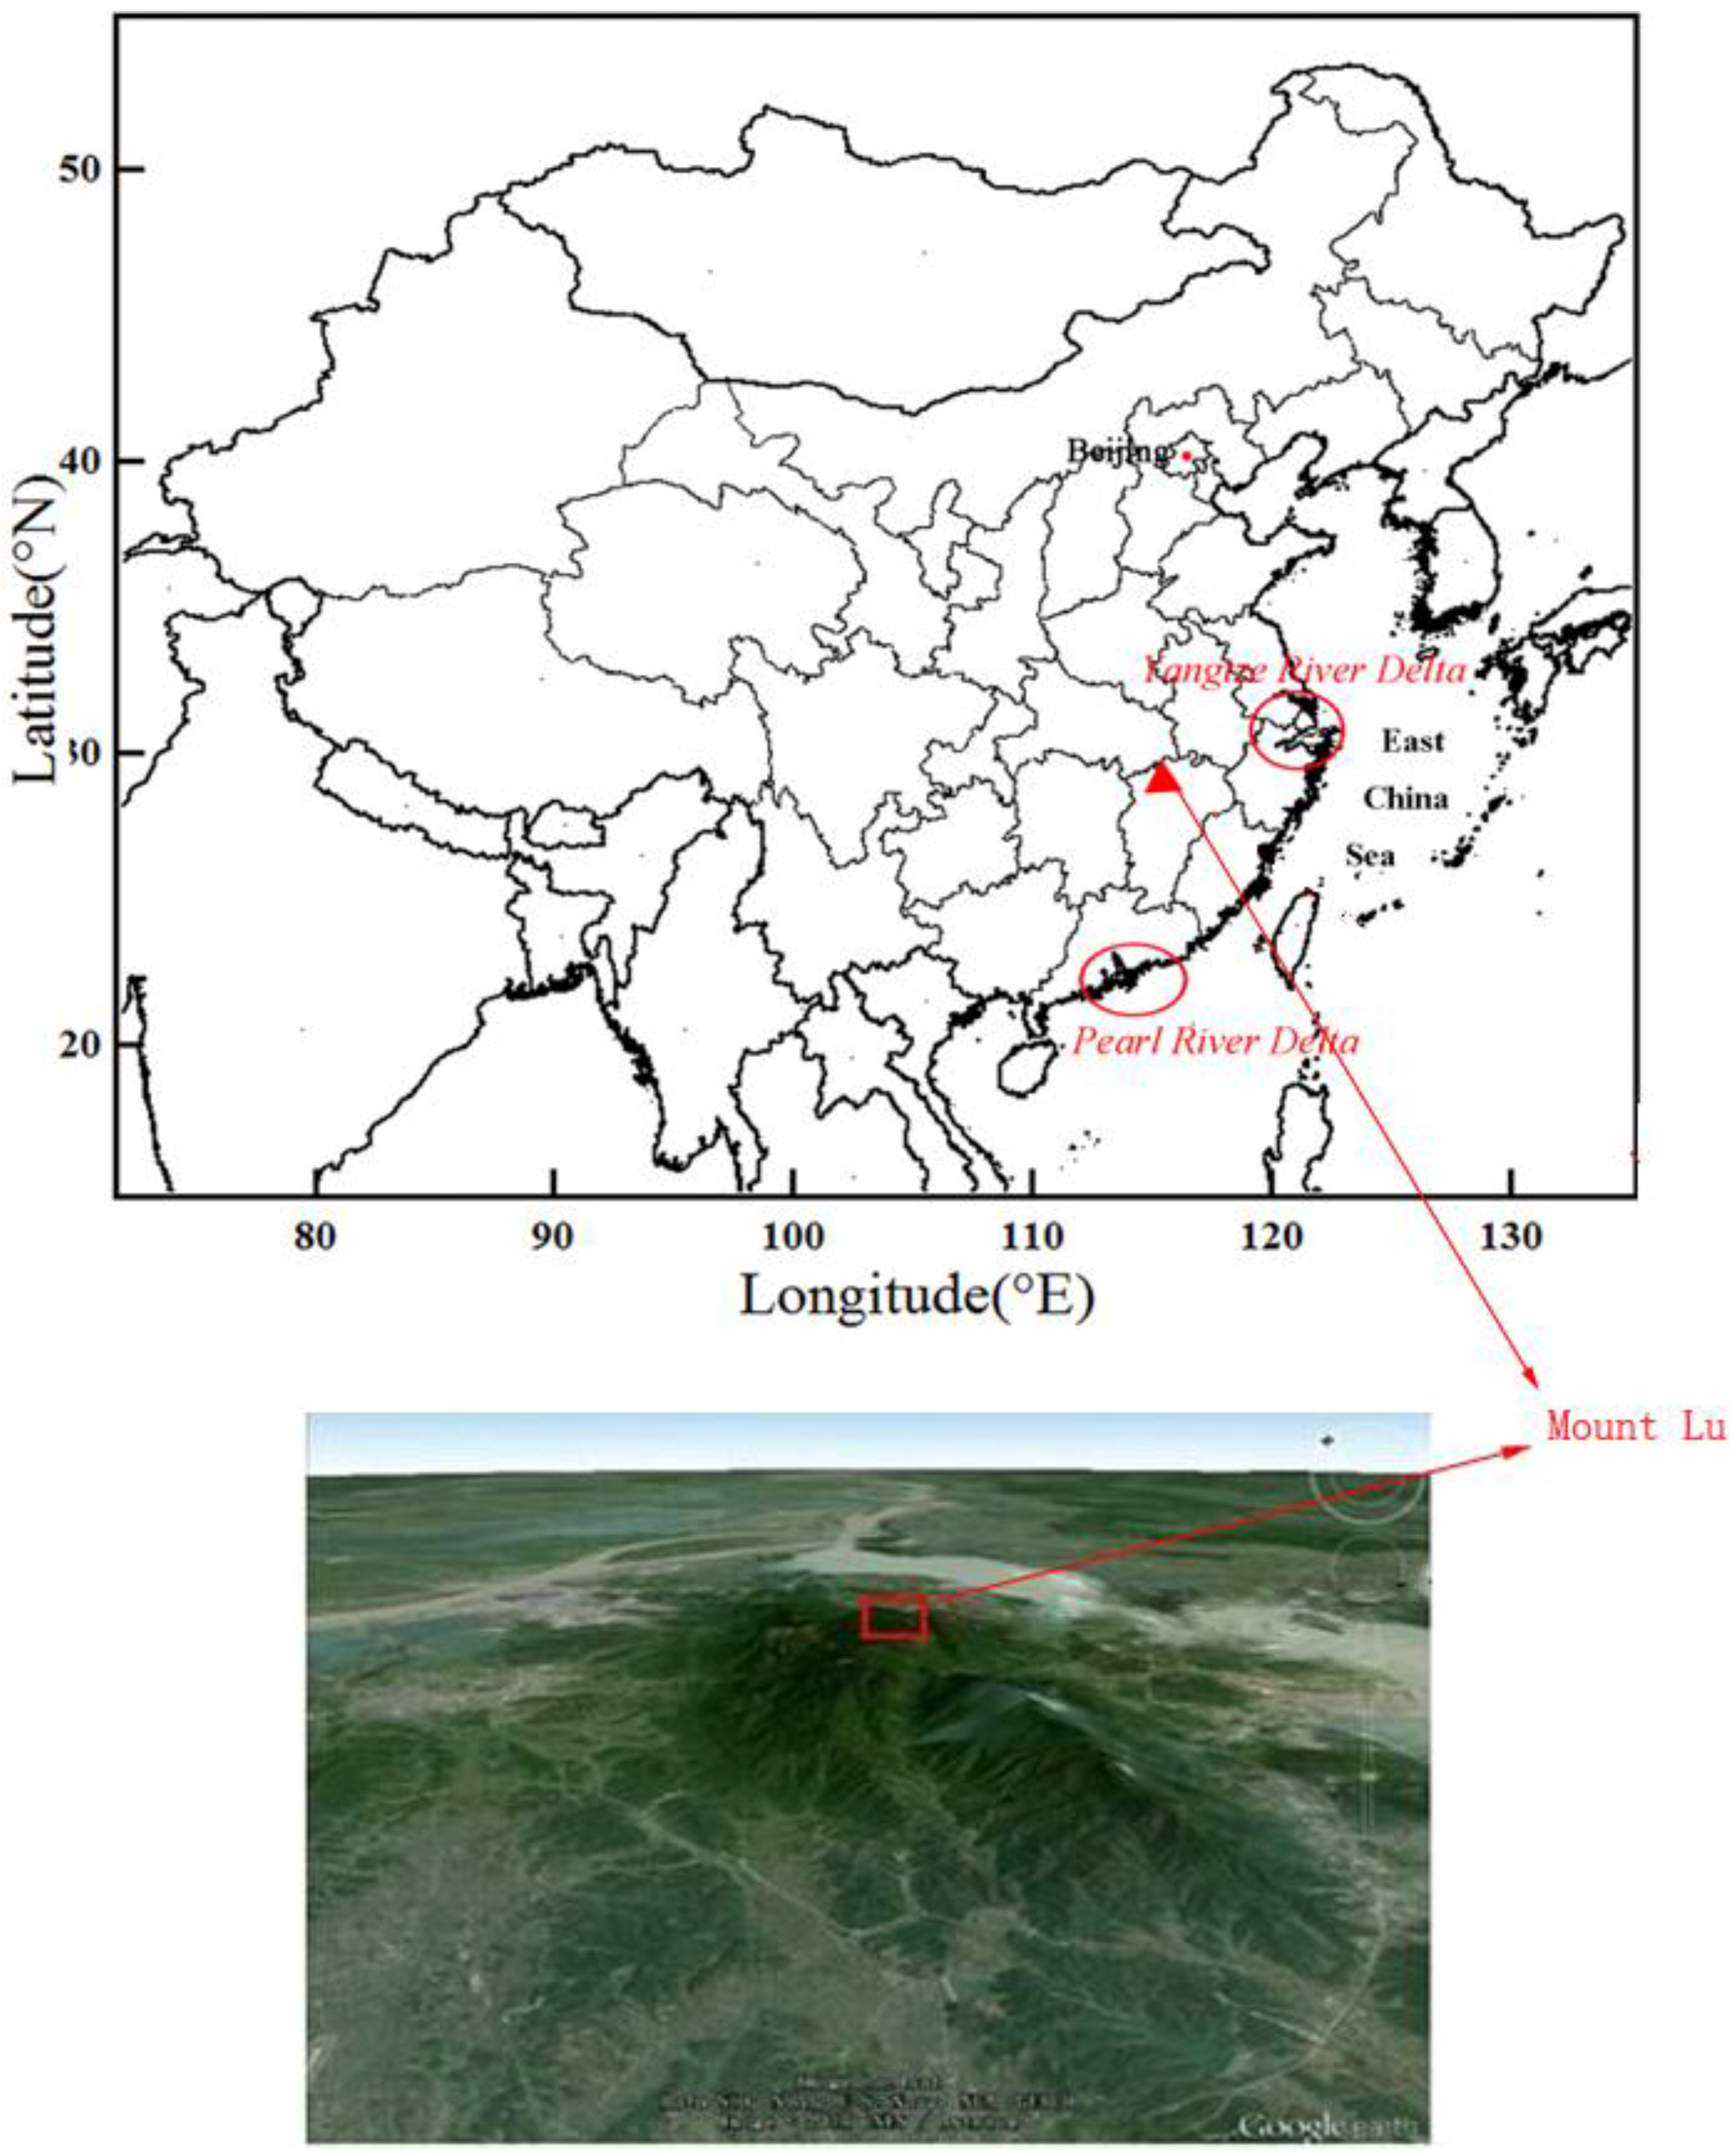
2.1. Sampling
2.2. Carbonaceous Species Analysis
3. Result and Discussion
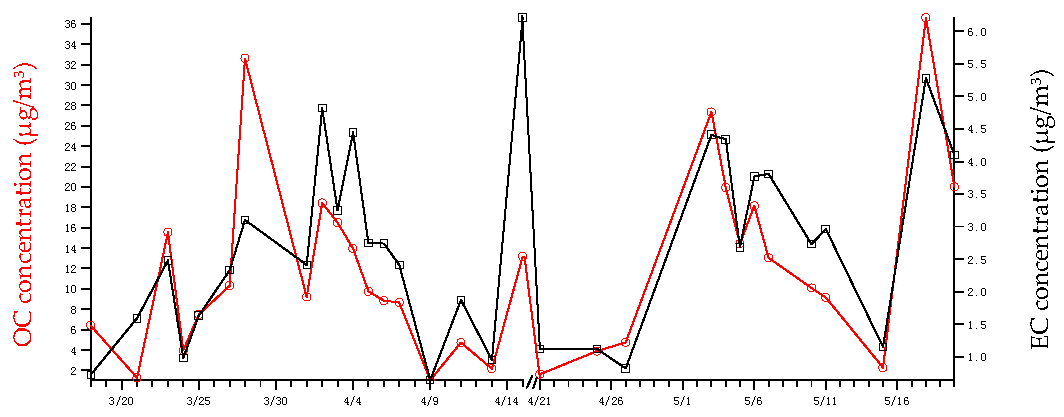
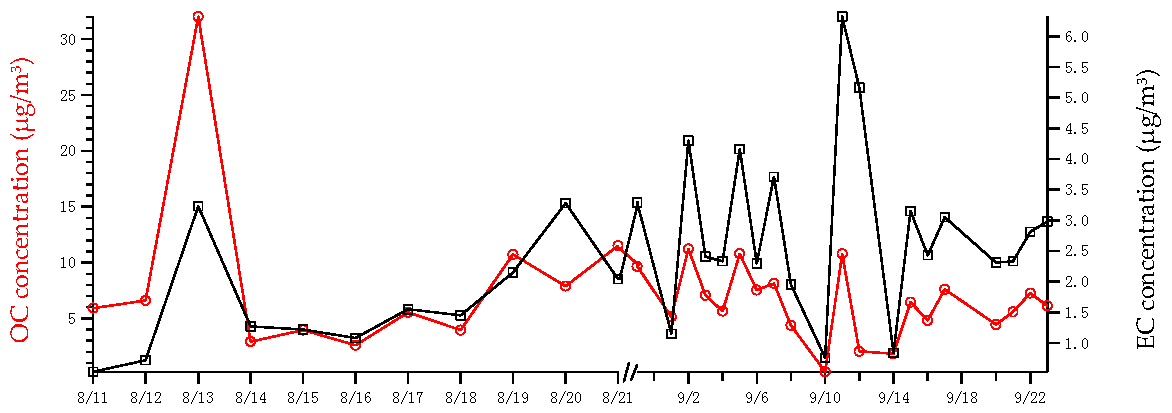
3.1. Temporal Variability
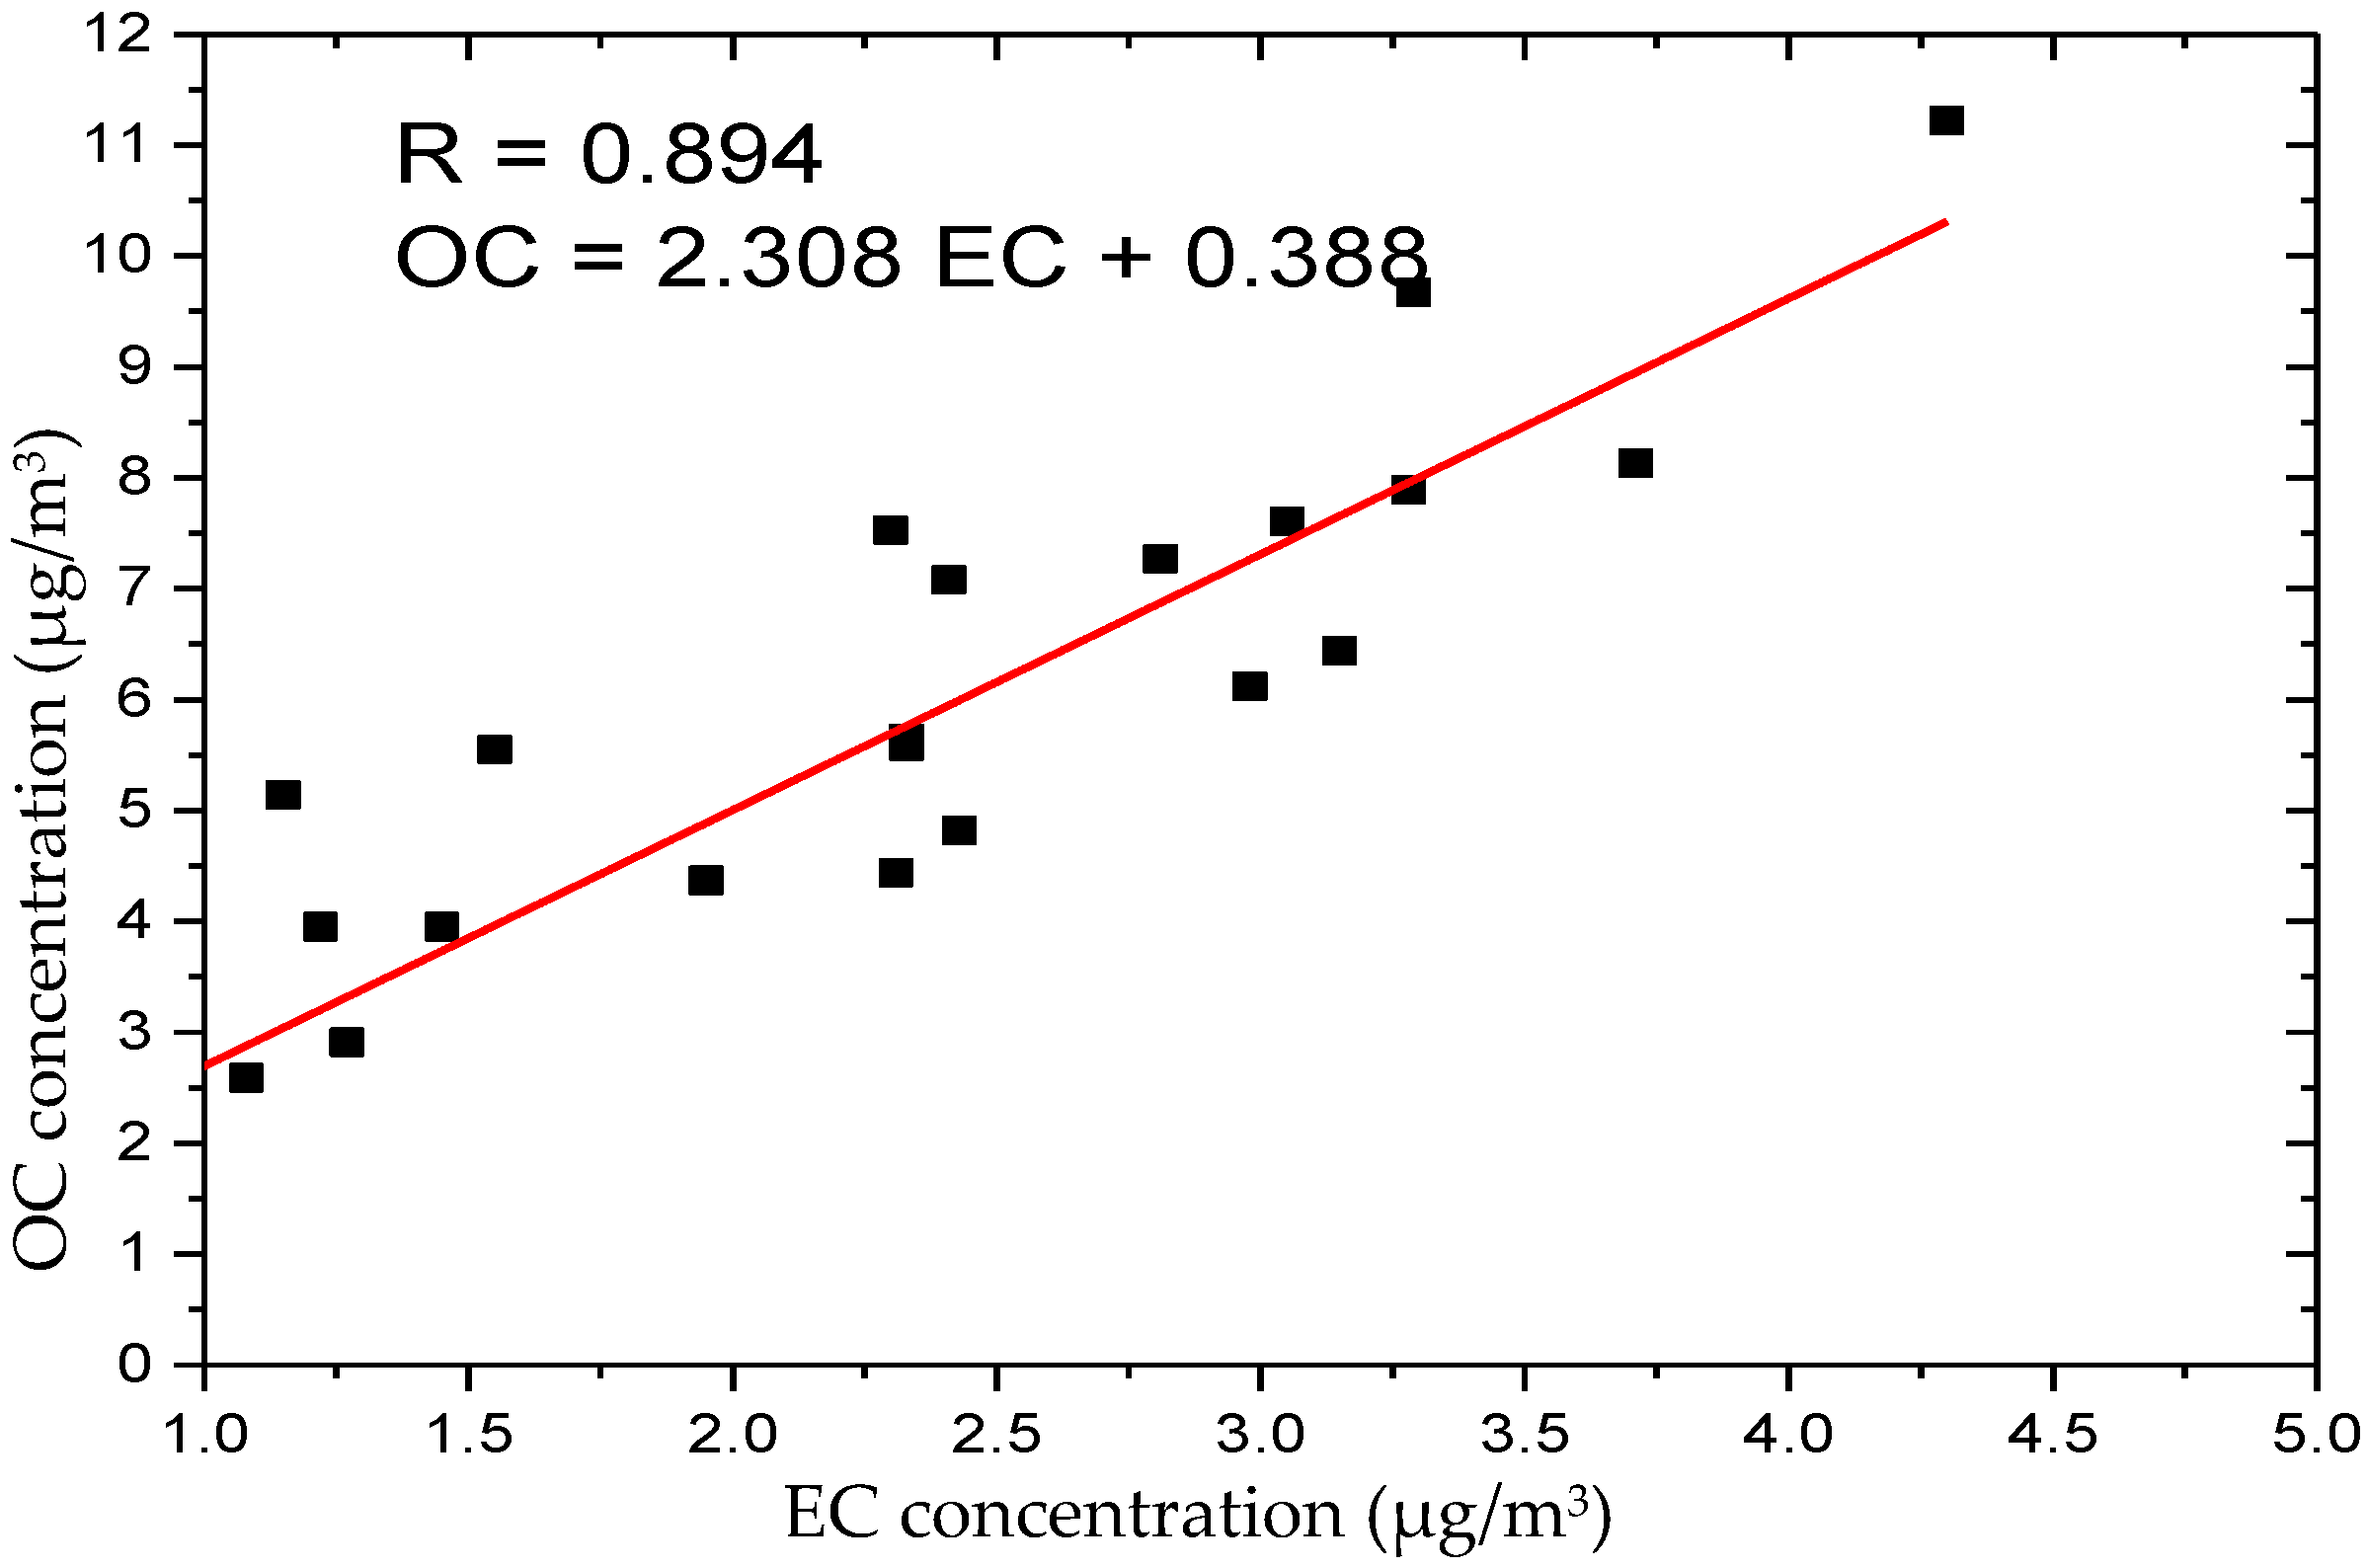
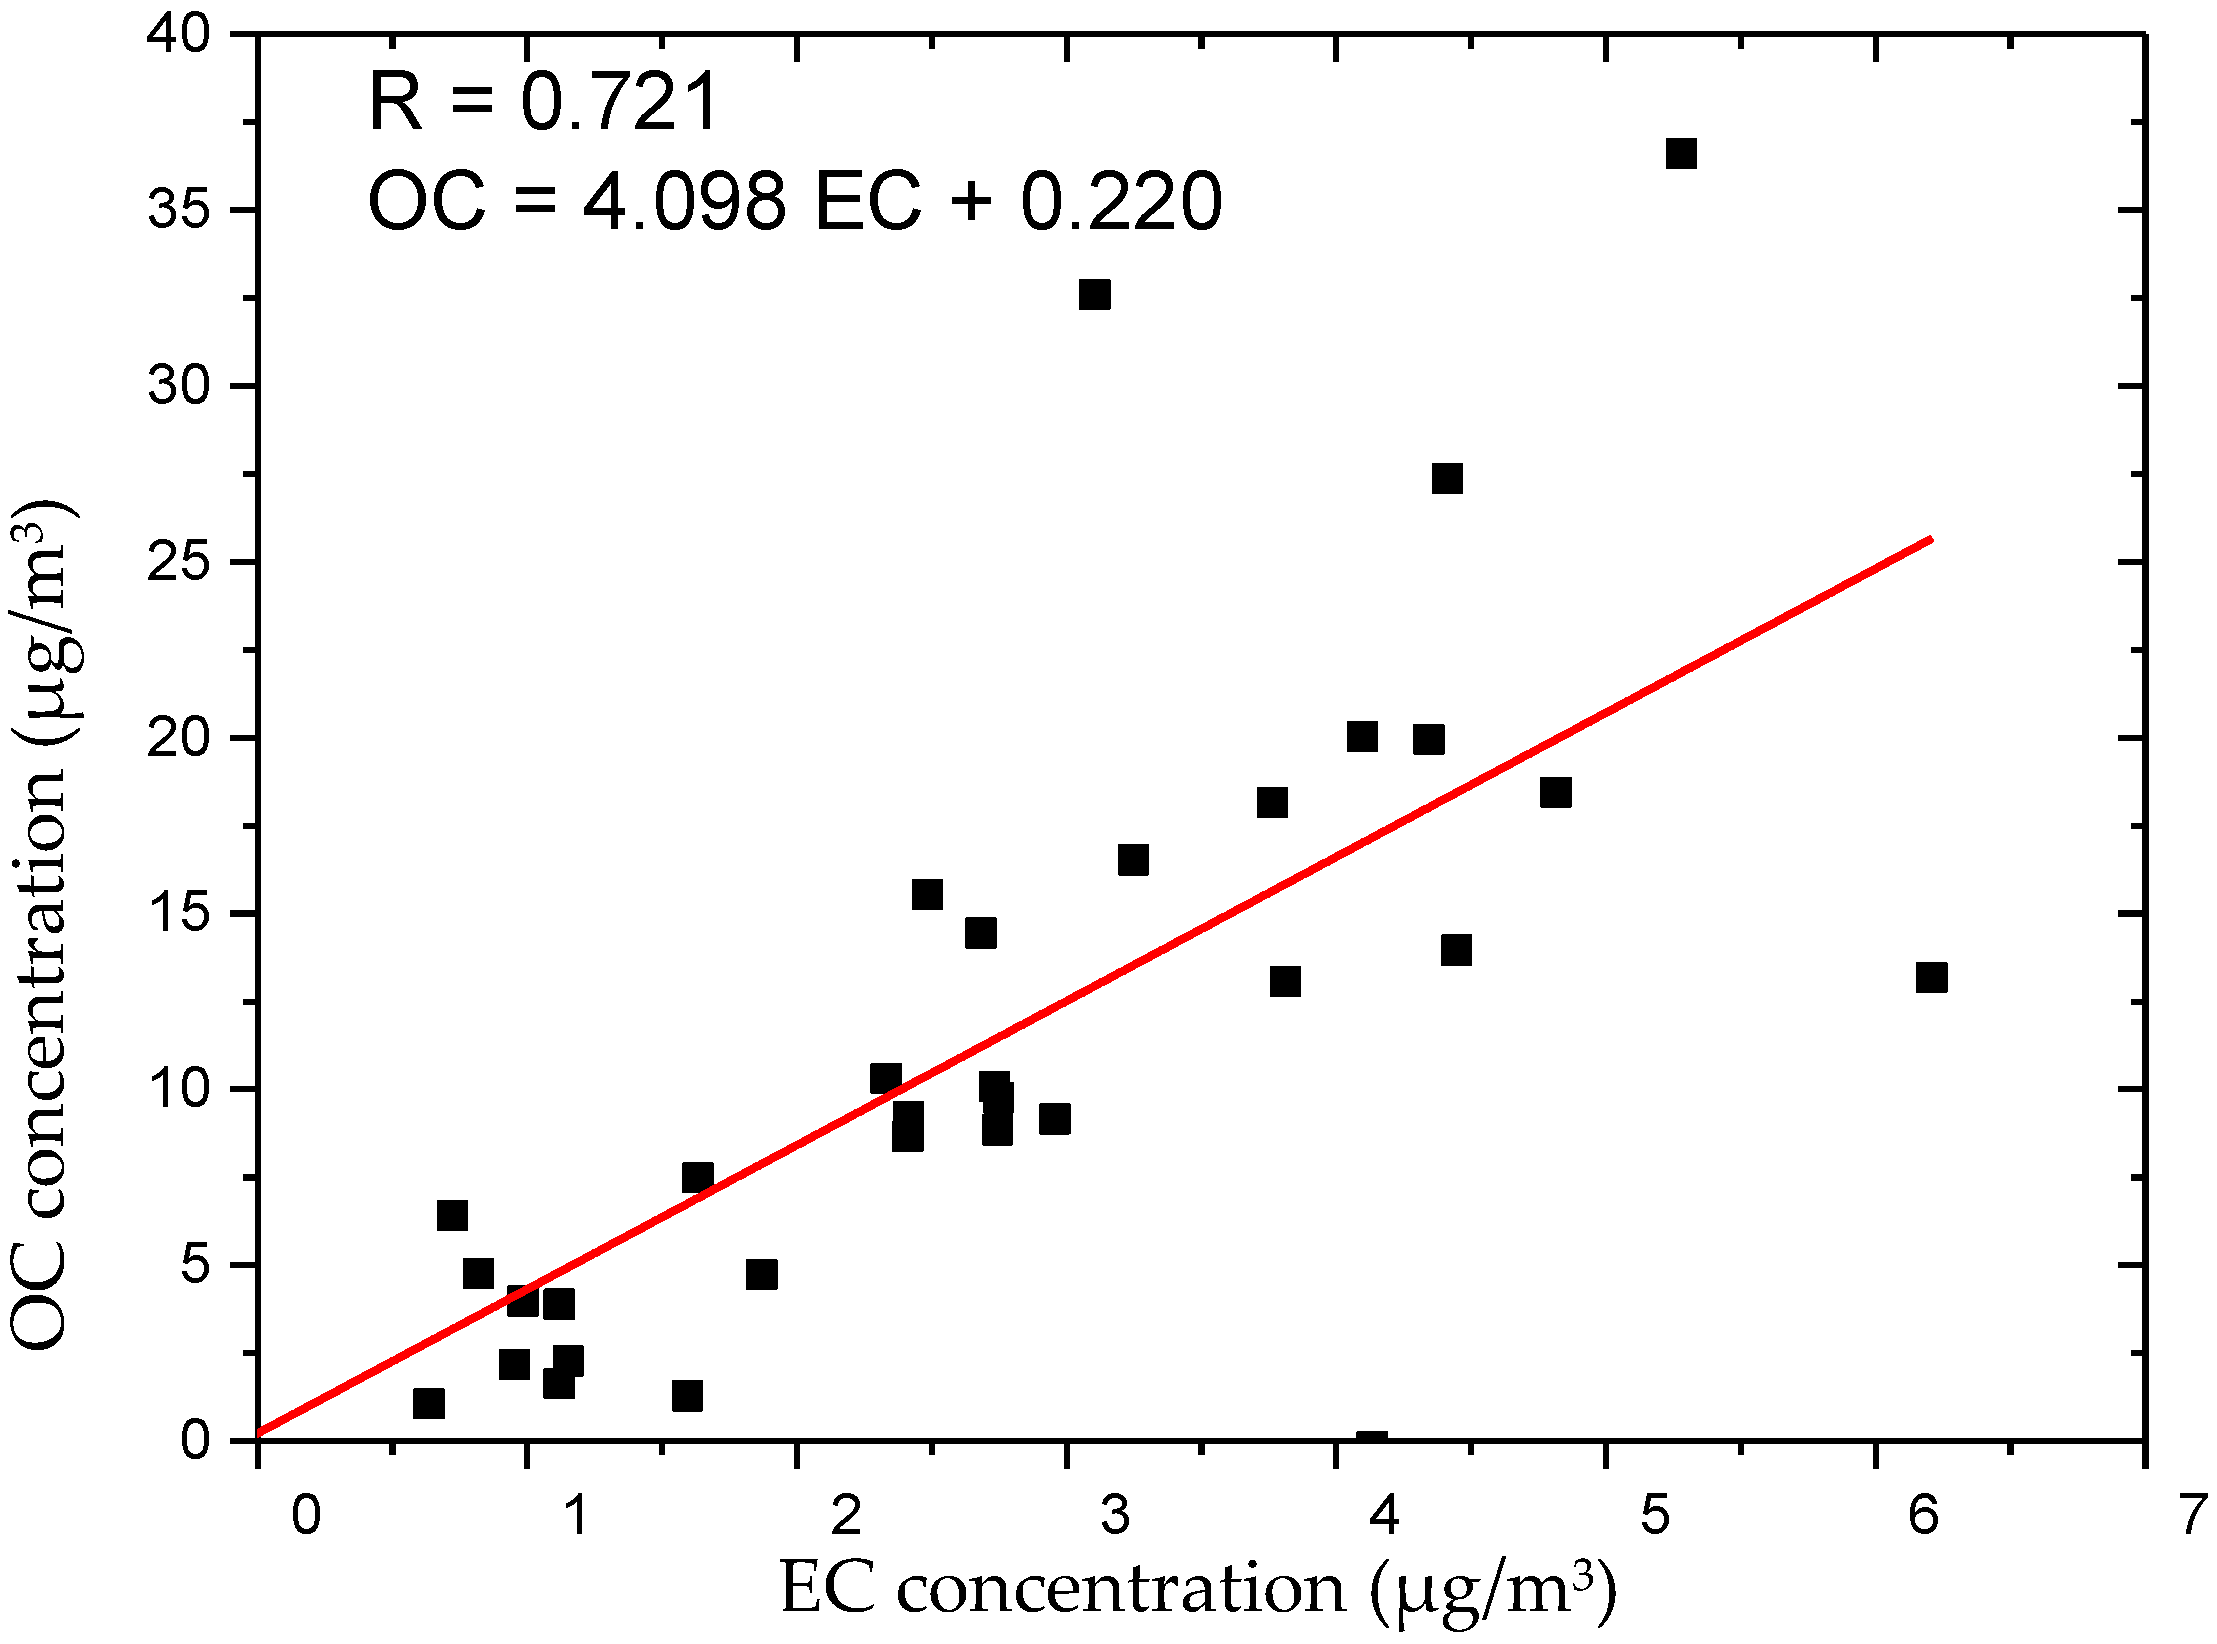
3.2. Estimation of SOC Concentrations
3.3. Source Apportionment of Carbonaceous Species
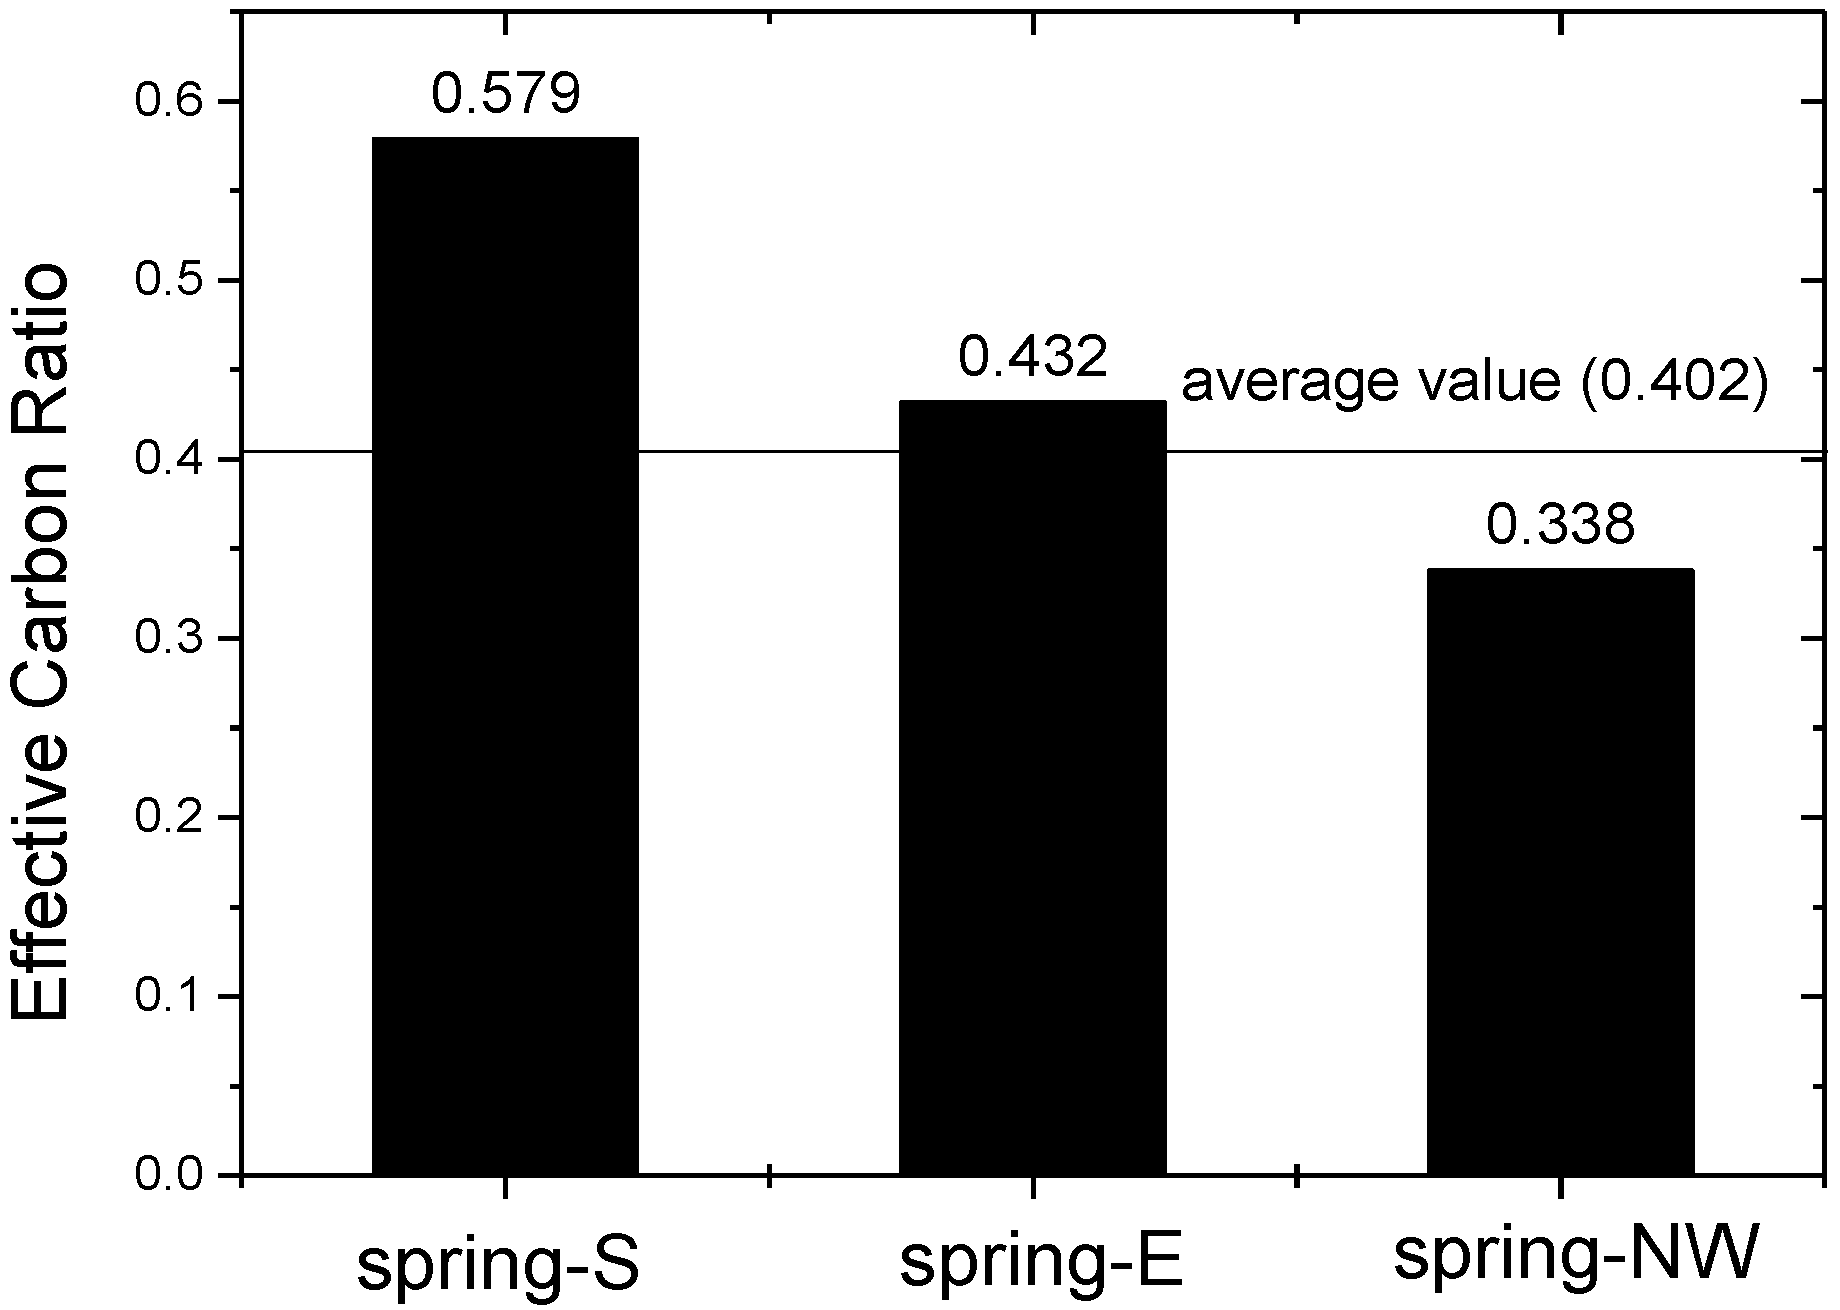
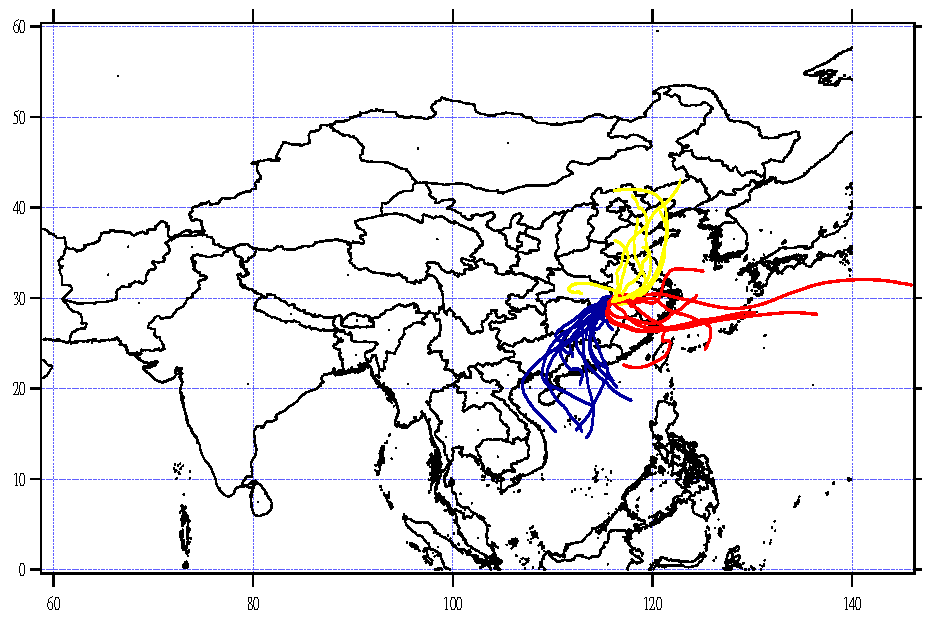
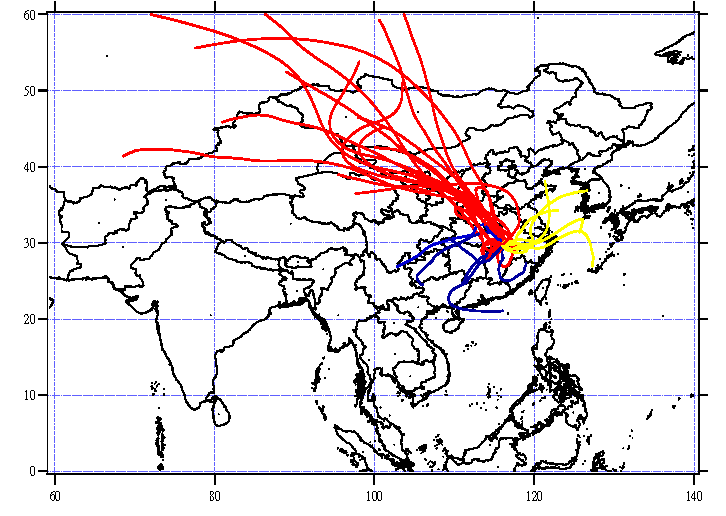
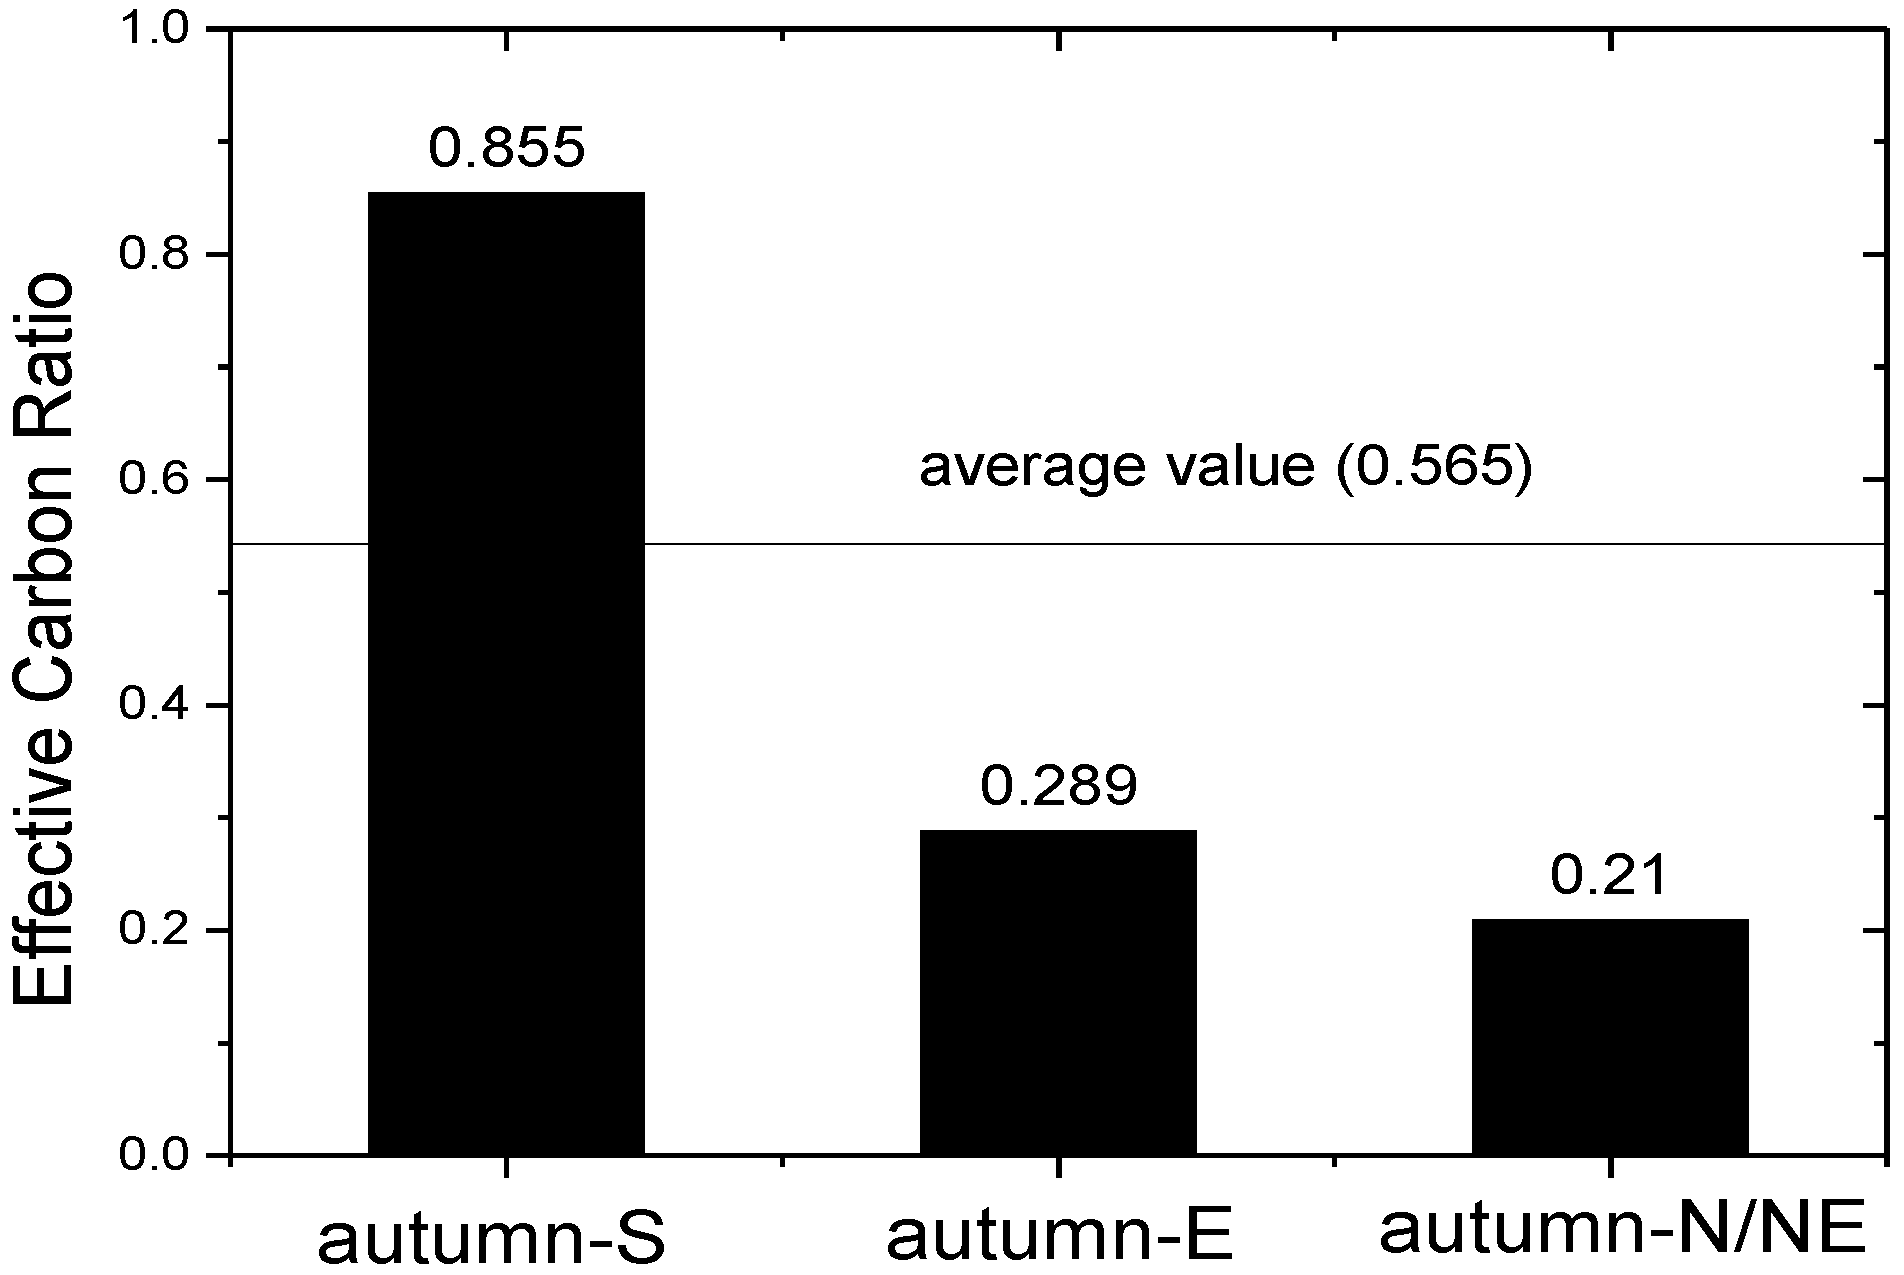
3.4. Long-Range Transport of Carbonaceous Aerosol
4. Conclusions
Acknowledgments
Author Contributions
Conflicts of Interest
References
- Srinivas, B.; Sarin, M. PM2.5, EC and OC in atmospheric outflow from the Indo-Gangetic Plain: Temporal variability and aerosol organic carbon-to-organic mass conversion factor. Sci. Total. Environ. 2014, 487, 196–205. [Google Scholar] [CrossRef] [PubMed]
- Li, P.H.; Wang, Y.; Li, T.; Sun, L.; Yi, X.; Guo, L.Q.; Su, R.H. Characterization of carbonaceous aerosols at Mount Lu in South China: Implication for secondary organic carbon formation and long-range transport. Environ. Sci. Pollut. R. 2015, 22, 14189–14199. [Google Scholar] [CrossRef] [PubMed]
- Wang, X.; Jing, H.; Dhungel, B.; Wang, W.N.; Kumfer, B.M.; Axelbaum, R.L.; Biswas, P. Characterization of organic and black carbon aerosol formation during coal combustion: An experimental study in a 1 MW pilot scale coal combustor. Fuel 2016, 180, 653–658. [Google Scholar] [CrossRef]
- Vignati, E.; Karl, M.; Krol, M.; Wilson, J.; Stier, P.; Cavalli, F. Sources of uncertainties in modelling black carbon at the global scale. Atmos. Chem. Phy. 2010, 10, 2595–2611. [Google Scholar] [CrossRef]
- Li, P.; Han, B.; Huo, J.; Lu, B.; Ding, X.; Chen, L.; Kong, S.F.; Bai, Z.P.; Wang, B. Characterization, meteorological influences and source identification of carbonaceous aerosols during the autumn-winter period in Tianjin, China. Aerosol Air Qual. Res. 2012, 12, 283–294. [Google Scholar] [CrossRef]
- Safai, P.D.; Raju, M.P.; Rao, P.S.P.; Pandithurai, G. Characterization of carbonaceous aerosols over the urban tropical location and a new approach to evaluate their climatic importance. Atmos. Environ. 2014, 92, 493–500. [Google Scholar] [CrossRef]
- Volkamer, R.; Ziemann, P.; Molina, M. Secondary organic aerosol formation from acetylene (C 2 H 2): Seed effect on SOA yields due to organic photochemistry in the aerosol aqueous phase. Atmos. Chem. Phys. 2009, 9, 1907–1928. [Google Scholar] [CrossRef]
- Zhou, S.; Wang, Z.; Gao, R.; Xue, L.; Yuan, C.; Wang, T.; Gao, X.; Wang, X.; Nie, W.; Xu, Z.; et al. Formation of secondary organic carbon and long-range transport of carbonaceous aerosols at Mount Heng in South China. Atmos. Environ. 2012, 63, 203–212. [Google Scholar] [CrossRef]
- Yang, F.; Tan, J.; Zhao, Q.; Du, Z.; He, K.; Ma, Y.; Duan, F.; Chen, G. Characteristics of PM2.5 speciation in representative megacities and across China. Atmos. Chem. Phys. 2011, 11, 5207–5219. [Google Scholar] [CrossRef]
- Chen, Y.; Schleicher, N.; Cen, K.; Liu, X.; Yu, Y.; Zibat, V.; Dietze, V.; Fricker, M.; Kaminski, U.; Chen, Y.; et al. Evaluation of impact factors on PM2.5 based on long-term chemical components analyses in the megacity Beijing, China. Chemosphere 2016, 155, 234–242. [Google Scholar] [CrossRef] [PubMed]
- Zhang, Y.; Huang, W.; Cai, T.; Fang, D.; Wang, Y.; Song, J.; Hu, M.; Zhang, Y. Concentrations and chemical compositions of fine particles (PM2.5) during haze and non-haze days in Beijing. Atmos. Res. 2016, 174, 62–69. [Google Scholar] [CrossRef]
- Gu, J.; Bai, Z.; Liu, A.; Wu, L.; Xie, Y.; Li, W.; Dong, H.; Zhang, X. Characterization of atmospheric organic carbon and element carbon of PM2.5 and PM10 at Tianjin, China. Aerosol Air Qual. Res. 2010, 10, 167–176. [Google Scholar] [CrossRef]
- Cao, J.; Lee, S.; Ho, K.; Zhang, X.; Zou, S.; Fung, K.; Chow, J.C.; Watson, J.G. Characteristics of carbonaceous aerosol in Pearl River Delta Region, China during 2001 winter period. Atmos. Environ. 2003, 37, 1451–1460. [Google Scholar] [CrossRef]
- Cao, J.J.; Lee, S.C.; Ho, K.F.; Zou, S.C.; Fung, K.; Li, Y.; Watson, J.G.; Chow, J.C. Spatial and seasonal variations of atmospheric organic carbon and elemental carbon in Pearl River Delta Region, China. Atmos. Environ. 2004, 38, 4447–4456. [Google Scholar] [CrossRef]
- Cao, J.; Wu, F.; Chow, J.; Lee, S.; Li, Y.; Chen, S.; An, Z.; Fung, K.; Watson, J.; Zhu, C. Characterization and source apportionment of atmospheric organic and elemental carbon during fall and winter of 2003 in Xi’an, China. Atmos. Chem. Phy. 2005, 5, 3127–3137. [Google Scholar] [CrossRef]
- Watson, J.G.; Chow, J.C.; Houck, J.E. PM2.5 chemical source profiles for vehicle exhaust, vegetative burning, geological material, and coal burning in Northwestern Colorado during 1995. Chemosphere 2001, 43, 1141–1151. [Google Scholar] [CrossRef]
- Saarikoski, S.; Timonen, H.; Saarnio, K.; Aurela, M.; Jarvi, L.; Keronen, P.; Kerminen, V.M.; Hillamo, R. Sources of organic carbon in fine particulate matter in northern European urban air. Atmos. Chem. Phys. 2008, 8, 6281–6295. [Google Scholar] [CrossRef]
- Carrico, C.M.; Bergin, M.H.; Shrestha, A.B.; Dibb, J.E.; Gomes, L.; Harris, J.M. The importance of carbon and mineral dust to seasonal aerosol properties in the Nepal Himalaya. Atmos. Environ. 2003, 37, 2811–2824. [Google Scholar] [CrossRef]
- Qu, W.J.; Zhang, X.Y.; Arimoto, R.; Wang, Y.Q.; Wang, D.; Sheng, L.F.; Fu, G. Aerosol background at two remote CAWNET sites in western China. Sci. Total Environ. 2009, 407, 3518–3529. [Google Scholar] [CrossRef] [PubMed]
- Zhang, X.; Wang, Y.; Zhang, X.; Guo, W.; Gong, S. Carbonaceous aerosol composition over various regions of China during 2006. J. Geophys. Res. 2008, 113. [Google Scholar] [CrossRef]
- Lin, J.J.; Tai, H.S. Concentrations and distributions of carbonaceous species in ambient particles in Kaohsiung City, Taiwan. Atmos. Environ. 2001, 35, 2627–2636. [Google Scholar] [CrossRef]
- Cao, J.; Shen, Z.; Chow, J.C.; Qi, G.; Watson, J.G. Seasonal variations and sources of mass and chemical composition for PM10 aerosol in Hangzhou, China. Particuology 2009, 7, 161–168. [Google Scholar] [CrossRef]
- Turpin, B.J.; Huntzicker, J.J. Identification of secondary organic aerosol episodes and quantitation of primary and secondary organic aerosol concentrations during SCAQS. Atmos. Environ. 1995, 29, 3527–3544. [Google Scholar] [CrossRef]
- Pipal, A.S.; Tiwari, S.; Satsangi, P.G.; Taneja, A.; Bisht, D.S.; Srivastava, A.K.; Srivastava, M.K. Sources and characteristics of carbonaceous aerosols at Agra “World heritage site” and Delhi “capital city of India”. Environ. Sci. Pollut. R. 2014, 21, 8678–8691. [Google Scholar] [CrossRef] [PubMed]
- Yang, F.; He, K.; Ye, B.; Chen, X.; Cha, L.; Cadle, S.; Chan, T.; Mulawa, P. One-year record of organic and elemental carbon in fine particles in downtown Beijing and Shanghai. Atmos. Chem. Phys. 2005, 5, 1449–1457. [Google Scholar] [CrossRef]
- Pio, C.; Legrand, M.; Oliveira, T.; Afonso, J.; Santos, C.; Caseiro, A.; Fialho, P.; Barata, F.; Puxbaum, H.; Sanchez-Ochoa, A. Climatology of aerosol composition (organic versus inorganic) at nonurban sites on a west-east transect across Europe. J. Geophys. Res. 2007, 112. [Google Scholar] [CrossRef]
- Ram, K.; Sarin, M.; Tripathi, S. A 1 year record of carbonaceous aerosols from an urban site in the Indo-Gangetic Plain: Characterization, sources, and temporal variability. J. Geophys. Res. 2010, 115. [Google Scholar] [CrossRef]
- Cabada, J.C.; Pandis, S.N.; Subramanian, R.; Robinson, A.L.; Polidori, A.; Turpin, B. Estimating the secondary organic aerosol contribution to PM2.5 using the EC tracer method special issue of aerosol science and technology on findings from the fine particulate matter supersites program. Aerosol. Sci. Tech. 2004, 38, 140–155. [Google Scholar] [CrossRef]
- Strader, R.; Lurmann, F.; Pandis, S.N. Evaluation of secondary organic aerosol formation in winter. Atmos. Environ. 1999, 33, 4849–4863. [Google Scholar] [CrossRef]
- Lim, H.J.; Turpin, B.J. Origins of primary and secondary organic aerosol in Atlanta: Results of time-resolved measurements during the Atlanta supersite experiment. Environ. Sci. Technol. 2002, 36, 4489–4496. [Google Scholar] [CrossRef] [PubMed]
- Zhou, Y.; Xue, L.; Wang, T.; Gao, X.; Wang, Z.; Wang, X.; Zhang, J.; Zhang, Q.; Wang, W. Characterization of aerosol acidity at a high mountain site in central eastern China. Atmos. Environ. 2012, 51, 11–20. [Google Scholar] [CrossRef]
- Wang, Z.; Wang, T.; Guo, J.; Gao, R.; Xue, L.; Zhang, J.; Zhou, Y.; Zhou, X.; Zhang, Q.; Wang, W. Formation of secondary organic carbon and cloud impact on carbonaceous aerosols at Mount Tai, North China. Atmos. Environ. 2012, 46, 516–527. [Google Scholar] [CrossRef]
- Gillies, J.A.; Gertler, A.W. Comparison and evaluation of chemically speciated mobile source PM2.5 particulate matter profiles. J. Air. Waste Manag. 2000, 50, 1459–1480. [Google Scholar] [CrossRef]
- Gillies, J.; Gertler, A.; Sagebiel, J.; Dippel, N.W. On-road particulate matter (PM2.5 and PM10) emissions in the Sepulveda Tunnel, Los Angeles, California. Environ. Sci. Technol. 2001, 35, 1054–1063. [Google Scholar] [CrossRef] [PubMed]
- Ram, K.; Sarin, M.M.; Hegde, P. Atmospheric abundances of primary and secondary carbonaceous species at two high-altitude sites in India: Sources and temporal variability. Atmos. Environ. 2008, 42, 6785–6796. [Google Scholar] [CrossRef]
- Sudheer, A.; Sarin, M. Carbonaceous aerosols in MABL of Bay of Bengal: influence of continental outflow. Atmos. Environ. 2008, 42, 4089–4100. [Google Scholar] [CrossRef]
- Chow, J.C.; Watson, J.G.; Kuhns, H.; Etyemezian, V.; Lowenthal, D.H.; Crow, D.; Kohl, S.D.; Engelbrecht, J.P.; Green, M.C. Source profiles for industrial, mobile, and area sources in the Big Bend Regional Aerosol Visibility and Observational study. Chemosphere 2004, 54, 185–208. [Google Scholar] [CrossRef] [PubMed]
- Zhou, J.; Wang, Y.; Yue, T.; Li, Y.; Wai, K.M.; Wang, W. Origin and distribution of trace elements in high-elevation precipitation in southern China. Environ. Sci. Pollut. R. 2012, 19, 3389–3399. [Google Scholar] [CrossRef] [PubMed]


| Sample Numbers | EC | OC | OC/EC | TC (total carbon) | PM10 (particulate matter) | |||||||||||
|---|---|---|---|---|---|---|---|---|---|---|---|---|---|---|---|---|
| Ave | Min | Max | Ave | Min | Max | Ave | Min | Max | Ave | Min | Max | Ave | Min | Max | ||
| Spring | 35 | 2.58 | BDL | 6.21 | 10.58 | BDL | 36.61 | 3.91 | BDL | 10.50 | 0.28 | 1.62 | 41.89 | 97.87 | 33.60 | 193.74 |
| Autumn | 33 | 2.40 | 0.47 | 6.32 | 6.89 | 0.22 | 32.02 | 3.27 | 0.28 | 11.21 | 0.29 | 0.98 | 35.25 | 73.40 | 4.55 | 231.46 |
| Location | Size | Time Period | EC (μg/m3) | OC (μg/m3) | OC/EC | Analysis Method | Reference |
|---|---|---|---|---|---|---|---|
| Mount Lu, China | PM10 | August–September 2011 | 2.58 | 10.58 | 3.91 | TOR | this study |
| March–May 2012 | 2.40 | 6.89 | 3.27 | ||||
| Shangri-La,China | PM10 | 2006 | 0.34 | 3.1 | 11.9 | [20] | |
| Zhuzhang, China | PM10 | July 2004–March 2005 | 0.34 | 3.13 | 11.9 | TOR | [19] |
| Kathmandu, Nepal | PM10 | February–May 2000 | 1.5 | 14.37 | TOT | [18] | |
| Nagarkot, Nepal | PM10 | February–May 2000 | 0.94 | 14.375 | TOT | [18] | |
| Puy de Dome, France | PM10 | April–September 2004 | 0.26 | 2.4 | 10.6 | TOT | [26] |
| Kaohsiung, Taiwan | PM10 | November 1998–April 1999 | 6.1 | 14.5 | 2.4 | Elemental analyzer | [21] |
| Hangzhou, China | PM10 | September 2001–August 2002 | 4.06 | 21.41 | 5.27 | TOT | [22] |
| Species | Factor1 | Factor2 |
|---|---|---|
| OC1 | 0.824 | |
| OC2 | 0.643 | |
| OC3 | 0.893 | |
| OC4 | 0.840 | |
| EC1 | 0.852 | |
| EC2 | 0.802 | |
| EC3 | 0.926 | |
| OPC | 0.897 | |
| Percentage of the variance | 46.12% | 29.63% |
| Cumulative | 46.12% | 75.75% |
| Sources | Gasoline motor vehicle exhau + coal combustion | Diesel vehicle exhaust + biomass burning |
| Species | Factor1 | Factor2 | Factor3 |
|---|---|---|---|
| OC1 (organic carbon) | 0.924 | ||
| OC2 | 0.602 | ||
| OC3 | 0.899 | ||
| OC4 | 0.802 | ||
| EC1 (elemental carbon) | 0.925 | ||
| EC2 | 0.674 | ||
| EC3 | 0.867 | ||
| OPC | 0.899 | ||
| Percentage of the variance | 47.51% | 20.48% | 16.08% |
| Cumulative | 47.51% | 67.98% | 84.07% |
| Sources | gasoline motor vehicle exhaust + coal combustion | diesel vehicle exhaust | biomass burning |
| Air Mass Trajectory | Occurrence Percentage (%) | Mean Concentration | OC/EC | OC/PM | EC/PM | SOC | SOC/OC | ||
|---|---|---|---|---|---|---|---|---|---|
| PM10 | OC | EC | |||||||
| S | 43.75% | 66.58 | 8.01 | 1.99 | 4.48 | 16.97% | 7.39% | 4.22 | 37.46% |
| E | 31.25% | 70.52 | 6.11 | 3.01 | 2.21 | 9.43% | 4.29% | 1.89 | 26.47% |
| N/NE | 25% | 92.33 | 6.81 | 2.70 | 2.52 | 0.0761 | 0.0297 | 1.71 | 22.85% |
| Air mass trajectory | Occurrence Percentage (%) | Mean Concentration | OC/EC | OC/PM | EC/PM | SOC | SOC/OC | ||
|---|---|---|---|---|---|---|---|---|---|
| PM10 | OC | EC | |||||||
| S | 18.75% | 90.18 | 13.98 | 2.67 | 4.39 | 13.86% | 2.84% | 8.15 | 26.95% |
| E | 18.75% | 101.54 | 20.22 | 3.92 | 4.89 | 22.84% | 4.47% | 8.55 | 32.29% |
| NW | 62.5% | 98.53 | 7.77 | 2.28 | 3.77 | 7.53% | 2.42% | 2.19 | 24.94% |
© 2016 by the authors; licensee MDPI, Basel, Switzerland. This article is an open access article distributed under the terms and conditions of the Creative Commons Attribution (CC-BY) license (http://creativecommons.org/licenses/by/4.0/).
Share and Cite
Jia, H.-y.; Wang, L.; Li, P.-h.; Wang, Y.; Guo, L.-q.; Li, T.; Sun, L.; Shou, Y.-p.; Mao, T.-y.; Yi, X.-l. Characterization, Long-Range Transport and Source Identification of Carbonaceous Aerosols during Spring and Autumn Periods at a High Mountain Site in South China. Atmosphere 2016, 7, 122. https://doi.org/10.3390/atmos7100122
Jia H-y, Wang L, Li P-h, Wang Y, Guo L-q, Li T, Sun L, Shou Y-p, Mao T-y, Yi X-l. Characterization, Long-Range Transport and Source Identification of Carbonaceous Aerosols during Spring and Autumn Periods at a High Mountain Site in South China. Atmosphere. 2016; 7(10):122. https://doi.org/10.3390/atmos7100122
Chicago/Turabian StyleJia, Hong-yan, Lei Wang, Peng-hui Li, Yan Wang, Li-qiong Guo, Tao Li, Lei Sun, You-ping Shou, Tian-yu Mao, and Xian-liang Yi. 2016. "Characterization, Long-Range Transport and Source Identification of Carbonaceous Aerosols during Spring and Autumn Periods at a High Mountain Site in South China" Atmosphere 7, no. 10: 122. https://doi.org/10.3390/atmos7100122
APA StyleJia, H.-y., Wang, L., Li, P.-h., Wang, Y., Guo, L.-q., Li, T., Sun, L., Shou, Y.-p., Mao, T.-y., & Yi, X.-l. (2016). Characterization, Long-Range Transport and Source Identification of Carbonaceous Aerosols during Spring and Autumn Periods at a High Mountain Site in South China. Atmosphere, 7(10), 122. https://doi.org/10.3390/atmos7100122