3.1. Spatial Distribution
In the study conducted by Park
et al. [
9], the RegCM4, forced by the two BCs (ERA and R2), simulated the location of the precipitation zones related to the summer and winter monsoons fairly well over the CORDEX East Asia domain, when compared with GPCP (Global Precipitation Climatology Project) [
22] data. However, the summer precipitation was over-simulated in the Indochinese peninsula, southern China, and Japan regions, but under-simulated in the South Korea region, with different magnitudes according to the BCs [
9]. In winter, the RegCM4 showed a similar spatial pattern and magnitude in the most of the regions regardless of the BCs. However, some regions, such as southern China, the southern part of Indian Ocean, and the South China Sea, showed slightly different patterns according to the BCs. Detailed results on the simulation performance of RegCM4 for precipitation according to the BCs are presented by Park
et al. [
9].
In this study, as shown in
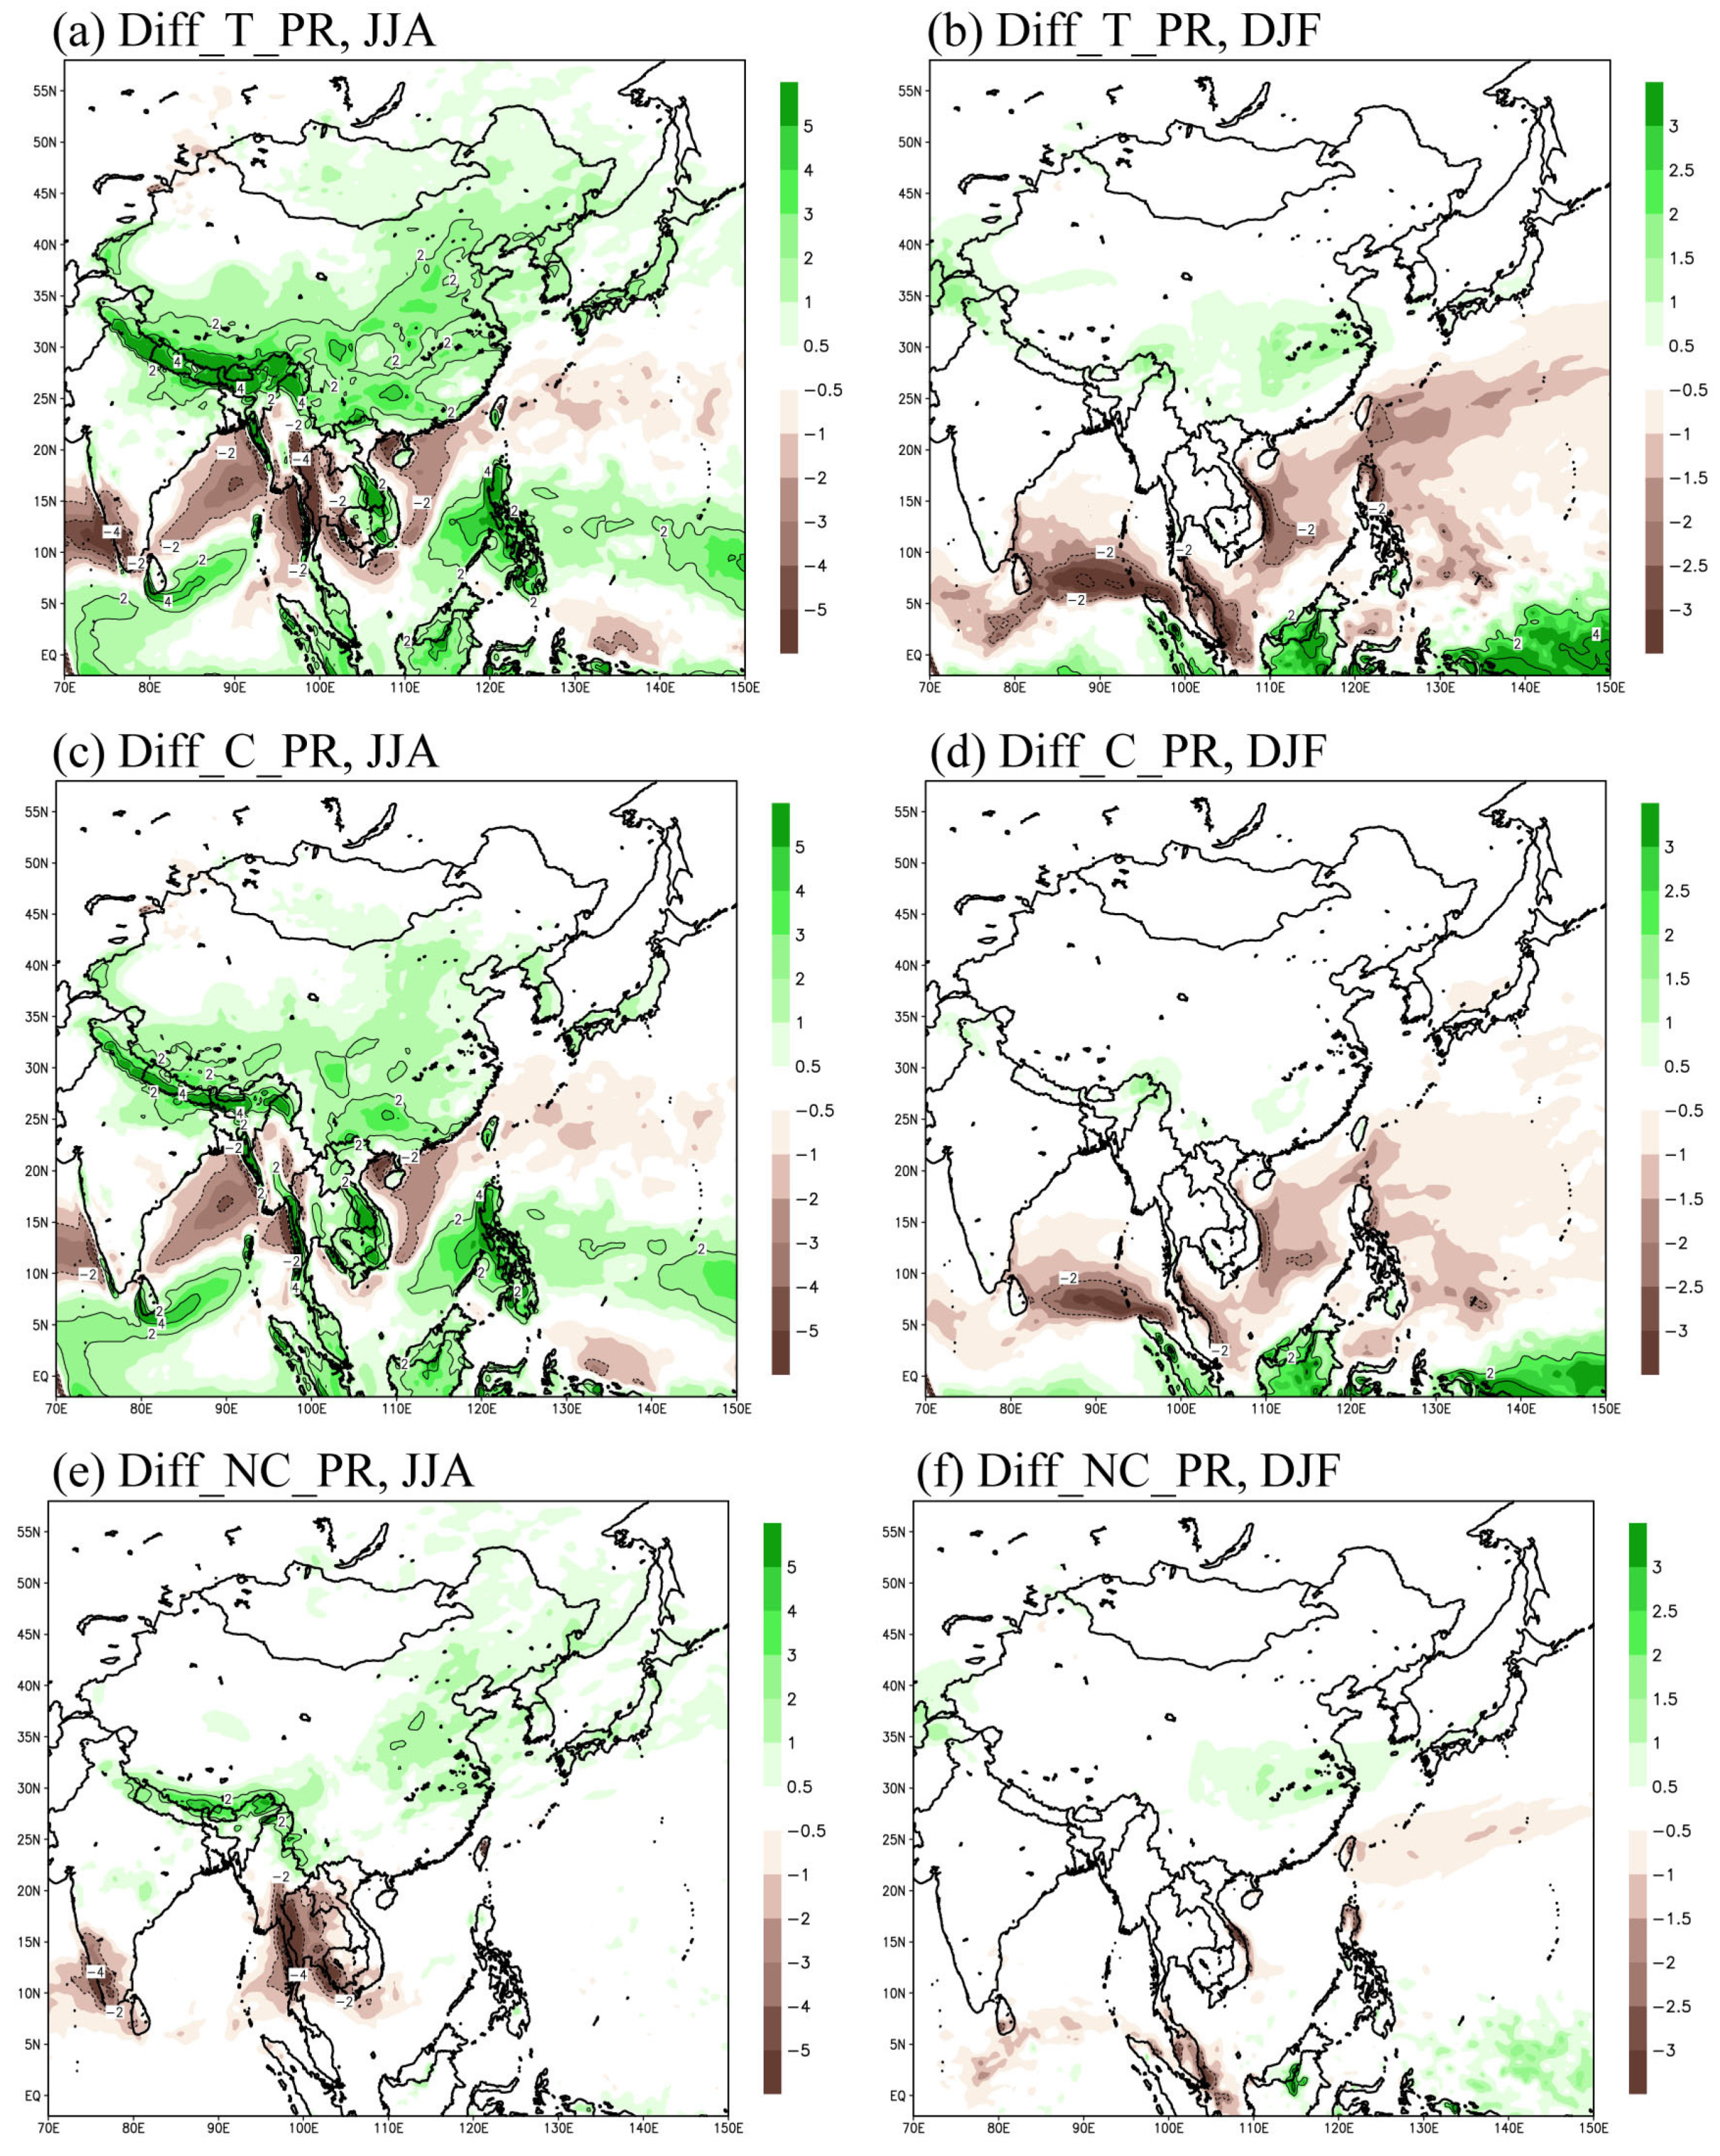
Figure 2, we performed a detailed analysis of the impacts of the BCs on the simulation of RegCM4 for precipitation types in the East Asian region. To compare the impacts of BCs more clearly, different scales are used for the color bars showing summer and winter precipitation. In summer, ERA_ReC over-simulated the total precipitation in most regions, except for the Bay of Bengal and the South China Sea, as compared to R2_ReC (
Figure 2a). Considerably more precipitation was simulated in ERA_ReC, particularly in the central China region, the Tibetan Plateau region, and the Philippines. These differences in total precipitation between ERA_ReC and R2_ReC were mainly due to the differences in convective precipitation rather than those in non-convective precipitation (
Figure 2c,e). On the other hand, no large differences in total precipitation were found for the most of the land region over East Asia in winter, when precipitation is minimal overall compared with the summer season. However, ERA_ReC slightly over-simulated the precipitation in southern China, while it under-simulated the precipitation in most ocean regions, such as the south Indian Ocean and the South China Sea, compared with R2_ReC. These differences are due to the combined differences between simulations of RegCM4 for non-convective precipitation and convective precipitation.
Figure 2.
Spatial distribution of precipitation differences (mm/day) between ERA_ReC and R2_ReC over 20 years (1989–2008). Left and right panels are the results for summer (JJA) and winter (DJF), respectively. Upper, middle, and lower panels indicate the differences in total precipitation (T_PR), convective precipitation (C_PR), and non-convective precipitation (NC_PR), respectively. To show a clear comparison of RegCM4’s performance for precipitation, different color bar scales were applied for summer and winter.
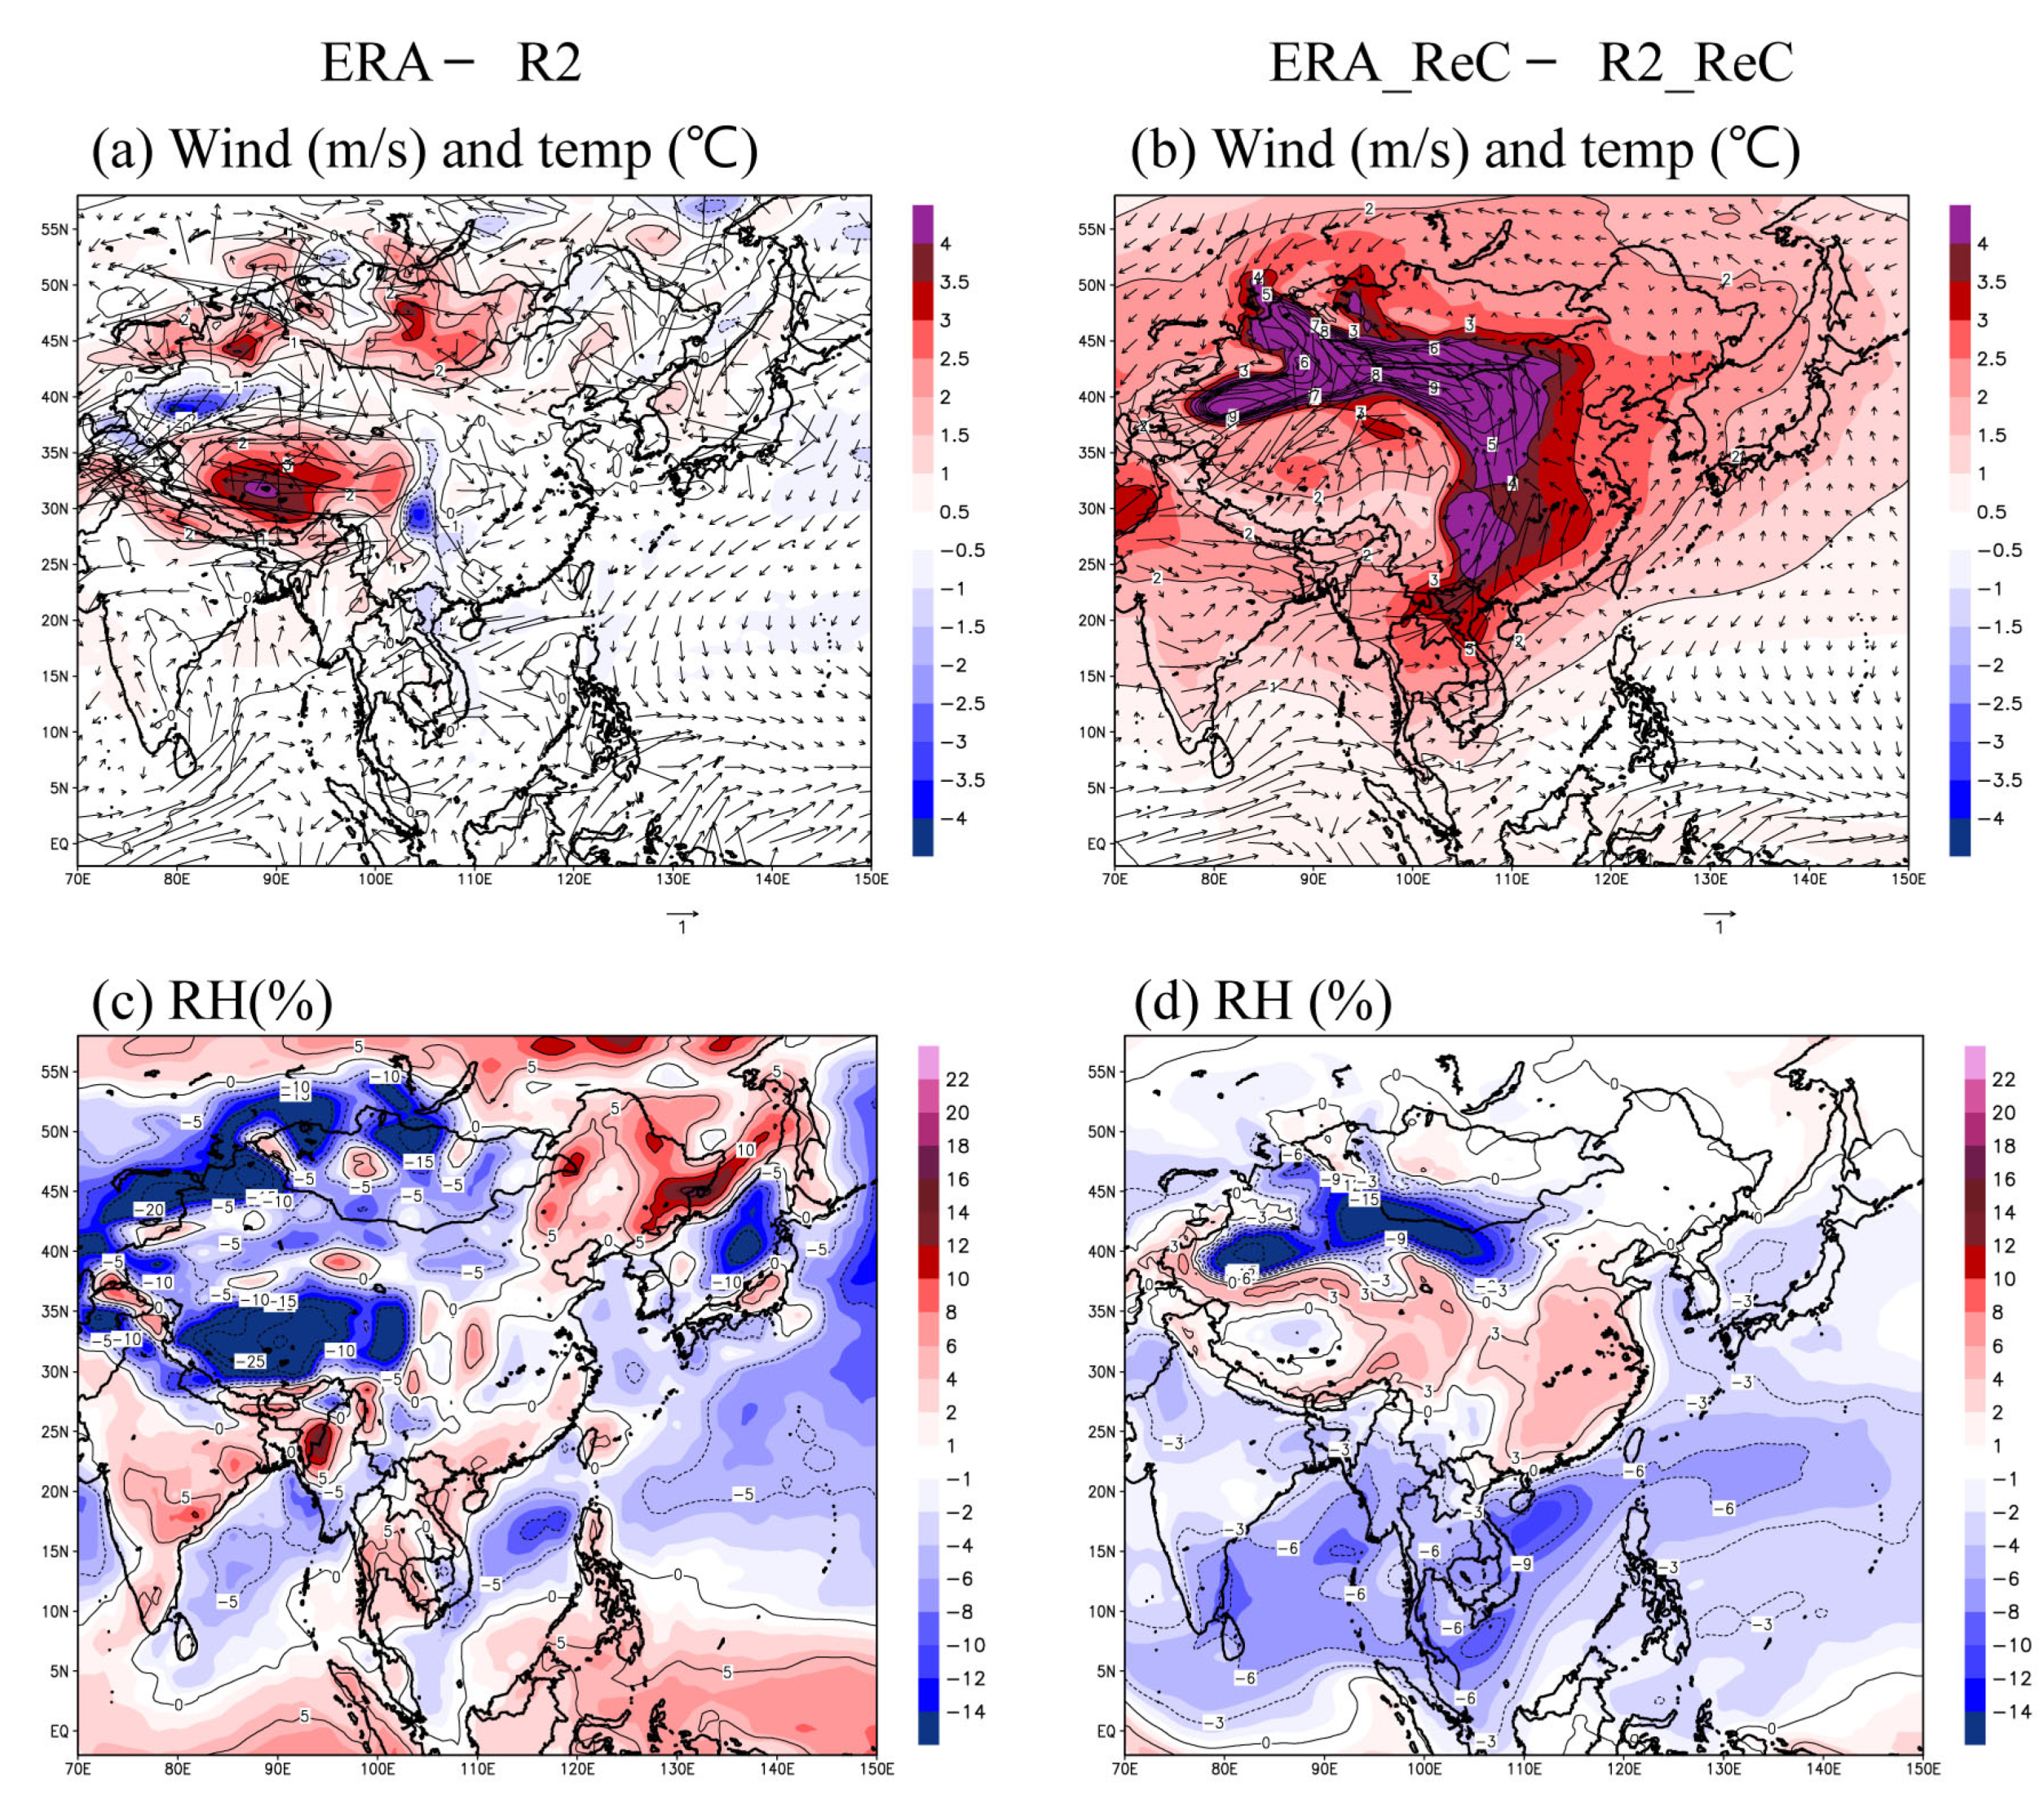
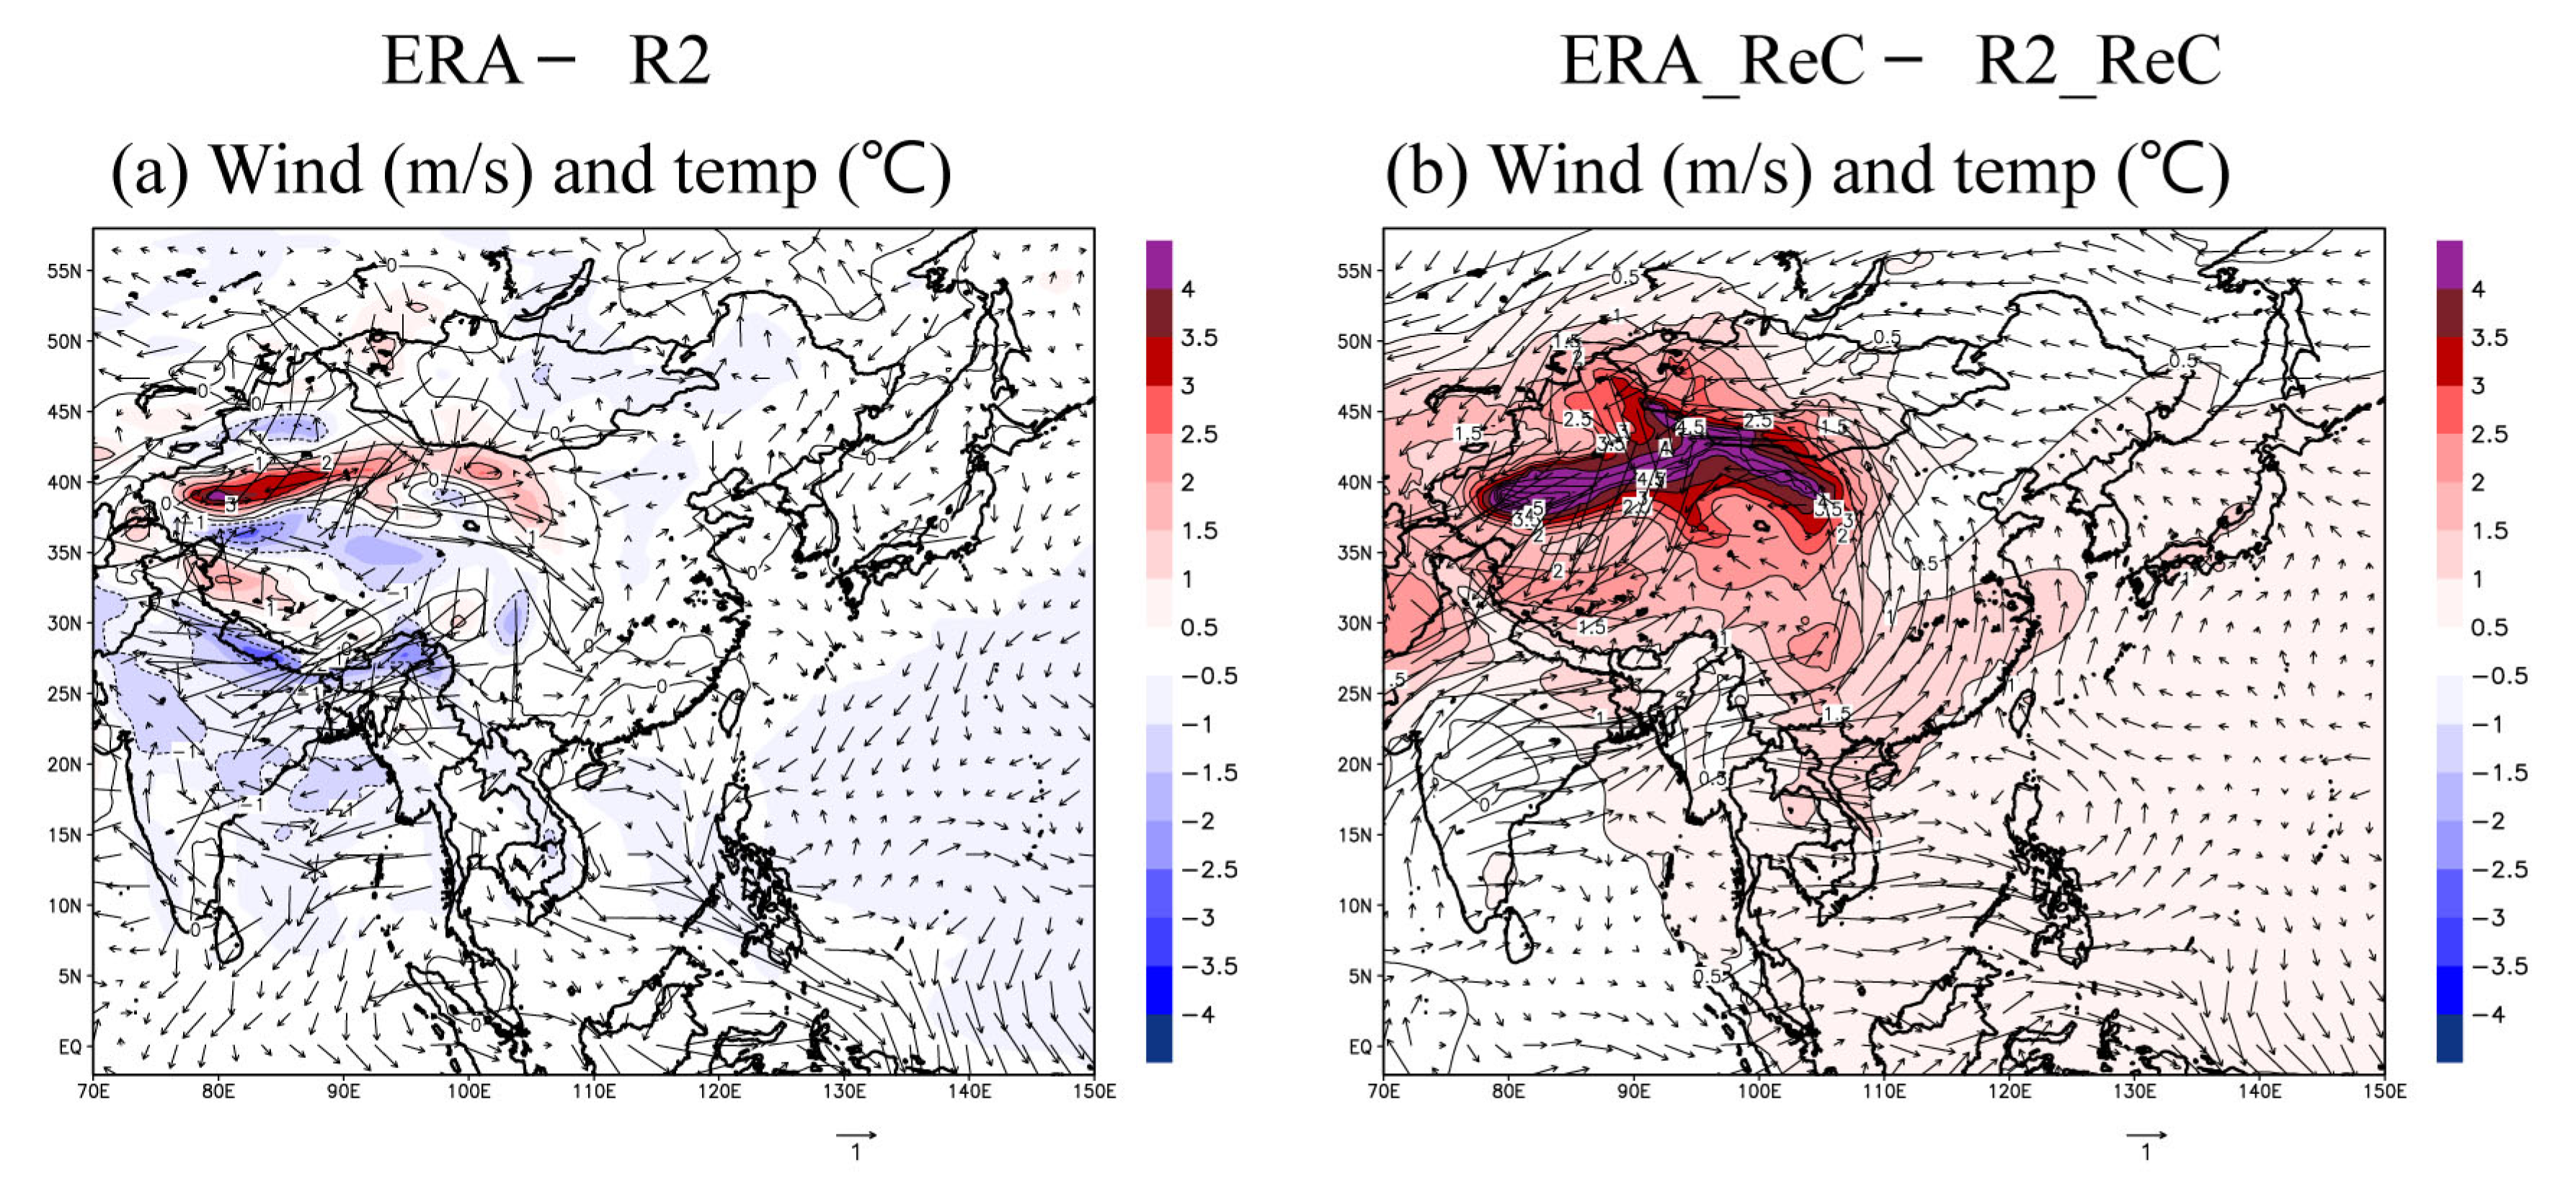
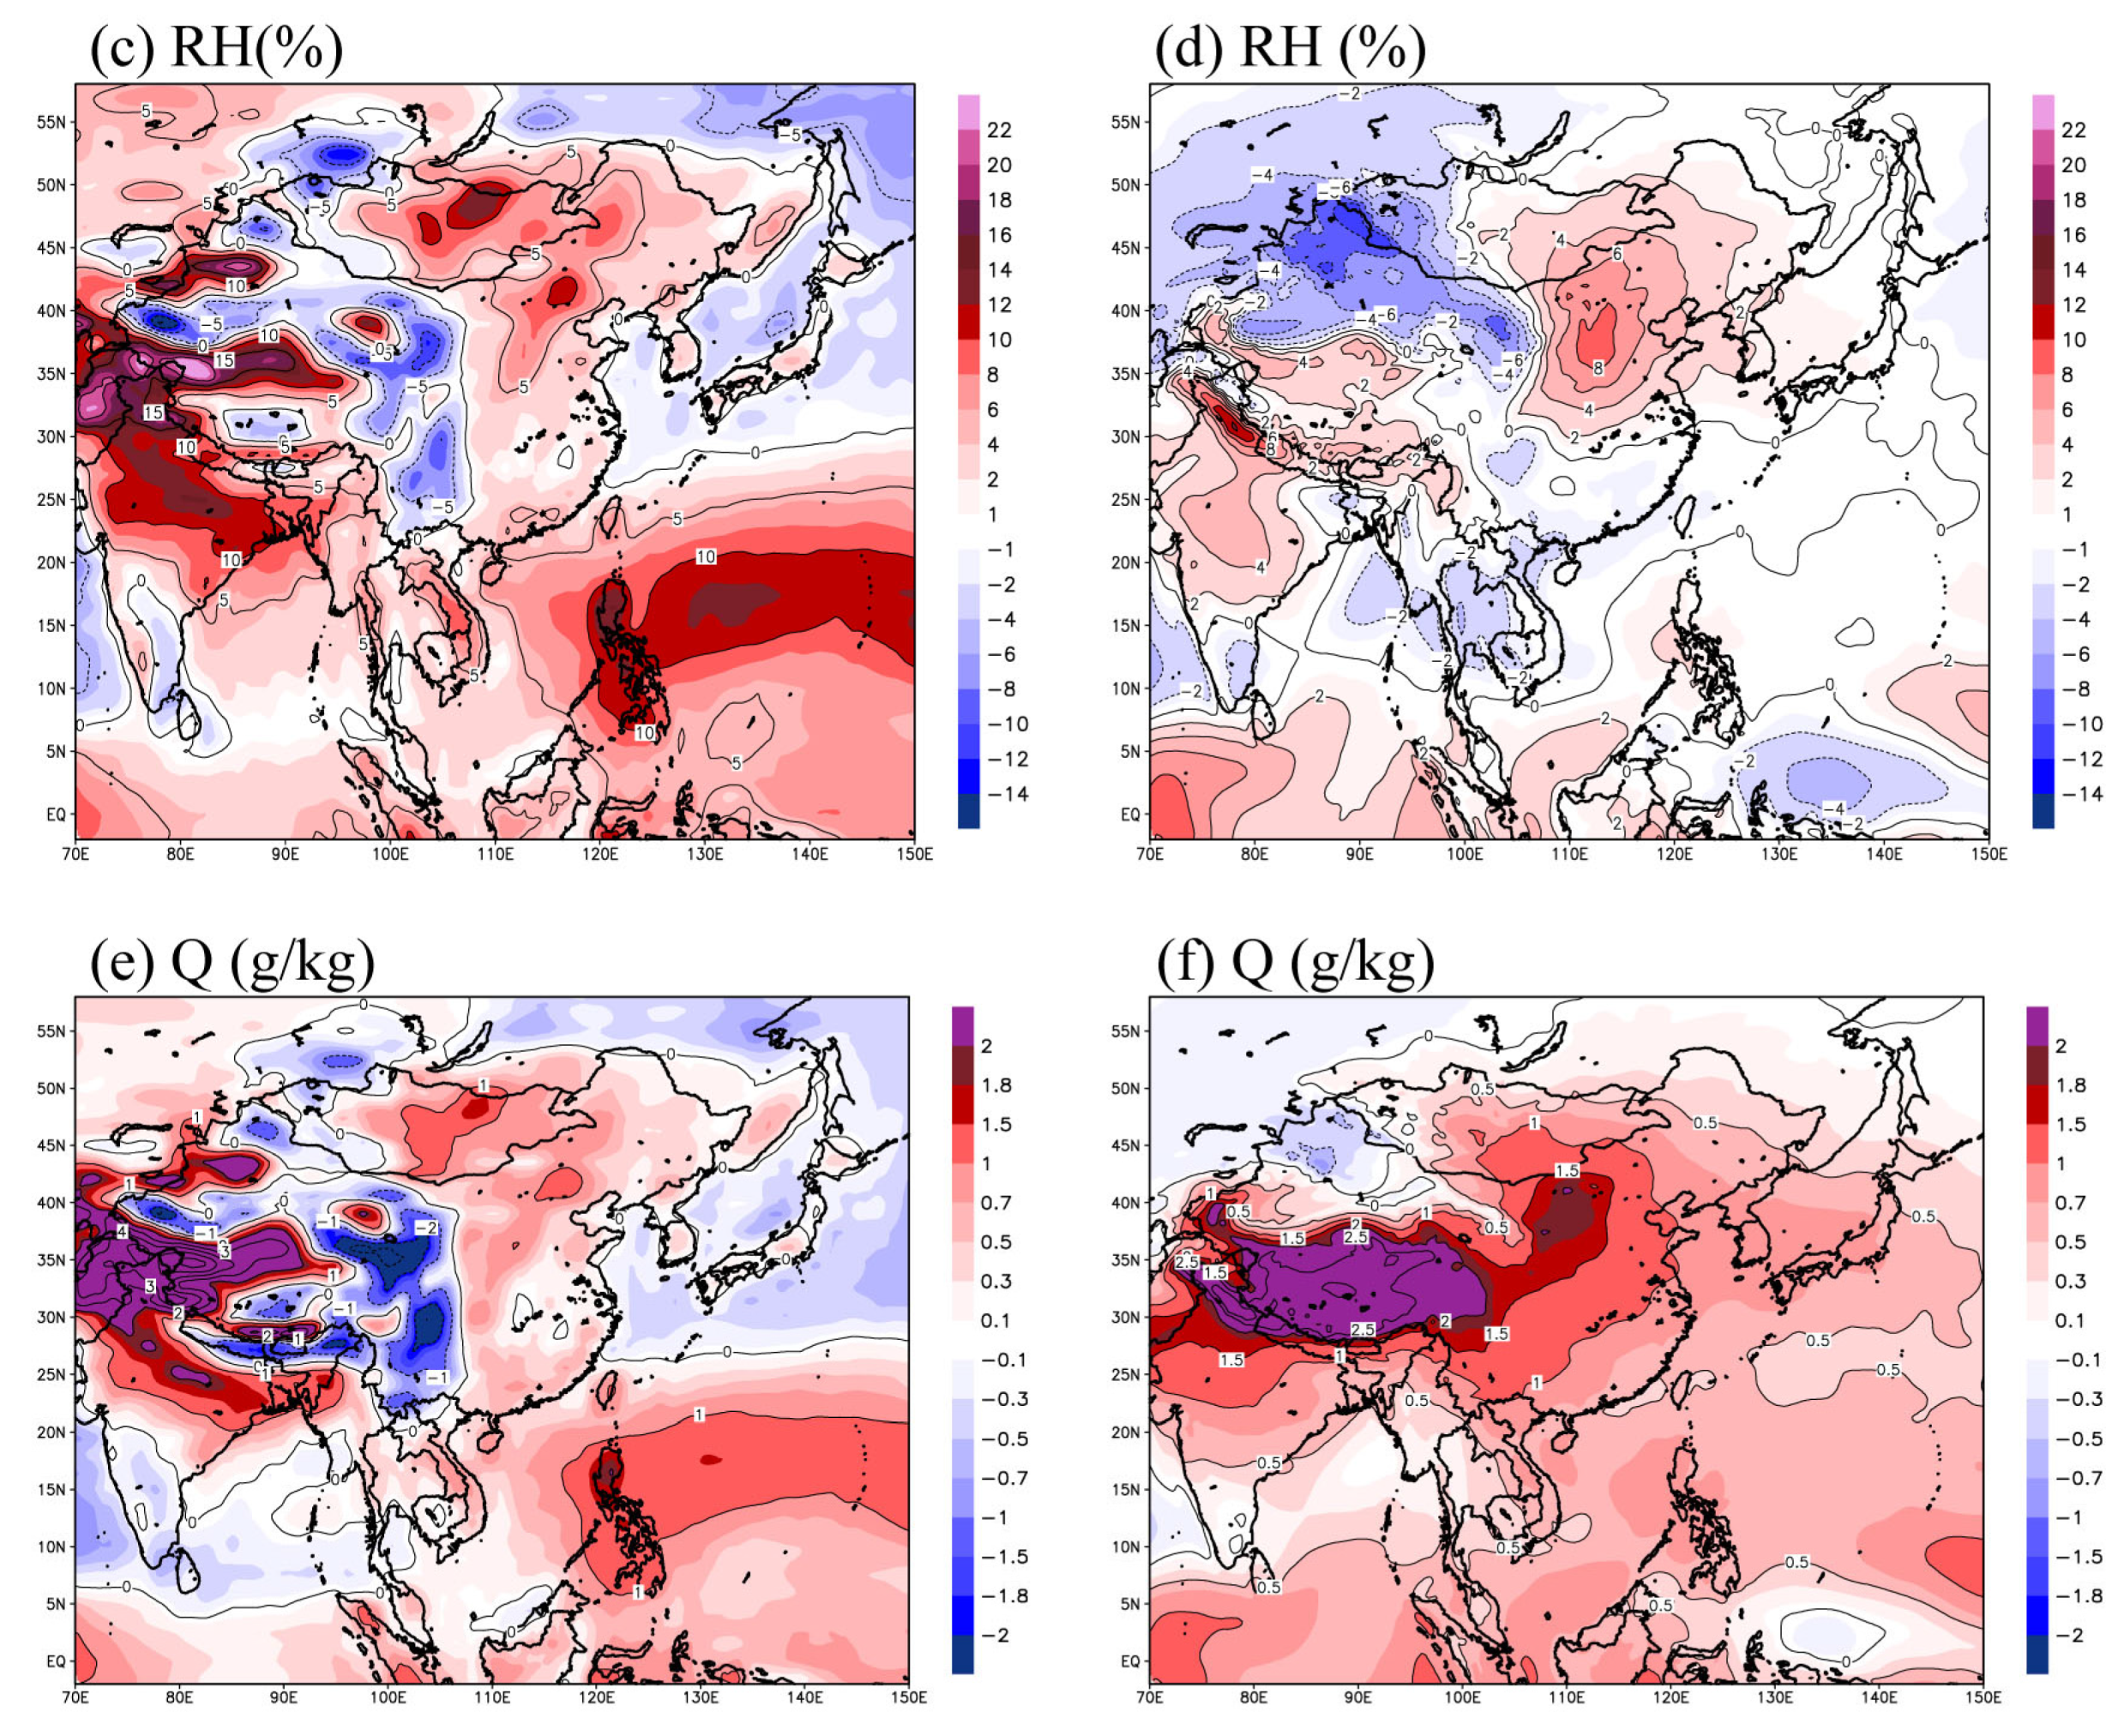
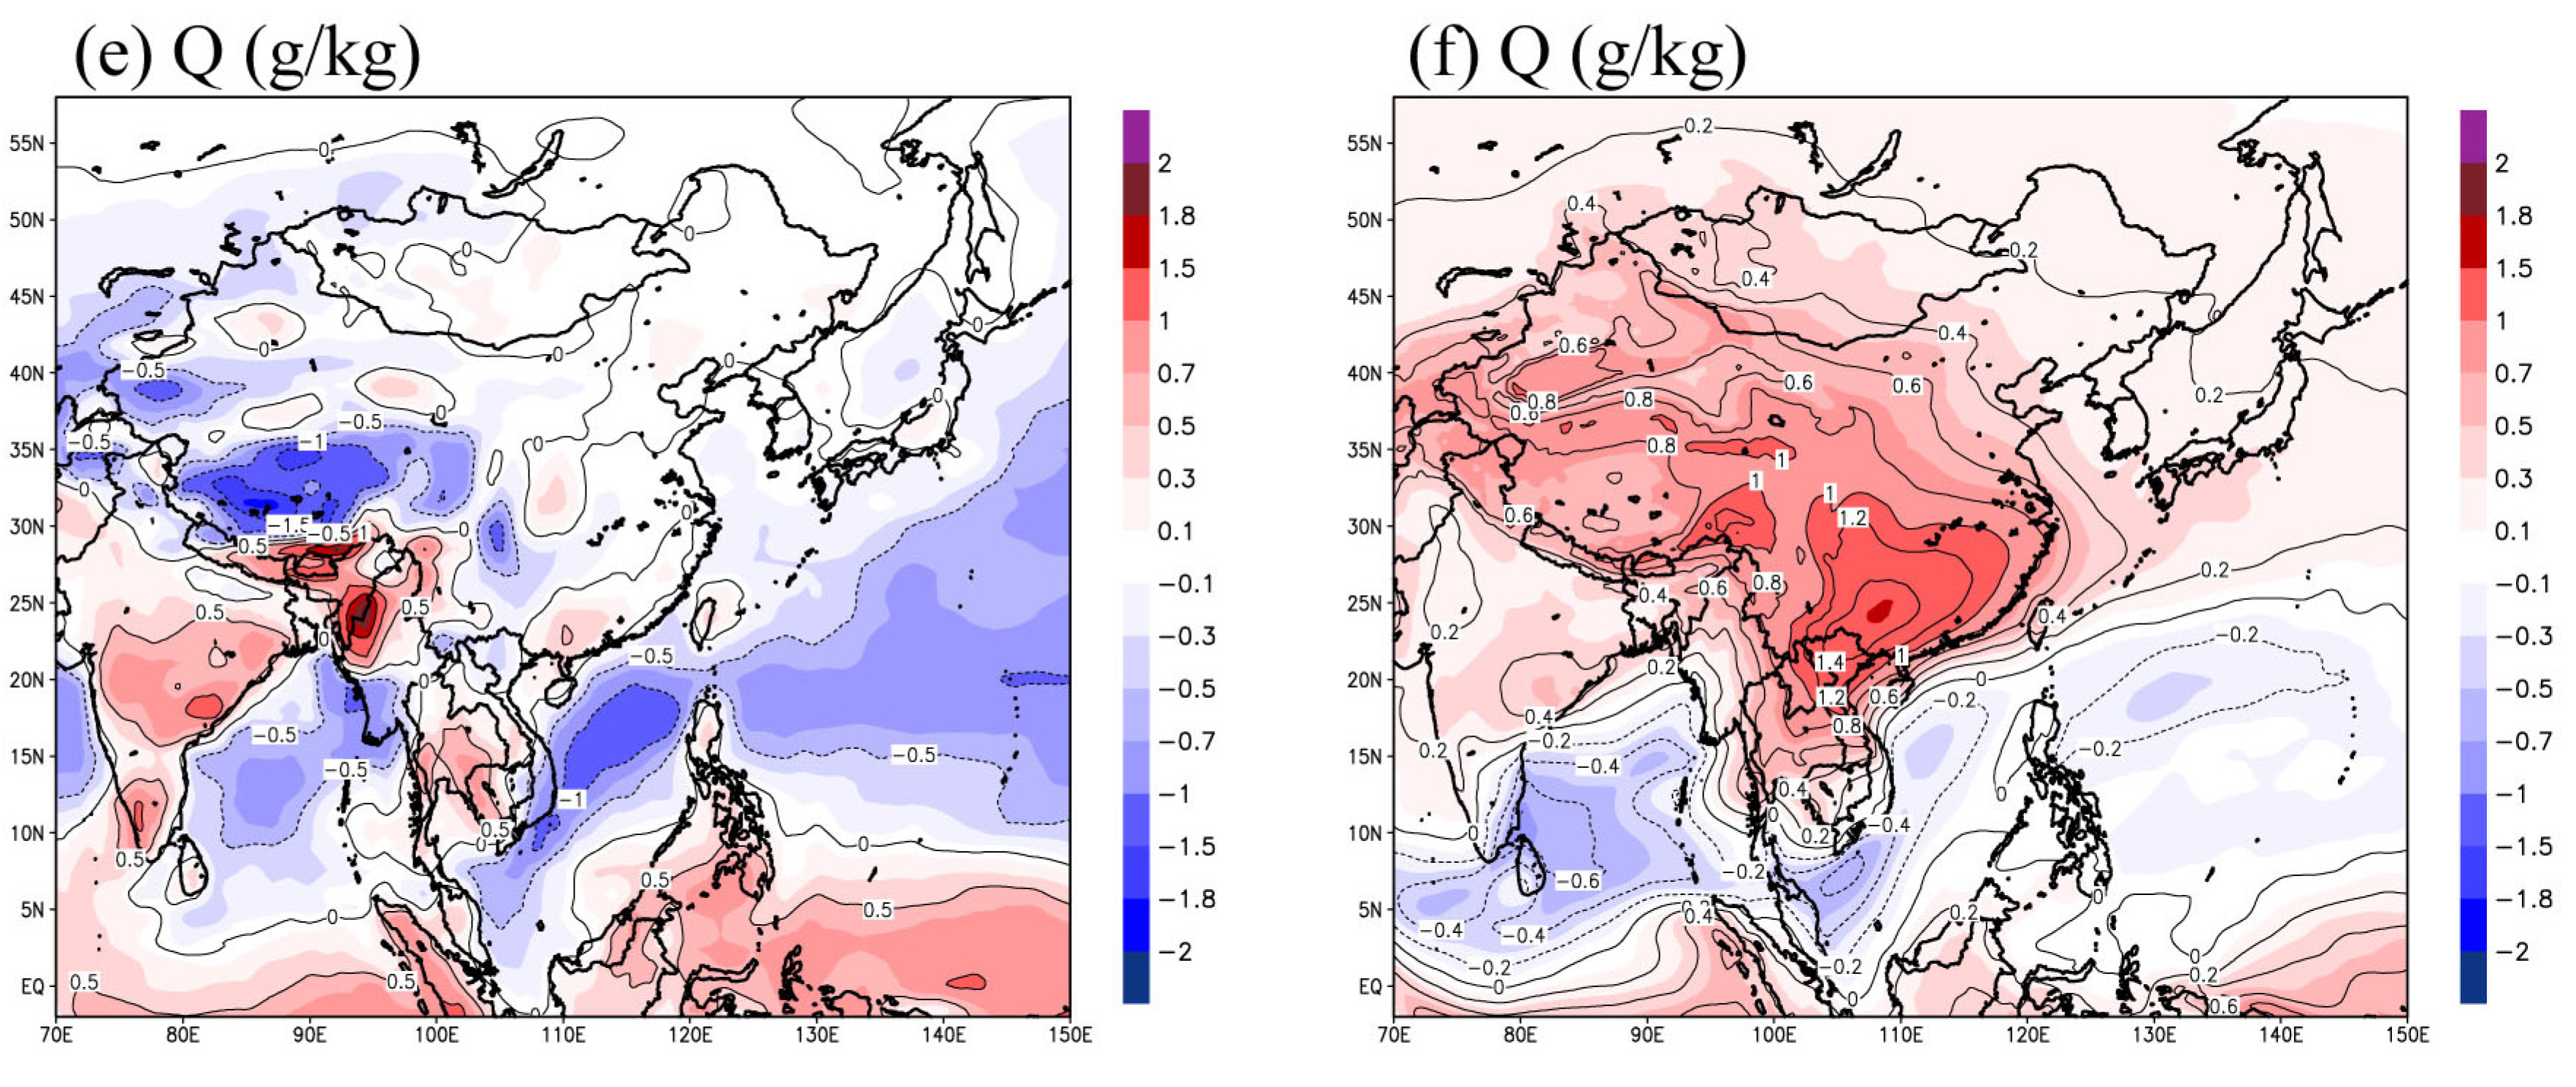
To investigate the causes of simulation differences when the two reanalysis datasets were used as the BCs in RegCM4 simulations, we analyzed the differences in the spatial distribution of the mixing ratio, and the location and intensity of the low-level jet that plays an important role in precipitation processes for the East Asian region during summer (JJA) (
Figure 3). Overall, no large differences were found for the location of the low-level jet that is responsible for localized heavy rainfalls in South Korea, but the ERA wind field at 850 hPa, including the northerly winds that blow strongly in the East Sea, showed large differences compared with the R2 wind field, although these differences depend on the region. Particularly large differences were found in the equator region of the Indian Ocean and over southern China and Mongolia. Compared with the R2 data, the ERA wind field showed strong northerly winds over the ocean, e.g., in the western Pacific Ocean, but smaller differences were observed in the central China region and South Korea. The ERA temperature data showed lower values than the R2 data around northern India. However, the differences between the wind fields and temperatures simulated with the two BCs were comparatively large. In particular, compared with R2_ReC, ERA_ReC simulated noticeably higher temperatures in the regions where precipitation was over-simulated, such as the central region of the model domain including Mongolia and the southern China region. As a result, ERA_ReC simulated stronger large-scale cyclonic circulation than R2_ReC in the central region of the model domain, thereby strengthening southerly-southwesterly winds in the regions between India and southern China. In addition, in ERA_ReC, strong easterly-northeasterly winds were simulated in the north region of the model domain, and slightly stronger southerly winds were simulated in South Korea. The ERA dataset showed lower relative humidity (RH) than the R2 dataset in the western China region and the East Sea, but noticeably higher RH values than the R2 dataset in all other regions. The regions where RH was underestimated in ERA_ReC are regions where temperatures were overestimated and the mixing ratios were underestimated in the simulation. In the ERA experiment, a very high RH was simulated in northeastern China as a result of over-simulation of mixing ratios, even though simulated temperatures were similar in the ERA and R2 experiments. In ERA_ReC, the mixing ratios were noticeably high in most of the model domains where precipitation was over-simulated, except for the western Mongolia region. The over-simulation of convective precipitation in the central regions of the model domain, such as in central China, may be explained by the simulated strong southerly winds and the mixing ratios in ERA_ReC compared with R2_ReC.
Figure 3.
Spatial distribution of 20-year summer mean differences for (a,b) wind field (m/s) and temperature (°C); (c,d) relative humidity (RH, %); and (e,f) mixing ratio (Q, g/kg) at 850 hPa between the two BCs (ERA, R2) (Left) and between the two simulations (ERA_ReC, R2_ReC) forced by the ERA and R2 datasets (right).
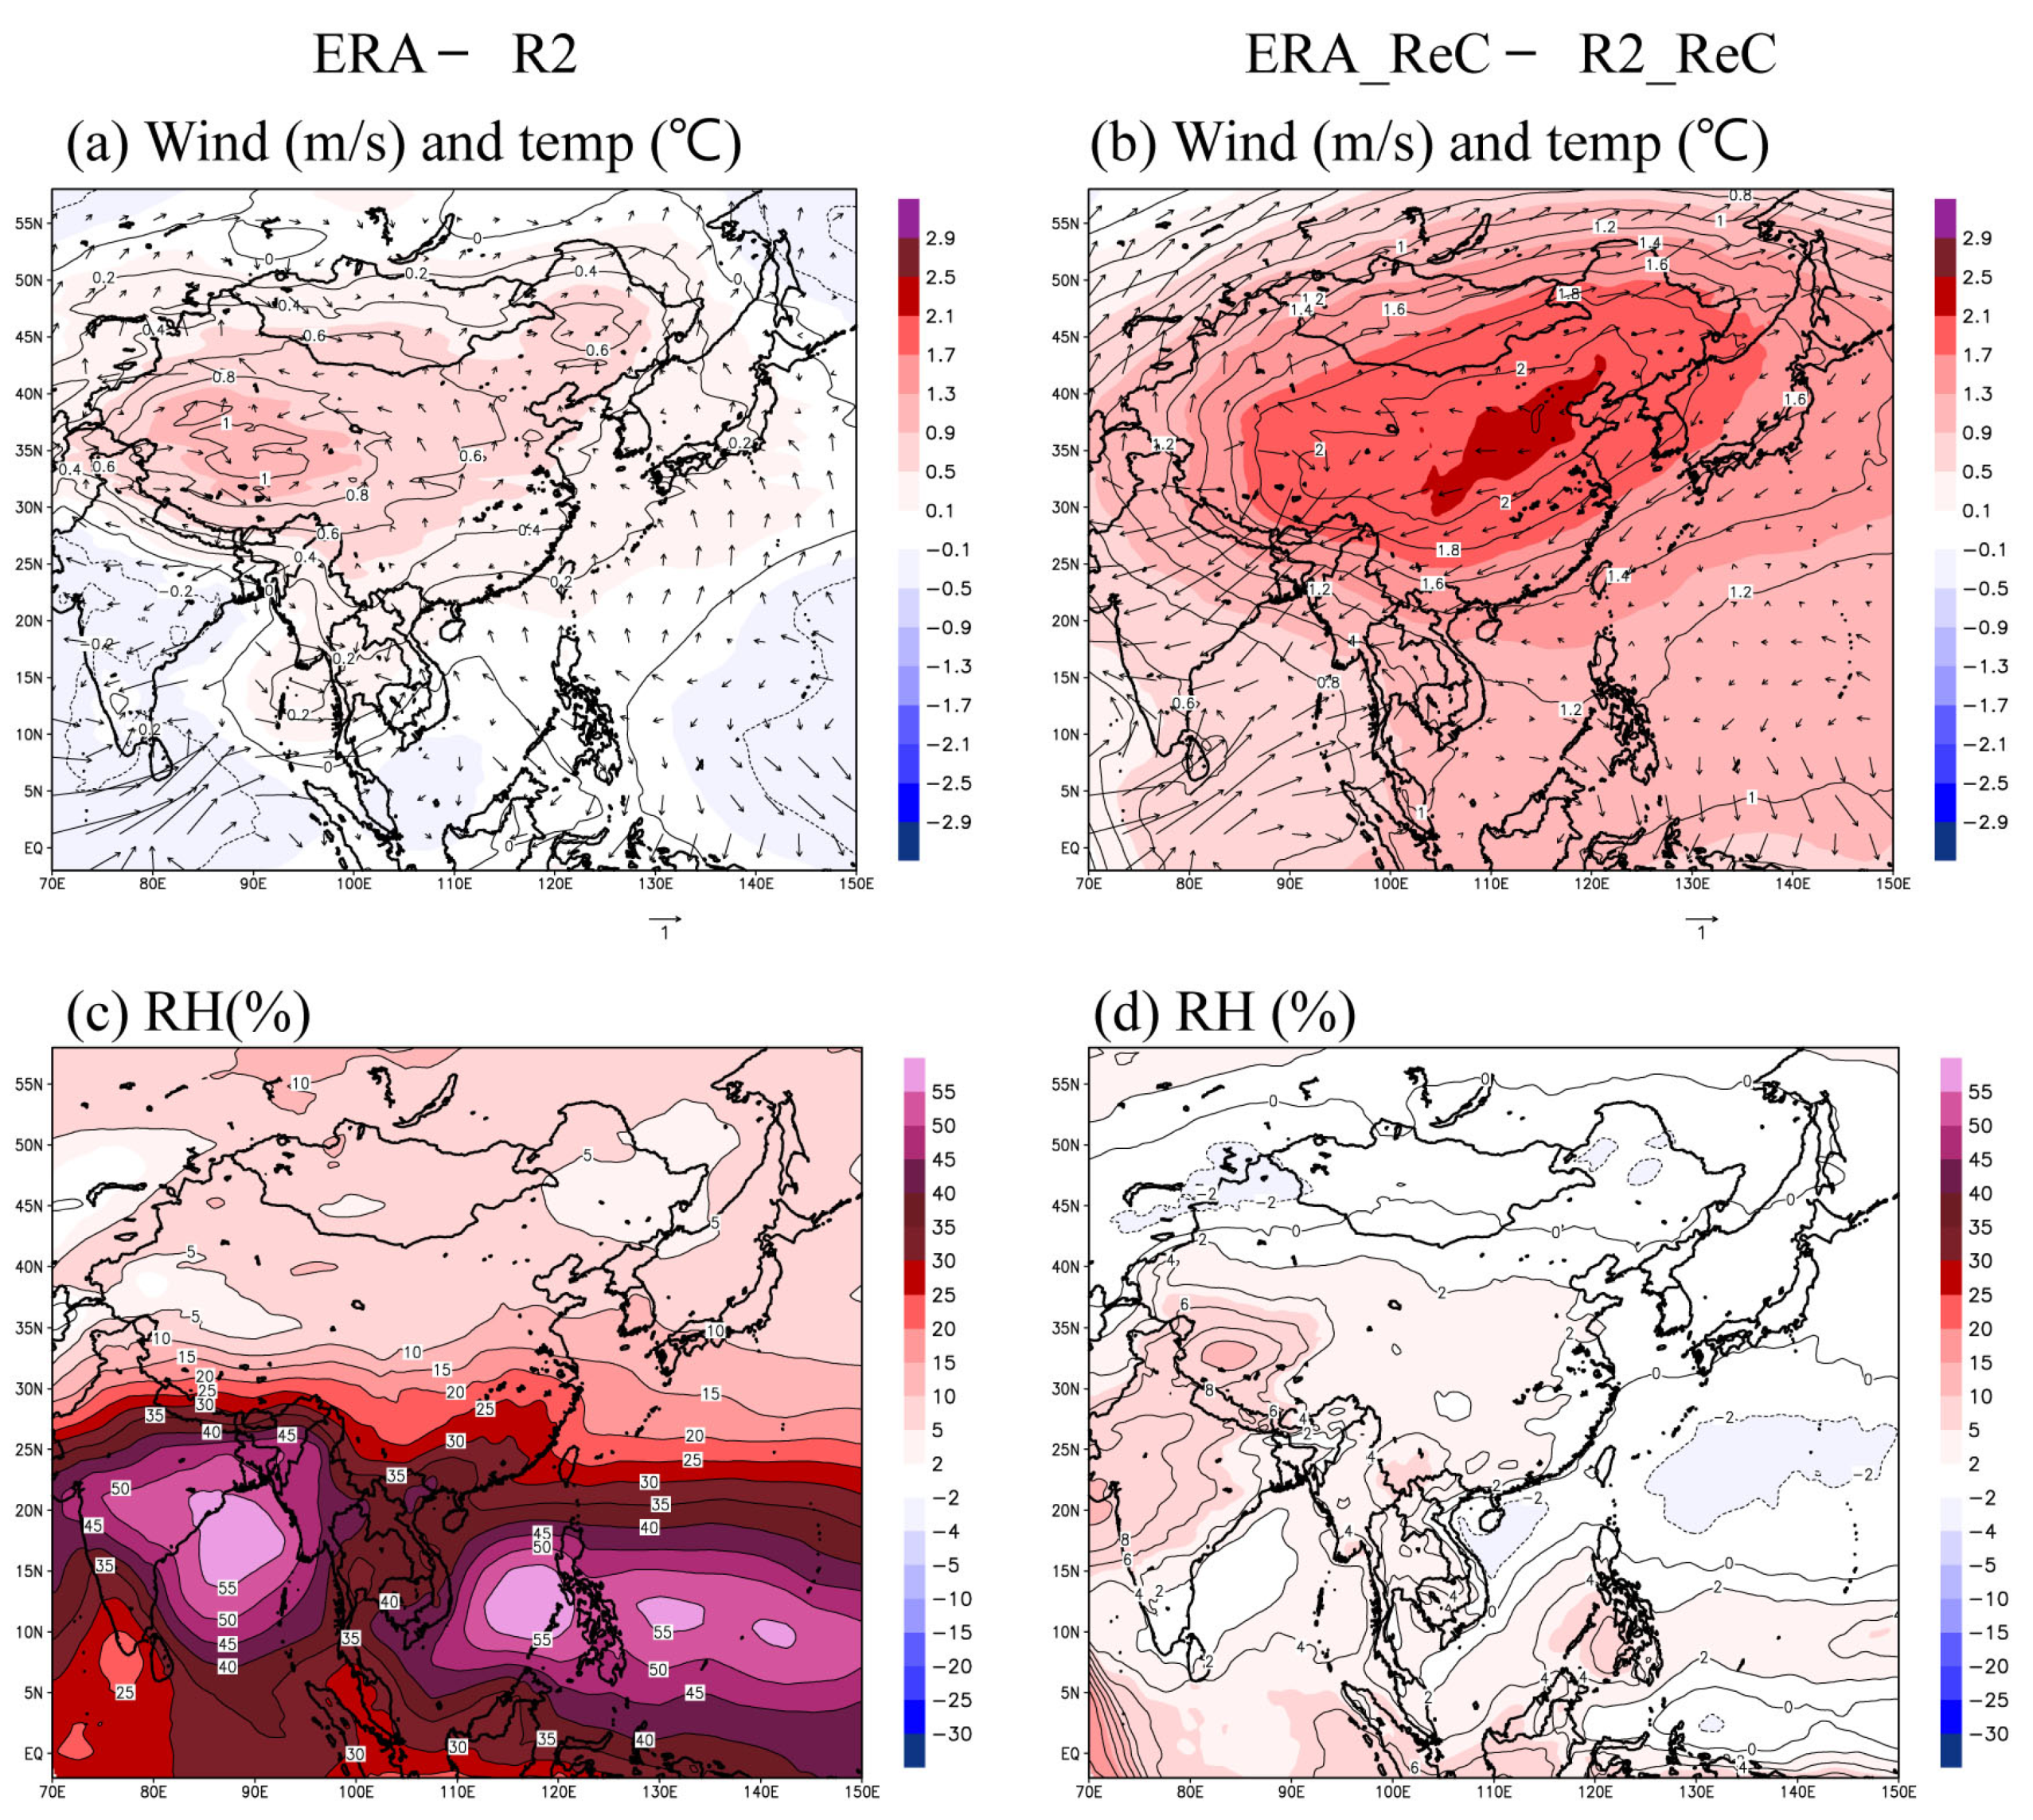
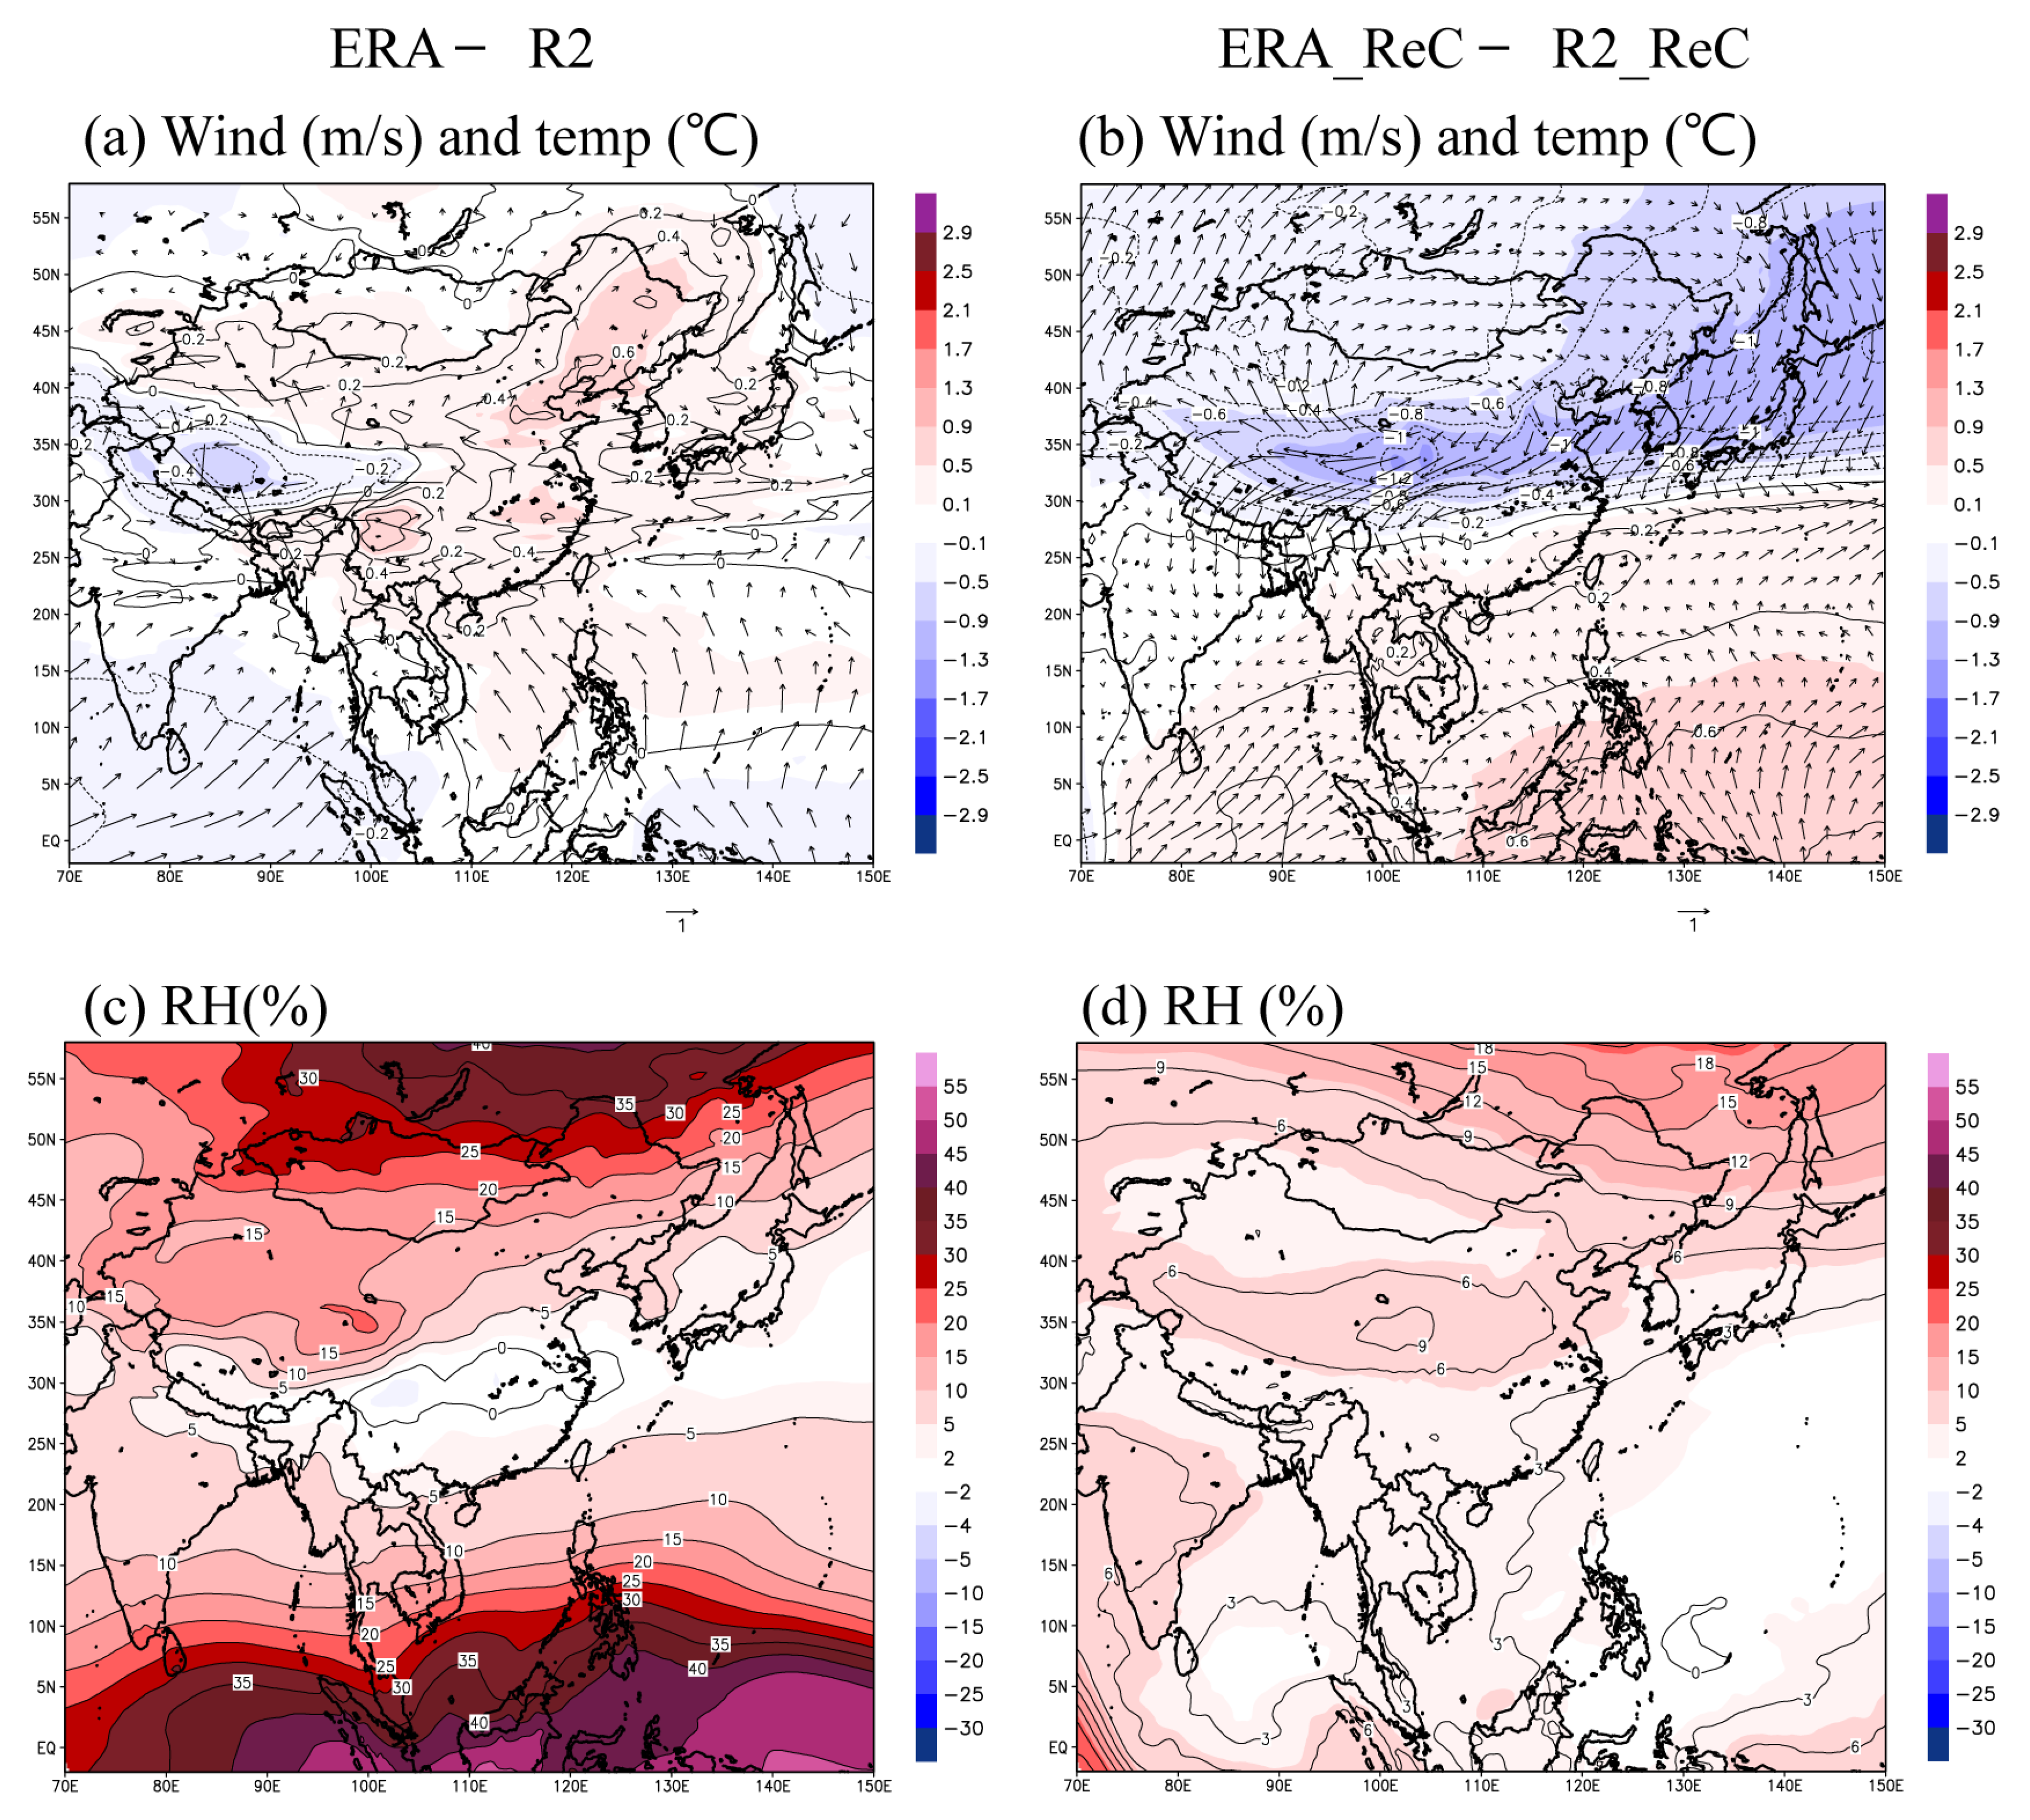
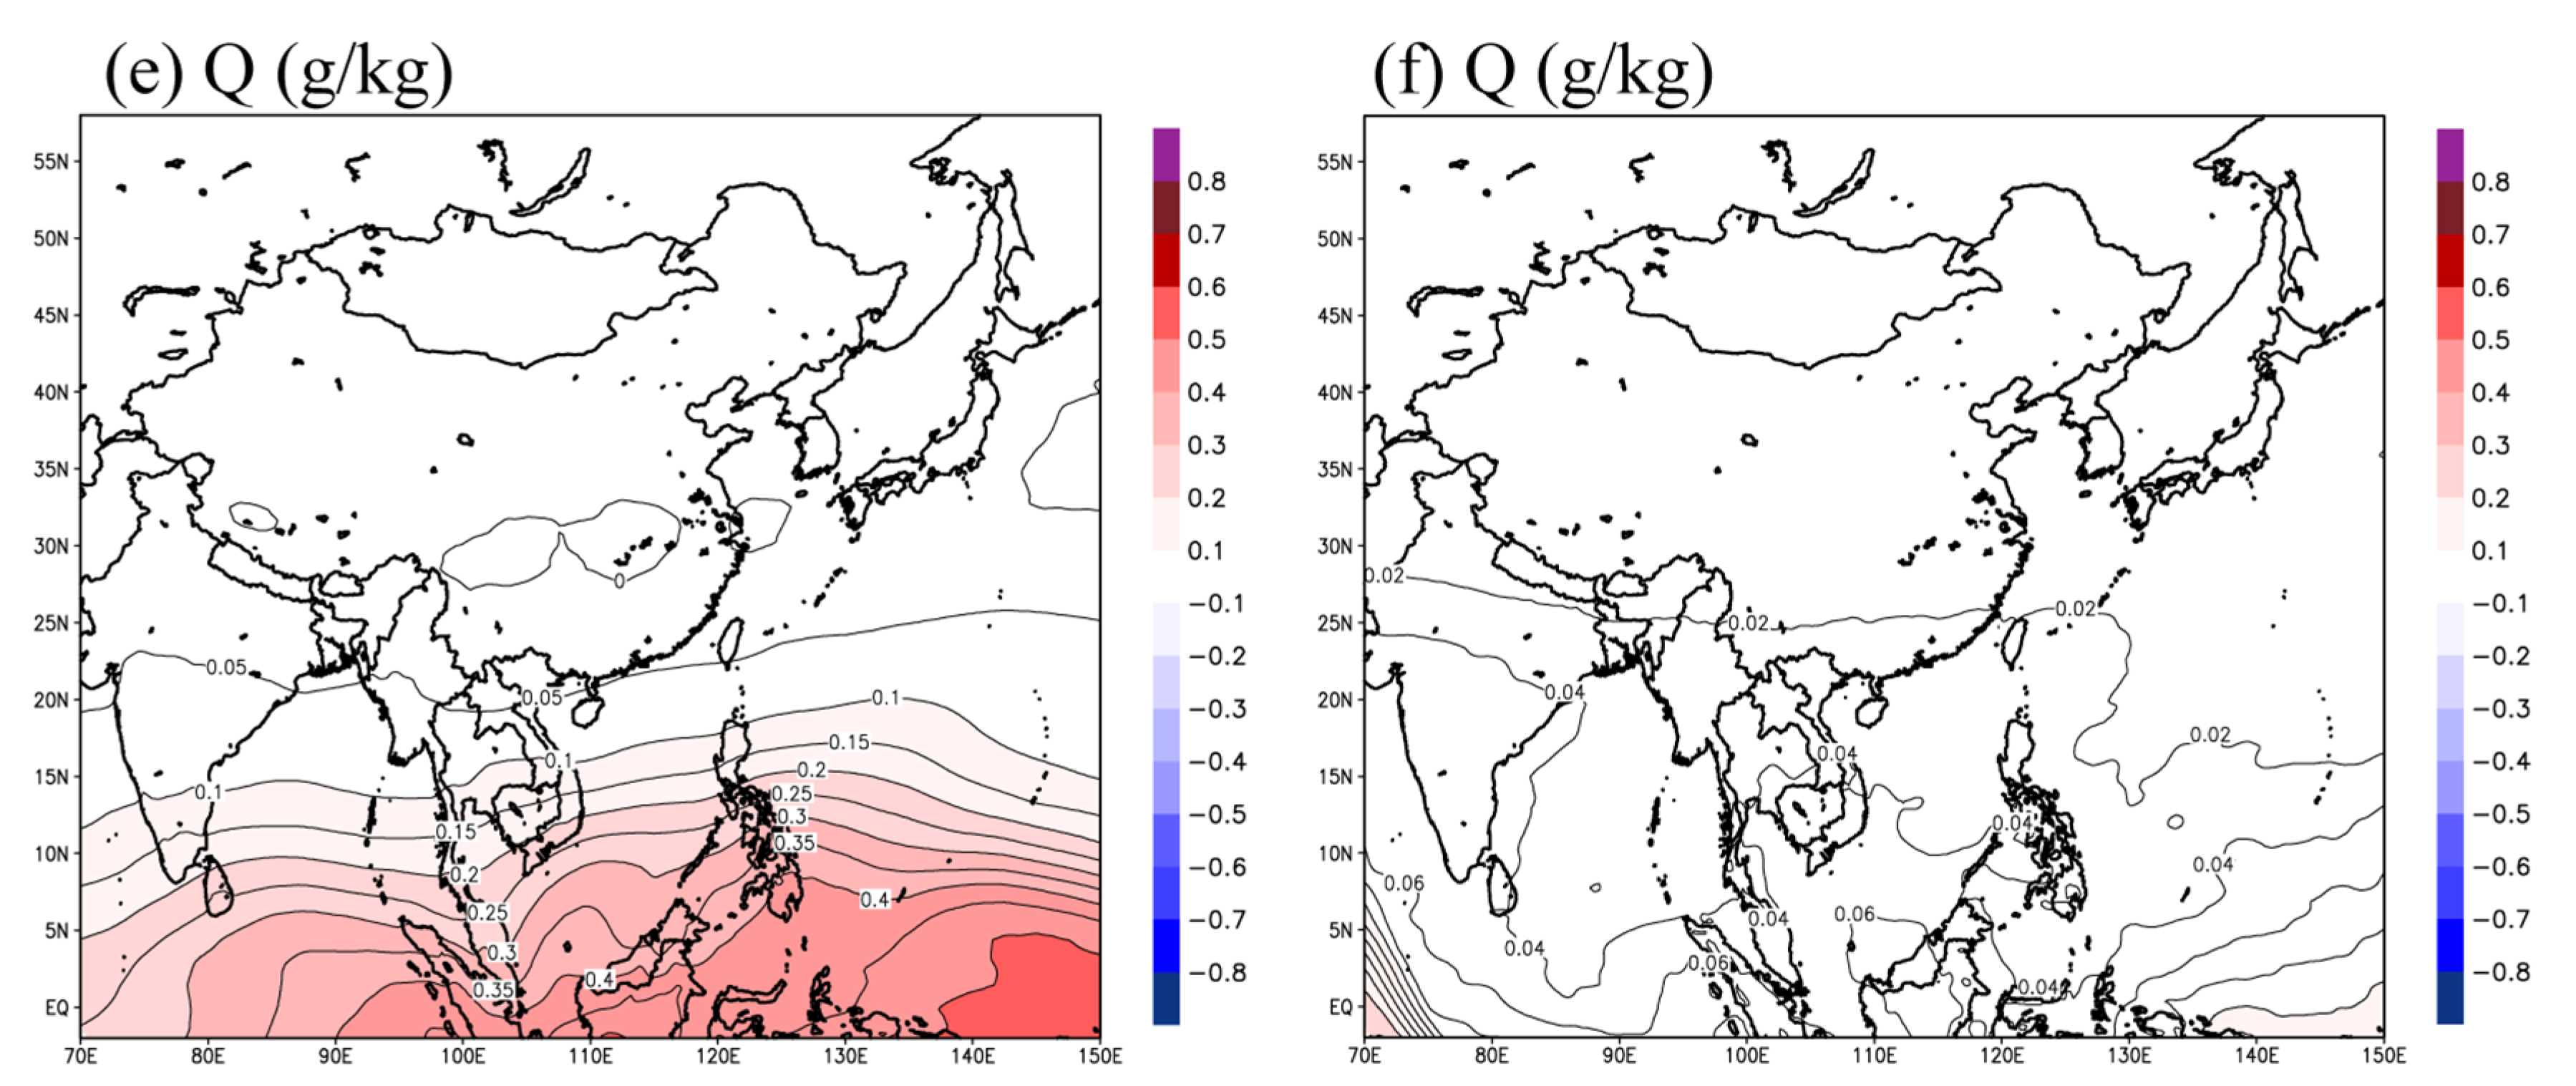
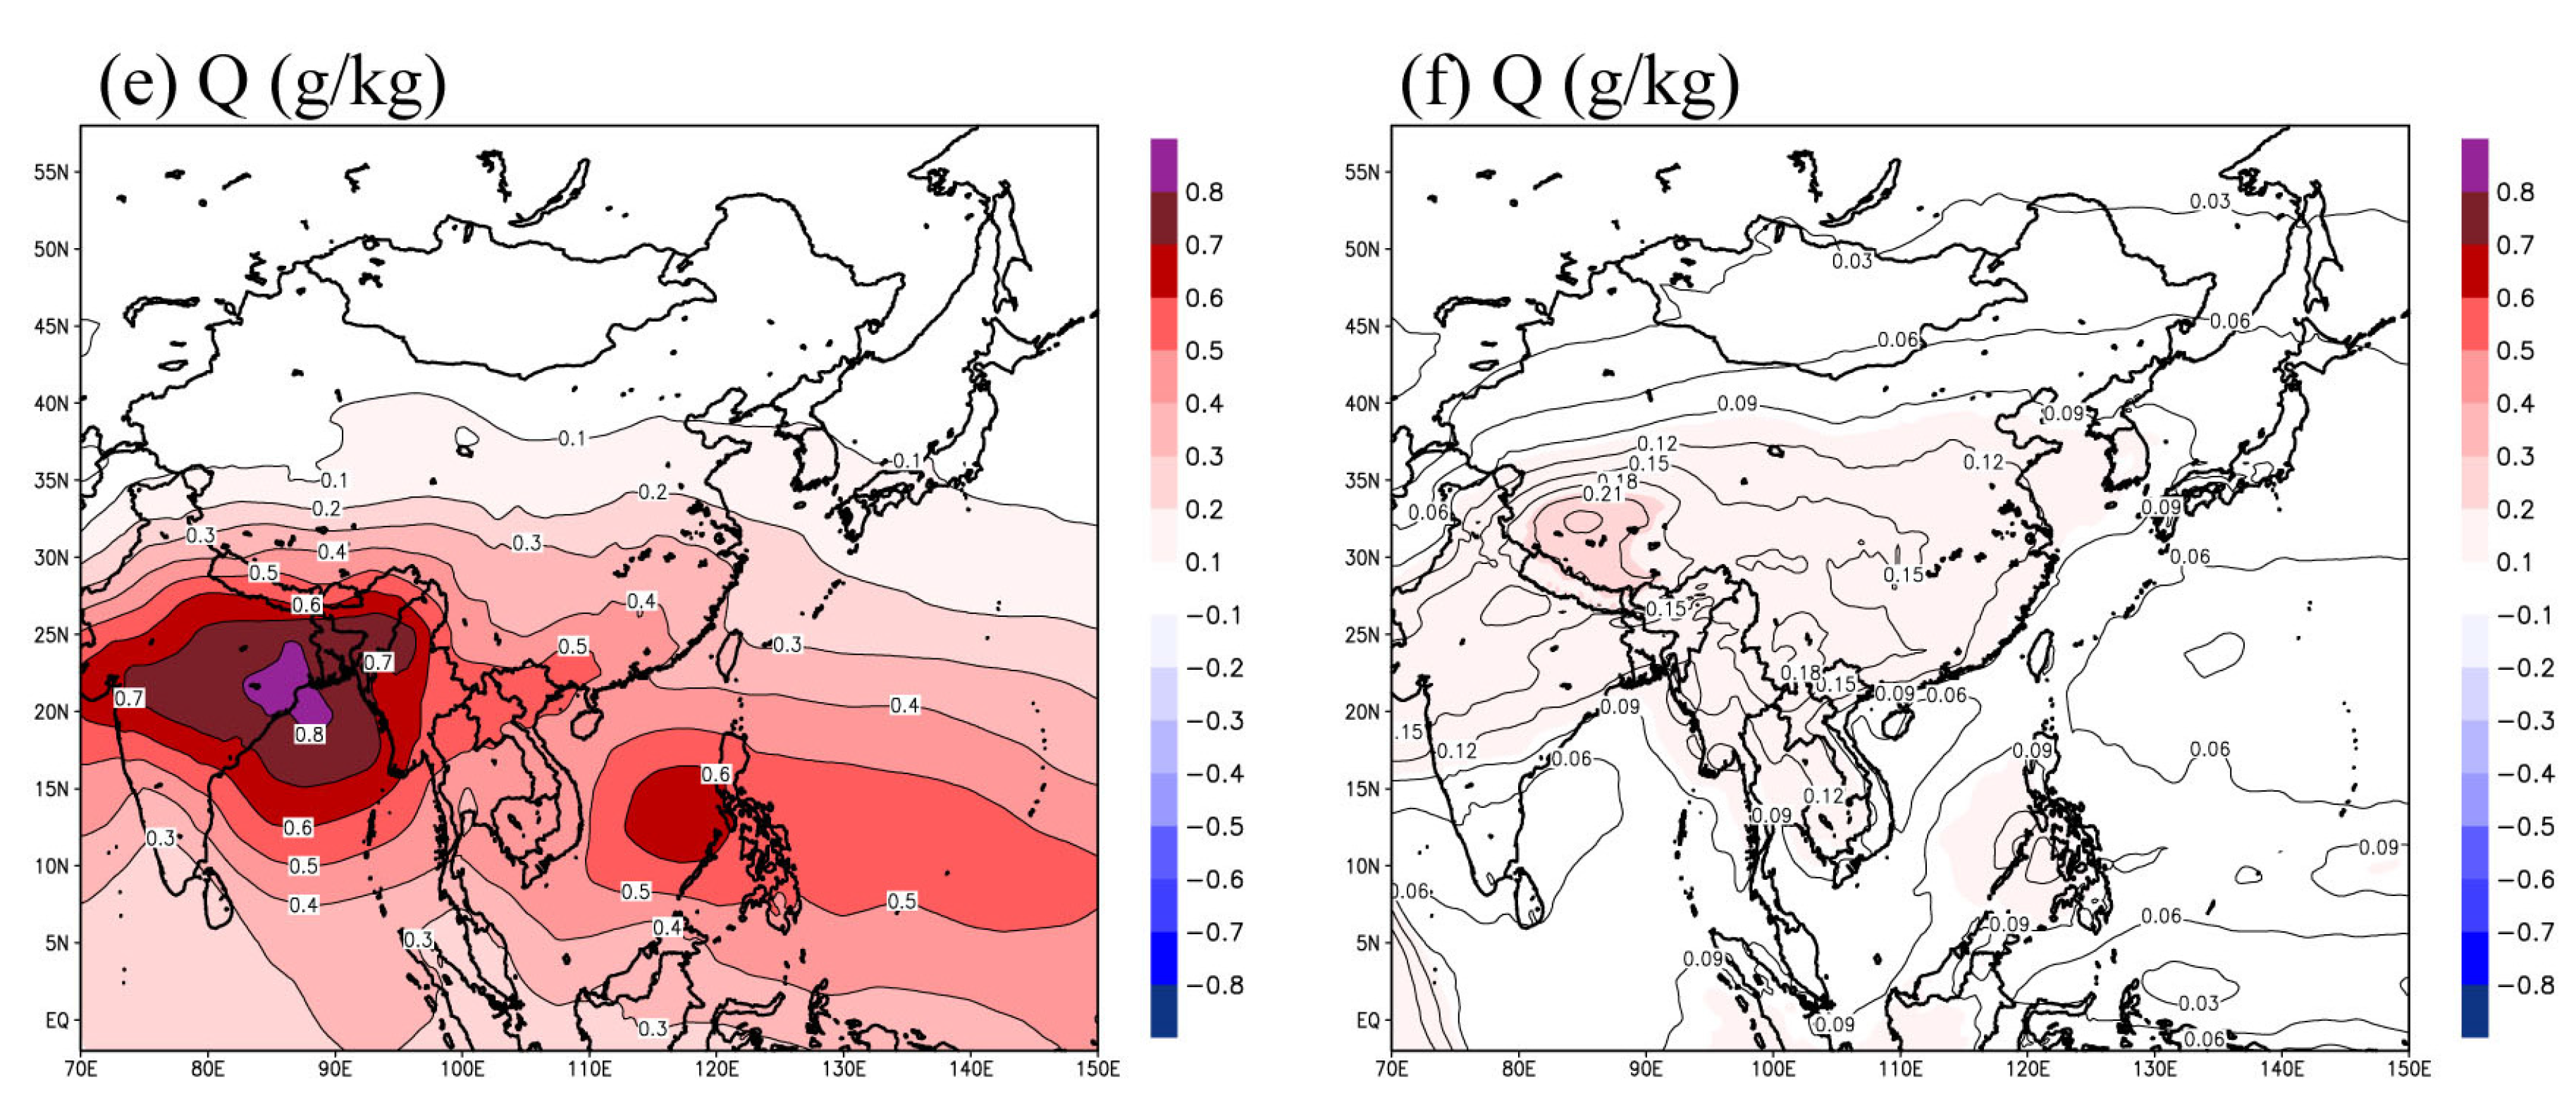
The wind field differences at 850 hPa between the ERA and R2 data were substantially larger in winter than in summer (
Figure 4). For the ERA dataset, southerly winds are dominant in the Indian Ocean and the coastal regions of the Philippines, and northerly winds are dominant in the western Pacific Ocean. In continental regions, however, there are large differences, independent of the region, but without any systematic patterns. In general, winter temperatures are higher in the ERA data than in the R2, except for some regions such as the northwestern region and the Tibetan Plateau. However, the wind fields and temperatures simulated using the two BCs showed very different patterns except in the southern sea region of the model domain. In particular, the noticeably over-simulated temperatures of ERA_ReC in China and Mongolia resulted in very different wind fields in these regions. In addition, in the seas surrounding the Korean peninsula, unlike the differences between the reanalysis datasets, stronger southerly winds were simulated in ERA_ReC. In winter, ERA dataset shows higher RH than R2 dataset in China, and noticeably lower RH than R2 dataset in most regions including northern China, Mongolia, the South China Sea, and the western Pacific Ocean. The mixing ratio differences between the two reanalysis datasets were not significant except for the South China Sea, India, and the Indian Ocean. As in summer, the differences in the RH and mixing ratios simulated with the two BCs showed a very different pattern to the differences between the two original reanalysis datasets. ERA_ReC simulated a higher mixing ratio than R2_ReC in most continental regions, excluding the Indian Ocean and the South China Sea. In the southern China region, in particular, the mixing ratio differences were shown to be as large as 1 g/kg. Compared to R2_ReC, ERA_ReC simulated higher RH at the center of the model domain (e.g., central China), but simulated lower RH in most other regions. ERA_ReC simulated noticeably lower RH in Mongolia, where the simulated mixing ratios were slightly higher but the simulated temperatures were noticeably higher, and it simulated higher RH in eastern China, where both simulated mixing ratios and temperatures were noticeably higher. In ERA_ReC, the total precipitation during winter (DJF) in eastern China and the South China Sea were over- and under-simulated, respectively, even though the intensity was low. This seems to be related to over- or under-simulated RHs in these regions as the result of over- or under-simulated mixing ratios and similar or over-simulated temperatures as compared to R2_ReC. In addition, the difference of total precipitation in these regions during winter (DJF) seem to be related to the combined differences of RegCM4 simulations for non-convective and convective precipitation.
Figure 4.
Spatial distribution of 20-year winter mean differences for (a,b) wind field (m/s) and temperature (°C); (c,d) relative humidity (RH, %); and (e,f) mixing ratio (Q, g/kg) at 850 hPa between the two BCs (ERA, R2) (left) and between the two simulations (ERA_ReC, R2_ReC) forced by the ERA and R2 datasets (right).
Figure 5.
Spatial distribution of 20-year summer mean differences for (a,b) wind field (m/s) and temperature (°C); (c,d) relative humidity (RH, %); and (e,f) mixing ratio (Q, g/kg) at 300 hPa between the two BCs (ERA, R2) (left) and between the two simulations (ERA_ReC, R2_ReC) forced by the ERA and R2 datasets (right).
Figure 6.
Spatial distribution of 20-year winter mean differences for (a,b) wind field (m/s) and temperature (°C); (c,d) relative humidity (RH, %); and (e,f) mixing ratio (Q, g/kg) at 300 hPa between the two BCs (ERA, R2) (left) and between the two simulations (ERA_ReC, R2_ReC) forced by the ERA and R2 datasets (right).
As shown in
Figure 5, the differences of the wind fields, temperature, RH, and mixing ratios at 300 hPa in summer were significant for both the two reanalysis datasets and the simulation results. The temperatures of the ERA dataset were slightly higher compared with those of the R2 dataset in the center of the model domain, which resulted in strong anticyclonic circulation in the entire model domain. However, in the simulation results, the positive differences region migrated from the western Tibetan region to the eastern China region, and the intensity of the positive differences was significantly enhanced. As a result, the anticyclonic circulation was greatly reinforced in most regions, excluding the southern boundary sea regions of the model domain, such as the Indian Ocean. The ERA dataset showed noticeably higher mixing ratios and RH in the southern regions of the model domain compared with the R2 dataset, but small differences in the northern regions resulted in a large meridional contrast. However, the mixing ratios and RH simulated with the two BCs were very similar irrespective of the region. The enhanced positive differences of temperature and greatly weakened mixing ratios in the southern part of the model domain resulted in significant decreases in the meridional contrast and absolute positive differences in the RH. Additionally, significant decreases in the mixing ratios in the southern part of the model domain can be explained by the combined effects of enhanced north-eastward transport of moisture by the increased low-level jet, and enhanced precipitation in the ERA-ReC, as shown in
Figure 2 and
Figure 3. For wind fields in the upper troposphere, weak differences, compared with the differences between the two reanalysis datasets, were found between the two simulations; this seems to be the result of applying spectral nudging, which gives large weight to the upper layer during the simulation processes.
In winter, while the temperature differences between the two reanalysis datasets were not large, considerable differences were seen in the wind fields. In particular, the ERA dataset showed stronger southerly winds than the R2 dataset in the southern regions of the model domain (
Figure 6). In the simulations, the temperatures and wind fields at 300 hPa for winter showed different patterns compared with the differences between the two reanalysis datasets. As the temperature differences became negative at the center of the model domain, where the ERA dataset showed higher temperatures, the anticyclonic circulation on the boundary of Mongolia and China was strengthened, thus weakening the jet above central China. In winter, the ERA dataset showed noticeably higher RH in the southern sea regions, and in the north excluding the center of the model domain, and a high mixing ratio was only seen in the southern sea regions of the model domain. However, in the simulations, most of the positive differences in the mixing ratio and RH in the southern sea regions were weakened; additionally, the intensity of the positive RH differences in the northern regions was weakened and the maximum difference region moved east. This may be ascribed to the lower temperatures simulated in the East Sea and the higher temperatures in the southeastern sea regions in ERA_ReC, although the mixing ratios were simulated at similar levels in the two experiments.


