Article

Impacts of Boundary Conditions on the Simulation of Atmospheric Fields Using RegCM4 over CORDEX East Asia

Department of Atmospheric Sciences, Kongju National University, Gongju 314-701, Korea
*
Author to whom correspondence should be addressed.
Atmosphere 2015, 6(6), 783-804; https://doi.org/10.3390/atmos6060783
Submission received: 31 December 2014 / Accepted: 1 June 2015 / Published: 5 June 2015

Abstract

:
The impacts of boundary conditions (BCs) on simulations of RegCM4 for mid-to-upper atmospheric fields over the CORDEX (COordinated Regional Downscaling EXperiment) East Asia domain were investigated using two datasets from integrations over 20 years (1989–2008) with two BCs (ERA and R2). The two datasets showed large differences for the atmospheric variables regardless of the geographic locations, heights, and seasons. The ERA dataset at 850 hPa displayed stronger northerly winds in the western Pacific Ocean, colder temperatures around northern India, and higher relative humidity compared with the R2 dataset during summer. The large differences in the BCs resulted in the significantly different simulations of RegCM4 in both surface and atmospheric variables. The temperatures and wind simulated at 850 hPa with the ERA dataset were warmer and stronger, respectively, than those simulated with the R2 dataset during summer. In addition, RegCM4 with the ERA dataset as a BC generally simulated a stronger southerly wind at 850 hPa over eastern China and more unstable environments than with the R2 dataset, and accordingly generated more precipitation over the eastern part of the domain. Contrary to the forcing data, the trends of simulated relative humidity and the mixing ratios from the two different BCs showed similar patterns irrespective of height and season. The significant impacts of the BCs on the simulation results indicate the importance of BCs in regional climate simulations.

1. Introduction

As the quality of reanalysis data has improved, diverse studies using reanalysis data have been conducted ranging from trend analyses of major climate elements, such as temperature and precipitation, to evaluations of the simulation performance of regional climate models [1,2,3,4,5]. The reanalysis data currently in wide use across the atmospheric and oceanic fields are comprehensively summarized at “ http://reanalyses.org/.” The spatial resolution, number of vertical levels, and periods of reanalysis data vary according to the model, data, and data assimilation methods used in the production of reanalysis data [3,5,6,7,8,9,10,11].
Among the numerous types of reanalysis data, ERA (European Centre for Medium-Range Weather Forecasts (ECMWF) Re-Analysis)–Interim (hereafter ERA [12]) and NCEP (National Centers for Environmental Prediction)/DOE (Department Of Energy) Reanalysis 2 (hereafter R2 [13]) data are the most commonly used datasets for the evaluation of regional climate model simulations [5,9,10]. The ERA data are produced using the output of the ERA reanalysis project of the ECMWF, and the data are provided at various horizontal resolutions (0.25°, 0.75°, 1.5°) for the entire global domain. The ERA data are provided from 1979 to the present with 6 h intervals, and 4D-VAR (four-dimensional variational assimilation) is used as the data assimilation method. The latest information on the ERA data can be obtained at “http://cclics.rcec.sinica.edu.tw/xms/content/show.php?id=3047.” The R2 data are the improved version of the NCEP reanalysis 1 model that fixed errors and updated parameterizations, and the data are provided at 2.5° horizontal resolution for the entire global domain. As for the ERA data, the R2 data are provided from 1979 to the present with 6 h intervals, but 3D-VAR is used as the data assimilation method. The latest information on the R2 data can be obtained at “http://www.esrl.noaa.gov/psd/data/gridded/data.ncep.reanalysis2.html.”
As various reanalysis datasets have been provided in terms of resolution, number of vertical levels, and data periods, several inter-comparison studies have been conducted on the similarities and differences among these datasets [3,6,7,11,14,15]. These studies have shown that all the reanalysis datasets, particularly after satellite data assimilation, captured the inter-annual and seasonal variations in the observation data, regardless of geographic locations and seasons, without major discrepancies. However, they also revealed that these reanalysis data showed slight discrepancies compared with the corresponding observational data for some regions and seasons, as well as considerable differences among the reanalysis datasets depending on the regions, seasons, and climate variables. Most previous studies have performed analyses focusing on surface climate elements, such as temperature, precipitation, and sea-level pressure [3,14,15].
Recently, many dynamical downscaling experiments forced by reanalysis data have been carried out [5,8,9,16]. Among them, Oh et al. [5] and Park et al. [9] conducted experiments in which R2 data [13] and ERA data [12] were used as boundary conditions (BCs) for the regional climate model (RegCM4: Regional Climate Model, version 4) simulations as part of the CORDEX-EA (COordinated Regional climate Downscaling EXperiment for East Asia region) project. They showed that the simulation performance of RegCM4 is largely influenced by the BCs for both precipitation and extreme climate events. In particular, they pointed out that when the ERA dataset, rather than the R2 dataset, was used as a BC, tropical nights, hot days, and wet days were over-simulated, whereas frost days were markedly under-simulated. Furthermore, they ascribed the substantial discrepancies in RegCM4 simulations for precipitation and extreme climate events to the differences between the two reanalysis datasets used as BCs for the model.
To achieve a more in-depth analysis of the factors that induced the differences in the simulation results of RegCM4 over the CORDEX-EA domain, this study analyzed the differences between the ERA and R2 datasets, focusing on the mid-to-upper atmospheric variables, and their impacts on the RegCM4 simulations of the mid-to-upper atmospheric variables. Additionally, the relationships between the precipitation types and atmospheric fields simulated by RegCM4 with the different BCs were analyzed. Section 2 presents the data and regional climate model used in this study, and Section 3 explains the differences in the spatial distributions and vertical profiles between the two reanalysis datasets and simulation results. Finally, Section 4 summarizes the results of this study.

2. Model and Experimental Design

The regional climate model used in this study is RegCM4, which is an upgraded model based on the previous model RegCM3 that was improved by coupling RegCM3 with the newest land–atmosphere interaction scheme provided by the Abdus Salam ICTP (International Centre for Theoretical Physics) (http://www.ictp.it/research/esp/models/regcm4.aspx). Compared to RegCM3, RegCM4 has many improved features including better simulations of land surface physical processes, the planetary boundary layer, air-sea flux, convective heat transfer, and radiative transfer. User convenience has also been improved by overall source code upgrading through revision and supplementation. A detailed description of RegCM4 is given by Giorgi et al. [17].
Table 1. Model configuration used in this study.
ContentsDescription
DomainCORDEX framework
50 km horizontal resolution
Central Lat. and Lon.: 22.04°N, 118.96°E
197 (Lat.) × 243 (Lon.)
Map projectionLambert Conformal
Vertical layers (top)18 vertical sigma levels (50 hPa)
PBL schemeHoltslag
Cumulus parameterization schemeMIT-Emanuel
Land Surface ModelNCAR CLM3.5
Short/Longwave radiation schemeNCAR CCM3
Boundary dataERA-Interim (ERA), NCEP/DOE2 (R2)
Spectral nudgingYes
Simulation periodsJanuary 1989–December 2008
Table 1 summarizes the experimental design attributes, such as BCs, simulation domain, resolution, physical processes of the model, and simulation period. The characteristics of this experiment are explained in detail in Oh et al. [5] and Park et al. [9], and the total integration period is 20 years from 1989 to 2008. To investigate the impacts of the BCs on RegCM4’s simulation performance for atmospheric variables, two reanalysis datasets (R2 [13] and ERA [12]) were used. Table 2 summarizes the information on the two reanalysis datasets used in this study. The comparison in this table shows the superiority of the ERA dataset to the R2 dataset in terms of the horizontal resolution, number of vertical levels, and the data assimilation method. Weekly optimum interpolation (OI) sea surface temperature (SST) analysis data [18] with 1° spatial resolution were used in the RegCM4 simulation as the ocean boundary condition. To analyze the differences between the ERA and R2 datasets, and the differences in the simulation results of RegCM4 forced by the ERA and R2 as BCs, we carried out separate experiments with RegCM4 forced by the ERA and R2 datasets (hereafter, ERA_ReC and R2_ReC, respectively). In this study, as in other dynamical downscaling experiments, the low-resolution reanalysis data were bilinearly interpolated to the horizontal grid points of RegCM4 and linearly interpolated to its vertical levels.
Table 2. Comparison of the two reanalysis datasets, ERA and R2, used in this study.
ContentsERA-InterimR2
DomainGlobalGlobal
Geographic Longitude0.0°E to 358.5°E0.0°E to 357.5°E
Geographic Latitude90°S to 90°N90°S to 90°N
Dimensions (Lat. × Lon.)121 × 24073 × 144
Spatial resolutionabout 1.5° × 1.5°about 2.5° × 2.5°
Altitudes37 pressure levels17 pressure levels
Available period1979. 01 to present1979. 01 to present
Temporal resolution6-hourly6-hourly
Assimilation system4D-VAR3D-VAR
InstitutionEuropean Center for Medium-Range Weather ForecastsNational Centers for Environmental Prediction
Websitehttp://cclics.rcec.sinica.edu.tw/xms/content/show.php?id=3047http://www.esrl.noaa.gov/psd/data/gridded/data.ncep.reanalysis2.html
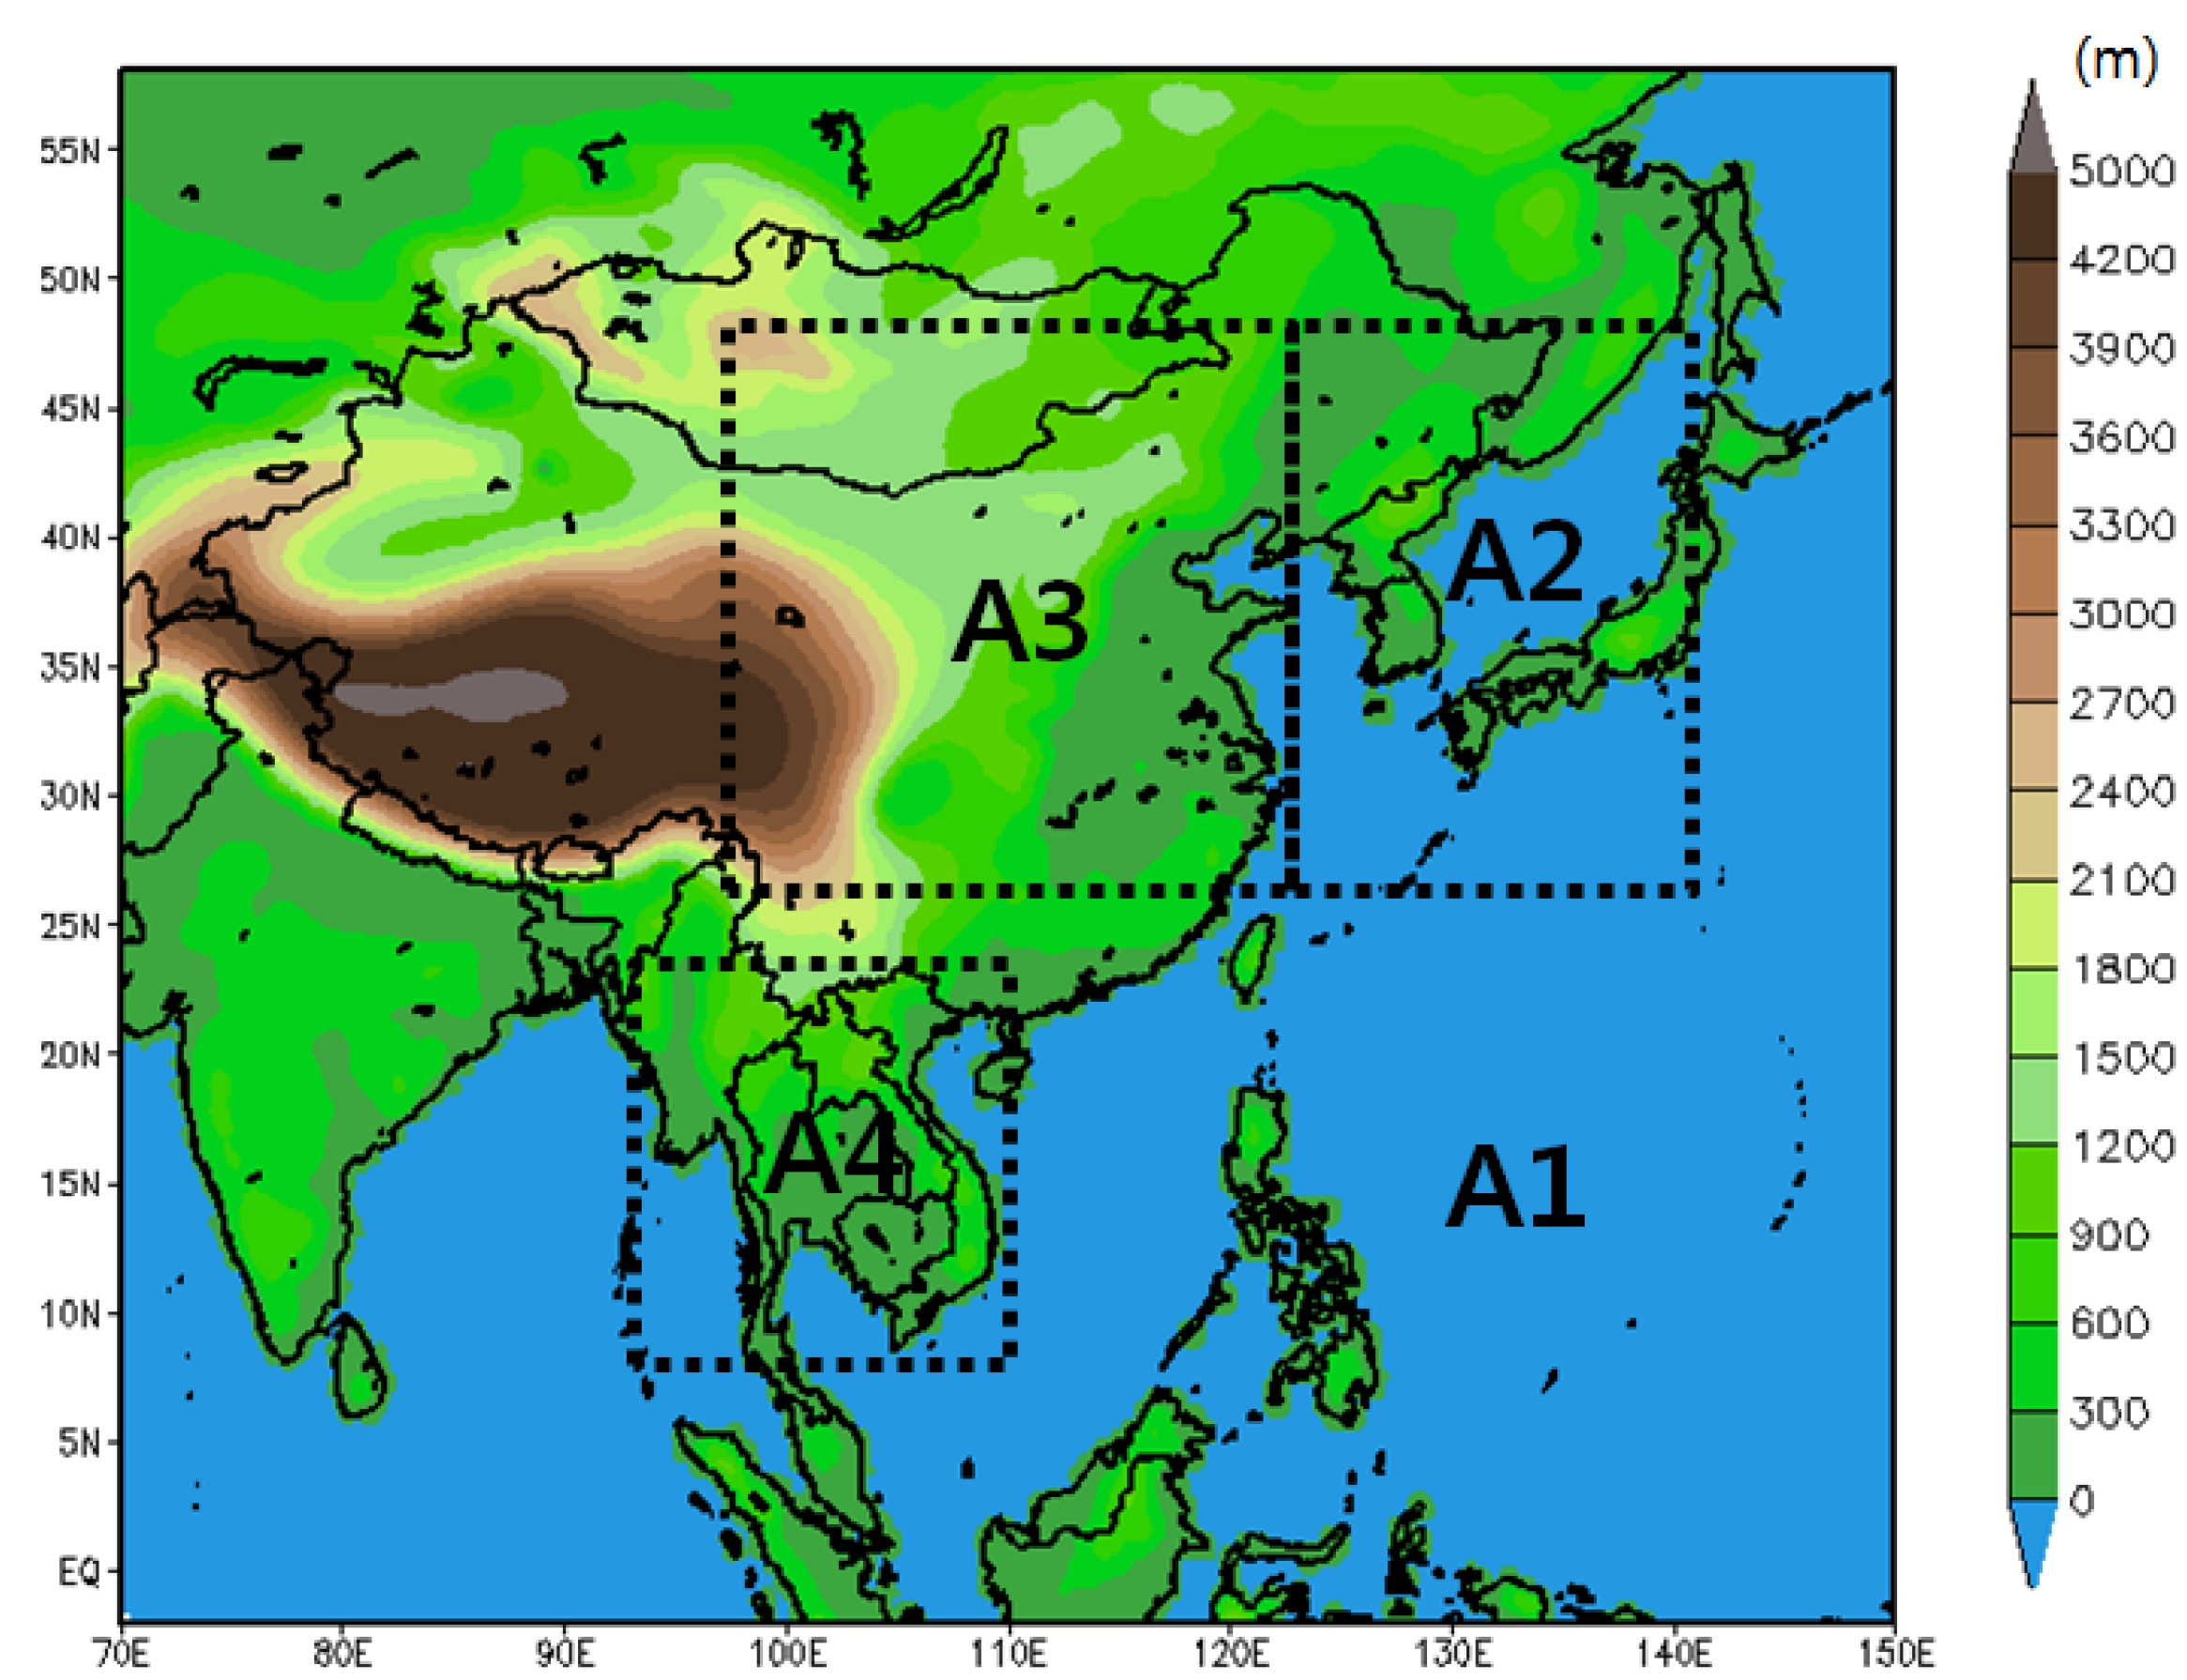
Figure 1. Model domain for CORDEX-EA showing elevation (m) and the sub-regions used in this study.
Atmosphere 06 00783 g001
Figure 1 shows the model domain of CORDEX-EA used in this study. It encompasses a broad region covering most of Asia and the western Pacific Ocean. The elevation data is also shown in the figure as well as the sub-regions (A1, A2, A3, and A4) selected for detailed analysis. Here, A1 refers to the entire model domain, A2 refers to the Korean peninsula and Japan, A3 refers to China, and A4 refers to the Indochinese peninsula; these regions are closely related to the spatio-temporal climate variations of the summer monsoon in South Korea. As shown in Figure 1, since the model domain is wide, systematic errors can occur in the simulated climate during the process of long-term integration. Therefore, to minimize these problems, the spectral nudging technique proposed by Von Storch et al. [19] was applied to RegCM4. Many previous studies have demonstrated the beneficial effect of this technique in minimizing systematic deviations when applied to long-term integration [20,21].

3. Results and Discussion

3.1. Spatial Distribution

In the study conducted by Park et al. [9], the RegCM4, forced by the two BCs (ERA and R2), simulated the location of the precipitation zones related to the summer and winter monsoons fairly well over the CORDEX East Asia domain, when compared with GPCP (Global Precipitation Climatology Project) [22] data. However, the summer precipitation was over-simulated in the Indochinese peninsula, southern China, and Japan regions, but under-simulated in the South Korea region, with different magnitudes according to the BCs [9]. In winter, the RegCM4 showed a similar spatial pattern and magnitude in the most of the regions regardless of the BCs. However, some regions, such as southern China, the southern part of Indian Ocean, and the South China Sea, showed slightly different patterns according to the BCs. Detailed results on the simulation performance of RegCM4 for precipitation according to the BCs are presented by Park et al. [9].
In this study, as shown in Figure 2, we performed a detailed analysis of the impacts of the BCs on the simulation of RegCM4 for precipitation types in the East Asian region. To compare the impacts of BCs more clearly, different scales are used for the color bars showing summer and winter precipitation. In summer, ERA_ReC over-simulated the total precipitation in most regions, except for the Bay of Bengal and the South China Sea, as compared to R2_ReC (Figure 2a). Considerably more precipitation was simulated in ERA_ReC, particularly in the central China region, the Tibetan Plateau region, and the Philippines. These differences in total precipitation between ERA_ReC and R2_ReC were mainly due to the differences in convective precipitation rather than those in non-convective precipitation (Figure 2c,e). On the other hand, no large differences in total precipitation were found for the most of the land region over East Asia in winter, when precipitation is minimal overall compared with the summer season. However, ERA_ReC slightly over-simulated the precipitation in southern China, while it under-simulated the precipitation in most ocean regions, such as the south Indian Ocean and the South China Sea, compared with R2_ReC. These differences are due to the combined differences between simulations of RegCM4 for non-convective precipitation and convective precipitation.
Figure 2. Spatial distribution of precipitation differences (mm/day) between ERA_ReC and R2_ReC over 20 years (1989–2008). Left and right panels are the results for summer (JJA) and winter (DJF), respectively. Upper, middle, and lower panels indicate the differences in total precipitation (T_PR), convective precipitation (C_PR), and non-convective precipitation (NC_PR), respectively. To show a clear comparison of RegCM4’s performance for precipitation, different color bar scales were applied for summer and winter.
Atmosphere 06 00783 g002
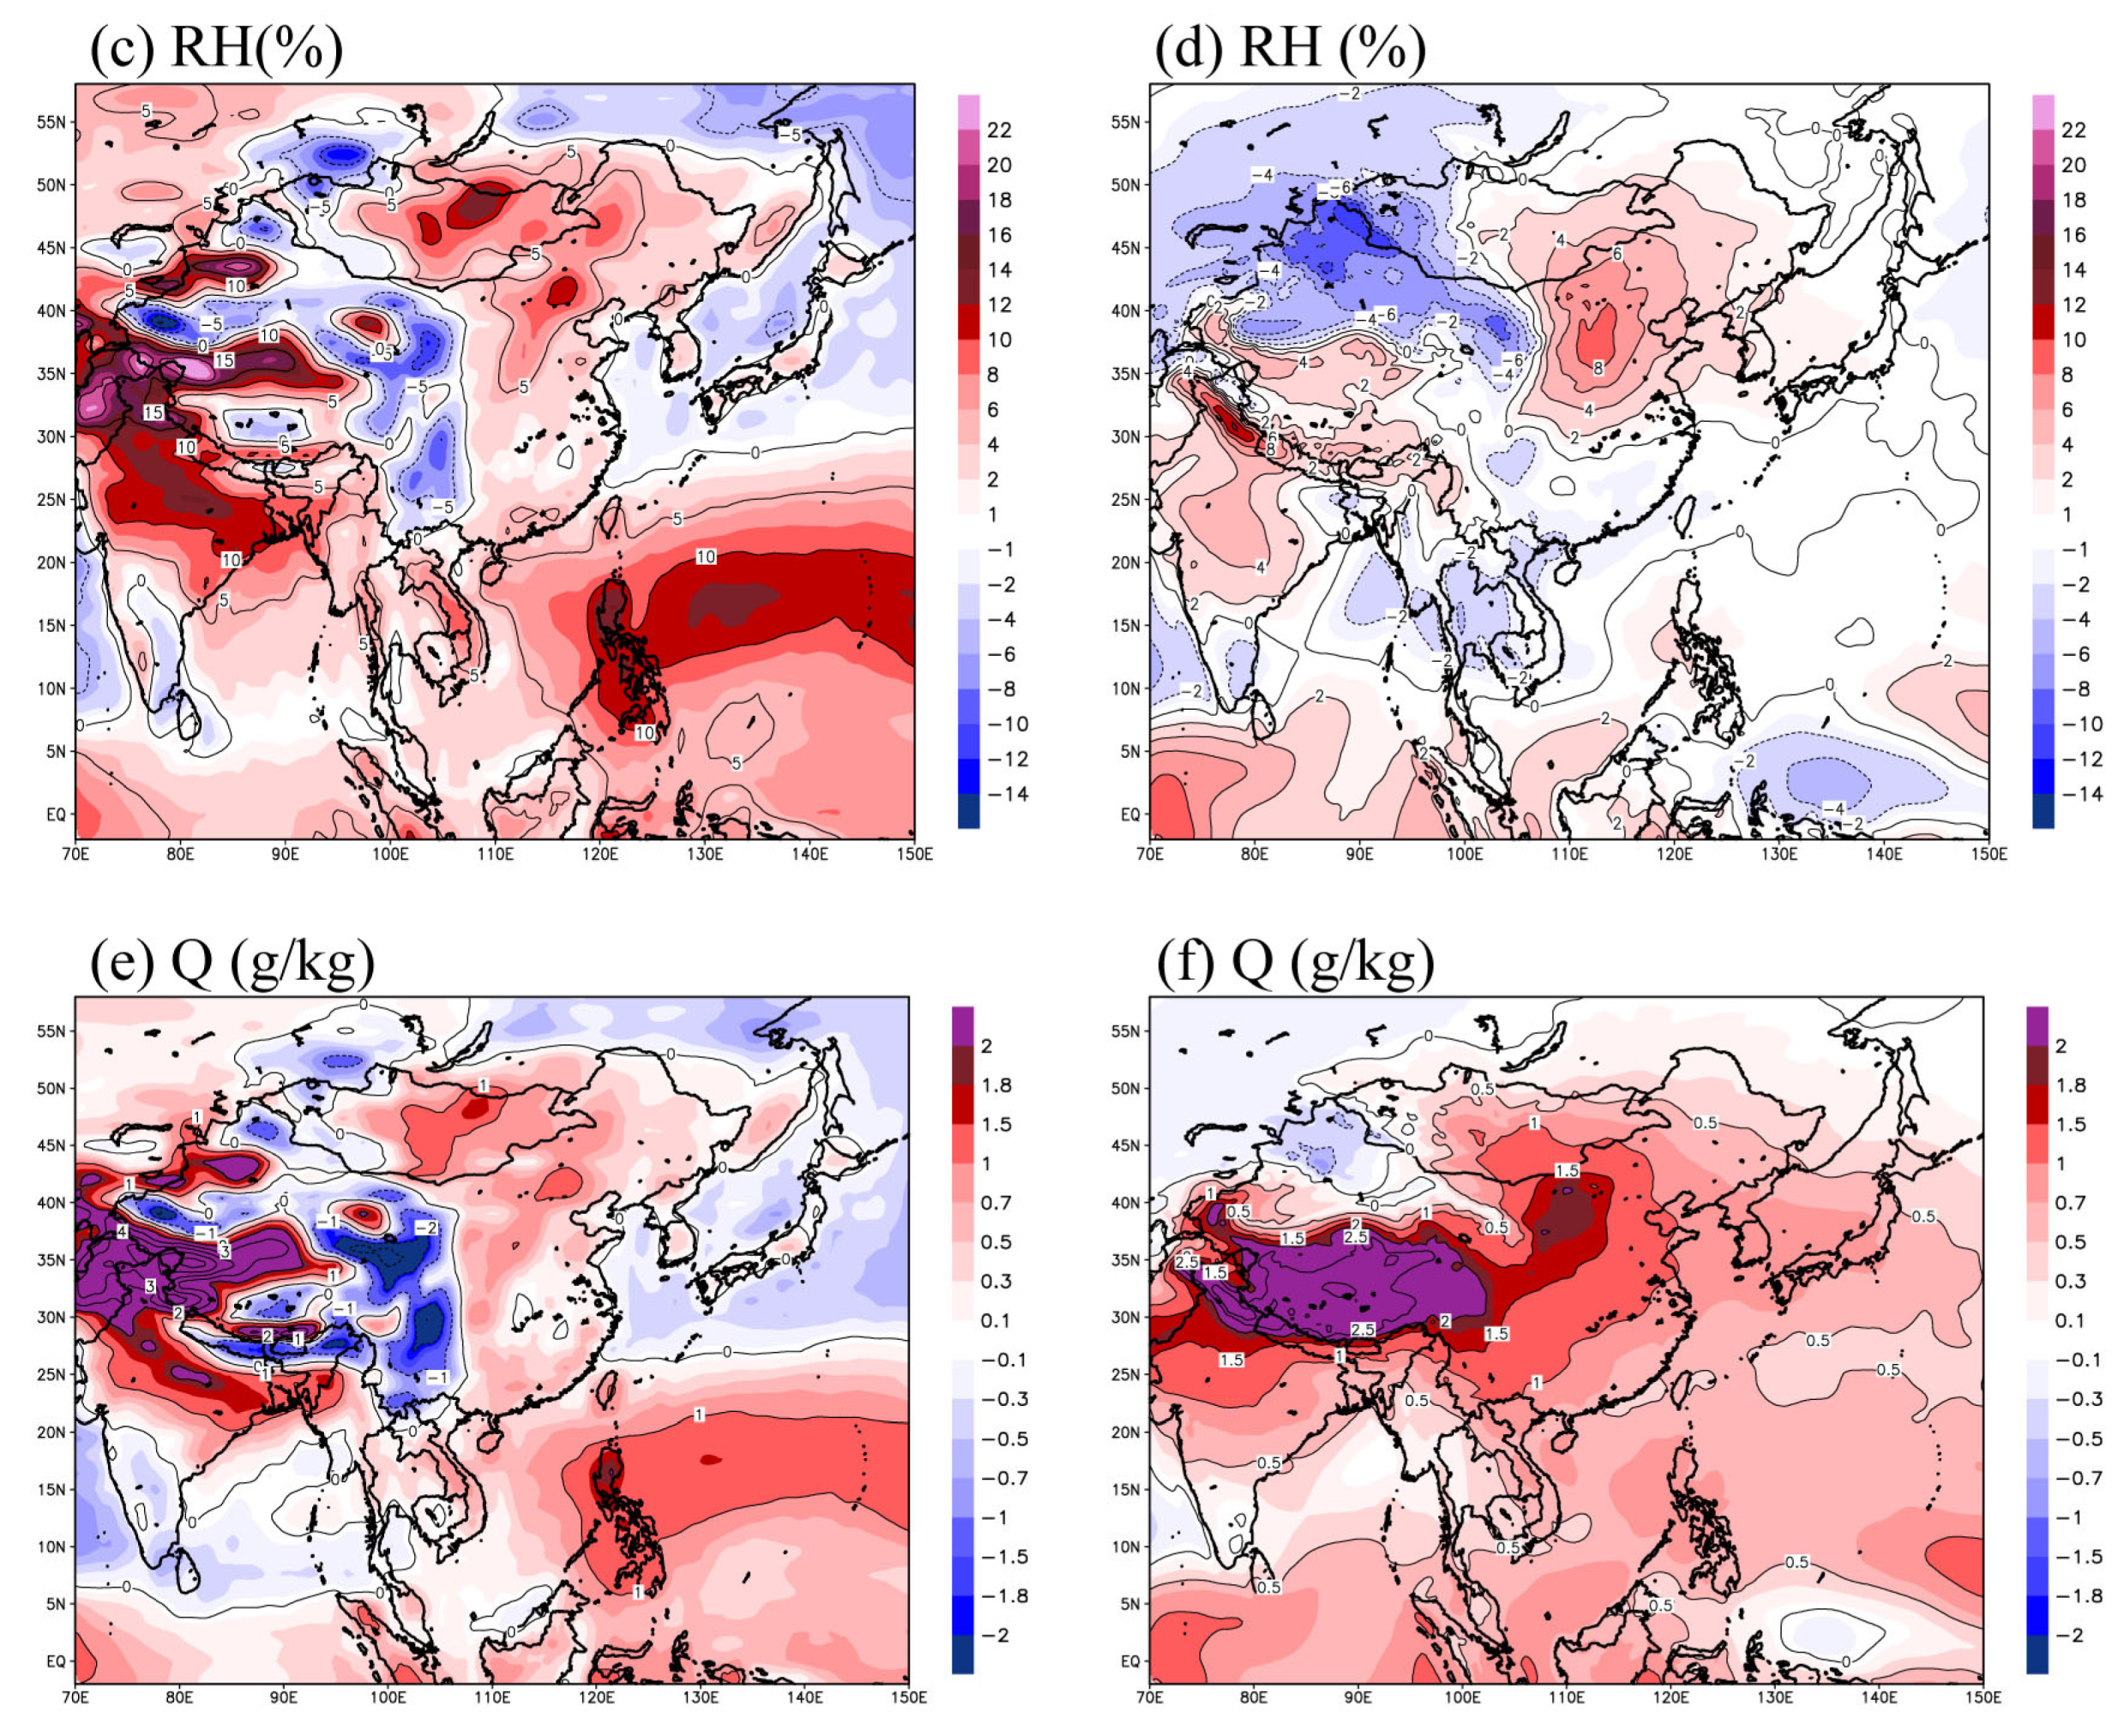
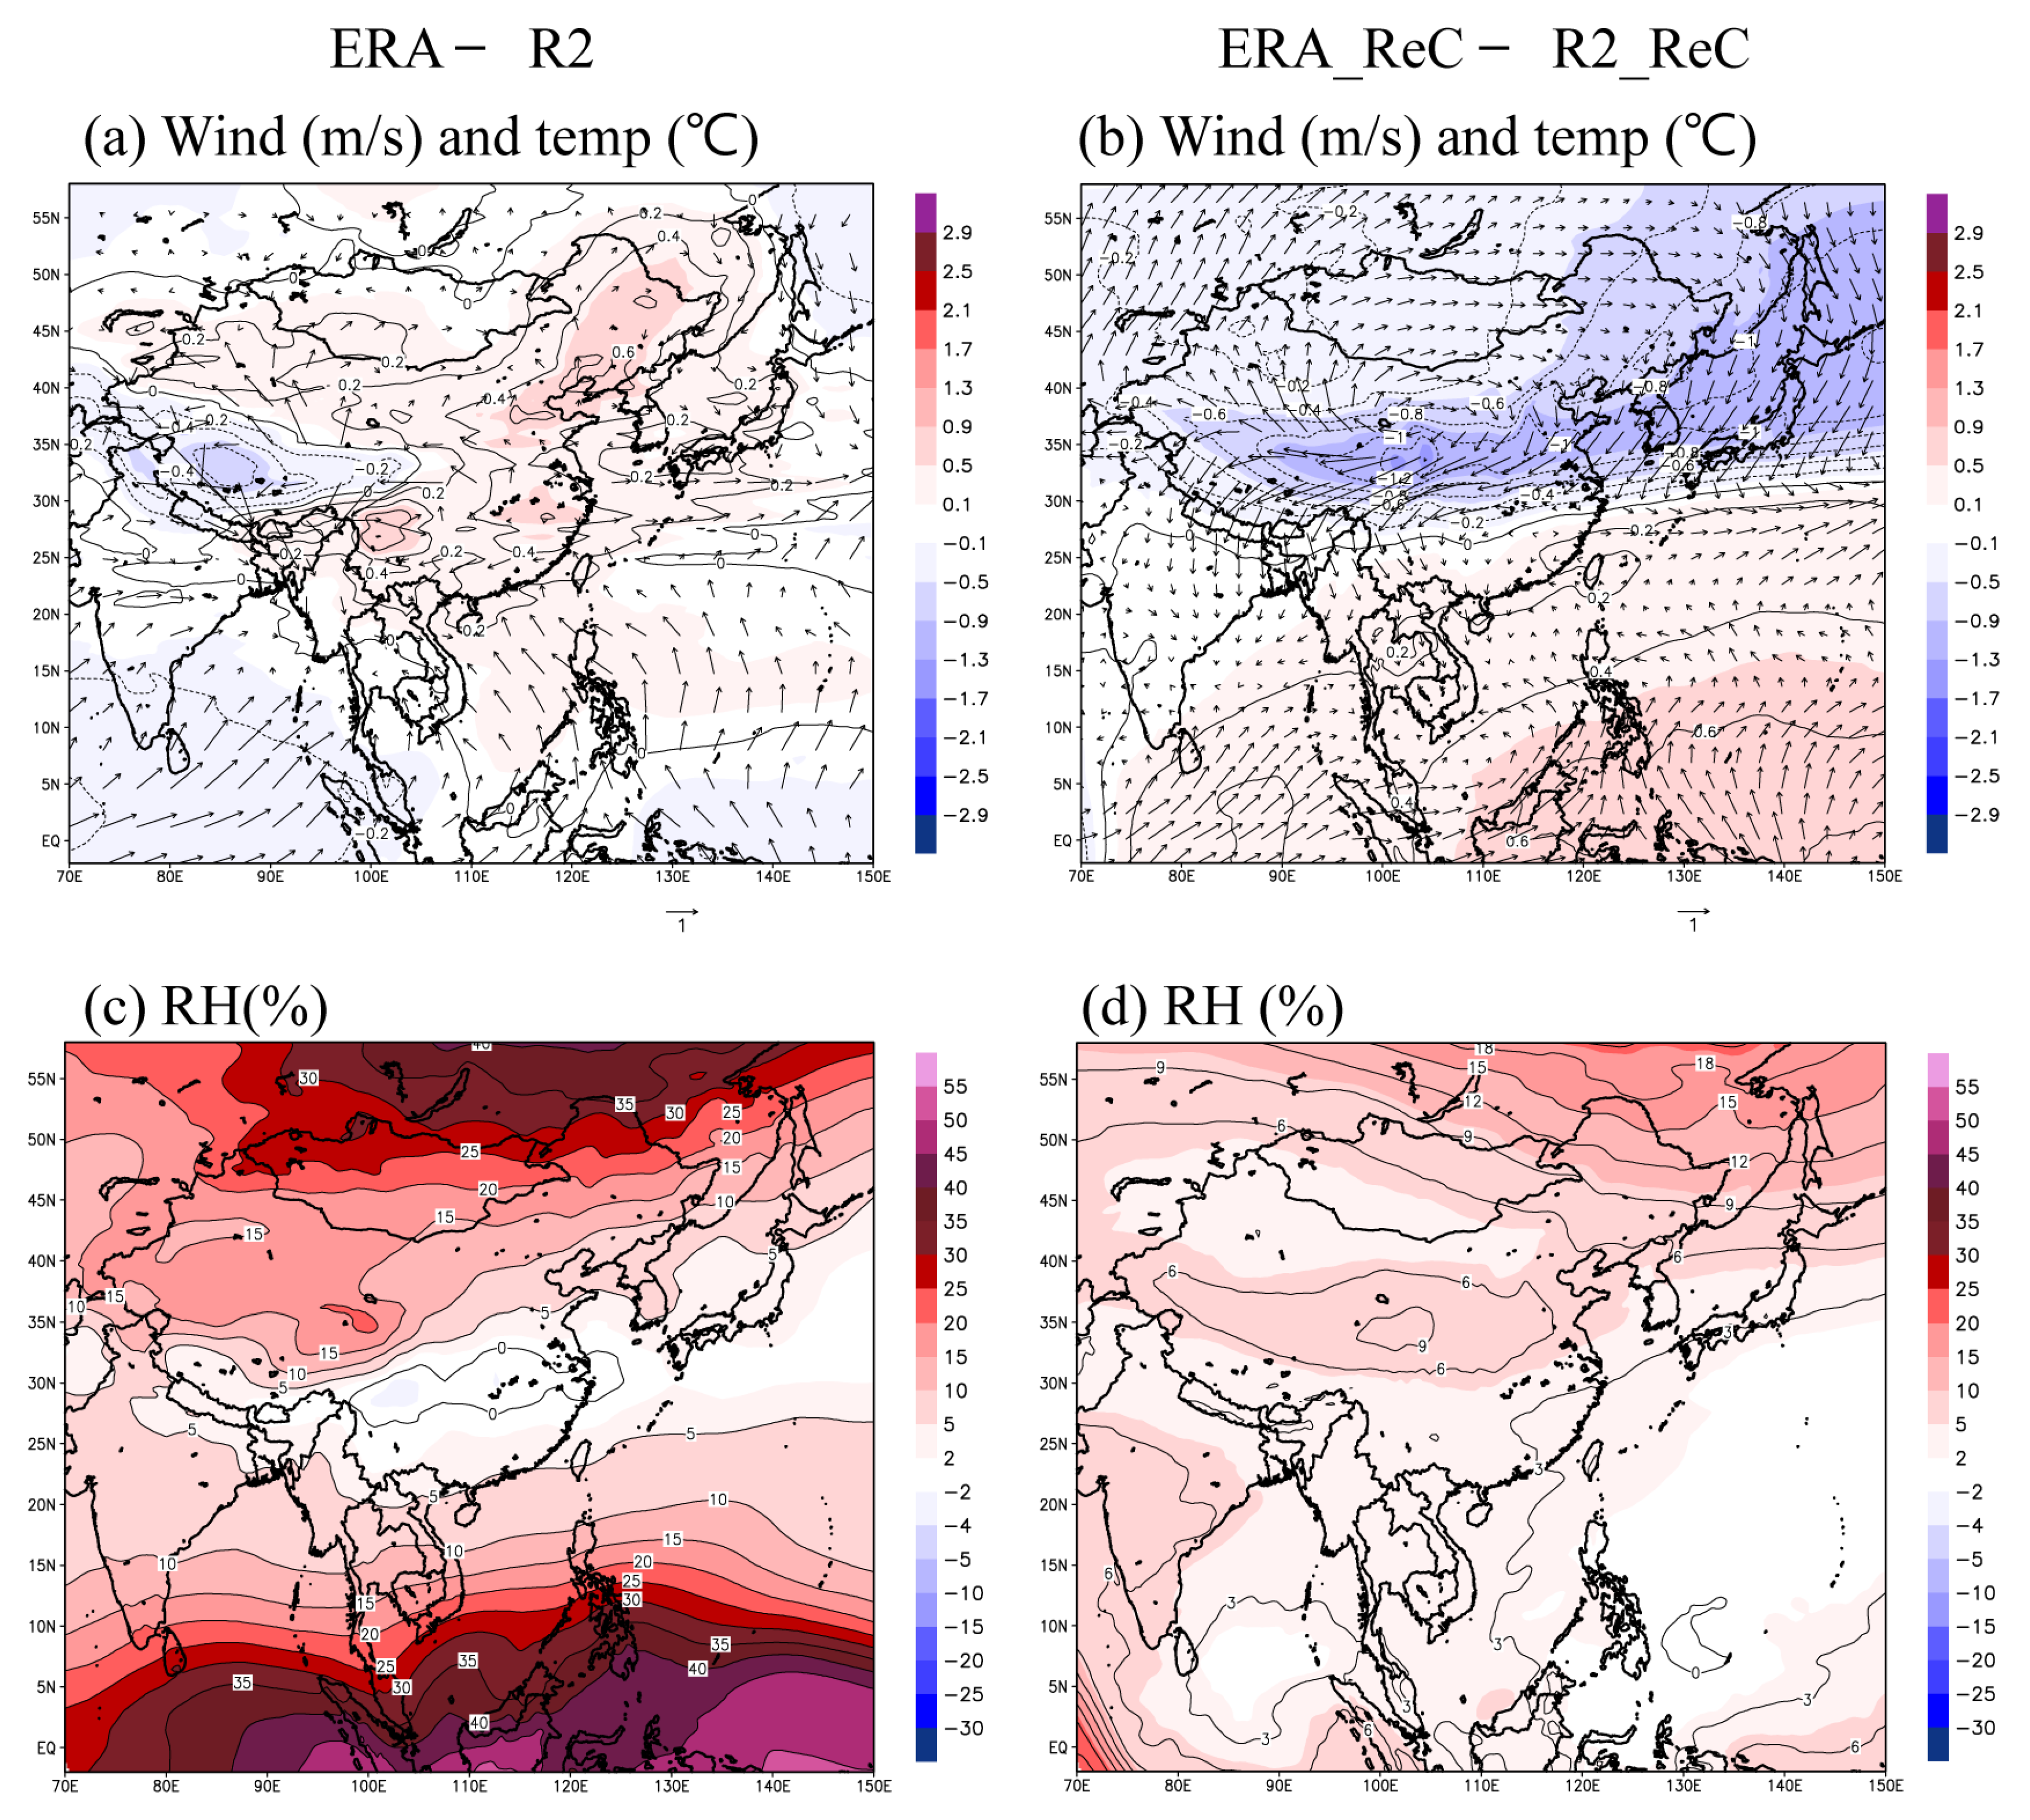
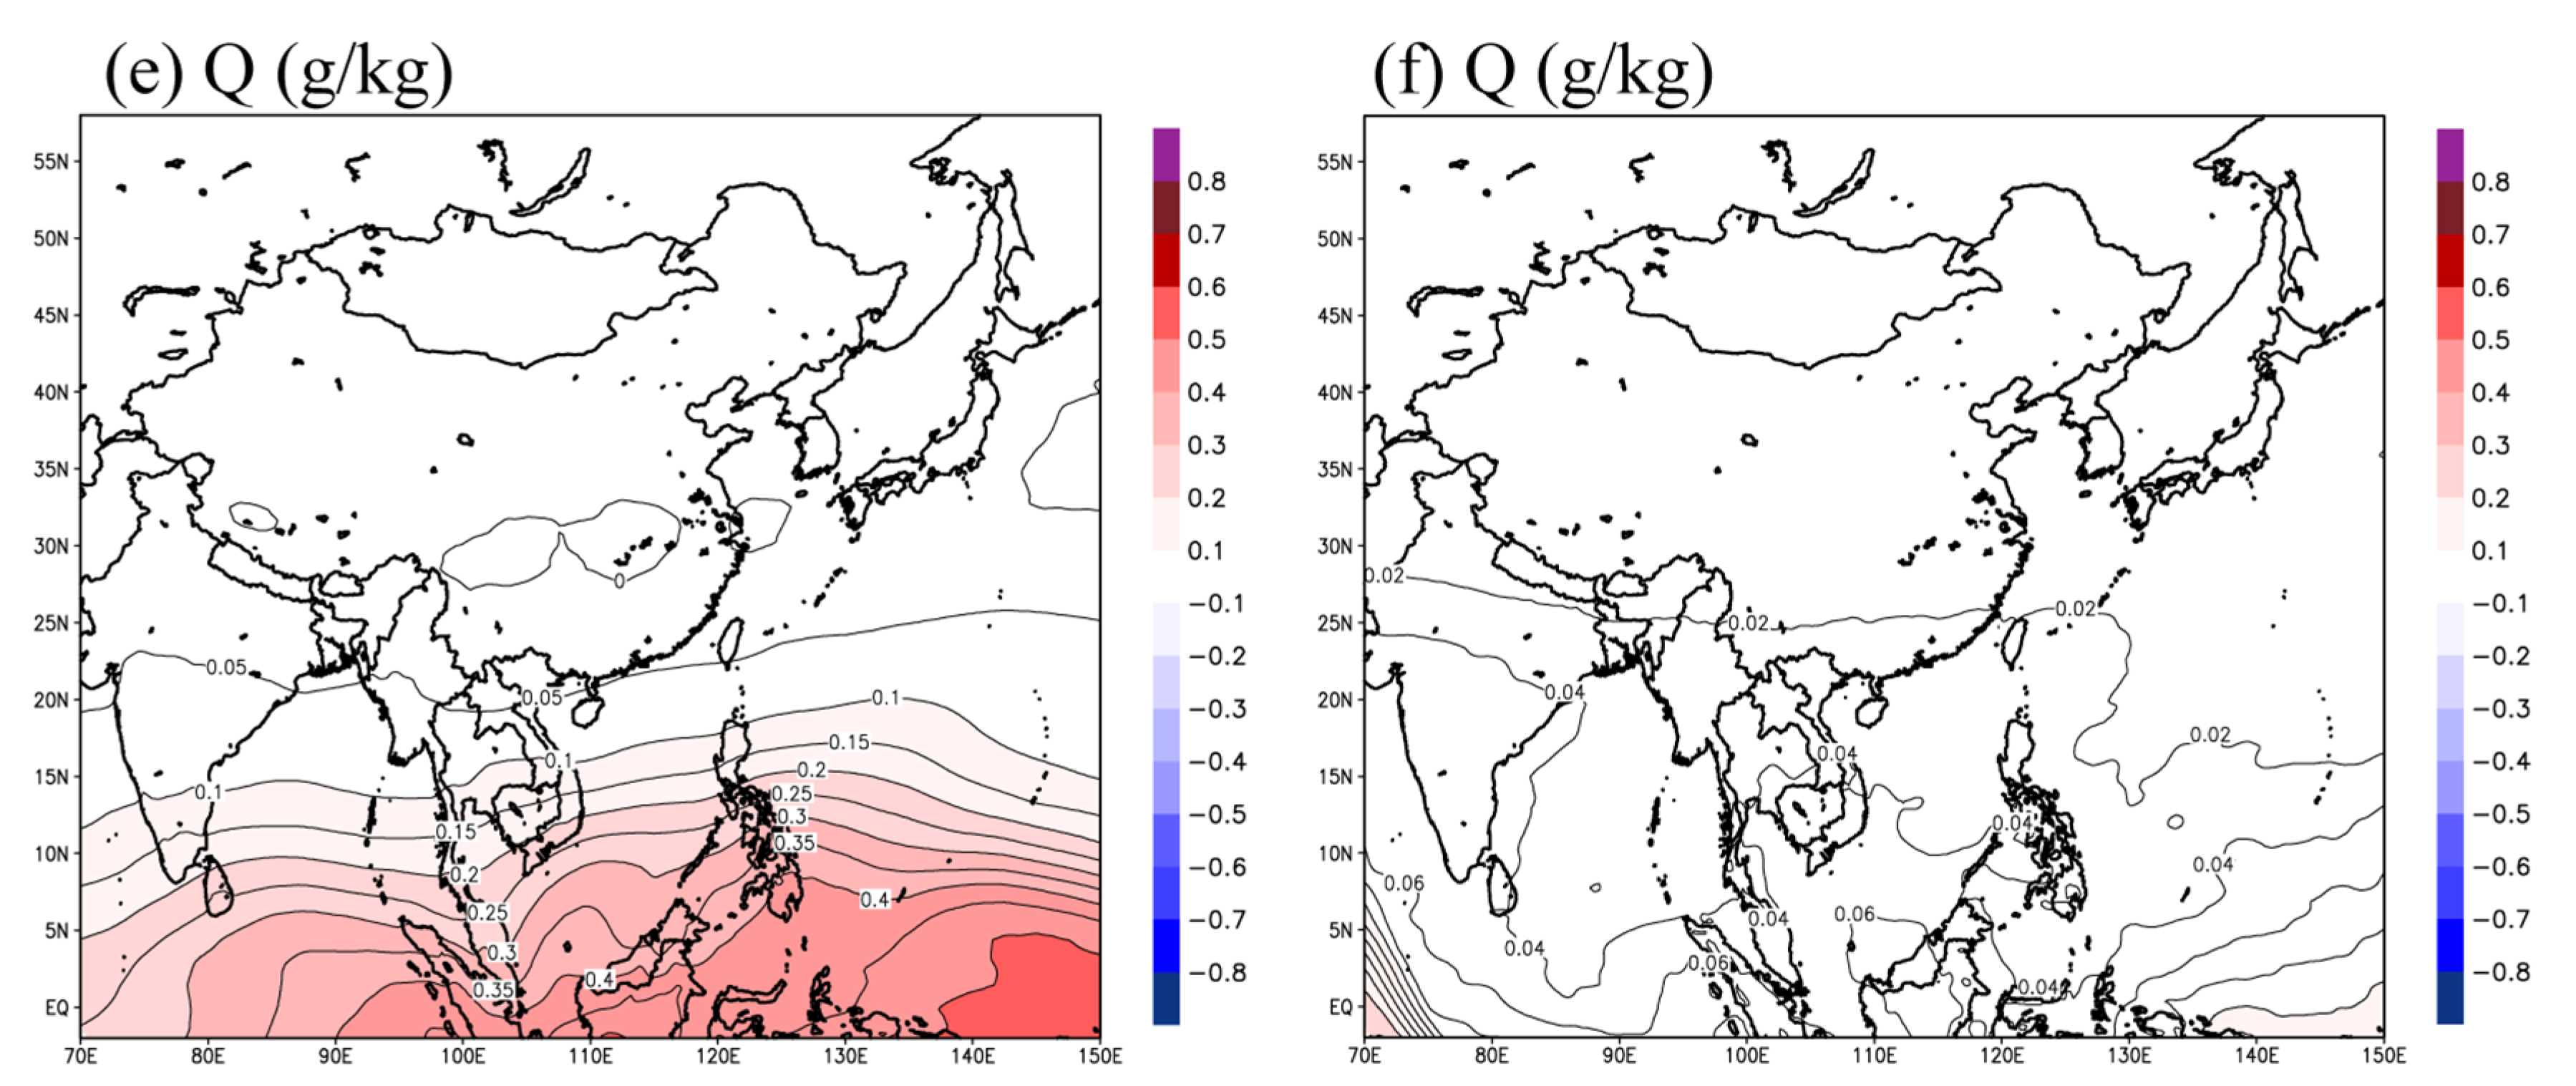
To investigate the causes of simulation differences when the two reanalysis datasets were used as the BCs in RegCM4 simulations, we analyzed the differences in the spatial distribution of the mixing ratio, and the location and intensity of the low-level jet that plays an important role in precipitation processes for the East Asian region during summer (JJA) (Figure 3). Overall, no large differences were found for the location of the low-level jet that is responsible for localized heavy rainfalls in South Korea, but the ERA wind field at 850 hPa, including the northerly winds that blow strongly in the East Sea, showed large differences compared with the R2 wind field, although these differences depend on the region. Particularly large differences were found in the equator region of the Indian Ocean and over southern China and Mongolia. Compared with the R2 data, the ERA wind field showed strong northerly winds over the ocean, e.g., in the western Pacific Ocean, but smaller differences were observed in the central China region and South Korea. The ERA temperature data showed lower values than the R2 data around northern India. However, the differences between the wind fields and temperatures simulated with the two BCs were comparatively large. In particular, compared with R2_ReC, ERA_ReC simulated noticeably higher temperatures in the regions where precipitation was over-simulated, such as the central region of the model domain including Mongolia and the southern China region. As a result, ERA_ReC simulated stronger large-scale cyclonic circulation than R2_ReC in the central region of the model domain, thereby strengthening southerly-southwesterly winds in the regions between India and southern China. In addition, in ERA_ReC, strong easterly-northeasterly winds were simulated in the north region of the model domain, and slightly stronger southerly winds were simulated in South Korea. The ERA dataset showed lower relative humidity (RH) than the R2 dataset in the western China region and the East Sea, but noticeably higher RH values than the R2 dataset in all other regions. The regions where RH was underestimated in ERA_ReC are regions where temperatures were overestimated and the mixing ratios were underestimated in the simulation. In the ERA experiment, a very high RH was simulated in northeastern China as a result of over-simulation of mixing ratios, even though simulated temperatures were similar in the ERA and R2 experiments. In ERA_ReC, the mixing ratios were noticeably high in most of the model domains where precipitation was over-simulated, except for the western Mongolia region. The over-simulation of convective precipitation in the central regions of the model domain, such as in central China, may be explained by the simulated strong southerly winds and the mixing ratios in ERA_ReC compared with R2_ReC.
Figure 3. Spatial distribution of 20-year summer mean differences for (a,b) wind field (m/s) and temperature (°C); (c,d) relative humidity (RH, %); and (e,f) mixing ratio (Q, g/kg) at 850 hPa between the two BCs (ERA, R2) (Left) and between the two simulations (ERA_ReC, R2_ReC) forced by the ERA and R2 datasets (right).
Atmosphere 06 00783 g003aAtmosphere 06 00783 g003b
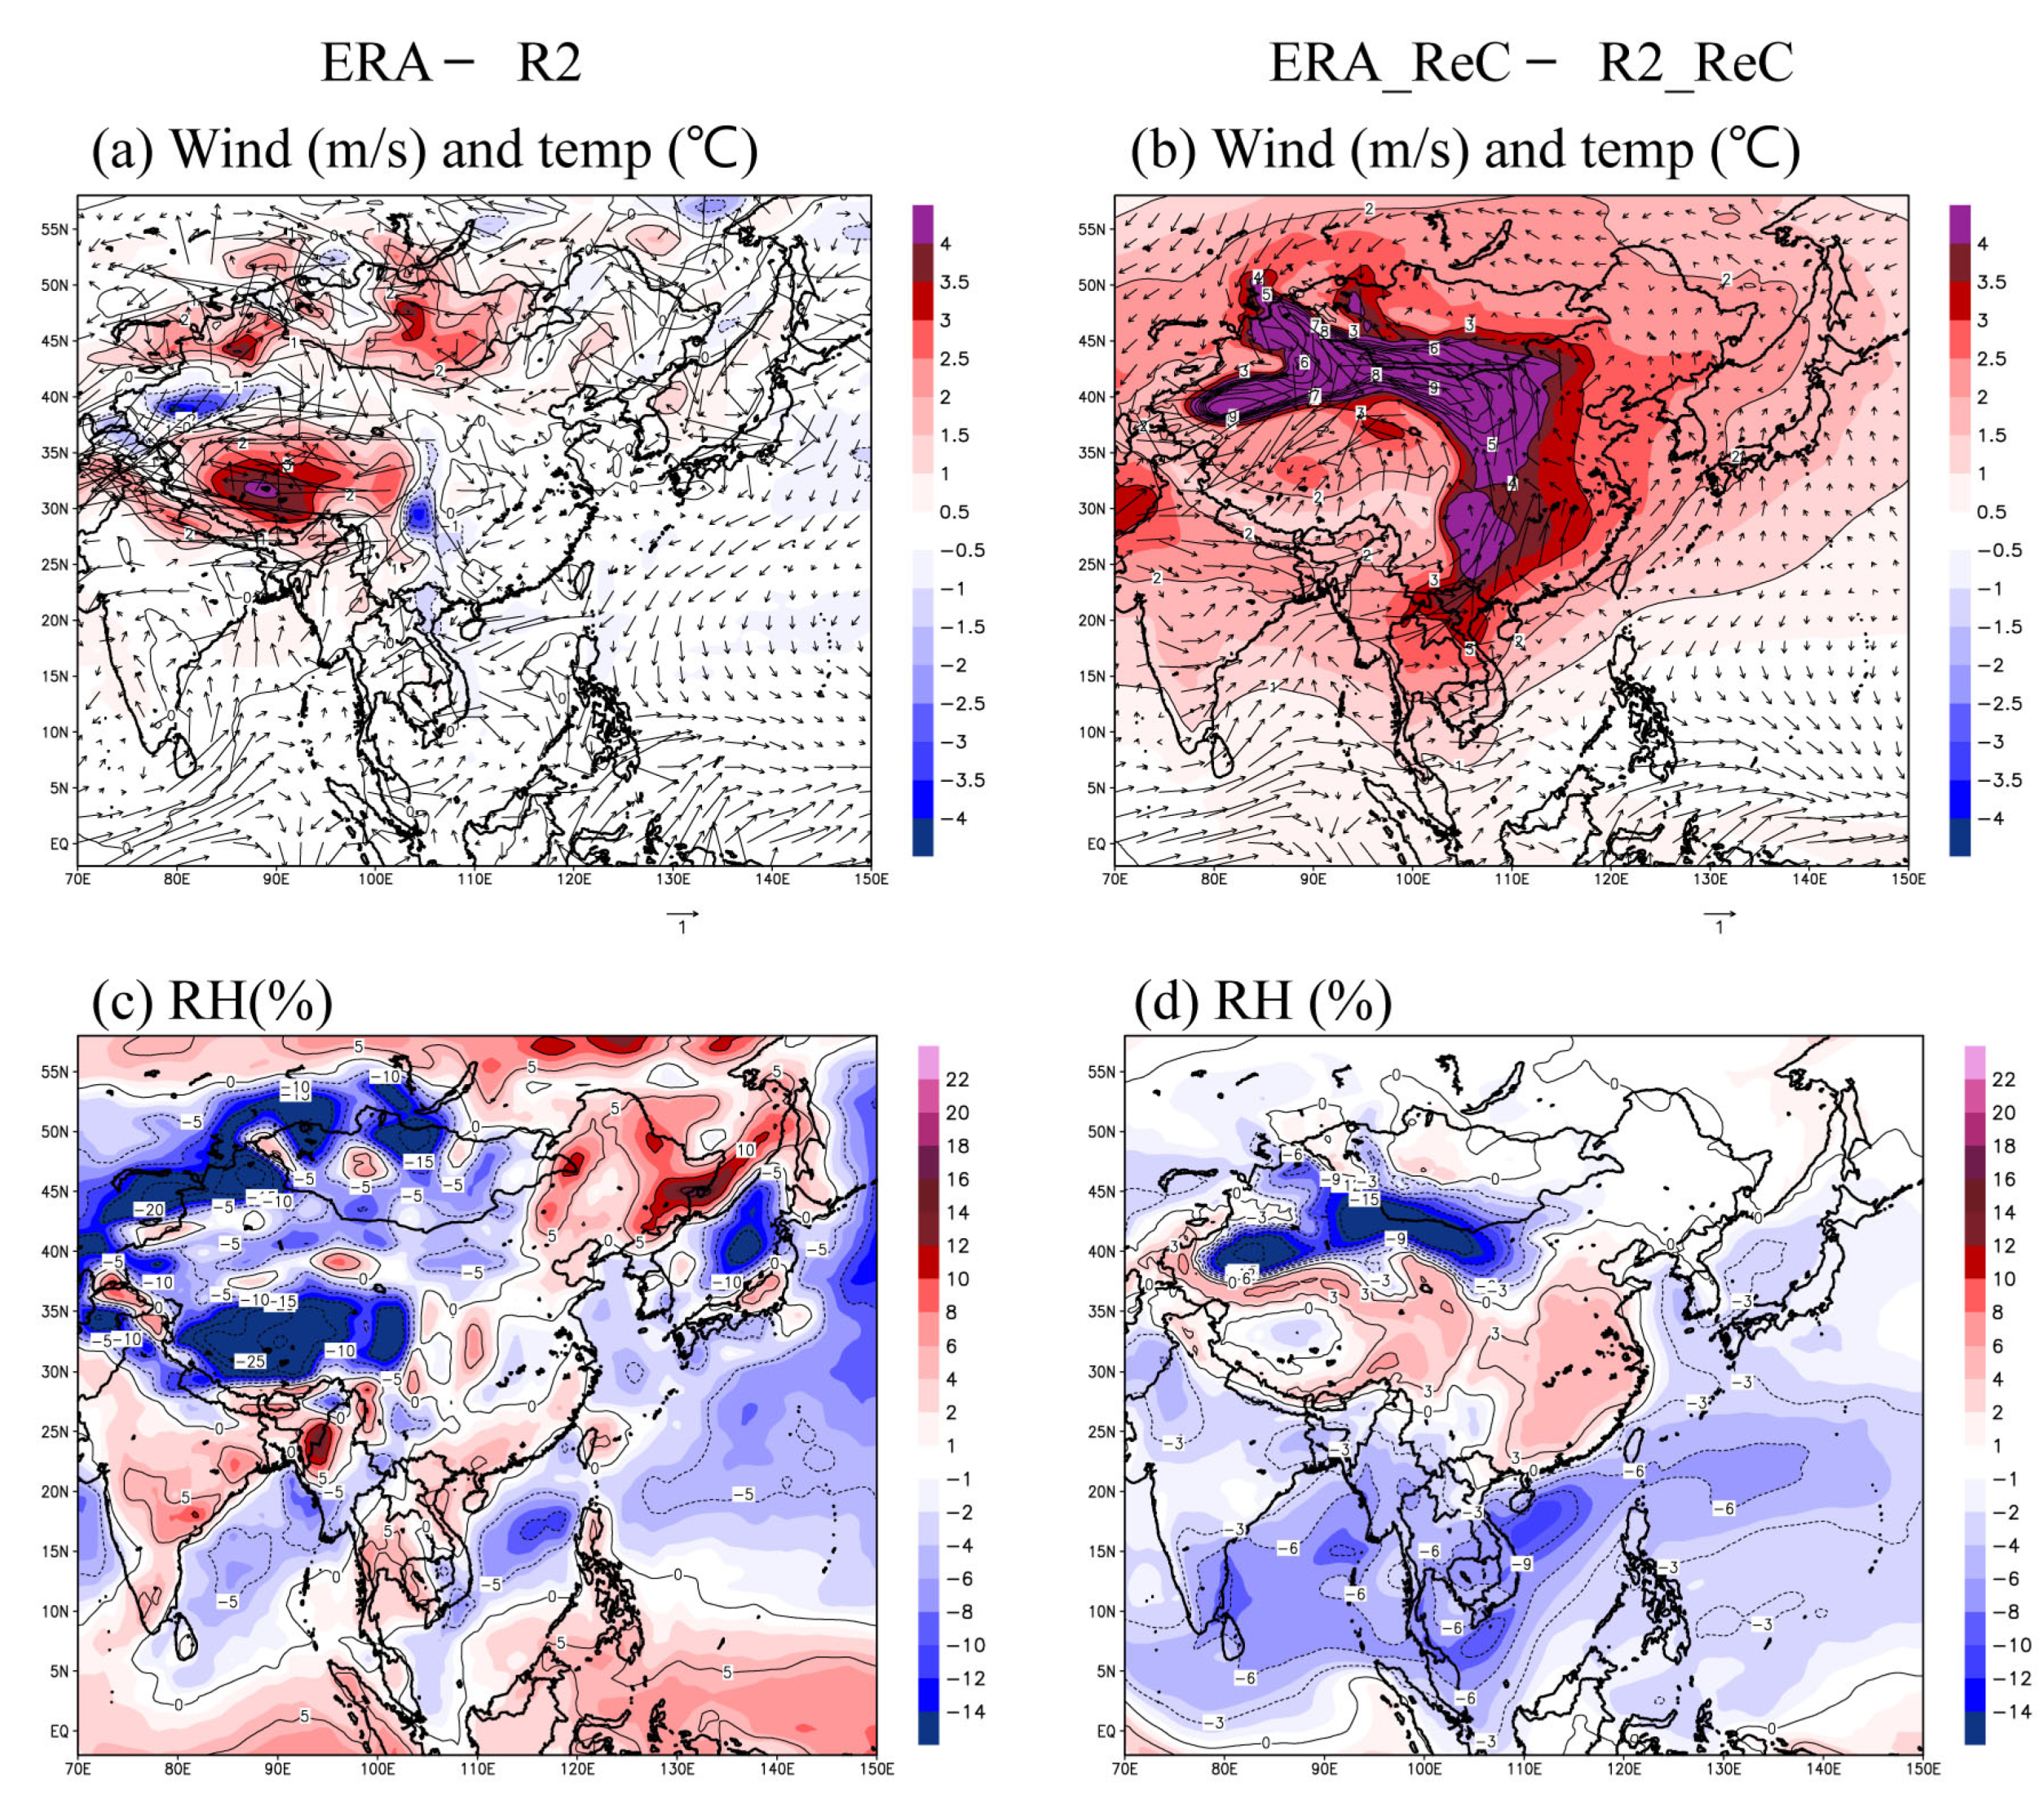
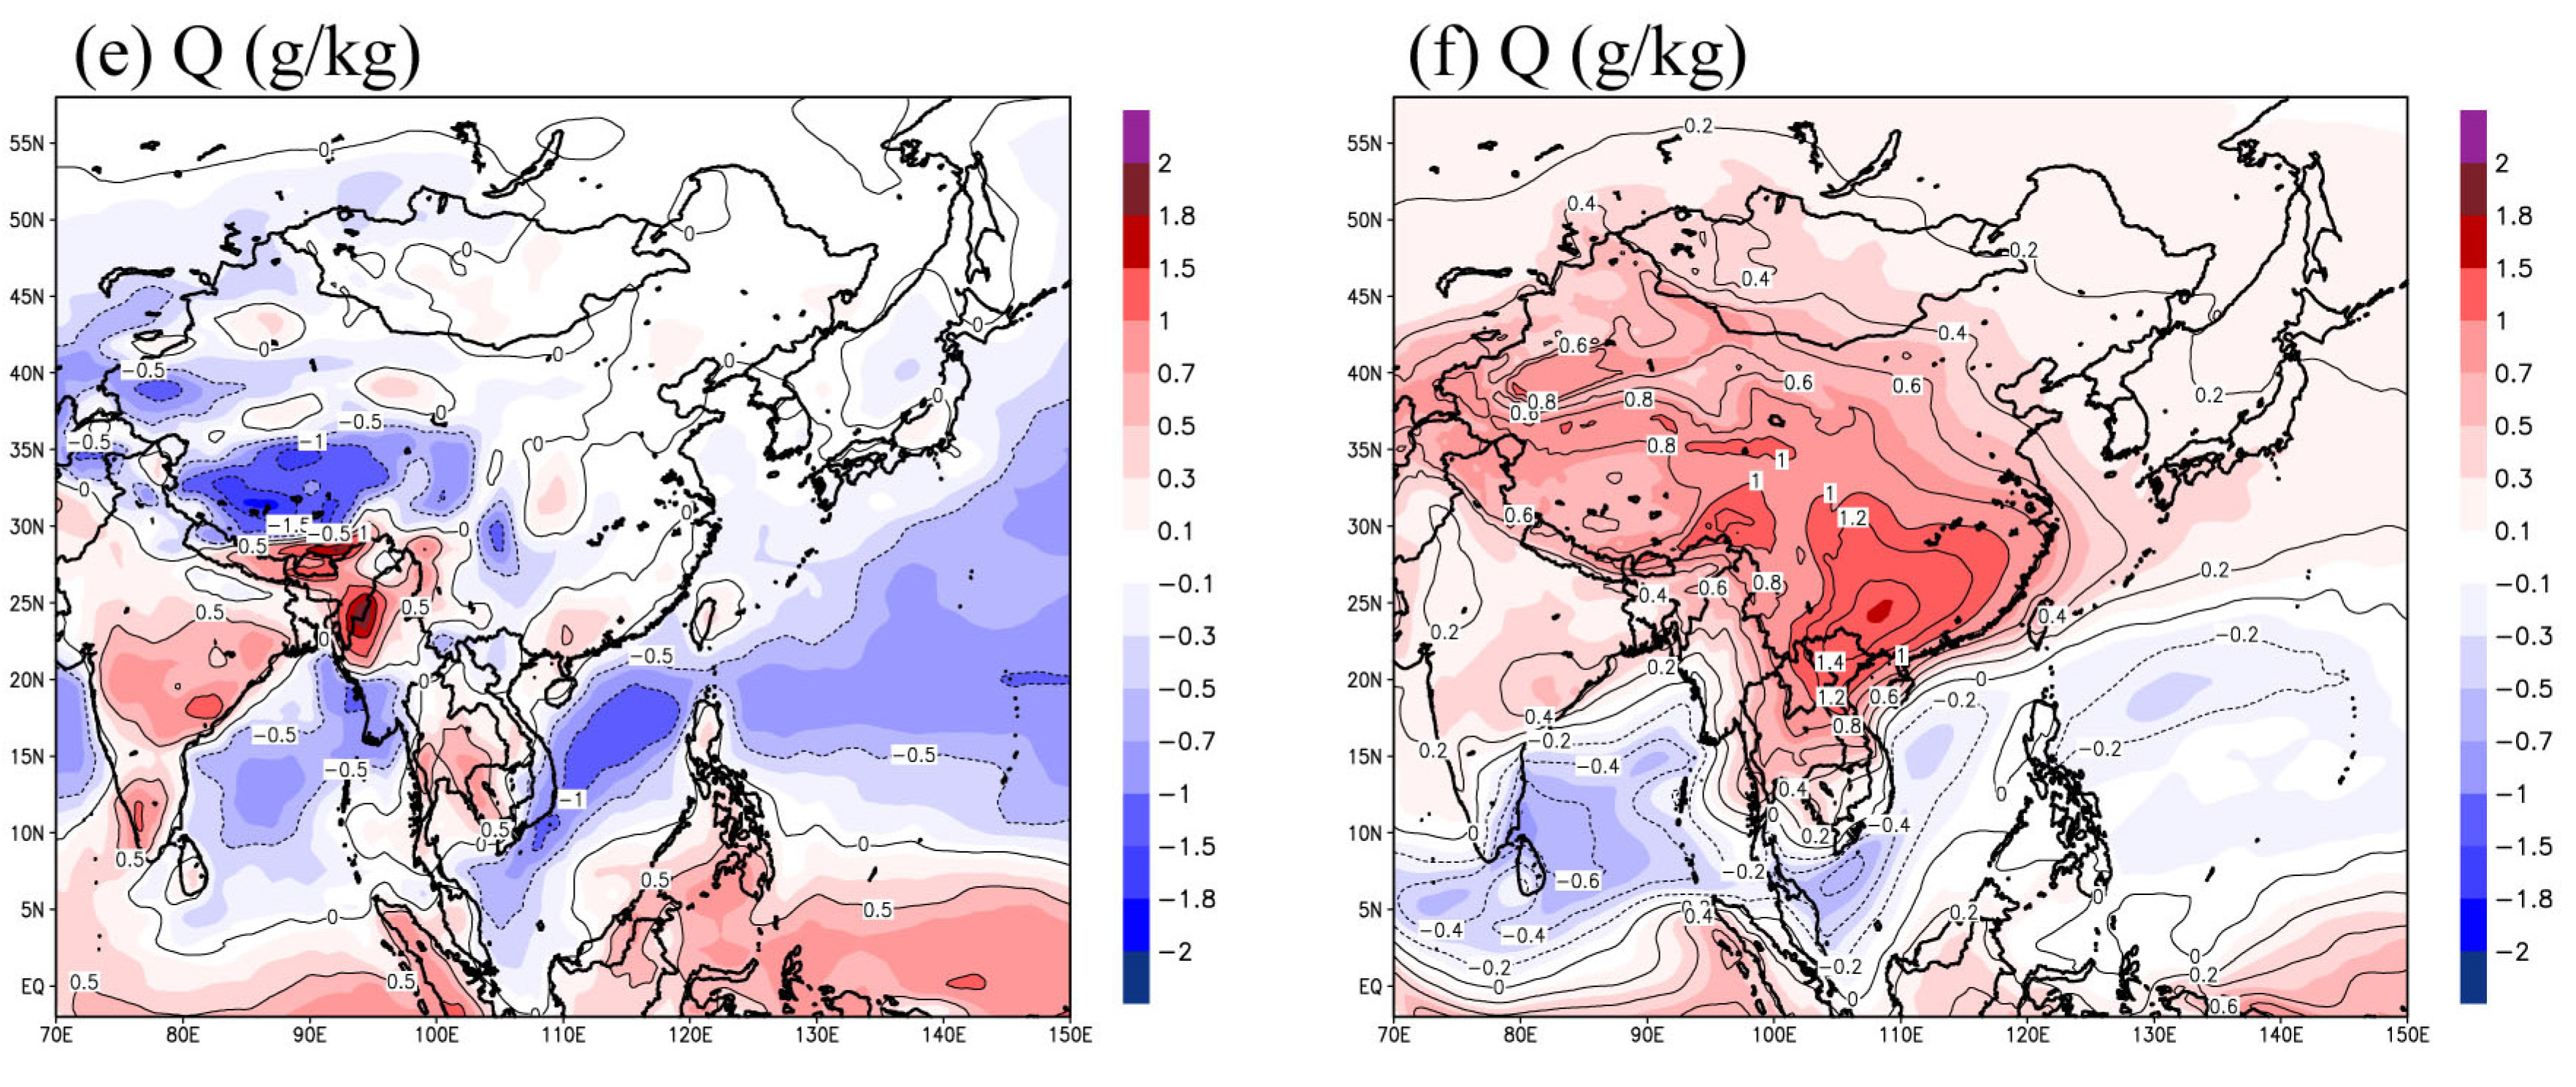
The wind field differences at 850 hPa between the ERA and R2 data were substantially larger in winter than in summer (Figure 4). For the ERA dataset, southerly winds are dominant in the Indian Ocean and the coastal regions of the Philippines, and northerly winds are dominant in the western Pacific Ocean. In continental regions, however, there are large differences, independent of the region, but without any systematic patterns. In general, winter temperatures are higher in the ERA data than in the R2, except for some regions such as the northwestern region and the Tibetan Plateau. However, the wind fields and temperatures simulated using the two BCs showed very different patterns except in the southern sea region of the model domain. In particular, the noticeably over-simulated temperatures of ERA_ReC in China and Mongolia resulted in very different wind fields in these regions. In addition, in the seas surrounding the Korean peninsula, unlike the differences between the reanalysis datasets, stronger southerly winds were simulated in ERA_ReC. In winter, ERA dataset shows higher RH than R2 dataset in China, and noticeably lower RH than R2 dataset in most regions including northern China, Mongolia, the South China Sea, and the western Pacific Ocean. The mixing ratio differences between the two reanalysis datasets were not significant except for the South China Sea, India, and the Indian Ocean. As in summer, the differences in the RH and mixing ratios simulated with the two BCs showed a very different pattern to the differences between the two original reanalysis datasets. ERA_ReC simulated a higher mixing ratio than R2_ReC in most continental regions, excluding the Indian Ocean and the South China Sea. In the southern China region, in particular, the mixing ratio differences were shown to be as large as 1 g/kg. Compared to R2_ReC, ERA_ReC simulated higher RH at the center of the model domain (e.g., central China), but simulated lower RH in most other regions. ERA_ReC simulated noticeably lower RH in Mongolia, where the simulated mixing ratios were slightly higher but the simulated temperatures were noticeably higher, and it simulated higher RH in eastern China, where both simulated mixing ratios and temperatures were noticeably higher. In ERA_ReC, the total precipitation during winter (DJF) in eastern China and the South China Sea were over- and under-simulated, respectively, even though the intensity was low. This seems to be related to over- or under-simulated RHs in these regions as the result of over- or under-simulated mixing ratios and similar or over-simulated temperatures as compared to R2_ReC. In addition, the difference of total precipitation in these regions during winter (DJF) seem to be related to the combined differences of RegCM4 simulations for non-convective and convective precipitation.
Figure 4. Spatial distribution of 20-year winter mean differences for (a,b) wind field (m/s) and temperature (°C); (c,d) relative humidity (RH, %); and (e,f) mixing ratio (Q, g/kg) at 850 hPa between the two BCs (ERA, R2) (left) and between the two simulations (ERA_ReC, R2_ReC) forced by the ERA and R2 datasets (right).
Atmosphere 06 00783 g004aAtmosphere 06 00783 g004b
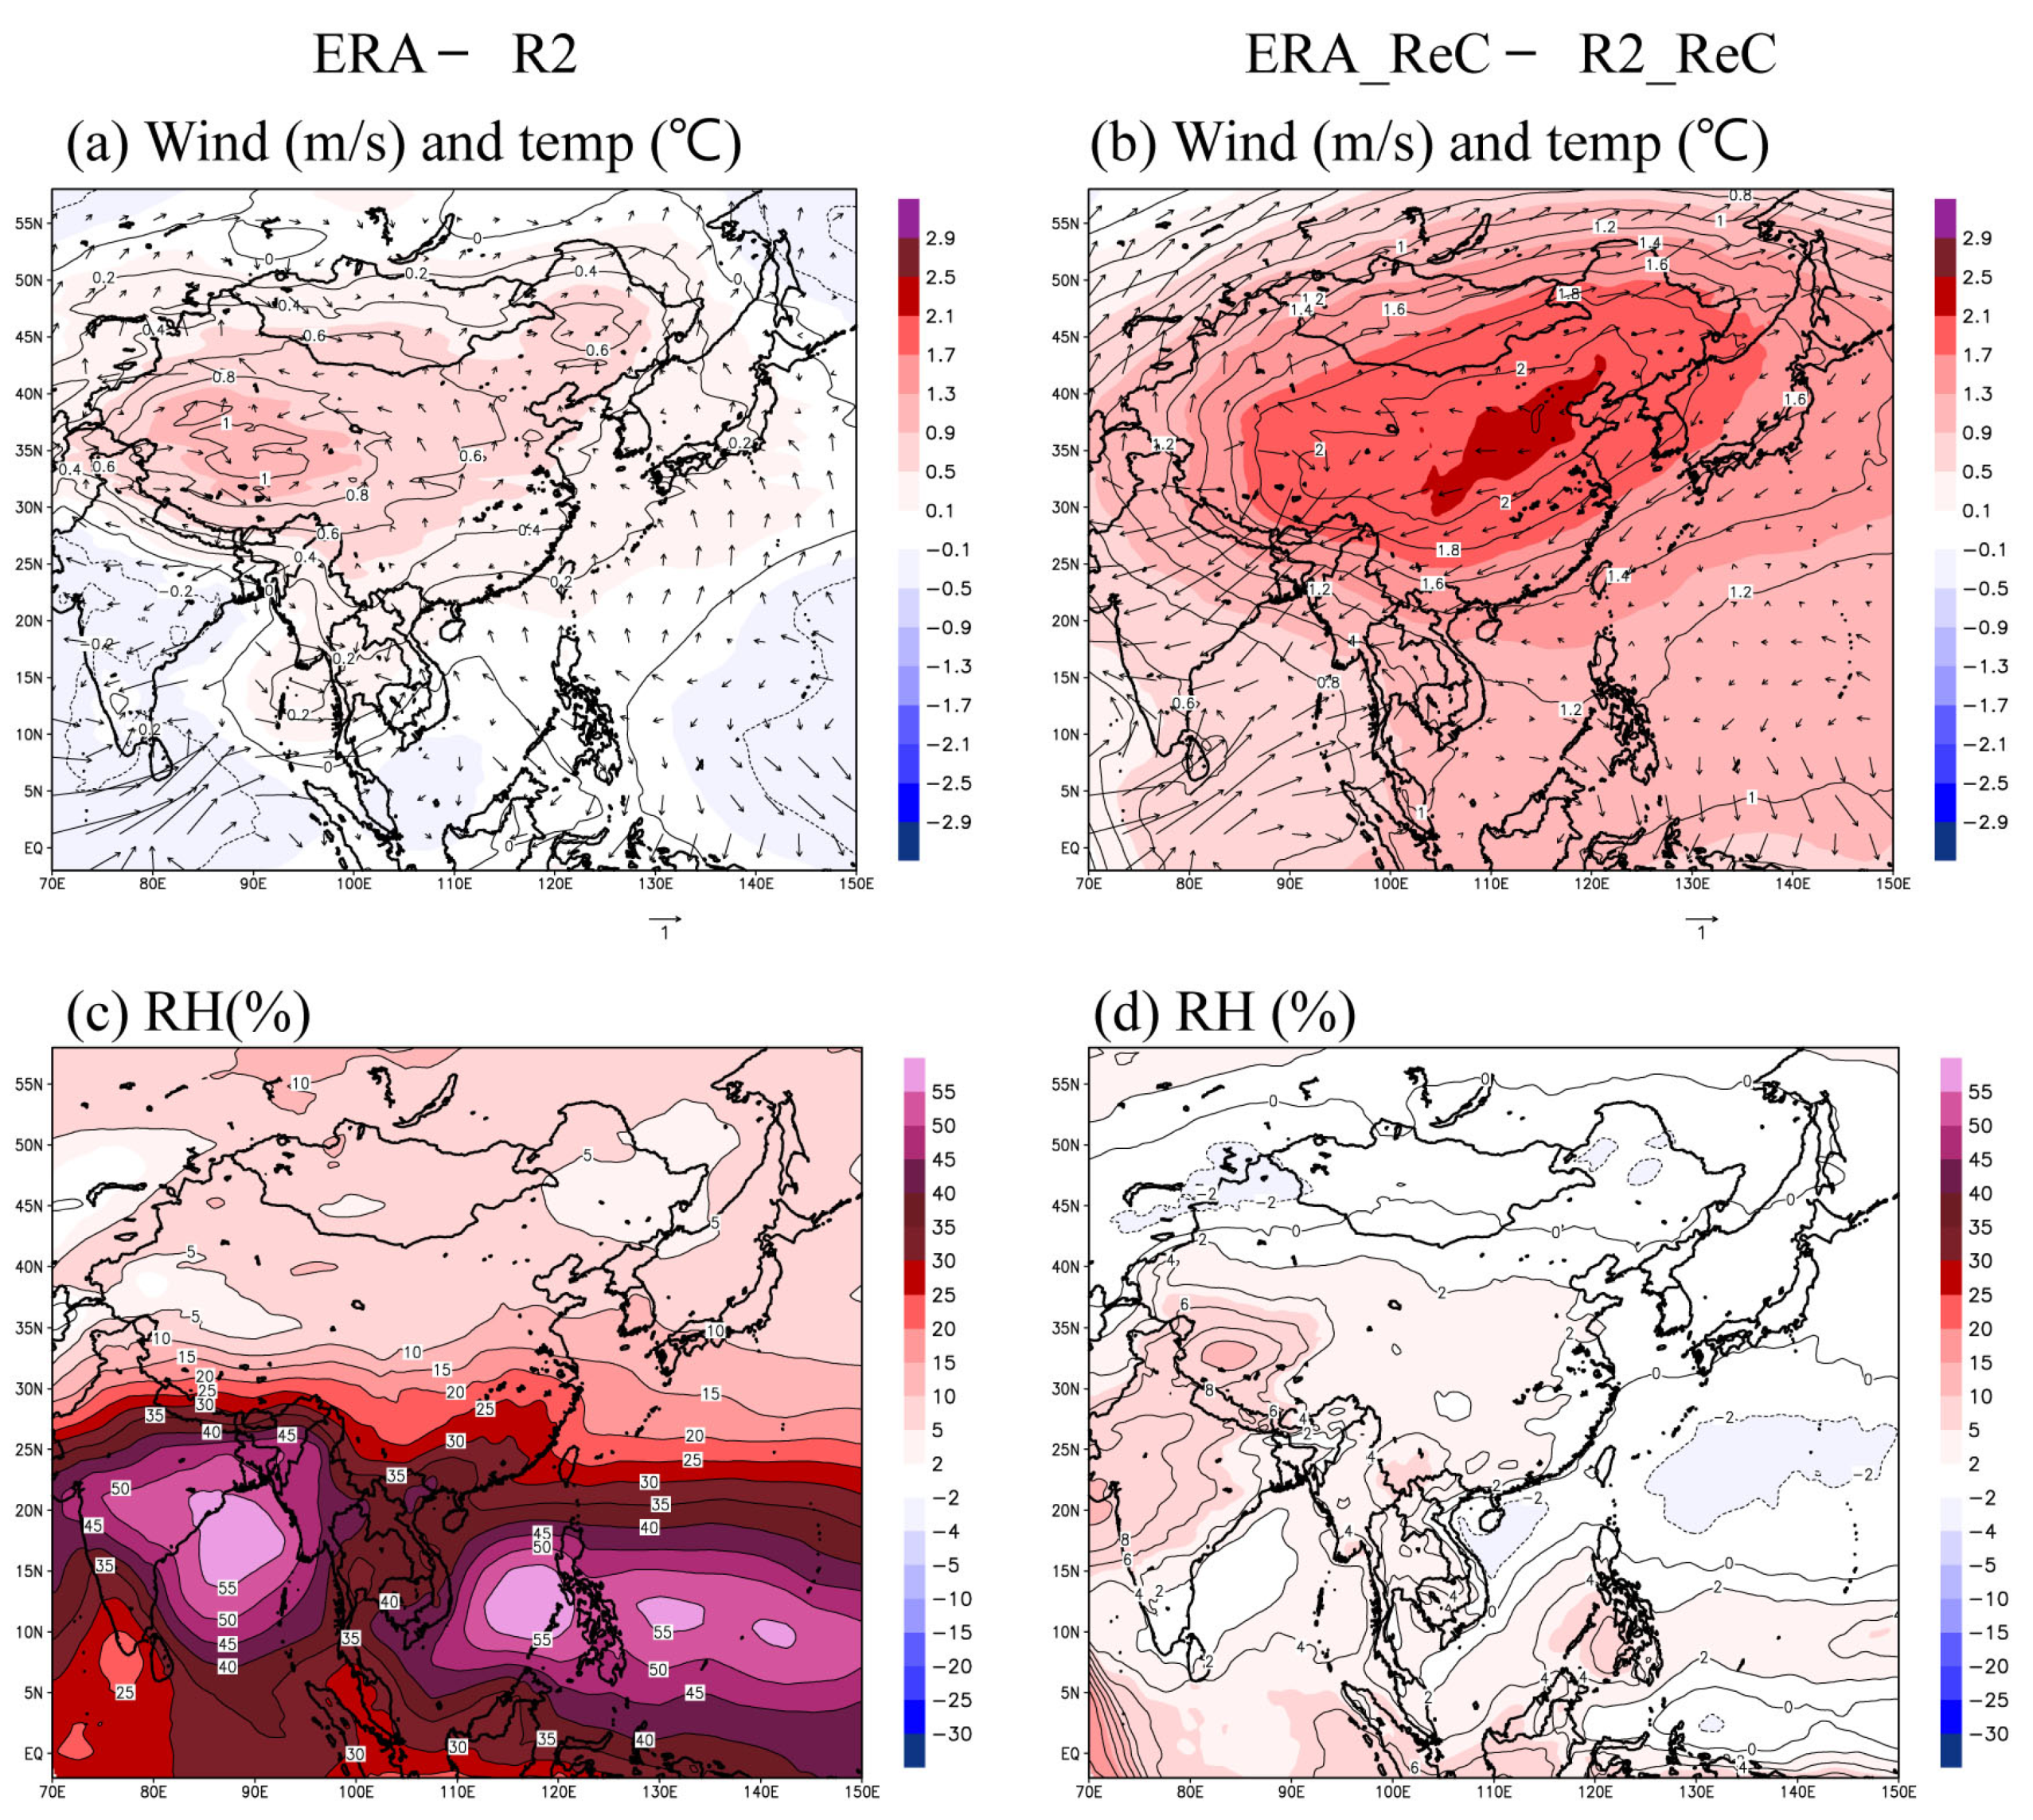
Figure 5. Spatial distribution of 20-year summer mean differences for (a,b) wind field (m/s) and temperature (°C); (c,d) relative humidity (RH, %); and (e,f) mixing ratio (Q, g/kg) at 300 hPa between the two BCs (ERA, R2) (left) and between the two simulations (ERA_ReC, R2_ReC) forced by the ERA and R2 datasets (right).
Atmosphere 06 00783 g005aAtmosphere 06 00783 g005b
Figure 6. Spatial distribution of 20-year winter mean differences for (a,b) wind field (m/s) and temperature (°C); (c,d) relative humidity (RH, %); and (e,f) mixing ratio (Q, g/kg) at 300 hPa between the two BCs (ERA, R2) (left) and between the two simulations (ERA_ReC, R2_ReC) forced by the ERA and R2 datasets (right).
Atmosphere 06 00783 g006aAtmosphere 06 00783 g006b
As shown in Figure 5, the differences of the wind fields, temperature, RH, and mixing ratios at 300 hPa in summer were significant for both the two reanalysis datasets and the simulation results. The temperatures of the ERA dataset were slightly higher compared with those of the R2 dataset in the center of the model domain, which resulted in strong anticyclonic circulation in the entire model domain. However, in the simulation results, the positive differences region migrated from the western Tibetan region to the eastern China region, and the intensity of the positive differences was significantly enhanced. As a result, the anticyclonic circulation was greatly reinforced in most regions, excluding the southern boundary sea regions of the model domain, such as the Indian Ocean. The ERA dataset showed noticeably higher mixing ratios and RH in the southern regions of the model domain compared with the R2 dataset, but small differences in the northern regions resulted in a large meridional contrast. However, the mixing ratios and RH simulated with the two BCs were very similar irrespective of the region. The enhanced positive differences of temperature and greatly weakened mixing ratios in the southern part of the model domain resulted in significant decreases in the meridional contrast and absolute positive differences in the RH. Additionally, significant decreases in the mixing ratios in the southern part of the model domain can be explained by the combined effects of enhanced north-eastward transport of moisture by the increased low-level jet, and enhanced precipitation in the ERA-ReC, as shown in Figure 2 and Figure 3. For wind fields in the upper troposphere, weak differences, compared with the differences between the two reanalysis datasets, were found between the two simulations; this seems to be the result of applying spectral nudging, which gives large weight to the upper layer during the simulation processes.
In winter, while the temperature differences between the two reanalysis datasets were not large, considerable differences were seen in the wind fields. In particular, the ERA dataset showed stronger southerly winds than the R2 dataset in the southern regions of the model domain (Figure 6). In the simulations, the temperatures and wind fields at 300 hPa for winter showed different patterns compared with the differences between the two reanalysis datasets. As the temperature differences became negative at the center of the model domain, where the ERA dataset showed higher temperatures, the anticyclonic circulation on the boundary of Mongolia and China was strengthened, thus weakening the jet above central China. In winter, the ERA dataset showed noticeably higher RH in the southern sea regions, and in the north excluding the center of the model domain, and a high mixing ratio was only seen in the southern sea regions of the model domain. However, in the simulations, most of the positive differences in the mixing ratio and RH in the southern sea regions were weakened; additionally, the intensity of the positive RH differences in the northern regions was weakened and the maximum difference region moved east. This may be ascribed to the lower temperatures simulated in the East Sea and the higher temperatures in the southeastern sea regions in ERA_ReC, although the mixing ratios were simulated at similar levels in the two experiments.
3.2. Vertical Profiles

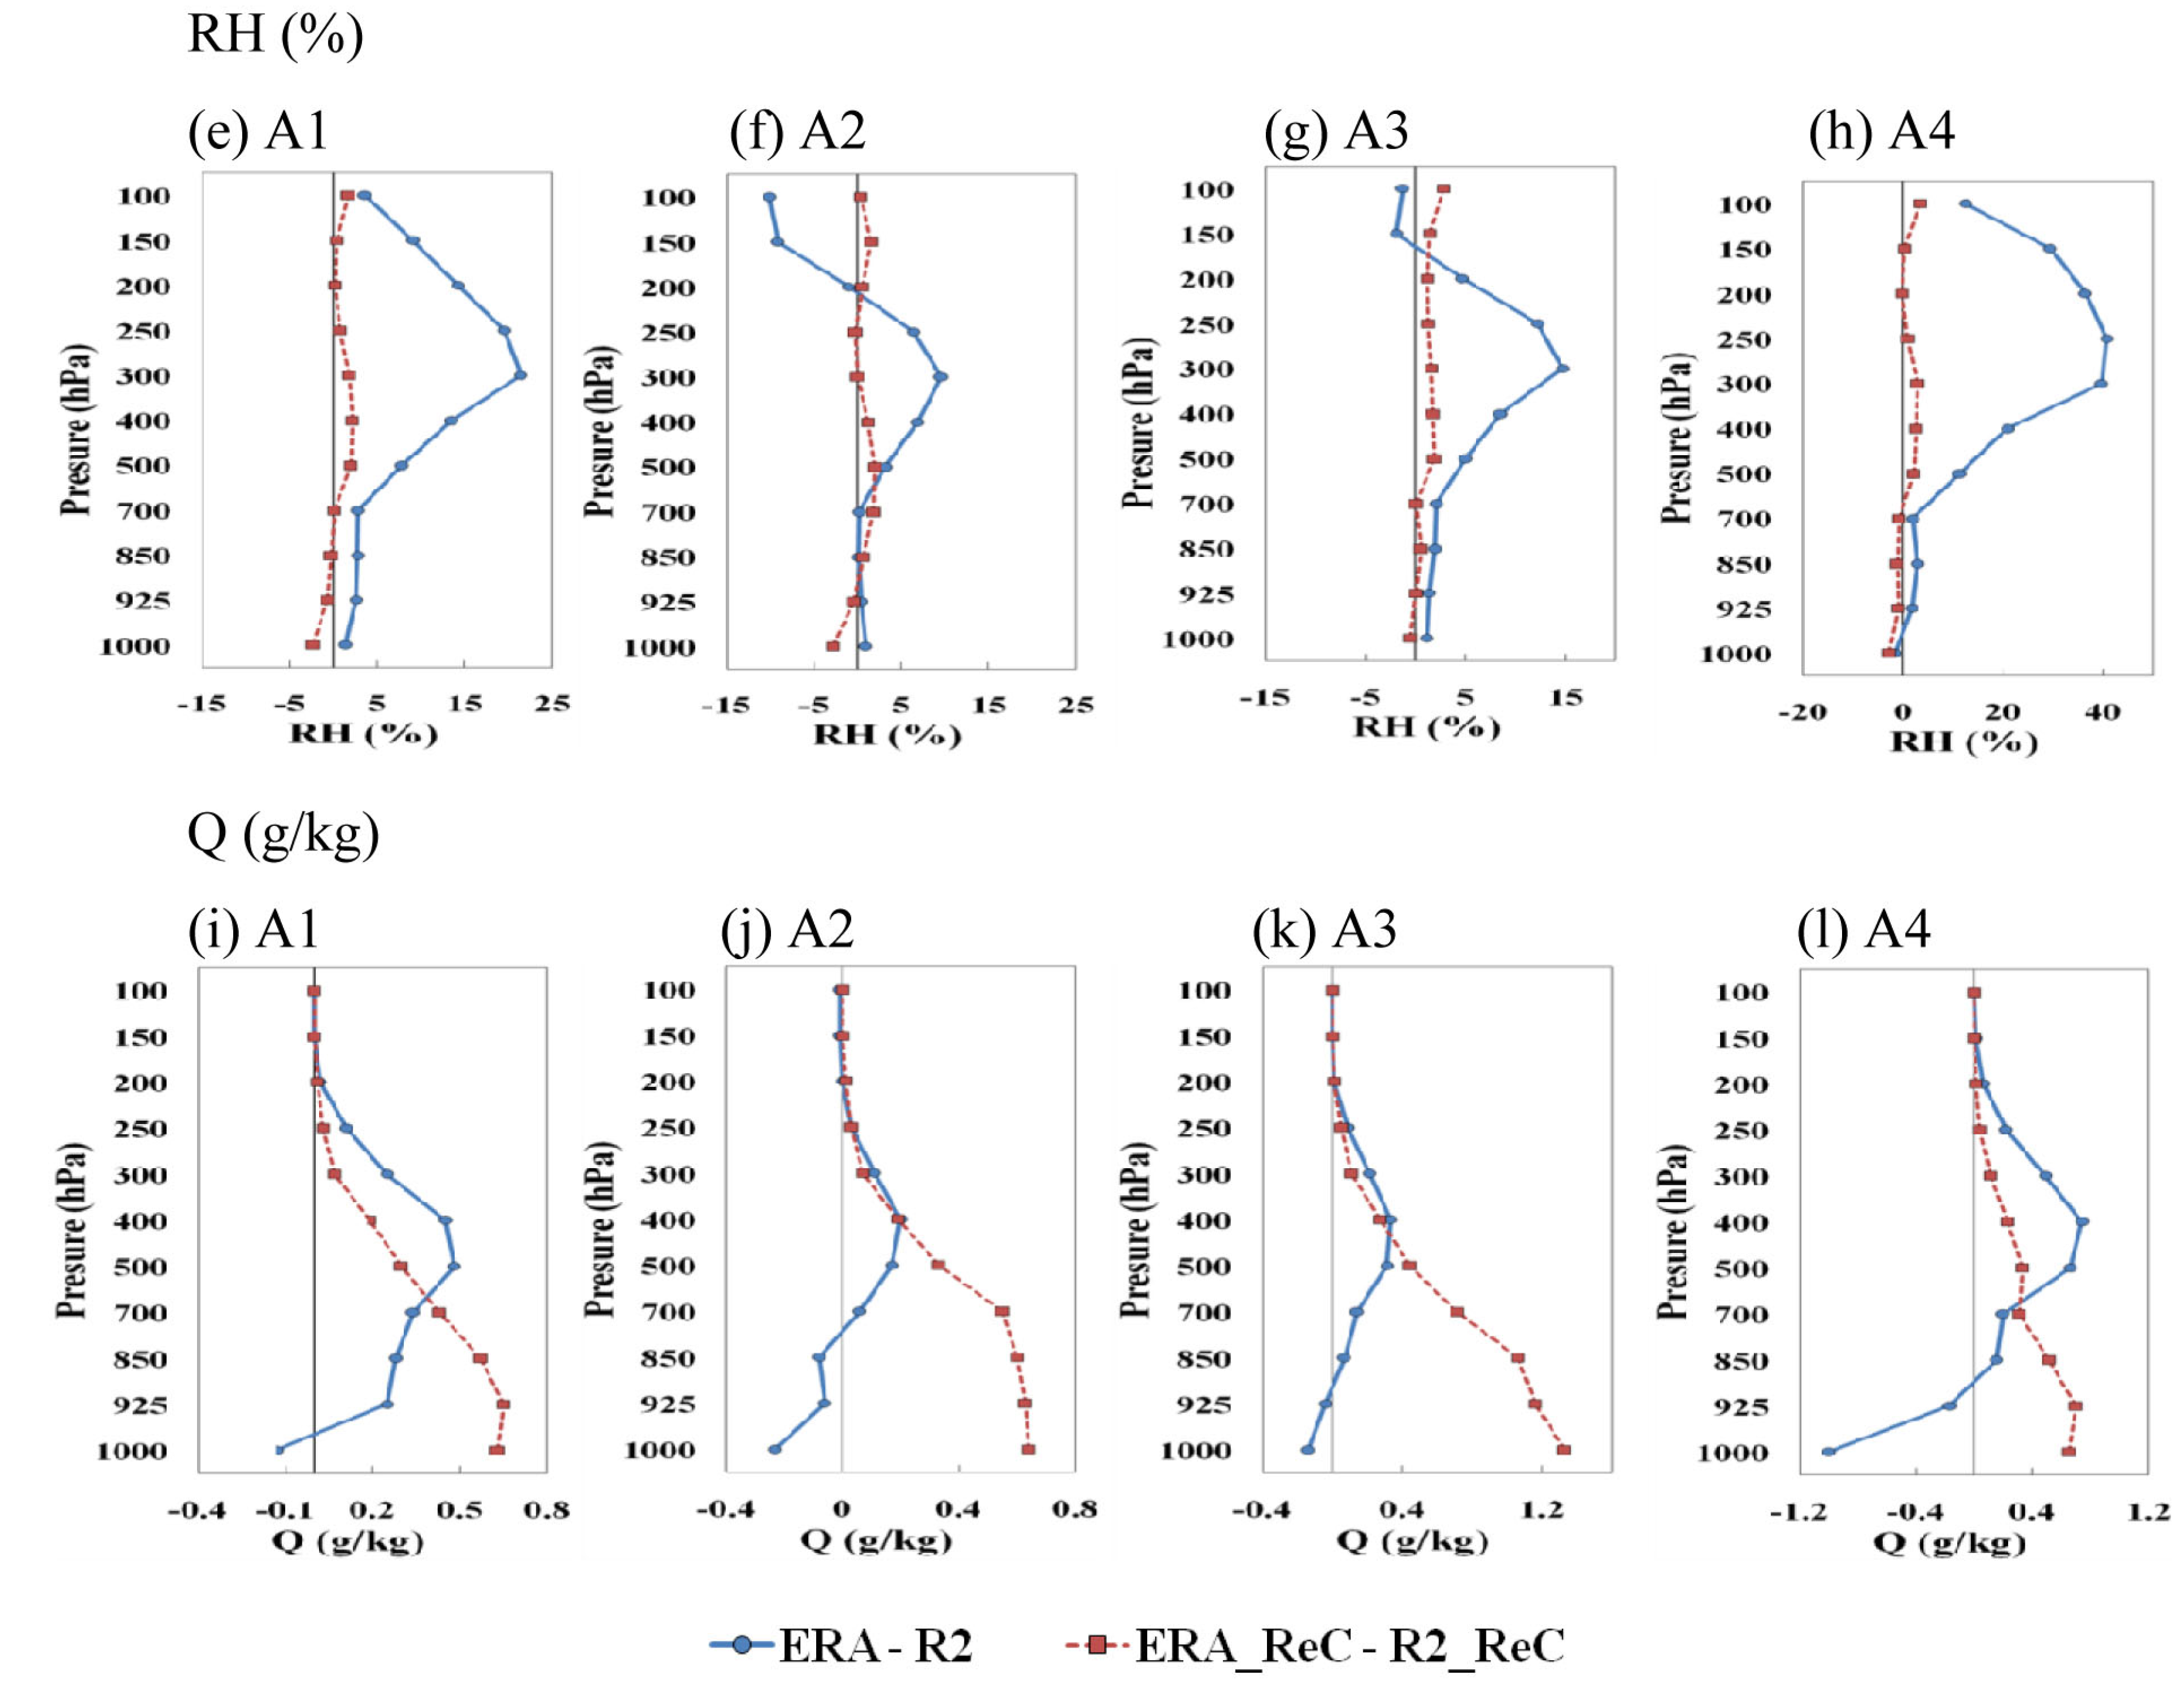
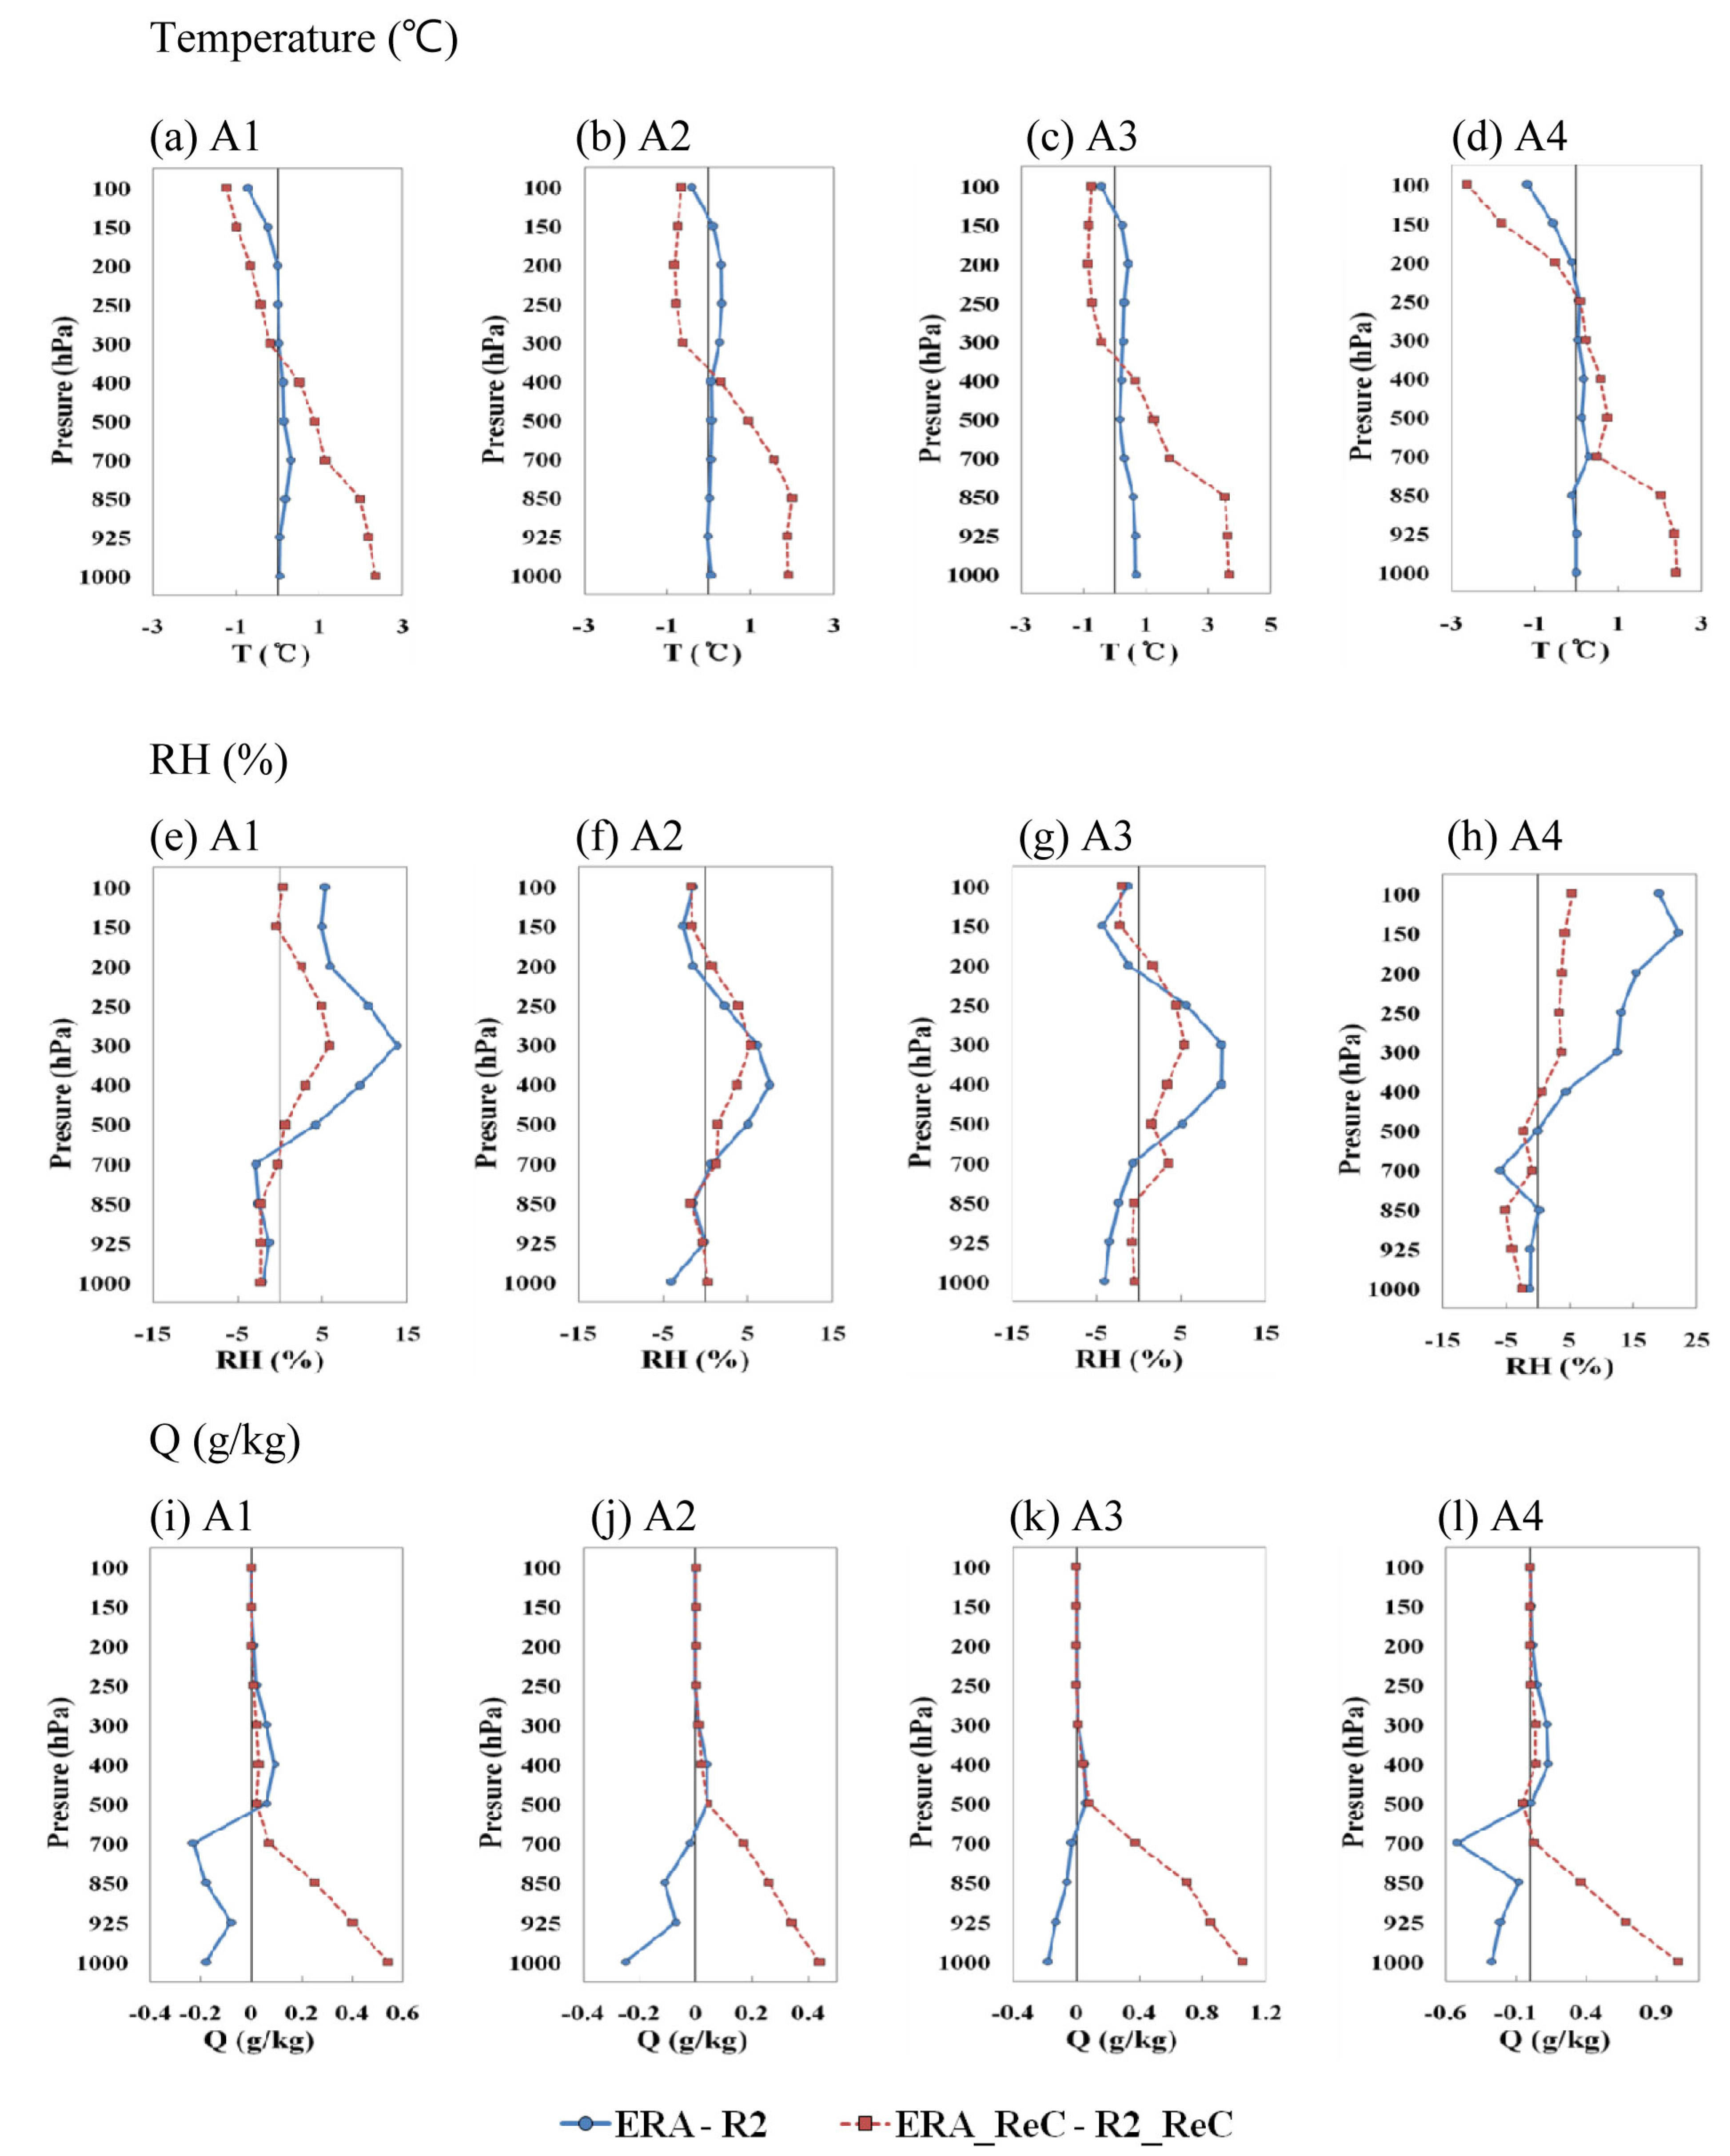
Figure 7 shows the vertical profiles of 20-year summer averaged differences between the ERA and R2 datasets, and between the ERA_ReC and R2_ReC simulations over selected sub-regions (A1 to A4 in Figure 1) for temperature, RH, and mixing ratio. The ERA and R2 datasets did not show substantial differences in temperature irrespective of the region and height, but the simulated temperatures of ERA_ReC were systematically warmer in the mid-to-lower troposphere and colder in the lower stratosphere compared with those of R2_ReC, regardless of the region. Based on these different profiles, when ERA is used as the boundary condition, RegCM4 simulates more unstable vertical profiles than R2_ReC over Northeast Asia. In addition, the ERA dataset showed a larger mixing ratio in the mid-to-upper troposphere, whereas the R2 dataset showed a larger mixing ratio in the lower troposphere, although their intensities varied depending on the region. However, in the RegCM4 simulations, the entire troposphere was noticeably more humid in ERA_ReC irrespective of the region, in contrast to the differences between the two reanalysis datasets. The differences in RH between the two reanalysis datasets were not large in the mid-to-lower troposphere regardless of the region, but in the upper layer, the ERA dataset showed higher RH than the R2 dataset, particularly in the A4 region. However, the RegCM4 simulation results did not differ greatly regardless of the region and height. This seems to be the result of the simultaneous over-simulation of the temperature and mixing ratio in the high and mid-to-lower troposphere in ERA_ReC. From these findings, it may be inferred that the over-simulation of convective precipitation during summer in ERA_ReC can be ascribed to the destabilized atmospheric vertical profiles and the over-simulated mixing ratio of the lower layers.
Figure 7. Vertical profiles of 20-year summer averaged differences between the ERA and R2 datasets (blue), and between the ERA_ReC and R2_ReC simulations (red) over the selected sub-areas (see Figure 1) for three selected climate elements (temperature (ad), RH (eh) and Q (il)).
Atmosphere 06 00783 g007aAtmosphere 06 00783 g007b
As in summer, winter temperatures showed almost no differences between the ERA and R2 datasets, regardless of the region and height (Figure 8). However, the simulated temperatures from ERA_ReC were warmer in the mid-to-lower troposphere and colder in the upper troposphere than those of R2_ReC, regardless of the region. From these differences in the vertical temperature profiles, it may be inferred that RegCM4 generally simulates unstable profiles over the Northeast Asian region in winter when ERA is used as the BC, as is the case in summer. The mixing ratio of the ERA dataset in winter showed dryer conditions in the mid-to-lower troposphere than the R2 dataset, regardless of the region, and there were no substantial differences in the upper troposphere. However, as in summer, the simulation results showed that the mid-to-lower troposphere was noticeably wetter in ERA_ReC than in R2_ReC, regardless of the region. In general, there were no differences in RH between the two reanalysis datasets in the mid-to-lower troposphere for the A1, A2, and A3 regions, but in the mid-atmosphere, the ERA dataset showed higher RH than the R2 dataset. However, in the A4 region, although there was no difference between the two reanalysis datasets for the whole troposphere, ERA_ReC simulated higher RH than R2_ReC in the mid-to-upper layer. This is considered to be the result of simultaneously over-simulating the temperature and mixing ratio for the mid-to-low troposphere when ERA provides the BC, as noted above for summer.
Figure 8. Vertical profiles of 20-year winter averaged differences between the ERA and R2 datasets (blue), and between the ERA_ReC and R2_ReC simulations (red) over the selected sub-areas (see Figure 1) for three selected climate elements (temperature (ad), RH (eh) and Q (il)).
Atmosphere 06 00783 g008

3.3. Trends

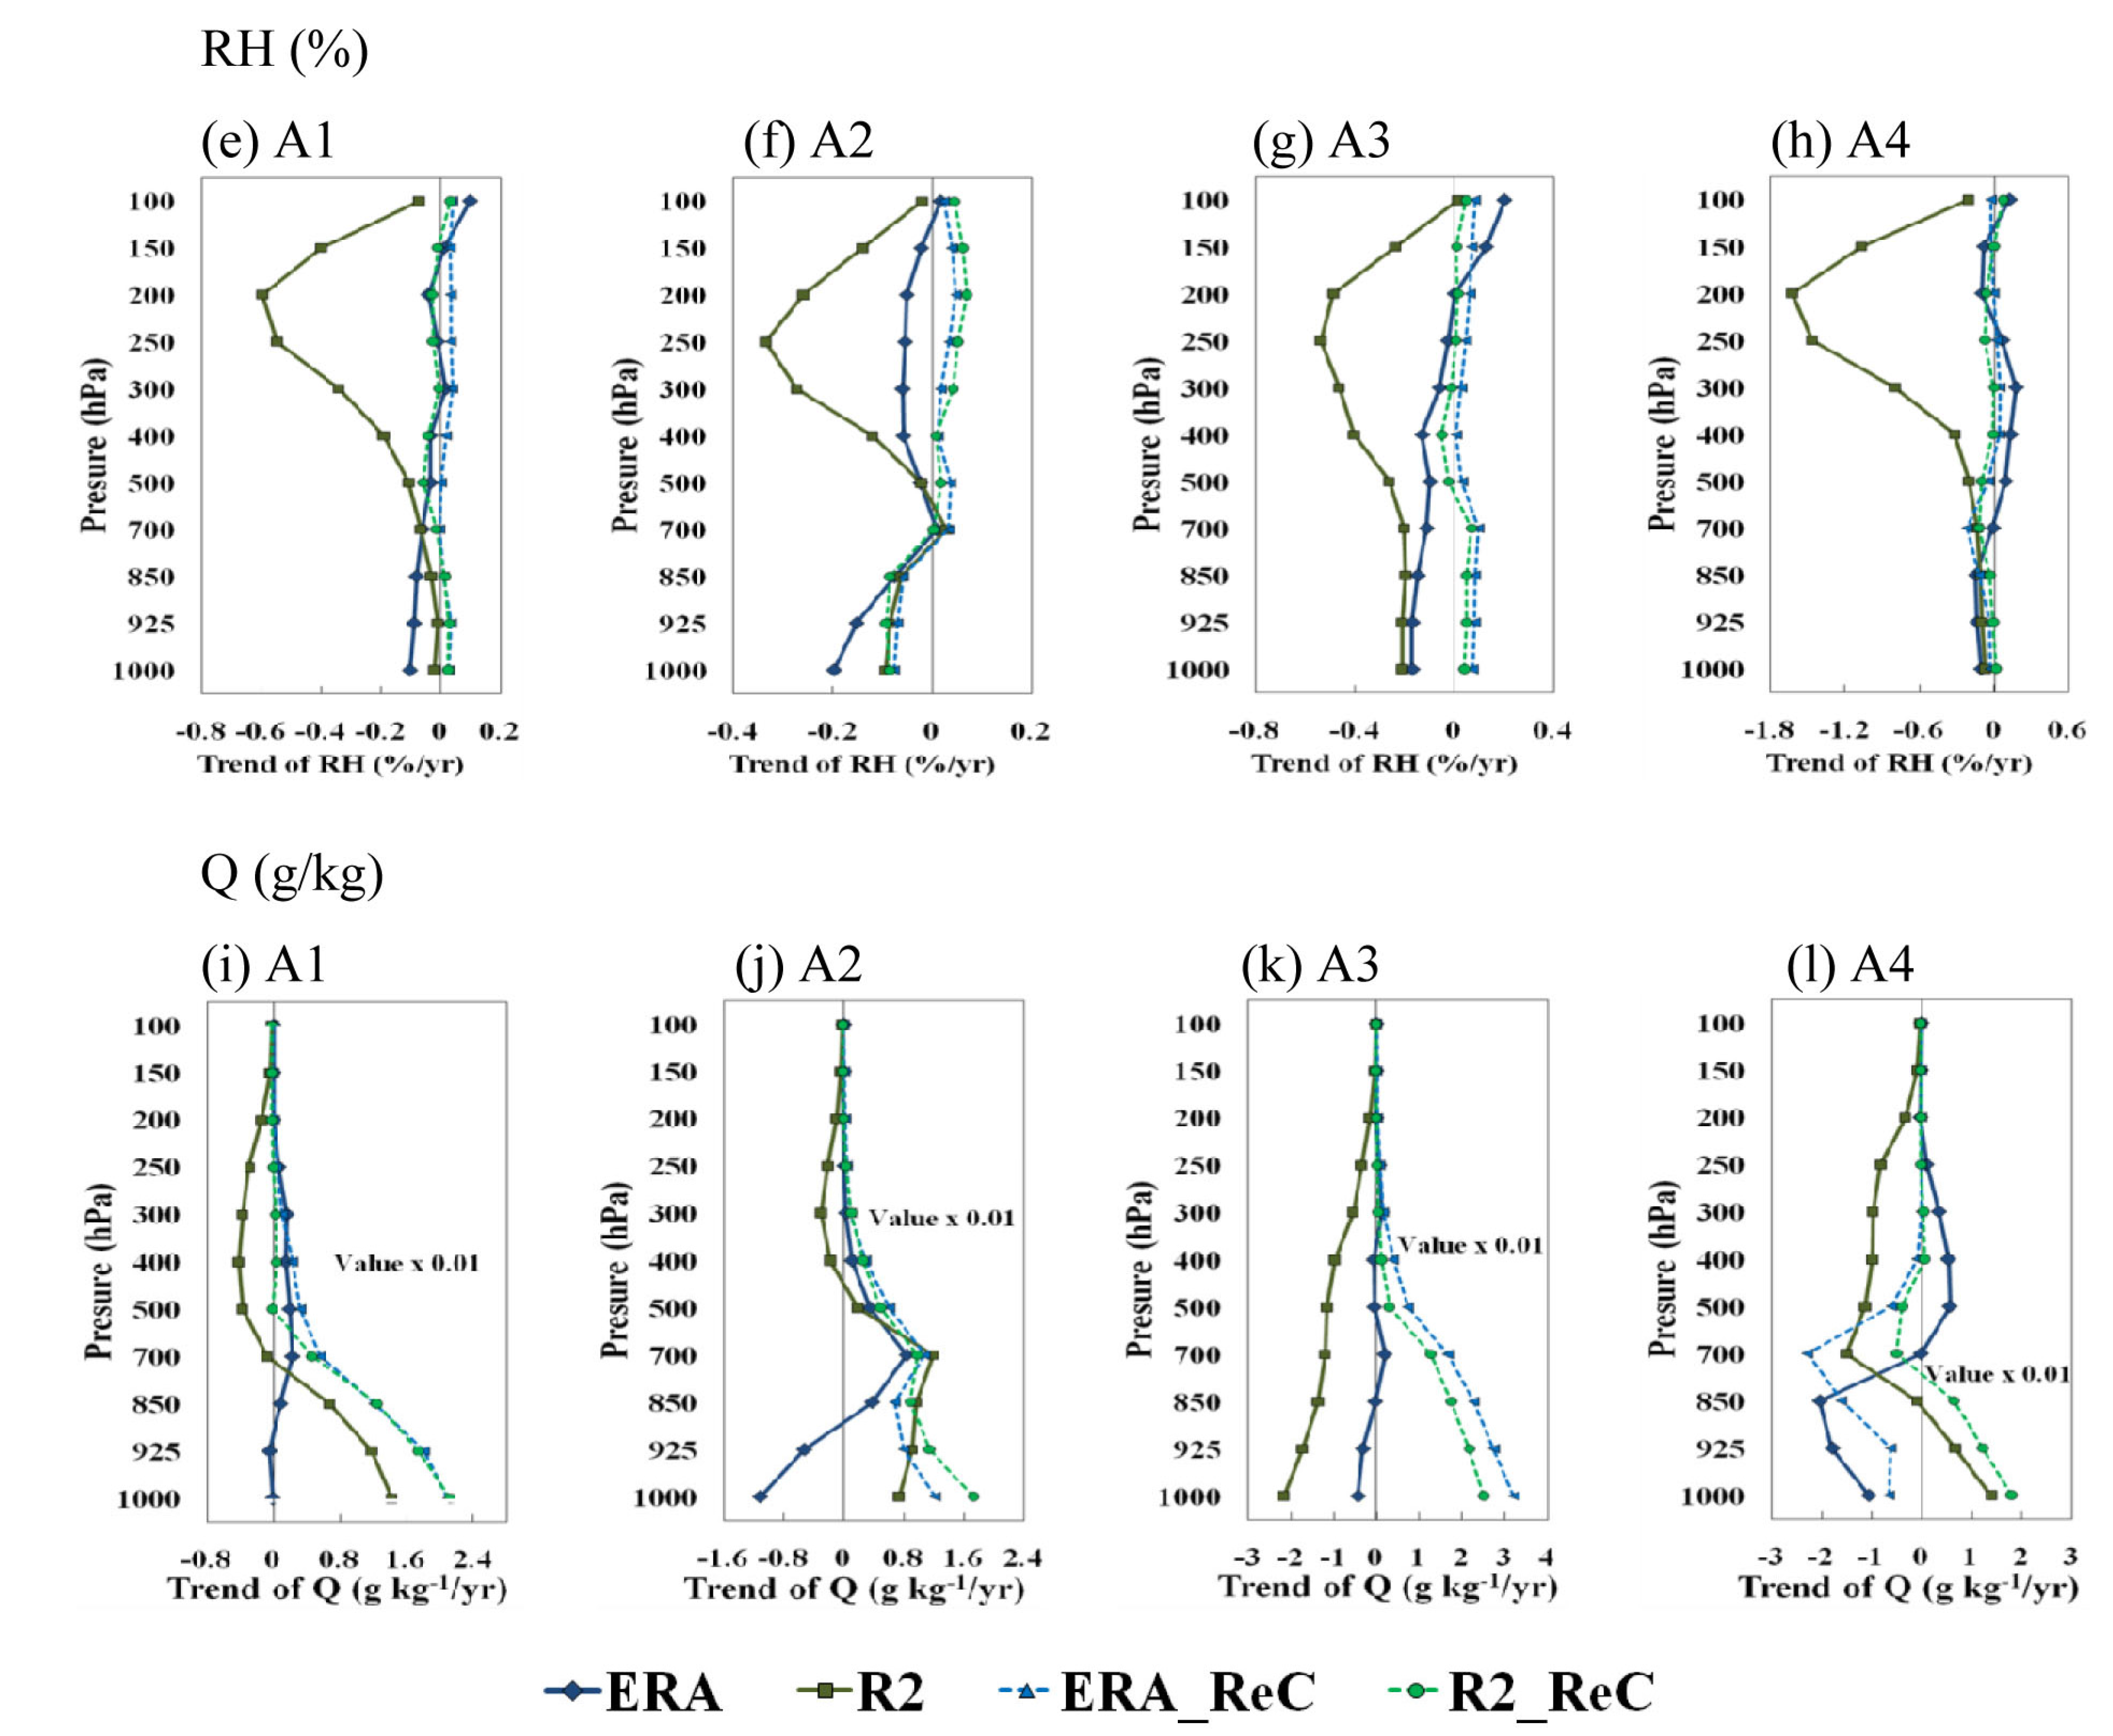
Figure 9 shows the vertical profiles of 20-year summer averaged trends for temperature, RH, and the mixing ratio of the ERA and R2 datasets, and the simulation results with ERA and R2, for the selected sub-regions. To improve visual clarity, the temperature and mixing ratio trends are magnified by 100 times of the actual values. Both the reanalysis datasets and the simulation results showed similar warming trends in temperatures in the lower-to-mid troposphere. However, at or above the upper troposphere, differences in the temperature trends were found between the two reanalysis datasets; in particular, a rapid cooling trend appears in the R2 data, regardless of the geographic location, and the simulation results showed a similar pattern. The mixing ratio trends for the two reanalysis datasets were substantially different depending on the geographic location and height. The ERA dataset showed a decreasing trend over East Asia regardless of height, whereas the R2 dataset showed an increasing trend in the lower troposphere and a decreasing trend in the upper troposphere. The two reanalysis datasets also showed a different trend in the lower troposphere in the A2 region, but in the A4 region, the opposite trend was observed throughout the troposphere, although the magnitude of the mixing ratio was small. The simulation results showed an increasing trend in the mid-to-low troposphere and no trend in the upper troposphere over the entire model domain, irrespective of regions and BCs, except for A4 region. In the A4 region, although the two reanalysis datasets showed opposing trends, the simulated trends showed similar patterns with height. The RH of the two reanalysis datasets showed no distinct trends in the lower troposphere, regardless of the geographic location, except for the strong decreasing trends observed in the mid-to-upper troposphere in the R2 data. This seems to be the combined result of an increasing temperature trend and a decreasing mixing ratio trend in the R2 data for the mid-to-upper troposphere. The results of the simulations with the two reanalysis datasets showed no substantial differences in the trends, irrespective of the geographic location and height. In particular, the significant difference in the RH and mixing ratio trends between the simulation results and the reanalysis data are assumed to be due to the effect of the climatic characteristics of each region on the simulation of the highly nonlinear physical processes of precipitation and land-atmosphere interaction. Additionally, the relatively large differences in the lower atmosphere indicate the importance of local and/or regional processes in the simulation of regional climates.
Figure 9. Vertical profiles of 20-year summer averaged trends for the ERA and R2 datasets, and simulations of RegCM4 forced by ERA and R2 data, over the selected sub-areas (Figure 1) for three selected climate elements (temperature (ad), RH (eh) and Q (il)).
Atmosphere 06 00783 g009aAtmosphere 06 00783 g009b
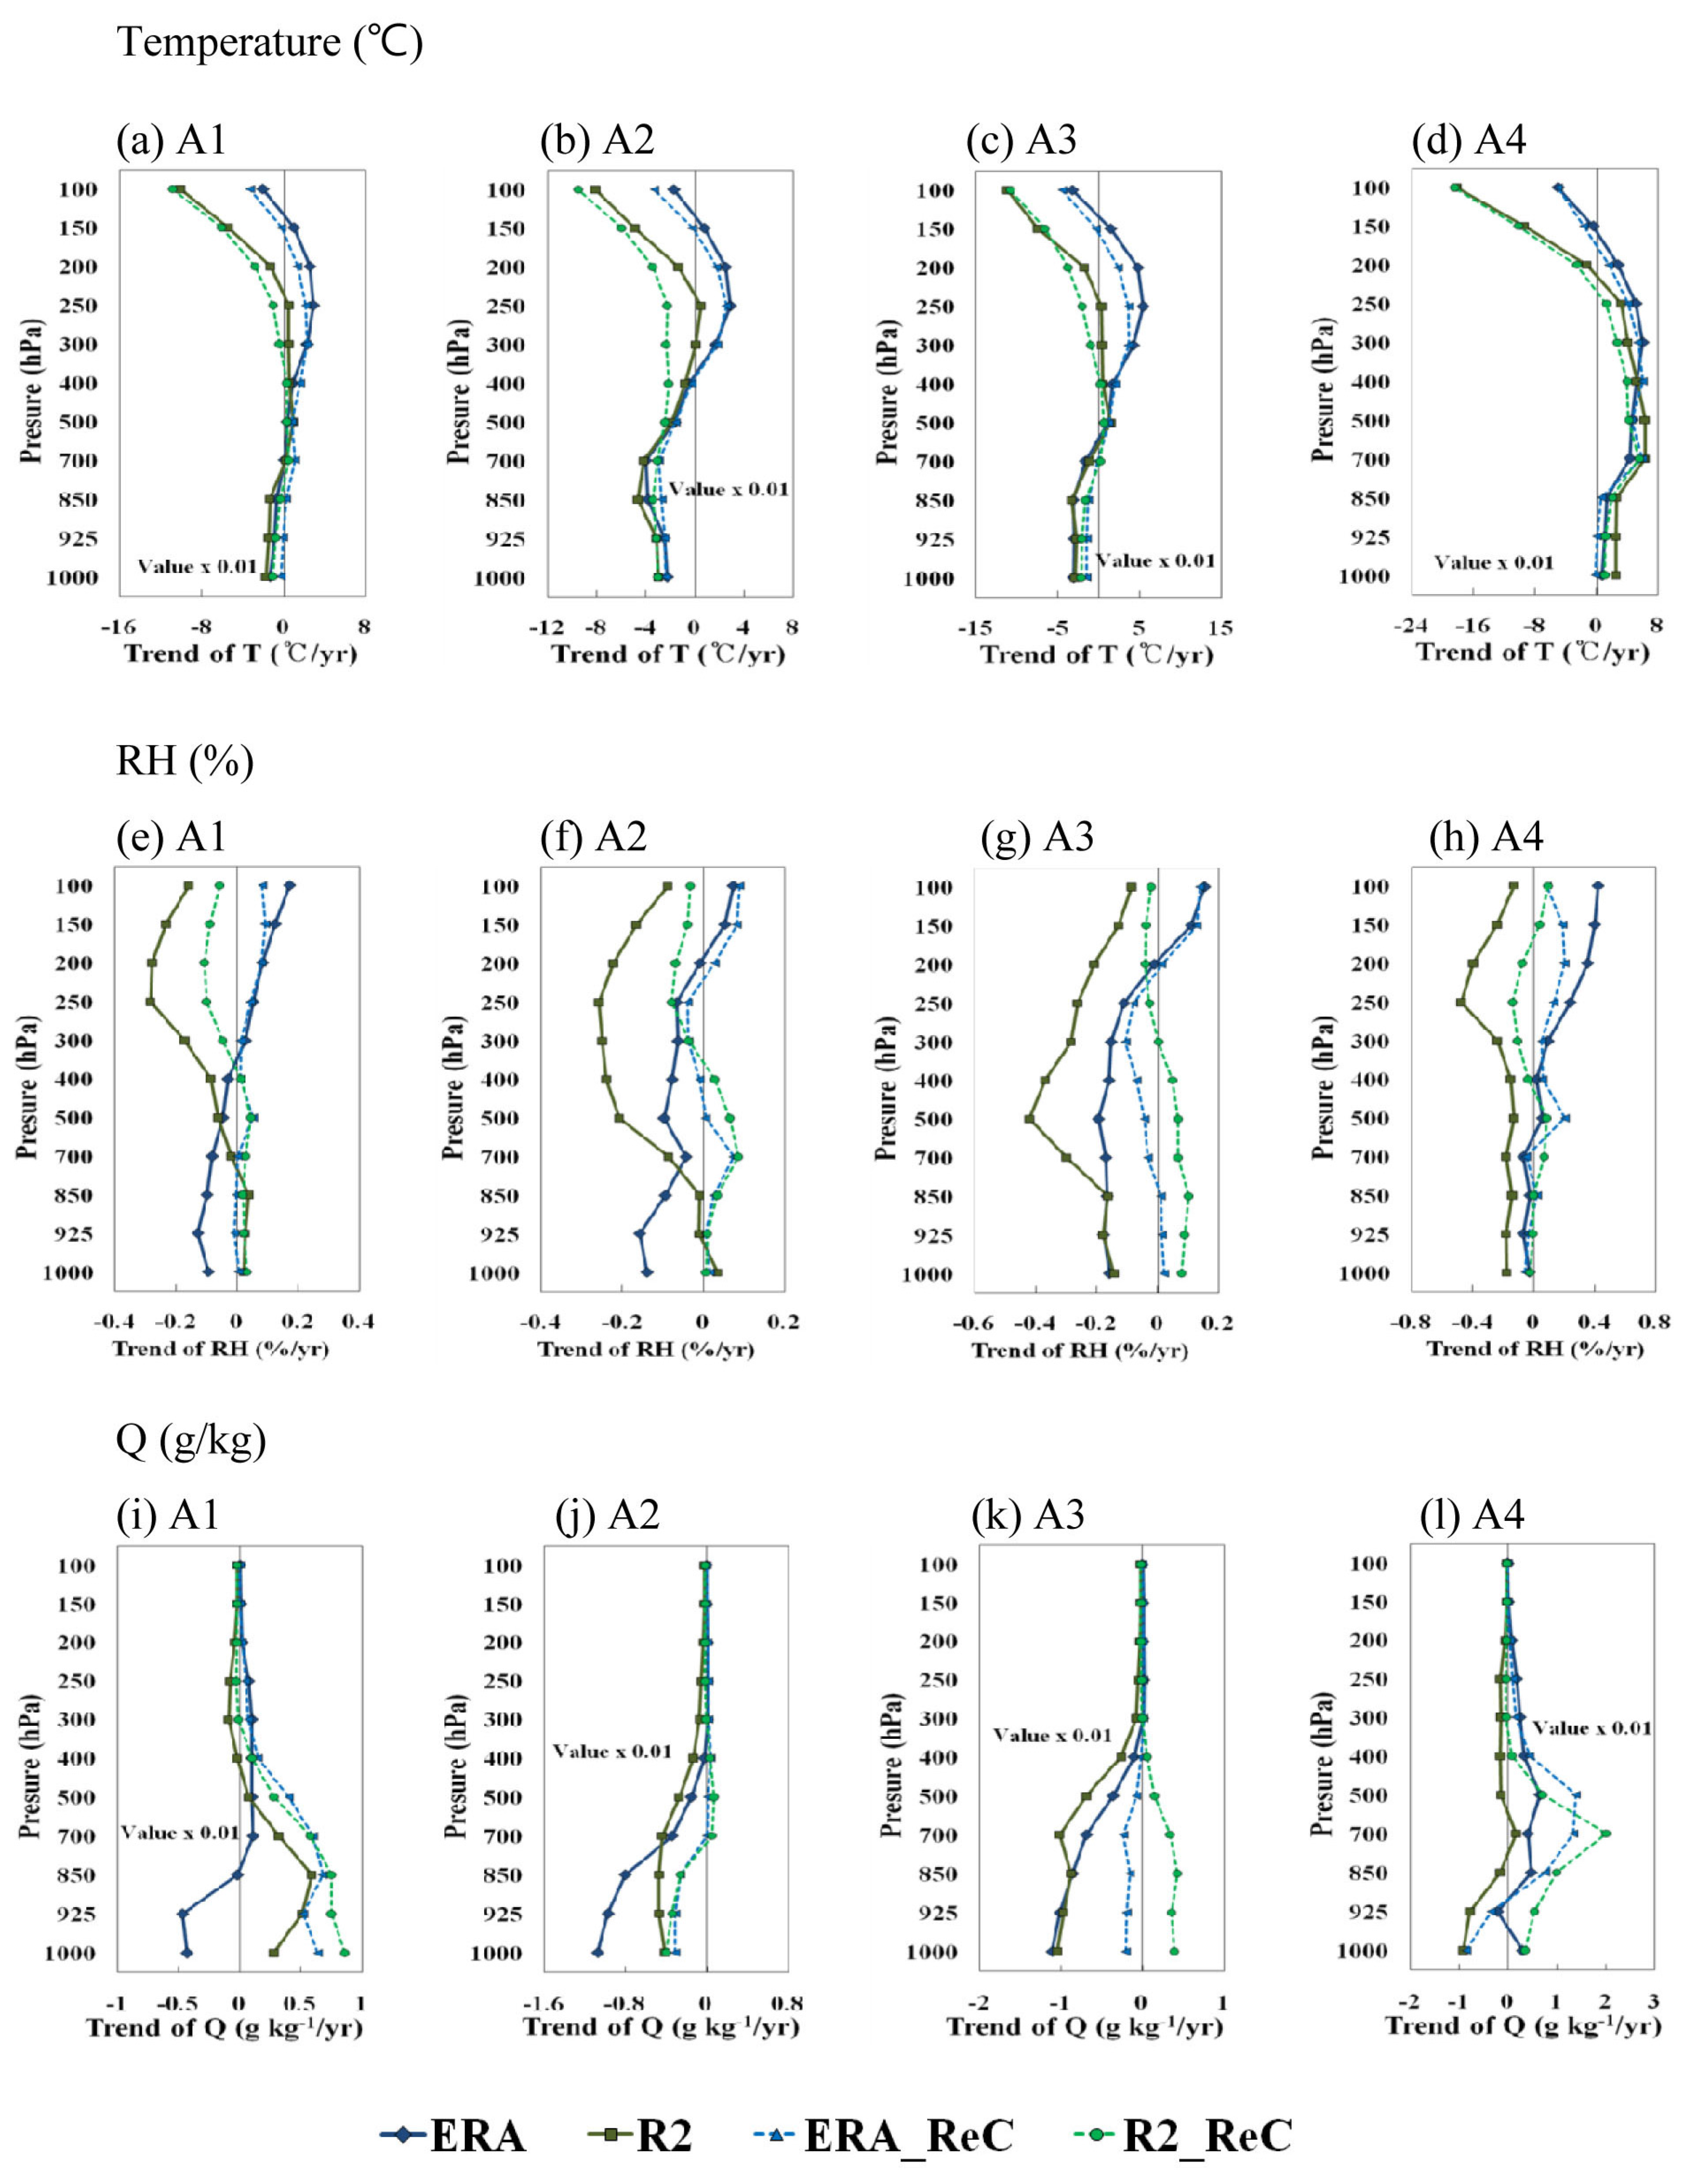
Figure 10 shows the winter trends for comparison with the summer trends in Figure 9. Interestingly, in all East Asia regions excluding A4, both the reanalysis datasets and the simulation results showed decreasing temperature trends in the lower troposphere, even though the intensities were weak. As in summer, the R2 dataset showed a stronger decreasing temperature trend in the upper troposphere than the ERA dataset, and the simulation results showed the same pattern. In the A4 region, both the reanalysis data and simulation results showed increasing temperature trends in the lower-to-mid atmosphere, although the intensities differ and are small. The reanalysis datasets showed decreasing mixing ratio trends in the lower troposphere for the A2 and A3 regions. The simulation results showed increasing mixing ratio trends for the lower troposphere throughout East Asia, but the results showed decreasing trends in the A2 region and contrasting trends in the A3 region. Additionally, relatively large increasing trends were found in the middle troposphere for the A4 region. The two reanalysis datasets showed different trends for RH in winter depending on the geographic location and height. Irrespective of the geographic location, the R2 dataset showed decreasing RH trends in the mid-to-upper troposphere, but the ERA dataset showed decreasing RH trends in the lower troposphere and increasing RH trends in the upper troposphere. The two simulation results did not show large variations in most regions and for most heights, as is the case in summer.
Figure 10. Vertical profiles of 20-year winter averaged trends for the ERA and R2 datasets, and simulations of RegCM4 forced by ERA and R2 data, over the selected sub-areas (Figure 1) for three selected climate elements (temperature (ad), RH (eh) and Q (il)).
Atmosphere 06 00783 g010

4. Conclusions

In this study, to obtain an in-depth analysis of the differences in the 20-year (1989–2008) simulation results of RegCM4 when forced by the ERA and R2 datasets over the CORDEX-EA domain, we analyzed the climatological differences between the two reanalysis datasets and their impacts on the RegCM4 simulations for mid-to-upper atmosphere variables. Additionally, the relationships between the precipitation types and atmospheric fields simulated by RegCM4 with the two different BCs were analyzed.
Irrespective of geographic location, season, and height, the two reanalysis datasets (ERA and R2) showed large differences in the wind field, temperature, RH, and mixing ratio. At 850 hPa in summer, the ERA dataset showed stronger northerly winds than the R2 dataset over most parts of the ocean, including the western Pacific Ocean, slightly lower temperatures around northern India, and higher RH and mixing ratios in all regions excluding the western China region and the East Sea. However, the ERA dataset showed lower RH and mixing ratios in most regions in winter, excluding some regions at the southern and northern boundaries of the model domain. At 300 hPa in summer, the differences between the two datasets were more apparent, and the ERA dataset showed strong anticyclonic circulation in the central region of the model domain due to higher temperatures compared with those in the R2 dataset. The ERA dataset also showed noticeably higher RH and mixing ratio than the R2 dataset, especially in the southern region of the model domain. However, in winter, the ERA dataset showed substantially higher RH in the northern region of the model domain compared with the R2 dataset.
The results of simulations using the two reanalysis datasets as BCs showed opposite results in some regions, and a comparison of the two simulations differed from the differences between the ERA and R2 datasets. For example, at 850 hPa in summer, temperatures were lower in the center of the model domain for the ERA dataset, but the simulated temperatures of ERA_ReC were higher than those of R2_ReC (Figure 3). Discrepancies were also found in the simulation results regarding temperatures, RH, and mixing ratios in both summer and winter at 300 hPa, which showed different patterns from those between the reanalysis datasets. However, compared with the wind intensity at 300 hPa, the difference between the two simulation results was relatively small because of the application of spectral nudging, which gives more weight to the upper troposphere in the simulation process. The differences in temperatures and mixing ratios were large in the mid-to-lower troposphere, but the difference in RH was large in the mid-to-upper troposphere. Considering these findings, ERA_ReC simulated strong southerly winds for the central eastern region of the model domain, unstable atmospheric vertical profiles, and larger mixing ratios in the mid-to-lower troposphere, which were responsible for the significant over-simulation of the convective precipitation during summer in these regions. In addition, the simulation results of ERA_ReC during winter were generally similar to those for summer, although there were slight differences depending on the region. Therefore, the ERA_ReC produced stronger monsoonal circulation in summer and winter, and thus a stronger annual cycle than R2_ReC.
Irrespective of geographic location, season, and height, the two reanalysis datasets and the results of the simulations with the two reanalysis datasets all showed similar temperature trends. However, the two reanalysis datasets showed different trends for RH and mixing ratios depending on the height and geographic location. Specifically, the mixing ratio showed a significantly different trend in the mid-to-lower troposphere and the RH showed a significantly different trend predominantly in the upper troposphere. However, the results of simulations using the two BCs showed similar trends irrespective of the geographic location, height, and season. Therefore, the results for the mixing ratio and RH simulated by RegCM4 were different from those of the reanalysis datasets. This is presumably because the strong non-linearity of the physical processes of precipitation and land-atmosphere interaction was reflected in the regional climate simulations of RegCM4 with a high resolution. This also means that local processes induced by the detailed prescription of the land/sea mask, topography, and land use/cover are important for the simulation of regional climates. In addition, the significant impacts of BCs on the simulation results indicate the importance of the choice of general circulation models used as BCs for future projections of regional climate change.

Acknowledgments

This work was funded by the Korea Meteorological Administration Research and Development Program under grant KMIPA2015-2084.

Author Contributions

Myoung-Seok Suh designed this research idea, analyzed the results and wrote the manuscript. Seok-Geun Oh performed the long-term simulation using regional climate model with reanalysis dataset. In addition, he analyzed the results and revised the manuscript with Myoung-Seok Suh.

Conflicts of Interest

The authors declare no conflict of interest.

References

  1. Eom, H.S.; Suh, M.S. Seasonal and diurnal variations of stability indices and environmental parameters using NCEP FNL data over East Asia. APJAS 2011, 47, 181–192. [Google Scholar] [CrossRef]
  2. Graversen, R.G.; Mauritsen, T.; Drijfhout, S.; Tjernstrom, M.; Martensson, S. Warm winds from the pacific caused extensive Arctic sea-ice melt in summer 2007. Clim. Dyn. 2011, 36, 2103–2112. [Google Scholar]
  3. Mooney, P.A.; Mulligan, F.J.; Fealy, R. Comparison of ERA-40, ERA-Interim and NCEP/NCAR reanalysis data with observed surface air temperatures over Ireland. Int. J. Climatol. 2011, 31, 545–557. [Google Scholar] [CrossRef]
  4. Oh, S.G.; Suh, M.S.; Myoung, J.S.; Cha, D.H. Impact of boundary conditions and cumulus parameterization schemes on regional climate simulation over South Korea in the CORDEX East Asia domain using the RegCM4 model. J. Korean Earth Sci. Soc. 2011. [Google Scholar] [CrossRef]
  5. Oh, S.G.; Suh, M.S.; Cha, D.H. Impact of boundary conditions on precipitation and temperature extremes over South Korea in the CORDEX regional climate simulation using RegCM4. APJAS 2013, 49, 497–509. [Google Scholar]
  6. Li, H.; Robock, A.; Liu, S.; Mo, X.; Viterbo, P. Evaluation of reanalysis soil moisture simulations using updated Chinese soil moisture observations. J. Hydrometeorol. 2005, 6, 180–193. [Google Scholar] [CrossRef]
  7. Marques, C.A.F.; Rocha, A.; Corte-Real, J.; Castanheira, J.M.; Ferreira, J.; Melo-Goncalves, P. Global atmospheric energetics from NCEP-Reanalysis 2 and ECMWF-ERA40 Reanalysis. Int. J. Climatol. 2008, 29, 159–174. [Google Scholar] [CrossRef]
  8. Martynov, A.; Laprise, R.; Sushama, L.; Winger, K.; Separovic, L.; Dugas, B. Reanalysis-driven climate simulation over CORDEX North America domain using the Canadian Regional Climate Model, version 5: Model performance evaluation. Clim. Dyn. 2013, 41, 2973–3005. [Google Scholar] [CrossRef] [Green Version]
  9. Park, J.H.; Oh, S.G.; Suh, M.S. Impacts of boundary conditions on the precipitation simulation of RegCM4 in the CORDEX East Asia domain. J. Geophys. Res. 2013, 118, 1658–1667. [Google Scholar] [CrossRef]
  10. Suh, M.S.; Oh, S.G.; Lee, D.K.; Cha, D.H.; Choi, S.J.; Jin, C.S.; Hong, S.Y. Development of new ensemble methods based on the performance skills of regional climate models over South Korea. J. Clim. 2012, 25, 7067–7082. [Google Scholar] [CrossRef]
  11. Zhu, Y. The Antarctic oscillation-East Asian summer monsoon connections in NCEP-1 and ERA-40. Adv. Atmos. Sci. 2009, 26, 707–716. [Google Scholar] [CrossRef]
  12. Simmons, A.; Uppala, S.; Dee, D.; Kobayashi, S. ERA-Interim: New ECMWF Reanalysis Products from 1989 onwards. ECMWF Newsletter 2006, 110, 25–35. [Google Scholar]
  13. Kanamitsu, M.; Ebisuzaki, W.; Woollen, J.; Yang, S.K.; Hnilo, J.J.; Fiorino, M.; Potter, G.L. NCEP-DOE AMIP II Reanalysis (R-2). Bull. Am. Meteorol. Soc. 2002, 83, 1631–1643. [Google Scholar] [CrossRef]
  14. Simmons, A.J.; Jones, P.D.; Bechtold, V.C.; Beljaars, A.C.M.; Kallberg, P.W.; Saarinen, S.; Uppala, S.M.; Viterbo, P.; Wedi, N. Comparison of trends and low-frequency variablity in CRU, ERA-40, and NCEP/NCAR analyses of surface air temperature. J. Geophys. Res. 2004. [Google Scholar] [CrossRef]
  15. Trigo, I.F. Climatology and interannual variability of storm-tracks in the Euro-Atlantic sector: A comparison between ERA-40 and NCEP/NCAR reanalyses. Clim. Dyn. 2006, 26, 127–147. [Google Scholar] [CrossRef]
  16. Jacob, D.; Elizalde, A.; Haensler, A.; Hagemann, S.; Kumar, P.; Podzun, R.; Rechid, D.; Remedio, A.R.; Saeed, F.; Sieck, K.; et al. Assessing the transferability of the regional climate model REMO to different coordinated regional climate downscaling experiment (CORDEX) regions. Atmosphere 2012, 3, 181–199. [Google Scholar] [CrossRef]
  17. Giorgi, F.; Coppola, E.; Solmon, F.; Mariotti, L.; Sylla, M.B.; Bi, X.; Elguindi, N.; Diro, G.T.; Nair, V.; Giuliani, G.; et al. RegCM4: Model description and preliminary test over multiple CORDEX domains. Clim. Res. 2012, 52, 7–29. [Google Scholar] [CrossRef]
  18. Reynolds, R.W.; Rayner, N.A.; Smith, T.M.; Stokes, D.C.; Wang, W. An improved in situ and satellite SST analysis for climate. J. Clim. 2002, 15, 1609–1625. [Google Scholar] [CrossRef]
  19. Von Storch, H.; Langerberg, H.; Feser, F. A spectral nudging technique for dynamical downscaling purposes. Mon. Wea. Rev. 2000, 128, 3664–3673. [Google Scholar] [CrossRef]
  20. Cha, D.H.; Lee, D.K. Reduction of systematic errors in regional climate simulations of the summer monsoon over East Asia and the western North Pacific by applying the spectral nudging technique. J. Geophys. Res. 2009, 114, D14108. [Google Scholar] [CrossRef]
  21. Cha, D.H.; Jin, C.S.; Lee, D.K.; Kuo, Y.H. Impact of intermittent spectral nudging on regional climate simulation using Weather Research and Forecasting model. J. Geophys. Res. 2011, 116, D10103. [Google Scholar] [CrossRef]
  22. Alder, R.F.; Huffman, G.J.; Chang, A.; Ferraro, R.; Xie, P.-P.; Janowiak, J.; Rudolf, B.; Schneider, U.; Curtis, S.; Bolvin, D.; et al. The version-2 global precipitation climatology project (GPCP) monthly precipitation analysis (1979-present). J. Hydrometeorol. 2003, 4, 1147–1167. [Google Scholar]