Article

Assessing the Influence of Seasonal and Spatial Variations on the Estimation of Secondary Organic Carbon in Urban Particulate Matter by Applying the EC-Tracer Method

1
Geography Department, Humboldt-Universität zu Berlin, Unter den Linden 6, D-10099 Berlin, Germany
2
German Federal Environmental Agency, Corrensplatz 1, D-14195 Berlin, Germany
3
German Federal Environmental Agency, Wörlitzer Platz 1, D-06844 Dessau-Roßlau, Germany
4
Biology Department, Humboldt-Universität zu Berlin, Unter den Linden 6, D-10099 Berlin, Germany
*
Author to whom correspondence should be addressed.
Current Affiliation: German Federal Institute for Risk Assessment, Max-Dohrn-Str. 8-10, D-10589 Berlin, Germany.
Atmosphere 2014, 5(2), 252-272; https://doi.org/10.3390/atmos5020252
Submission received: 15 January 2014 / Revised: 22 March 2014 / Accepted: 16 April 2014 / Published: 29 April 2014

Abstract

:
The elemental carbon (EC)-tracer method was applied to PM10 and PM1 data of three sampling sites in the City of Berlin from February to October 2010. The sites were characterized by differing exposure to traffic and vegetation. The aim was to determine the secondary organic carbon (SOC) concentration and to describe the parameters influencing the application of the EC-tracer method. The evaluation was based on comparisons with results obtained from positive matrix factorization (PMF) applied to the same samples. To obtain site- and seasonal representative primary OC/EC-ratios ([OC/EC]p), the EC-tracer method was performed separately for each station, and additionally discrete for samples with high and low contribution of biomass burning. Estimated SOC-concentrations for all stations were between 11% and 33% of total OC. SOC-concentrations obtained with PMF exceeded EC-tracer results more than 100% at the park in the period with low biomass burning emissions in PM10. The deviations were besides others attributed to the high ratio of biogenic to combustion emissions and to direct exposure to vegetation. The occurrences of biomass burning emissions in contrast lead to increased SOC-concentrations compared to PMF in PM10. The obtained results distinguish that the EC-tracer-method provides well comparable results with PMF if sites are strongly influenced by one characteristic primary combustion source, but was found to be adversely influenced by direct and relatively high biogenic emissions.

1. Introduction

Fine particulate matter (PM) in the atmosphere is of great importance due to climatic effects [1,2] and health aspects [3,4]. A major interest is on the carbonaceous fraction, which makes up a major fraction in PM. Studies reported between 8% and 53% of total carbon (TC) in PM2.5 samples in Italy [5], 26% to 39% in PM2.5 and 20% to 27% in PM10 in California [6] or between 21% and 28% in PM2.5 samples in different cities in Korea and China [7,8,9]. Whereas elemental carbon (EC) is emitted by combustion processes, organic carbon (OC) can also be of biogenic origin. Furthermore, it can not only be emitted as primary particles, but also formed through oxidation processes of precursor gases in the atmosphere [10]. Major attention has lately been paid on the secondary organic aerosol (SOA), since it consists of numerous, in part still unknown compounds and makes up a substantial fraction of PM, especially that from biogenic precursors [11]. Prior investigations addressed several techniques to calculate the contribution of SOA. The positive matrix factorization (PMF) for example, is a multivariate receptor model technique to determine potential sources [12]. It has been applied in a number of studies based on the analysis of elemental constituents, OC and EC. Recently several studies estimating secondary organic carbon (SOC) by using PMF with organic compounds have been conducted [13,14,15]. Another technique is the EC-tracer method, which is based on the assumption of similar sources for anthropogenic primary organic carbon (POC) and EC [16,17]. Using the primary ratio of OC/EC, the SOC-fraction can be calculated. For a good approximation, information about emission inventories of the main sources at the location of interest is necessary.
The EC-tracer method has been applied in many studies because it provides a rather simple approach for estimating the SOC-contribution and does not necessarily need any information about aerosol components other than OC and EC. However, Yuan et al. [18] already mentioned the uncertainties that may occur due to the difficulty to find a primary ratio that is characteristic for the site of interest. They applied this method to ten different sampling sites in Hong Kong by merging the data of all sampling sites in one data pool. In this way a primary OC/EC-ratio representing the ratio of the whole investigated area was produced. SOC-concentrations were predominantly overestimated, most probably caused by the different characteristics of emission inventories. Lonati et al. [5] found very high primary ratios in the cold season in PM2.5 samples in Milan, even preventing them from performing the calculations for this period, as they could not assume this ratio to be representative for primary emissions. They primarily argued that the total exclusion of SOA events could not be guaranteed. In many studies the EC-tracer method was applied to one single sampling site where similar conditions or emission inventories could be assumed over time [16,17,19]. Few studies exist applying the method on several sampling sites, merged in one data pool [18], and only few studies applied the method separately to different sampling sites [20,21].
The study presented here aims to determine the contribution of SOC to total OC using the EC-tracer method. With regard to the uncertainties arising from calculating a representative primary OC/EC-ratio, it is performed in consideration of spatial and temporal variations. Therefore, the sampling period is divided into days with high and low contribution of biomass burning emissions and is investigated separated by stations. This approach was chosen to assess both, the effect of biomass burning emissions on the calculation of [OC/EC]p and the potential effect of different station characteristics, especially the impact of vegetation at a given site. OC and EC- PM10 and PM1 data were obtained from three measurement sites characterized by different vegetation influences in the city of Berlin from February to October 2010. The results of the EC-tracer method are assessed by comparing them to those determined by PMF-analysis in a previous study, which was based on the detection of single, mainly biogenic compounds determined for the same samples [14,22].
This approach provides an extensive analysis of SOC-concentrations obtained with the EC-tracer method by (a) considering seasonal variations with regard to biomass burning emissions and vegetation; (b) by comparing site-specific primary ratios and (c) by comparing the applications of two established SOC-calculation techniques, which is a useful instrument to verify the results and the study is unique in this detailedness. These comparisons and the additional information of real SOA-events provide the potential to give suggestions for the application.

2. Experimental Section

2.1. Sampling

PM10 and PM1 samples were collected at three sites in Berlin with different vegetation influences, namely an urban park in the center of the city, referred to as site with high vegetation stock (HV), a traffic station with low vegetation stock (LV) in the west of the city surrounded by dwellings, and an urban background station in the southeast of Berlin with intermediate vegetation density which is typical for the region (regV, only PM10). Sampling took place each 6th day for 24 h from February 2010 to October 2010. Aerosols were collected on quartz-fiber filters (Pallflex, Tissuquartz 2500QAT-UP, 47 mm) using low-volume samplers (LVS3.1, Derenda) at a flow rate of 2.3 m3∙h−1. For more detailed information about the sampling sites and sample collection see Wagener et al. [22]. NOx-concentrations for similar urban measurement stations close to the HV and regV sites were provided by the “BLUME” meteorological network of Berlin, which is operated by the Senate Department for Urban Development and the Environment. Concentrations for a station representative for site LV could not be provided.

2.2. Analysis

1.5 cm2 of each filter was used for the determination of OC and EC. The NIOSH Method 5040 on a thermal/optical carbon aerosol analyzer instrument from Sunset Laboratory Incorporated [23] was used due to its good adaptation to urban samples [24]. LODs were calculated from the mean + 3 S.D. ranging from 0.36 µg∙m−3 to 0.76 µg∙m−3 for OC and from 0.01 µg∙m−3 to 0.04 µg∙m−3 for EC at the different sites. Results were corrected for blank values. One half of the same filters was used for single compound analysis using GC-MS after a derivatization procedure. Compounds included, amongst others, were the α-pinene markers pinic and pinonic acid and the isoprene markers 2-methyltreitol and 2-methylerythritol as biogenic secondary compounds and levoglucosan as marker for biomass burning. The methodology of single compound analysis has been reported in detail in Wagener et al. [22].

2.3. PMF-Analysis

In a previous study, source apportionment of OC was conducted with PMF-analysis including the concentrations of single compounds, OC and EC. It was found that for both PM-fractions the data matrix was presented best by a set of 6 factors, namely isoprene-derived SOA and α-pinene-derived SOA as biogenic secondary factors, bio primary and bio/urban primary as biogenic primary factors, and biomass burning and combustion fossil as primary anthropogenic factors. However, as no specific tracers for secondary anthropogenic sources were available for PMF analysis, it must be considered that the anthropogenic factors may also include secondary aerosol. Furthermore, some of the OC in PMF analysis was unapportioned, which can also be assumed to be in part secondary. Further details on the composition and the concentration of the factors are given in Wagener et al. [14].

2.4. EC-Tracer-Method

2.4.1. Application with Regard to Temporal and Spatial Variation

The EC-tracer method was pioneered by Turpin and Huntzicker [17]. It is based on the assumption that primary OC from combustion processes and EC have similar sources resulting in a defined primary OC/EC-ratio for the area of interest. Increased ratios are consequently a hint for secondary formation processes. The EC-tracer method is expressed by
Atmosphere 05 00252 i001
where [OC]p represents primary OC and [OC/EC]p is the defined ratio of anthropogenic primary OC/EC. Primary sources other than combustion processes, like biogenic aerosol, are considered within this approach and are expressed by the intercept b. The secondary contribution to OC can then be calculated following the equation
SOC = OC − [OC]p
For a good approximation of [OC/EC]p, this technique should be applied to samples collected during similar conditions [16,25]. Problems can arise from temporal or spatial variations which are addressed in detail in the study presented here.
Temporal variations: Concerning temporal variations, above all the contribution of biomass burning has to be considered, as emissions are generally higher in the colder season [26,27]. Significant negative correlations between temperature and biomass burning were already identified for the sampling sites of this study [14]. The expected [OC/EC]p-ratio of biomass burning emissions can differ from those determined for traffic emissions, and was also supposed by Park et al. [28] and Lonati et al. [5] for places at an urban site in Korea or in Milan, Italy respectively. Thus the temporal variation is a deviation between high and low biomass burning emissions, more or less representing colder and warmer months, with the exception of few sampling days, where biomass burning showed quite high concentrations also in summer. This deviation additionally represents periods with low and high vegetation stocks.
Spatial variations: Recent studies predominantly considered only one measurement site for the application of the EC-tracer-method. Besides, the EC-tracer method was primarily conducted for sites where the influence of primary biogenic emissions could rather be neglected compared to primary anthropogenic sources [19,29,30]. One study investigating several stations was reported by Yuan et al. [18] highlighting the difficulty to obtain a ratio that is representative for a mixture of primary sources which vary not only in time but also in space. Another study considering several places—urban background, curbside and tunnel—in Portugal, Spain and UK was reported by Pio et al. [21], who found that primary ratios decreased with increasing traffic emissions. In order to obtain an [OC/EC]p that is specific for each area of interest, in this study, calculations are also performed separated by stations. To proof if vegetation has an impact on the application, a park (site HV) with many deciduous trees is chosen, where PMF analysis showed a primary biogenic contribution to OC of 22% compared to 14% at the traffic-related site (site LV), but with comparable absolute concentrations.

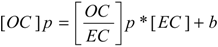
2.4.2. Calculation of [OC/EC]p and SOC

Several approaches have been developed to identify the most probable [OC/EC]p necessary for the calculation of SOC. Castro et al. [31] for example used the minimum ratios for the calculation of [OC/EC]p. Cabada et al. [16] calculated [OC/EC]p using ratios from events with low ozone concentrations or solar radiation as a hint for low or no SOA-formation. In this study, data on biogenic SOA-compounds, which were analyzed in a previous study [22], could be used to differentiate between events with high or low SOA-contribution, since they can be assumed to be the dominant secondary source, at least in the warmer months. Furthermore, emanating from similar meteorological conditions for the formation of anthropogenic and biogenic SOA, days with high biogenic SOA were considered as being representative for days for total SOA-formation, being aware of the fact that a complete consideration of anthropogenic SOA-contribution cannot be guaranteed. Thus, days with high concentrations of SOA-indicator compounds (limit values for the division into high and low are given in Table A1) were deleted from the data pool to determine an [OC/EC]p-ratio, and outliers were additionally removed. Figure 1 gives the sum of the SOA-compound concentrations for PM10 from the previous study and shows, that days with no occurrence of even only biogenic SOA were rare, preventing a complete exclusion of SOA. The information on real measured SOA levels shows that the selection of data sets assumed to be unaffected by SOA-formation is a critical step in the calculation of [OC/EC]p and approves the concerns made by Lonati et al. [5]. In comparison with taking the approach which uses the lowest OC/EC-ratio, the approach used here, might lead to an increased [OC/EC]p-ratio, but also to a decreased intercept.
Figure 1. PM10-SOA-concentrations from compound analysis. Secondary organic aerosol (SOA) is given by the sum of the compounds pinic acid, pinonic acid, 2-Methylthreitol and 2-Methylerythritol [22].
Atmosphere 05 00252 g001

3. Results and Discussion

3.1. OC and EC

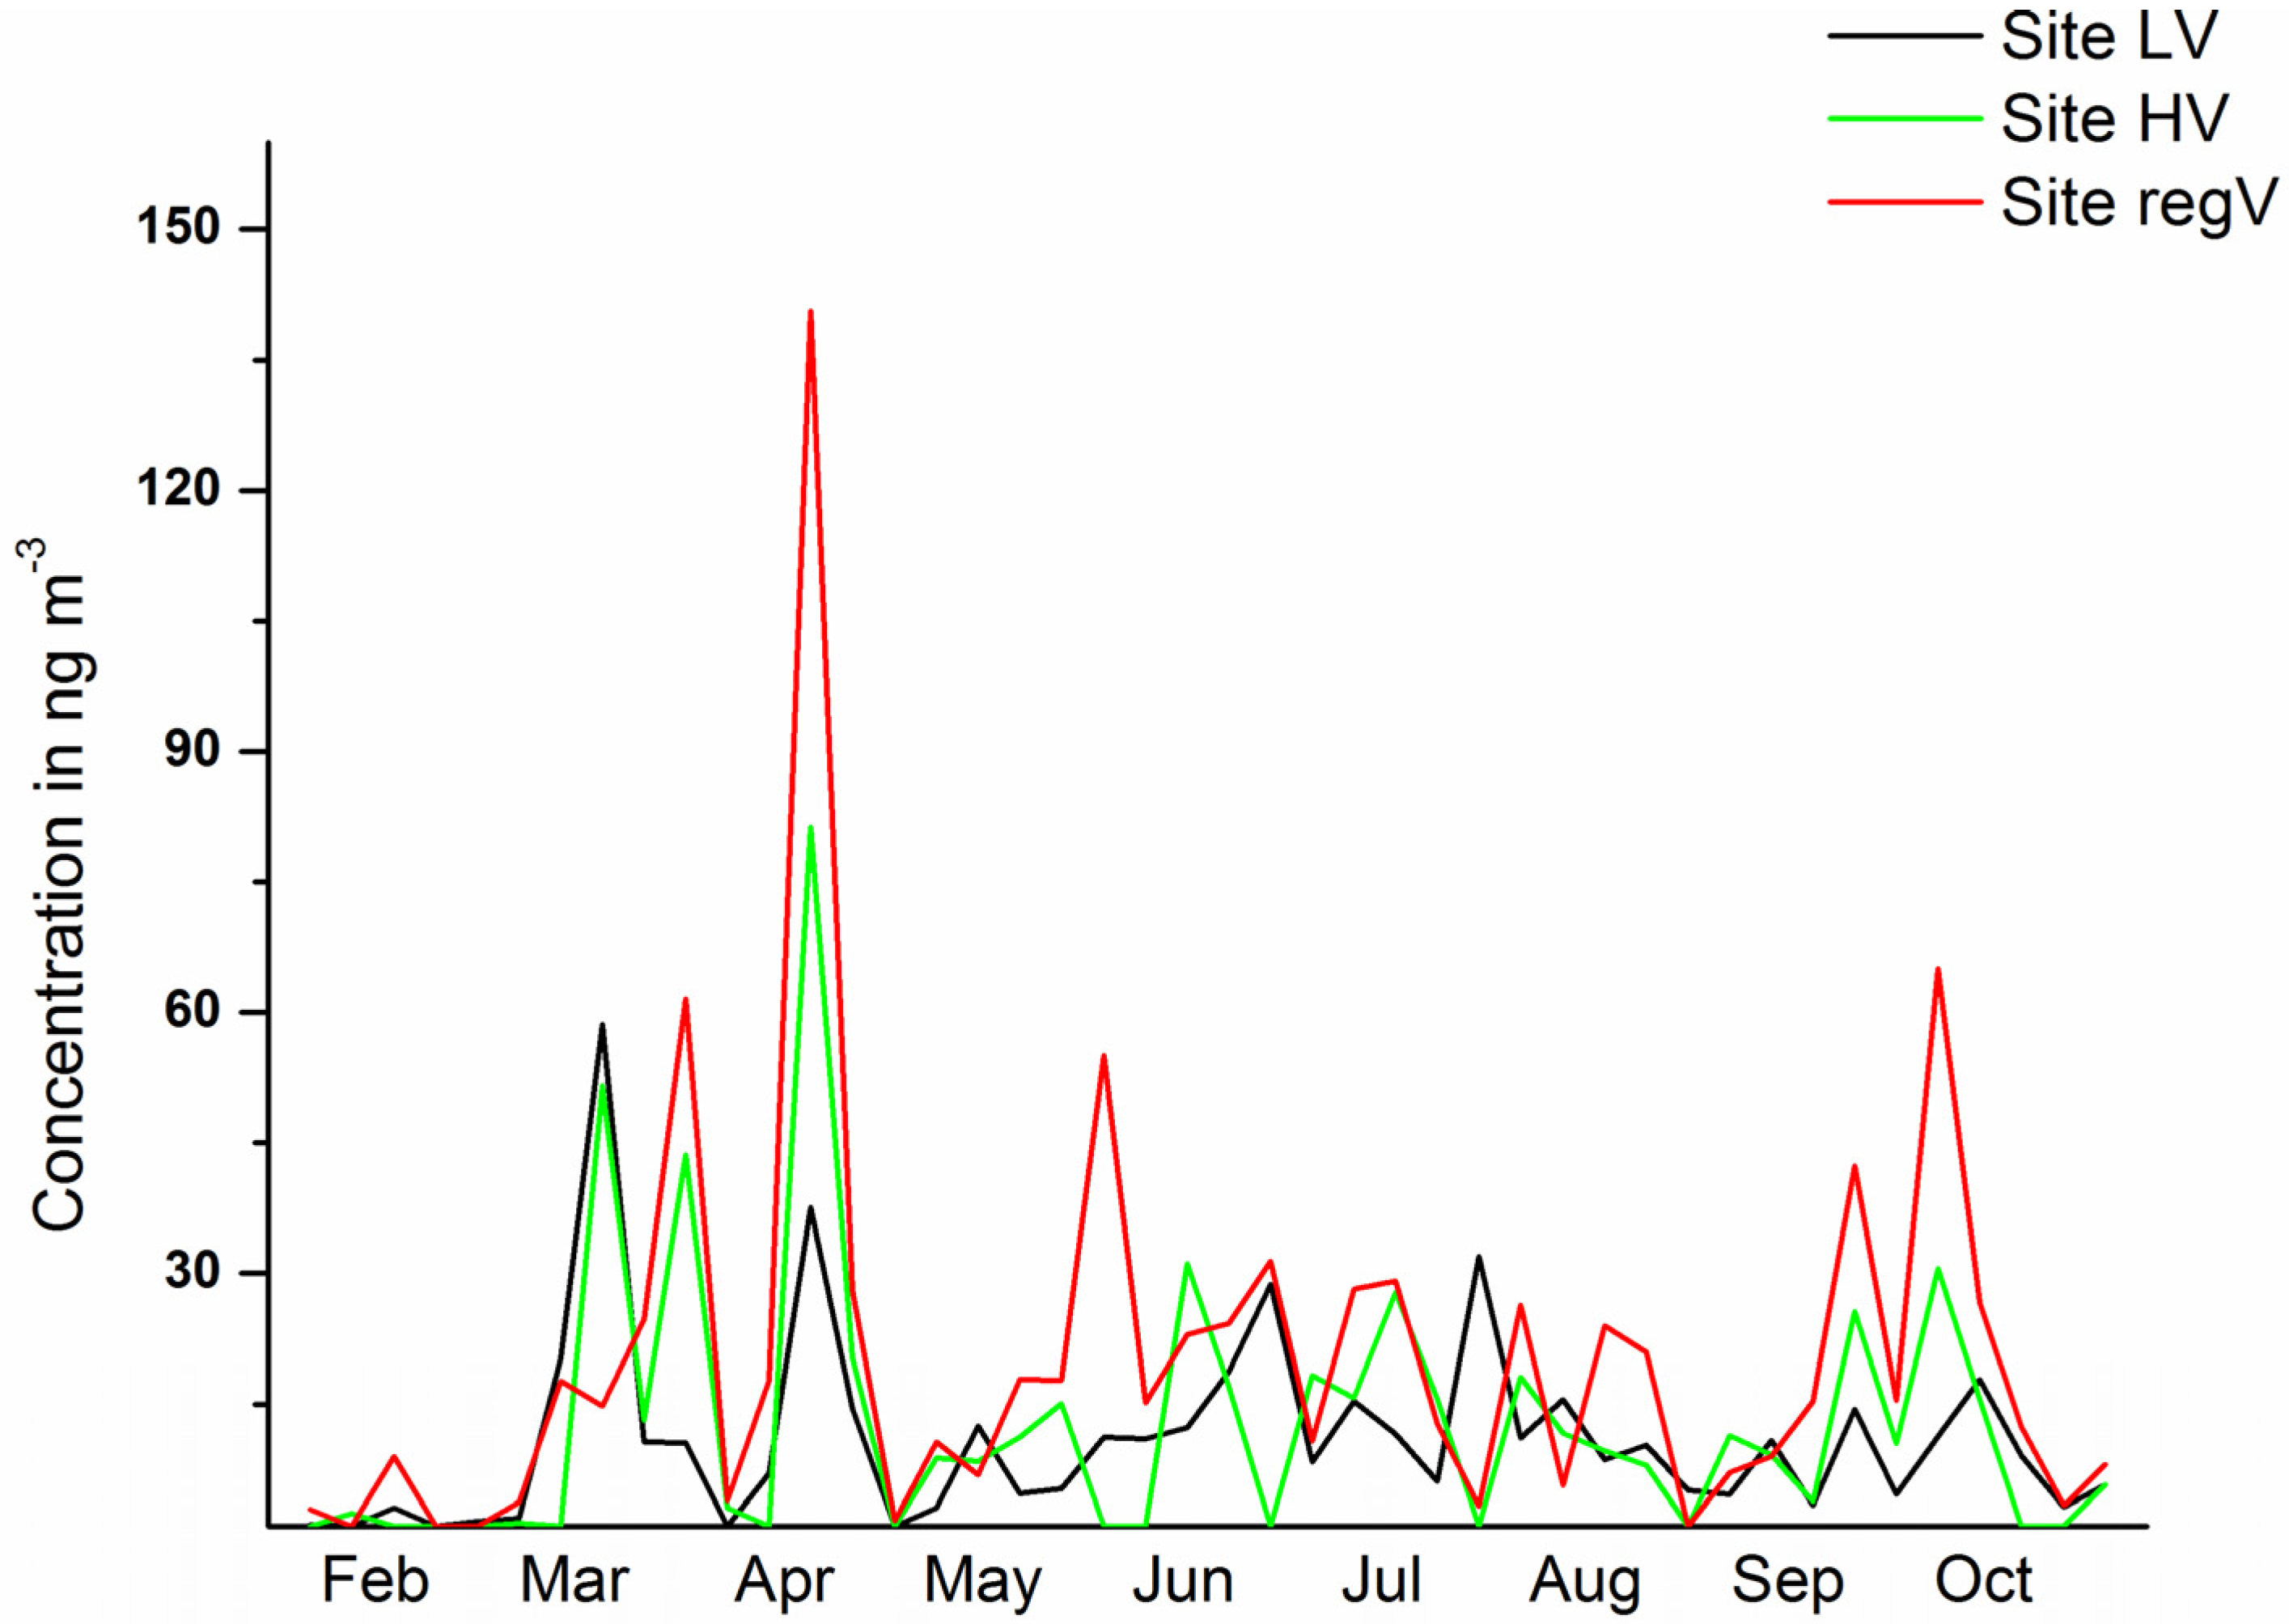
3.1.1. Concentrations

Mean OC concentrations vary between 4.1 µg∙m−3 at site HV and 4.9 µg∙m−3 at site LV in PM10 and between 2.6 µg∙m−3 and 2.7 µg∙m−3 in PM1 (Table 1). EC concentrations are lower than 1 µg∙m−3 at the HV and regV-sites and reach 3 µg∙m−3 at site LV. Concentrations are low compared to other metropolis like Los Angeles, US, Sao Paulo, Brazil, or Beijing, China, which show OC concentrations between 7.74 µg∙m−3 and 21.5 µg∙m−3 and EC concentrations between 3.81 µg∙m−3 and 8.7 µg∙m−3 in PM2.5 [6,32,33]. The lower OC and EC levels in Berlin are most probably due to the lower population density and lower traffic or advanced filter technology for cars. Concentrations are also little lower than those reported for PM2.5 sampled at a background station in Milan [5]. The OC/EC-ratios (Table 1) observed at the HV and regV sites are in a similar range as ratios reported for PM2.5 samples from urban sites in California [34] or Pittsburgh [16]. They are also comparable with PM2.5 samples in several rural/remote places in Europe for winter, but lower than the ratios found in summer [35]. Between stations, correlations of OC are significantly high (>0.95 in PM10 and 0.91 in PM1, data not shown), indicating a uniform spatial distribution. EC shows significant but low correlations between the LV- and regV sites (0.33), significant correlations between the HV and the regV-sites (0.82), but no correlations between the HV and the LV-sites in both fractions. Thus, EC has a clear local contribution at site LV, and the HV and the regV-sites seem to reflect the regional distributed EC in the urban and surrounding area.

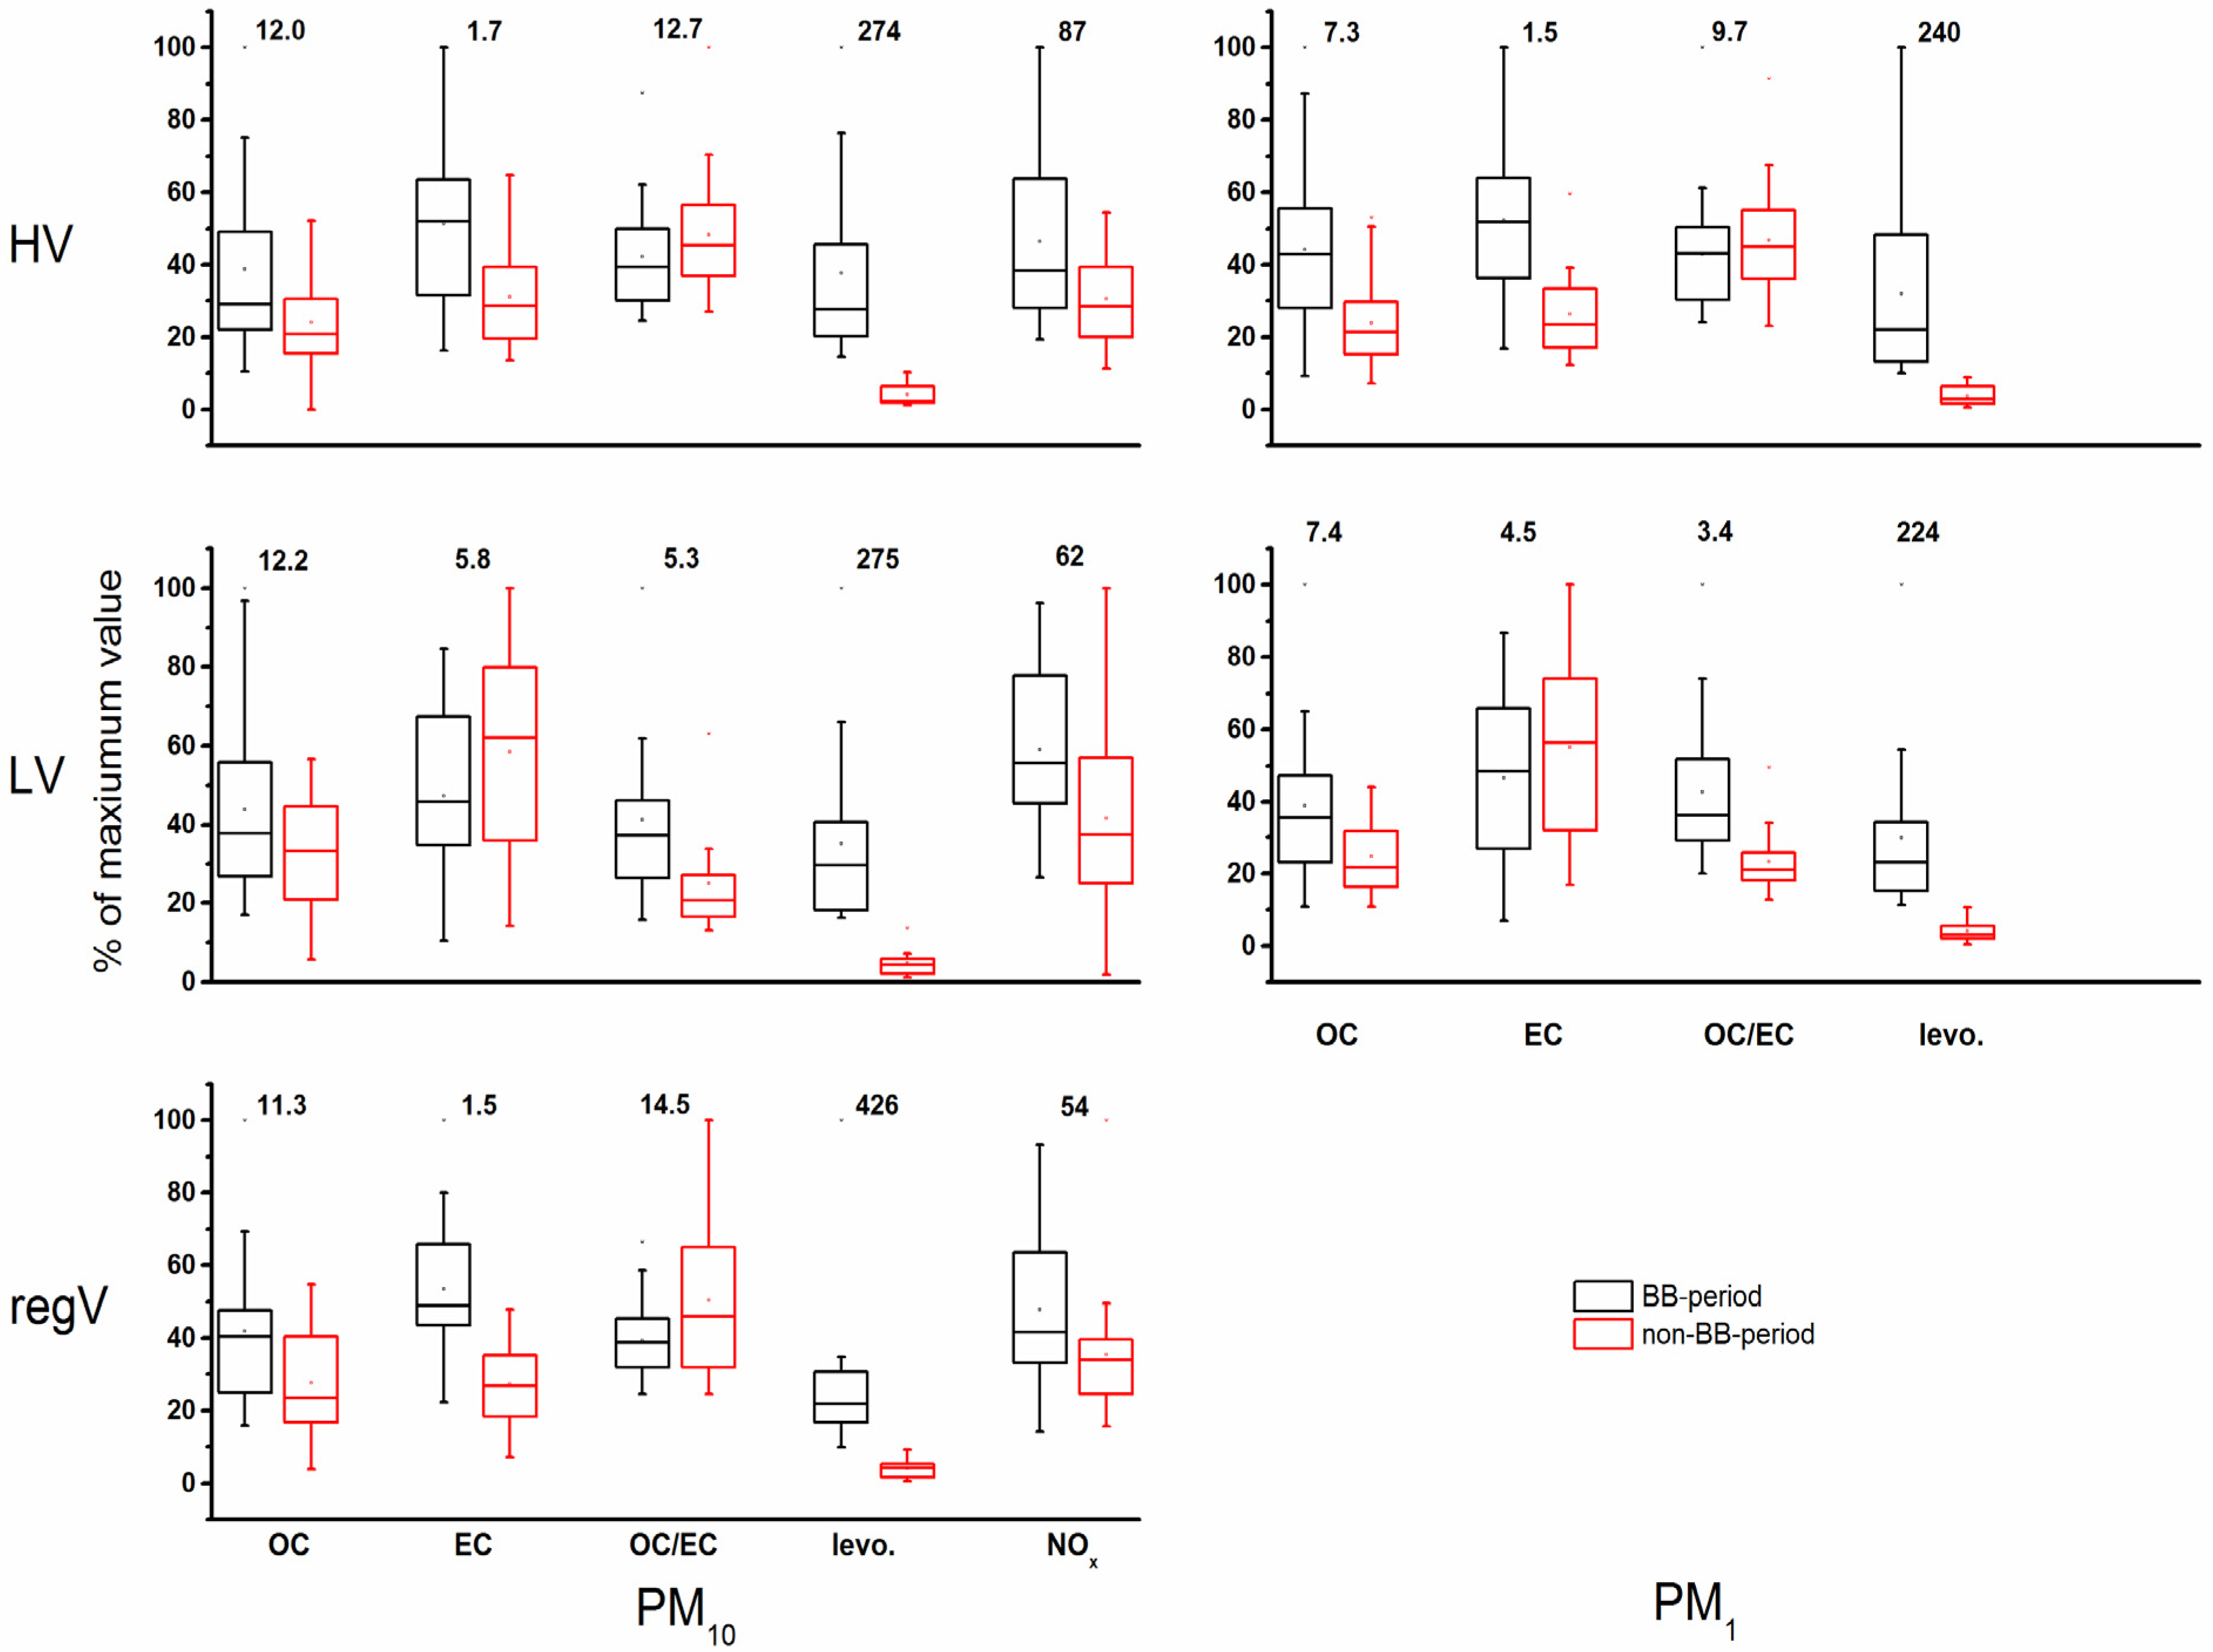
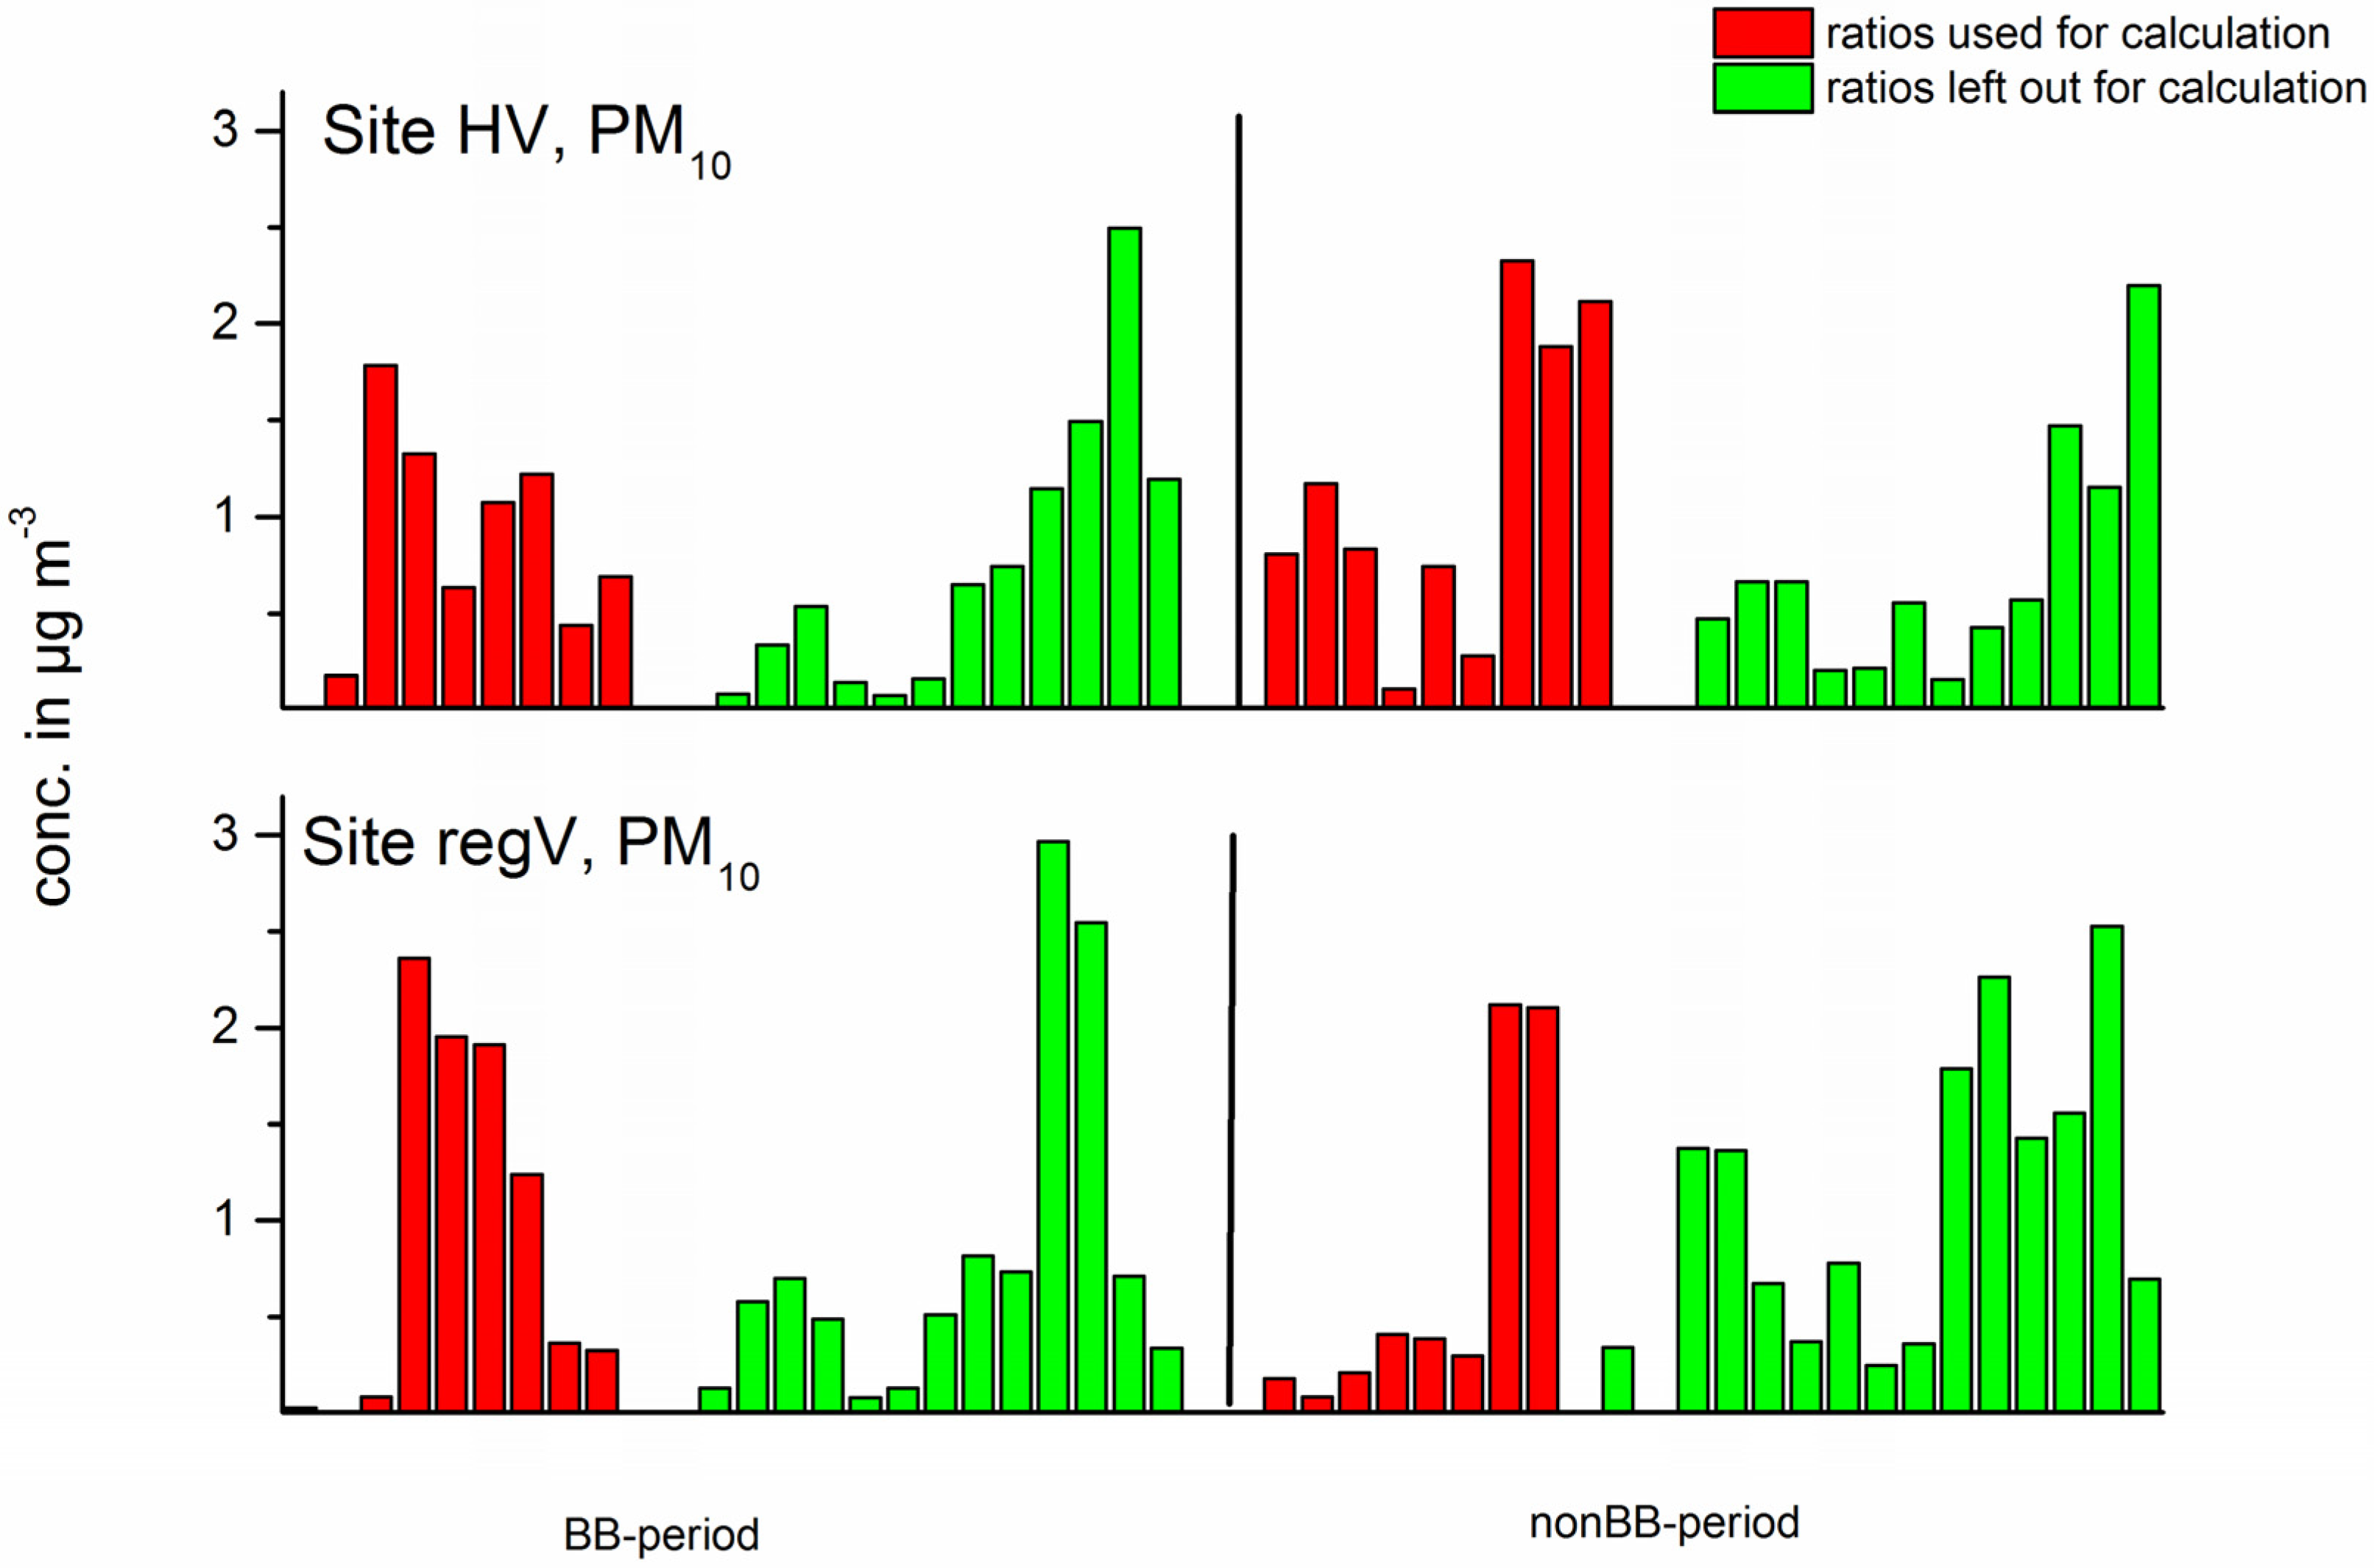
3.1.2. Influence of Biomass Burning, SOA and Traffic on OC/EC-Ratios

Table 2 gives the correlations between OC, EC, OC/EC, levoglucosan, NOx and SOA-compounds. At site LV, where traffic emissions can be supposed to determine the OC/EC-ratio, significant correlations can be observed between the OC/EC-ratio and levoglucosan. In contrast, at the HV and regV-sites, levoglucosan shows insignificant negative correlations with the OC/EC-ratio, but positive correlations with OC and especially EC. Correlations of OC, EC or the OC/EC-ratio with NOX are less significant than with levoglucosan. Correlations with SOA can also rather be neglected at all sites, confirming that an increase of the OC/EC-ratio is not necessarily only a result of increased SOA-concentration, but also derives from biomass burning emissions.
Table 1. Mean concentrations of organic carbon (OC) and elemental carbon (EC) of the whole sampling period in µg∙m−3 (±standard deviation) and OC/EC-ratios.
PM10PM1
OCECOC/ECOCECOC/EC
HV4.1 ± 2.40.6 ± 0.45.7 ± 2.12.7 ± 1.50.6 ± 0.34.3 ± 1.7
LV4.9 ± 2.53.0 ± 1.51.8 ±1.02.6 ± 1.32.3 ± 1.11.1 ± 0.7
regV4.3 ± 2.30.6 ± 0.36.5 ± 2.5
Table 2. Correlations after Pearson between OC, EC, OC/EC, levoglucosan, NOx and SOA-concentrations.
HV LV regV
PM10ECOC/ECLevo.SOANOxECOC/ECLevo.SOANOxECOC/ECLevo.SOANOx
OC0.830.430.490.180.170.620.380.260.34 0.730.510.410.170.06
EC−0.180.680.030.35 −0.41−0.190.23 −0.40.690.020.38
OC/EC−0.210.38−0.18 0.580.26 −0.210.300.39
PM1
OC0.800,360.540.300.170.560.380.480.31
EC−0.350.70,080.34 0.570.050.22
OC/EC−0.250.48−0.35 0.570.14
Note: Numbers in bold represent significant correlations.
As biomass burning has the strongest influence on OC, EC or the OC/EC ratio, it is reasonably to divide the whole sampling period in two periods with low and strong influence of biomass burning emissions (further on termed as BB-period and nonBB-period; limit values for distinguishing are 40 and 25 ng∙m−3 levoglucosan for PM10 and PM1 respectively). Concentration tendencies between both periods for OC, EC, OC/EC, levoglucosan and NOx are presented in Figure 2. The OC/EC-ratio and levoglucosan have a similar seasonal distribution at the LV site, consistent with the positive correlations. Mean OC concentrations are little higher in the BB-period as compared to the non-BB period, EC decreases. This is surprising as EC concentrations from fossil combustion are expected to be higher in cooler months mainly due to invasion conditions during these months, and additionally, a contribution of EC from biomass burning must be included in the concentrations of this period. Furthermore, a higher increase of OC as actually seen would also have been expected for the BB-period. At this point, we can only assume increased vacation activities, tourism and construction works during summer for this observation causing more traffic and traffic jam. Irrespective the underlying reason, it is assumed here that the OC/EC ratio during this time would not differ substantially with or without this source contribution, as the source would positively affect both, OC and EC concentrations. Thus it is still assumed that the increased OC/EC ratio in the BB-period is rather a result of increased biomass burning emissions in winter instead of increased traffic emissions in summer and seems reasonably as it is consistent with the findings of Lonati et al. [5] in Milan, Italy and Fine et al. [36]. Latter found that biomass burning can reach an OC/EC-ratio up to 40 times that of traffic, dependent on the wood type. A different trend is observed at the HV and regV sites. In the BB-period, EC increases more strongly than OC, leading to a decreased OC/EC-ratio. This can result from both, higher traffic and biomass burning emissions during this period which have both a lower OC/EC-ratio than the dominant summer emissions, which are biogenic and absent in EC. This is in contrast to the LV site, where traffic emissions are the dominant source also in summer compared to biogenic emissions at the other two sites, thus at the traffic site, the traffic OC/EC-ratio must be used for comparison with the OC/EC-ratio arriving from biomass burning.
Figure 2. Concentration tendencies for OC, EC, OC/EC-ratio, levoglucosan and NOX between the BB- and non-BB-period.
Atmosphere 05 00252 g002
Note: Concentrations are given as relation (%) to the maximum value (on top) of each variable. OC, EC and NOx are given in µg∙m−3, levoglucosan in ng∙m−3. The box plots represent the mean (dot within the box), median, 25- and 75-percentile (box) and the 1.5*IQR (interquartile range, whiskers).

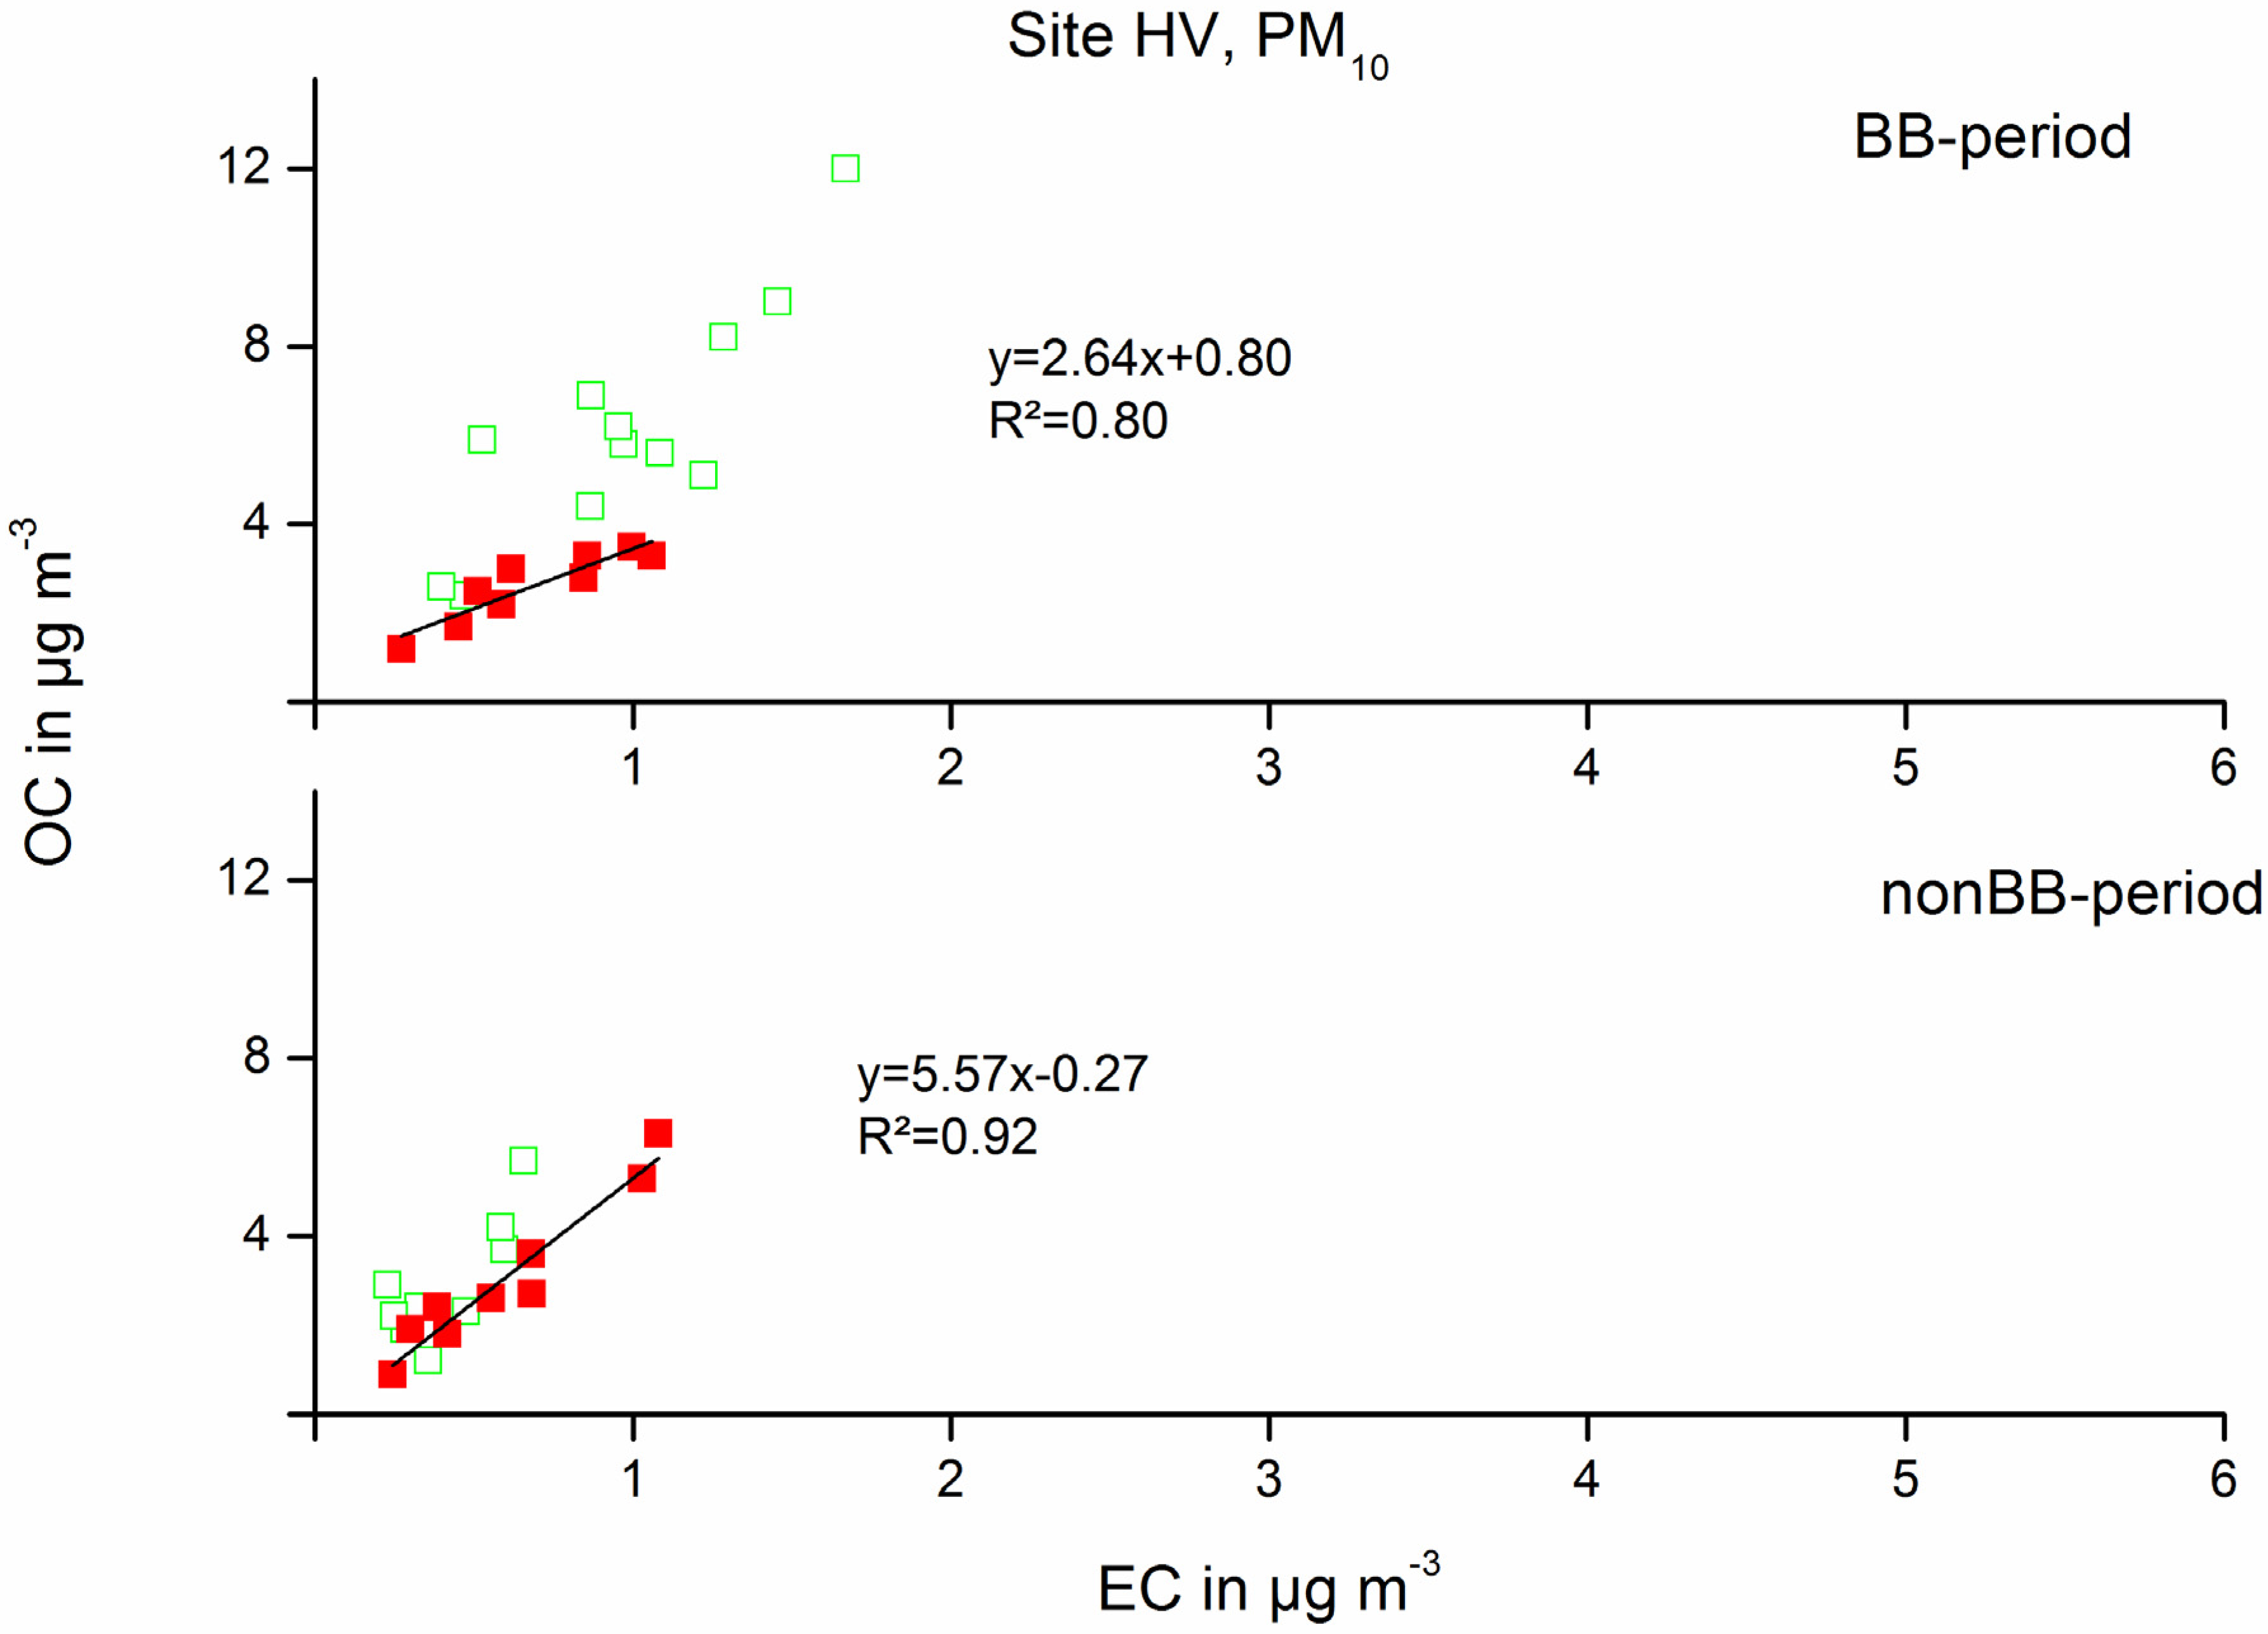
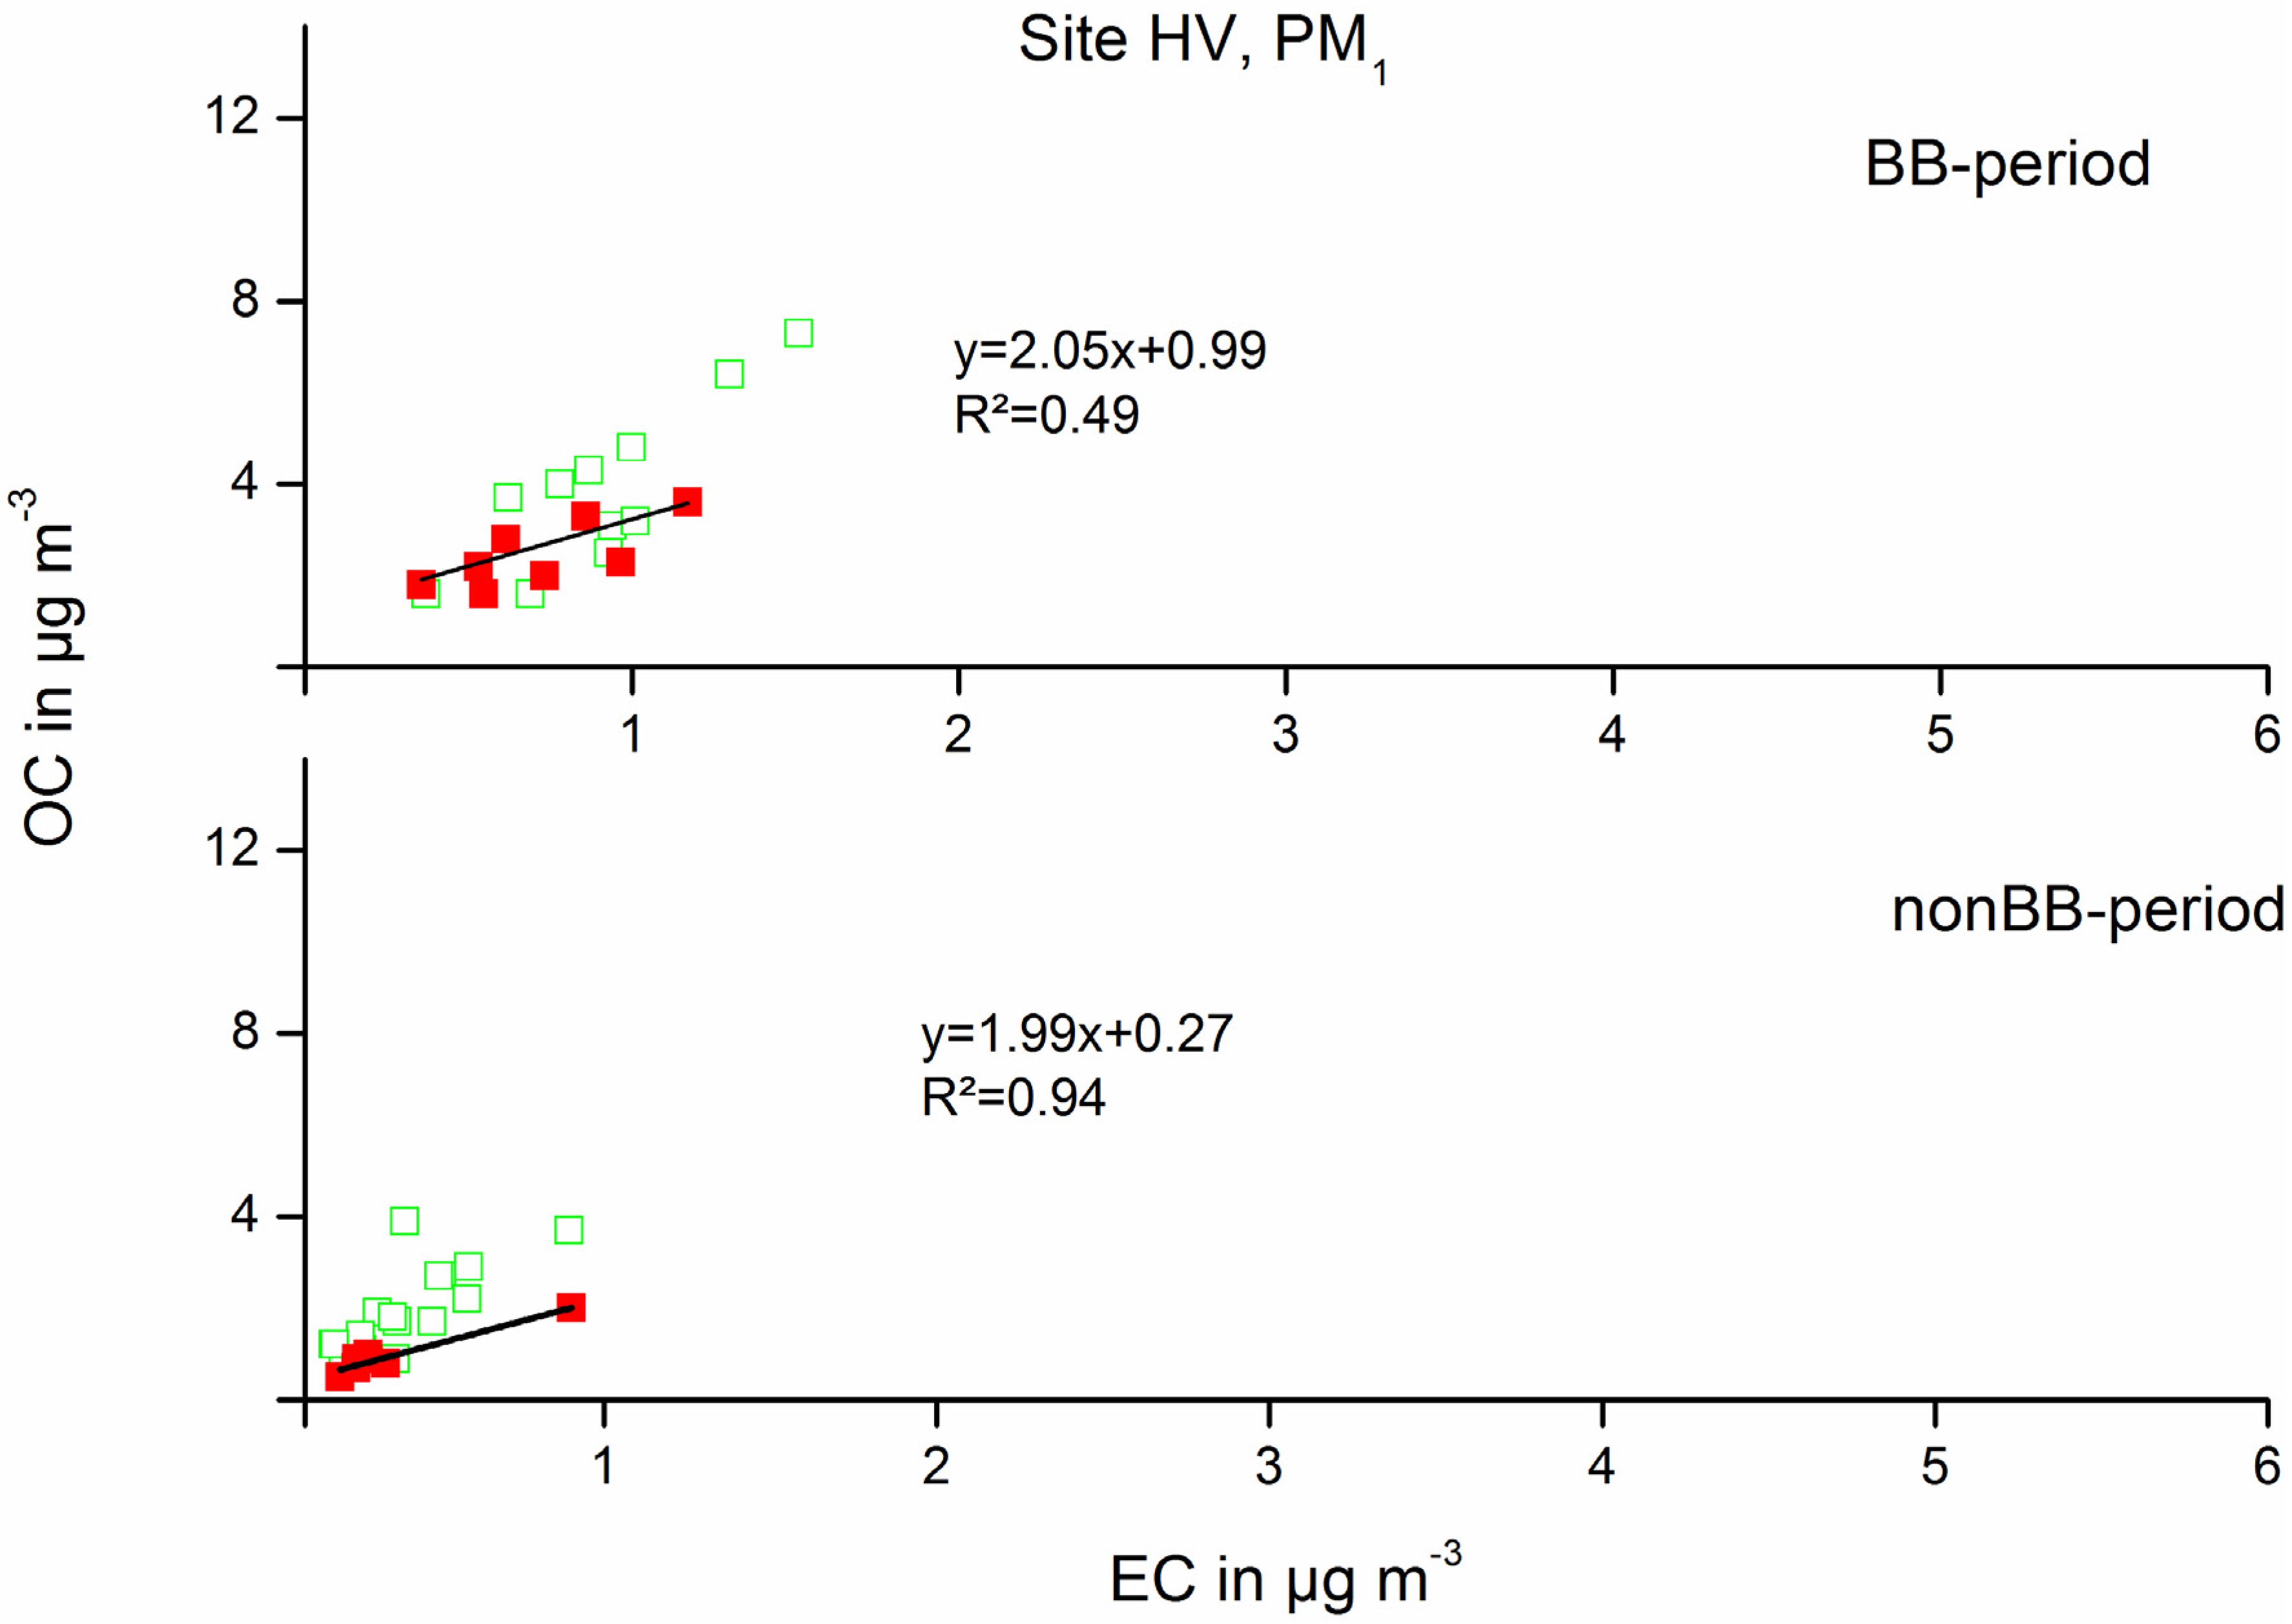
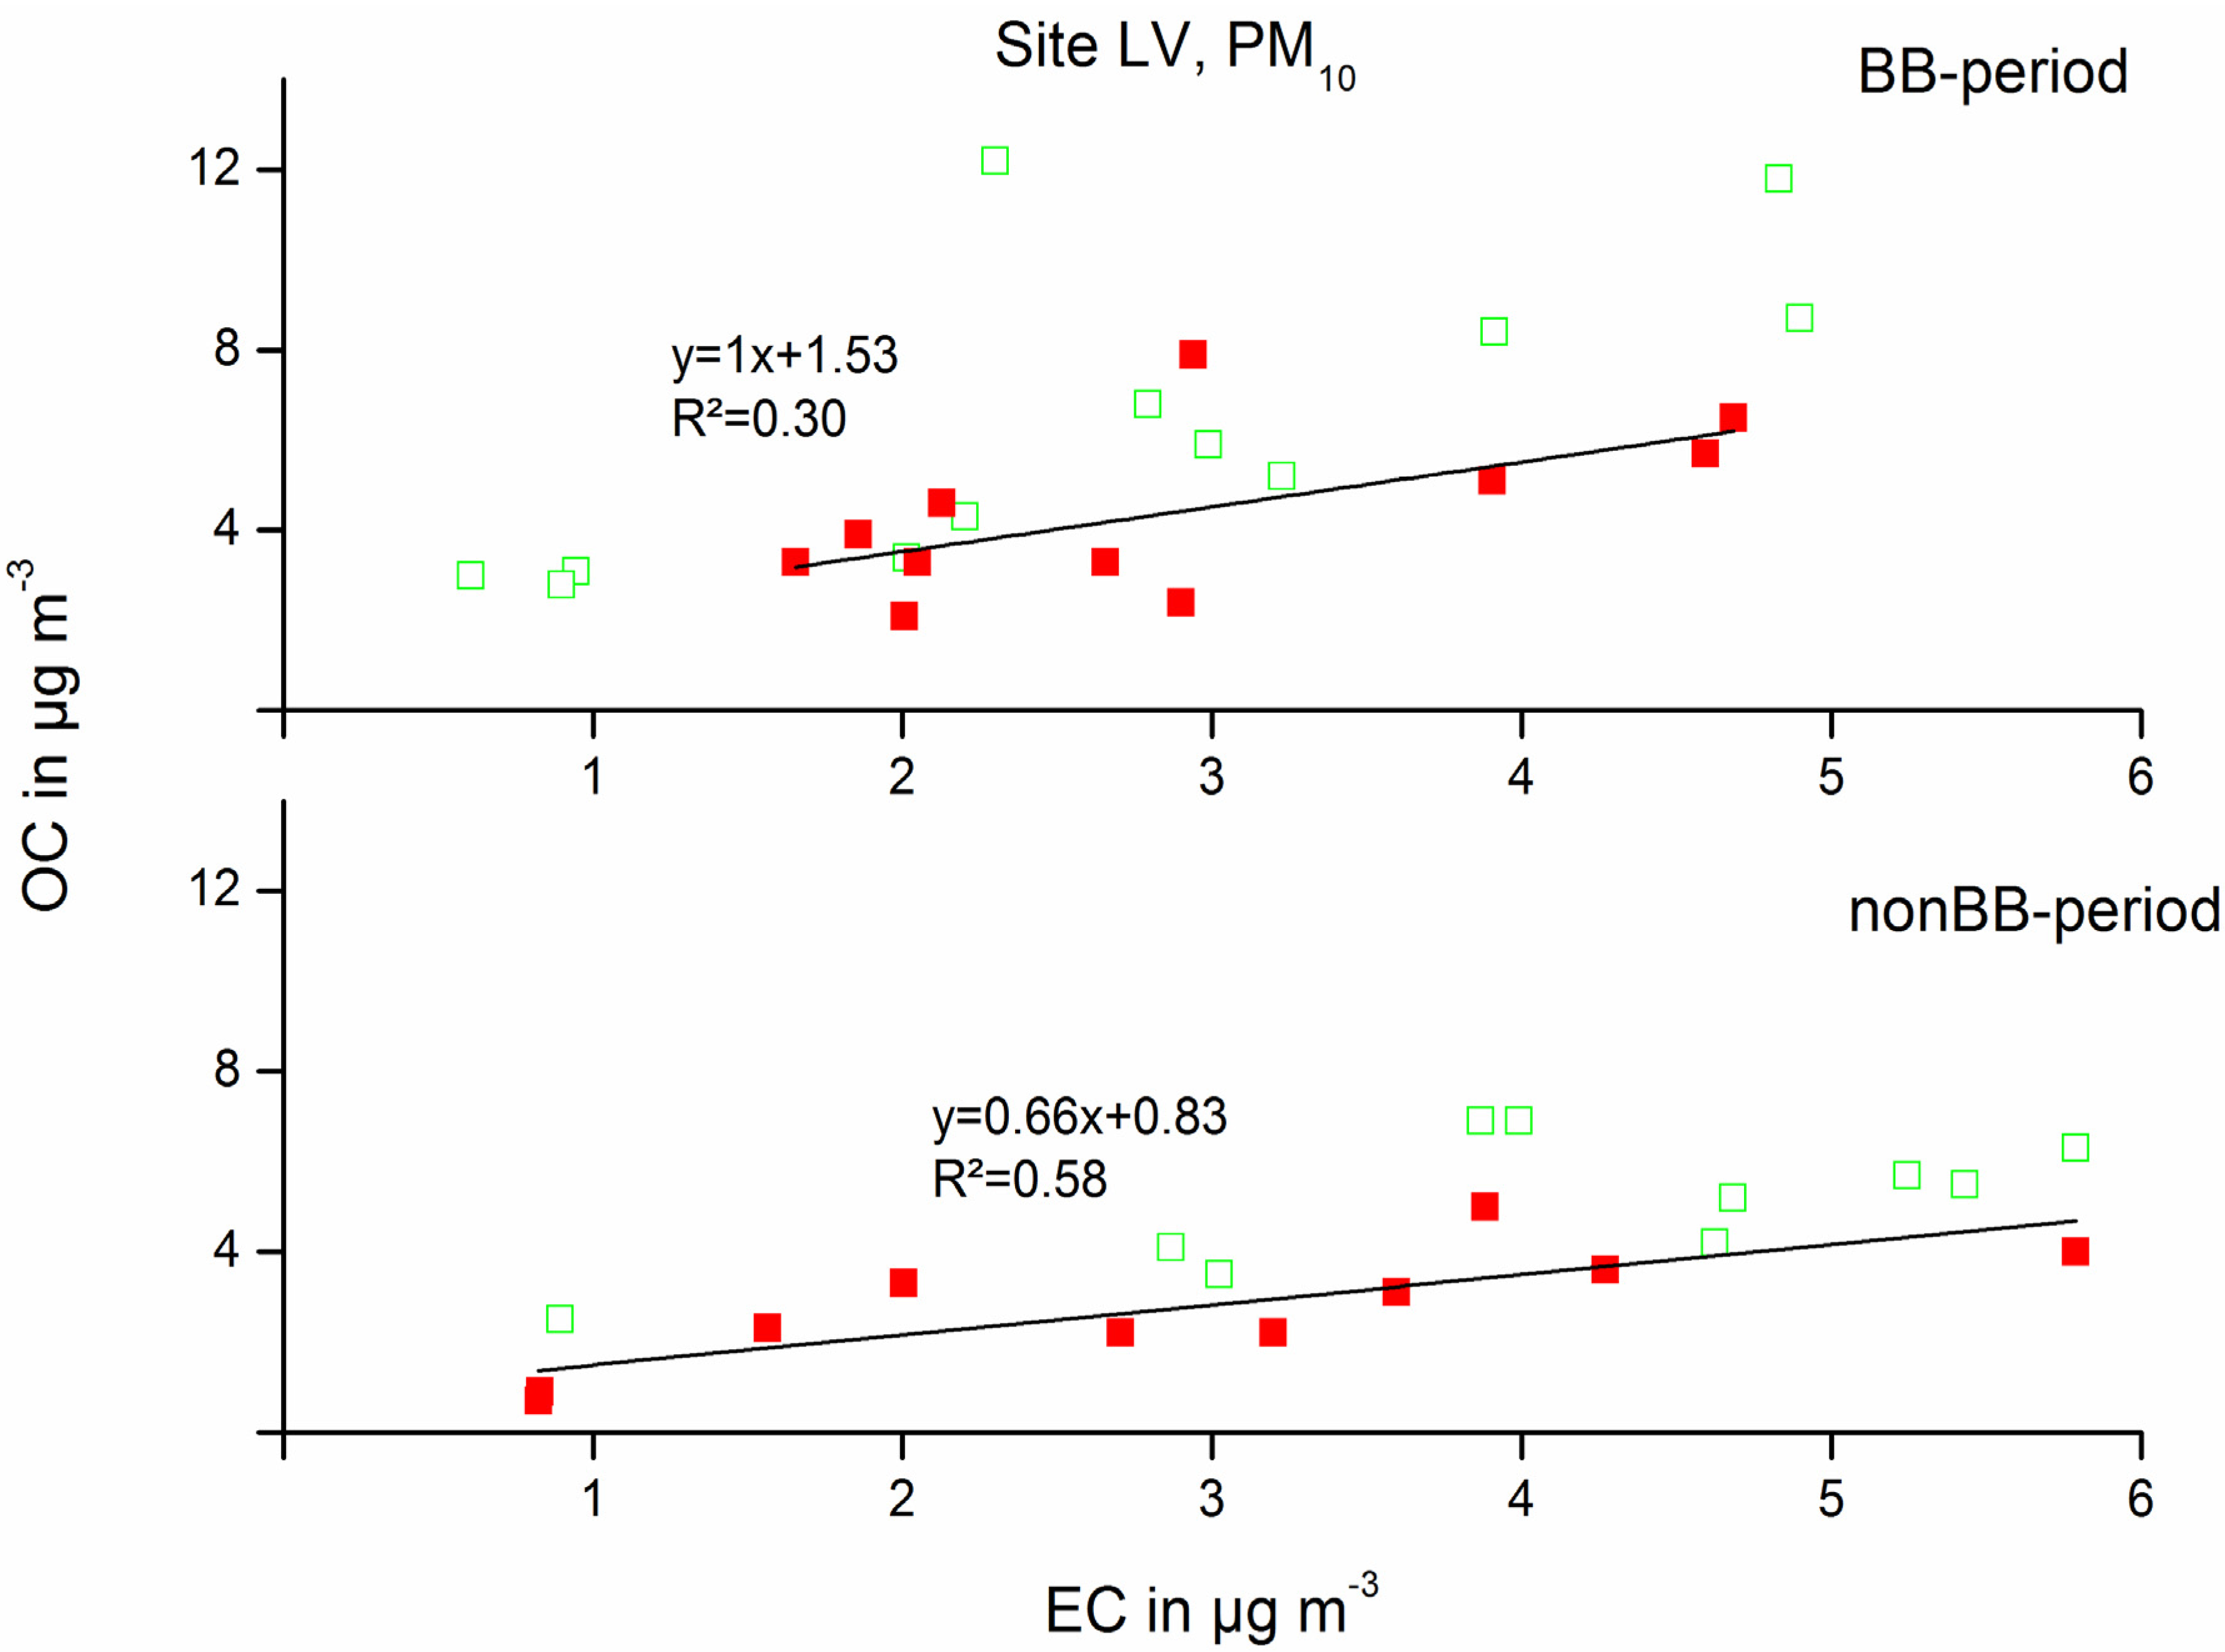
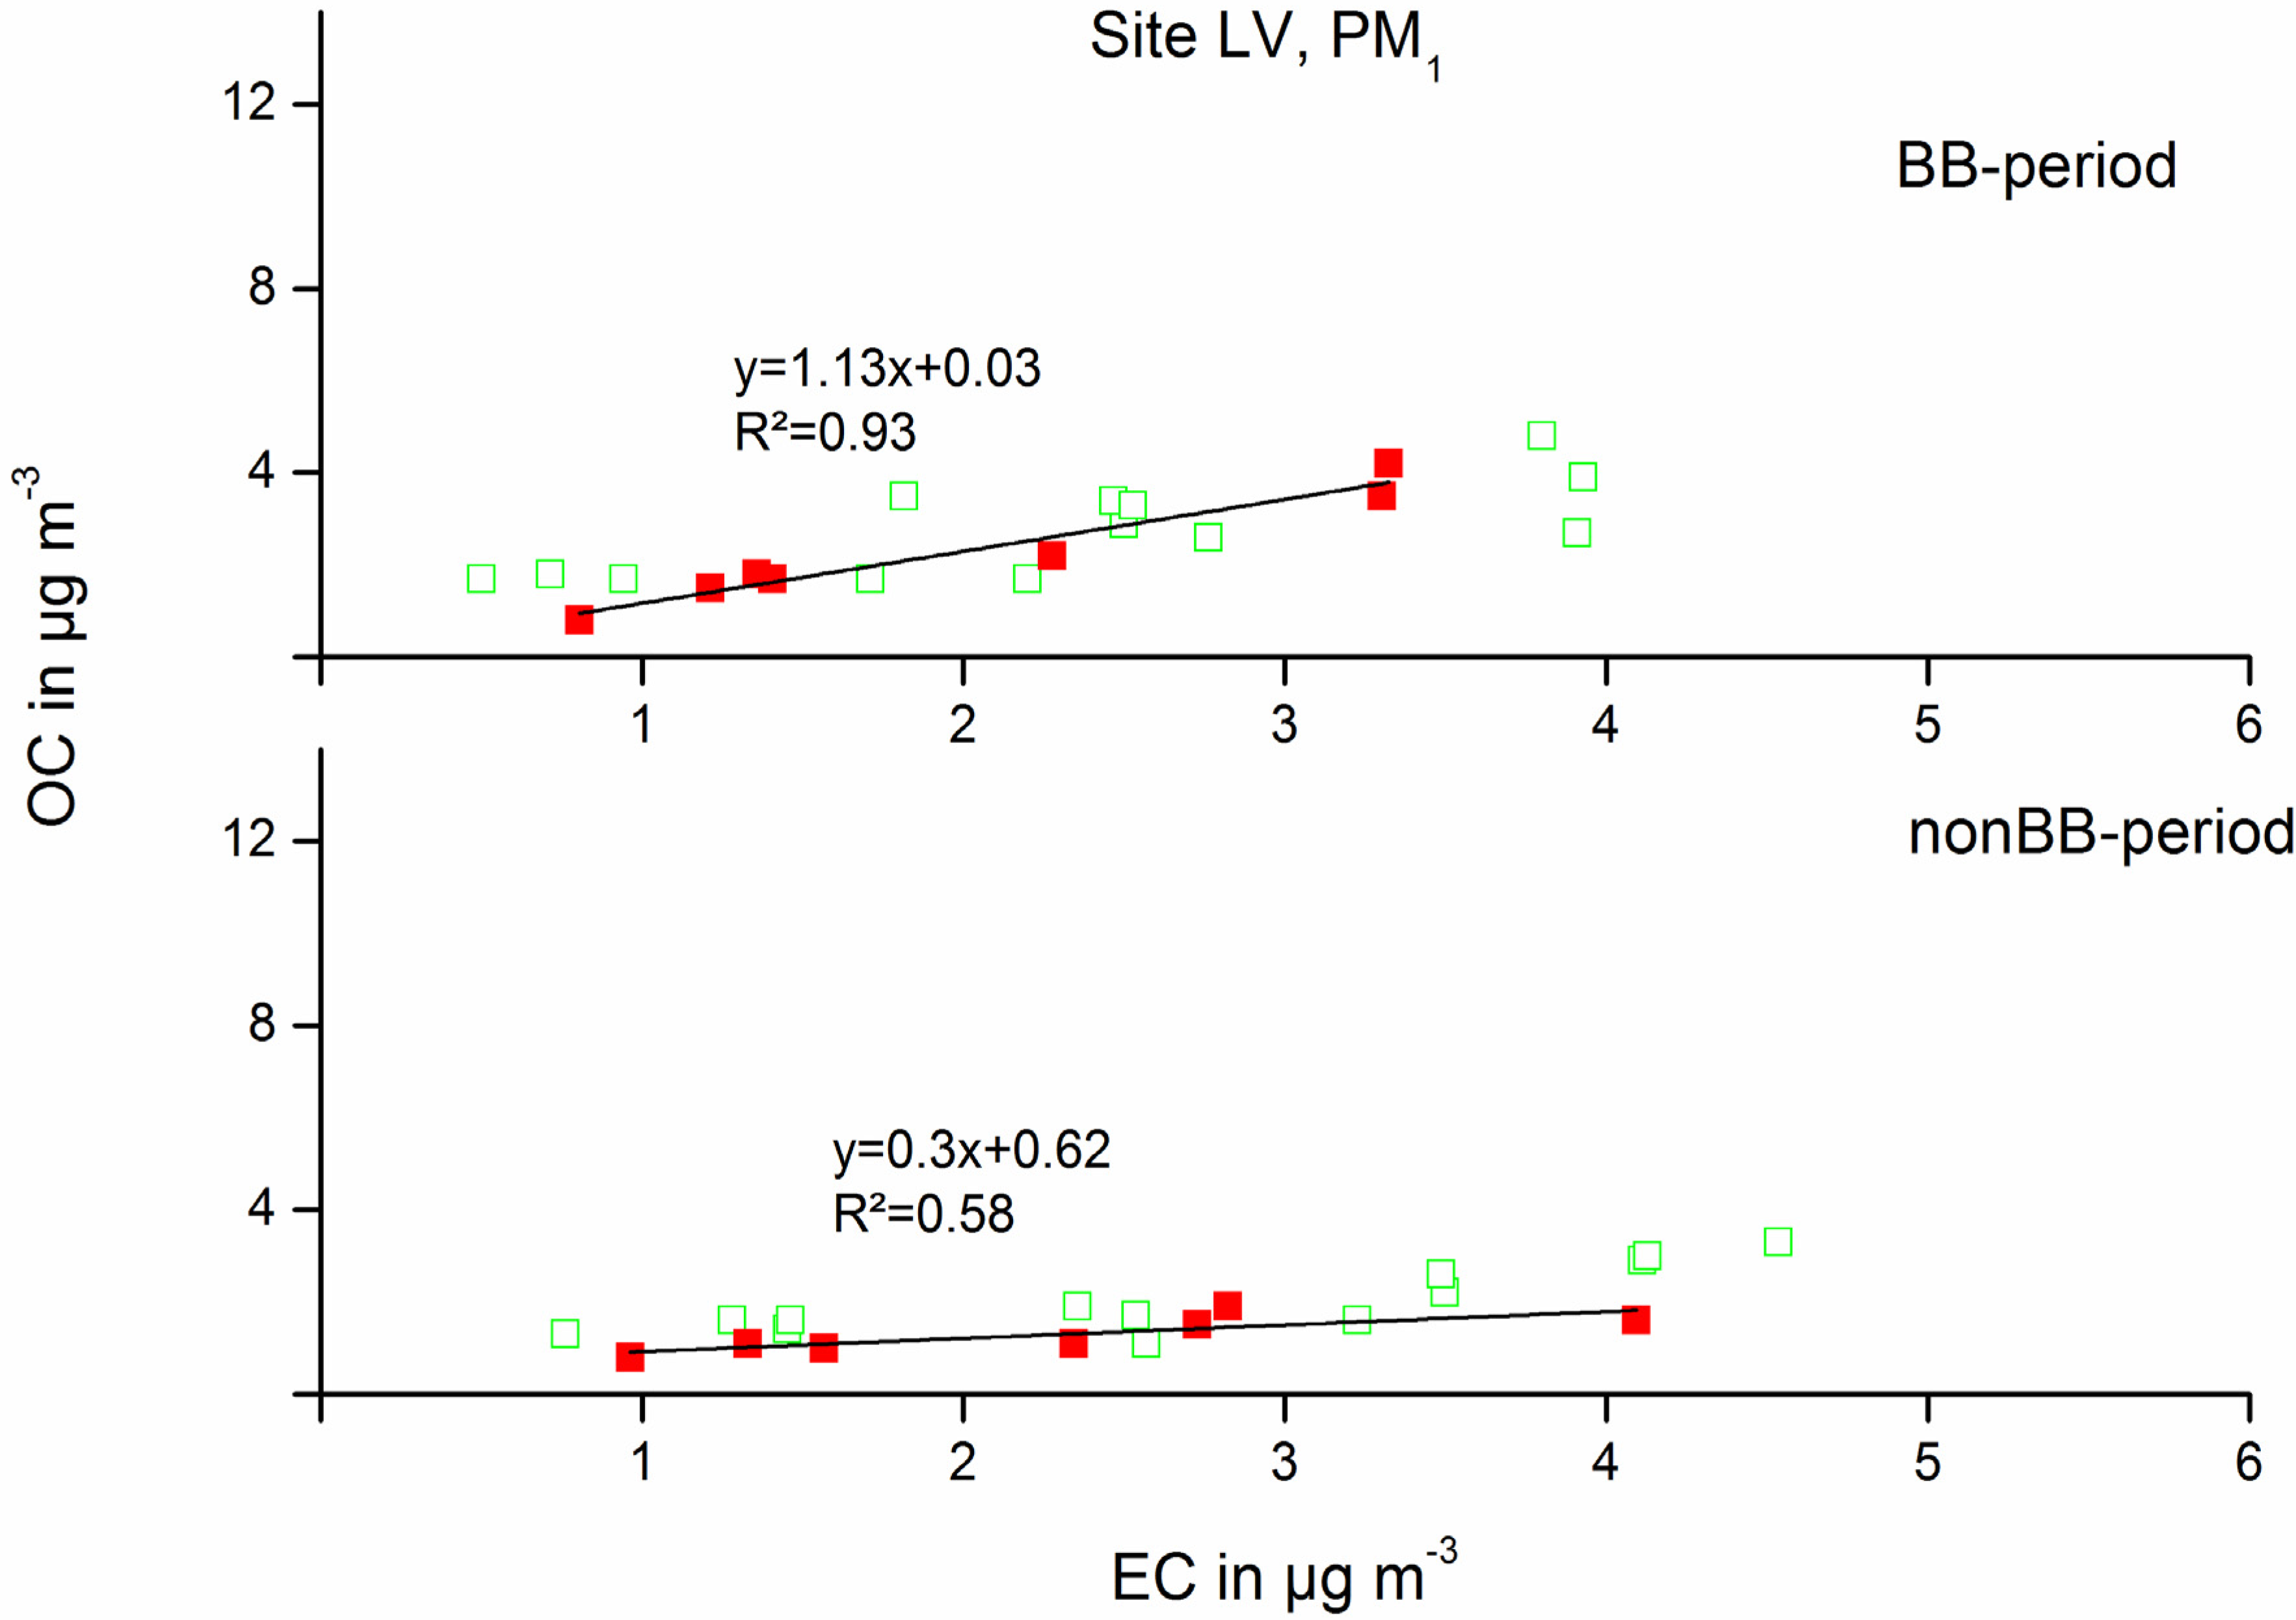
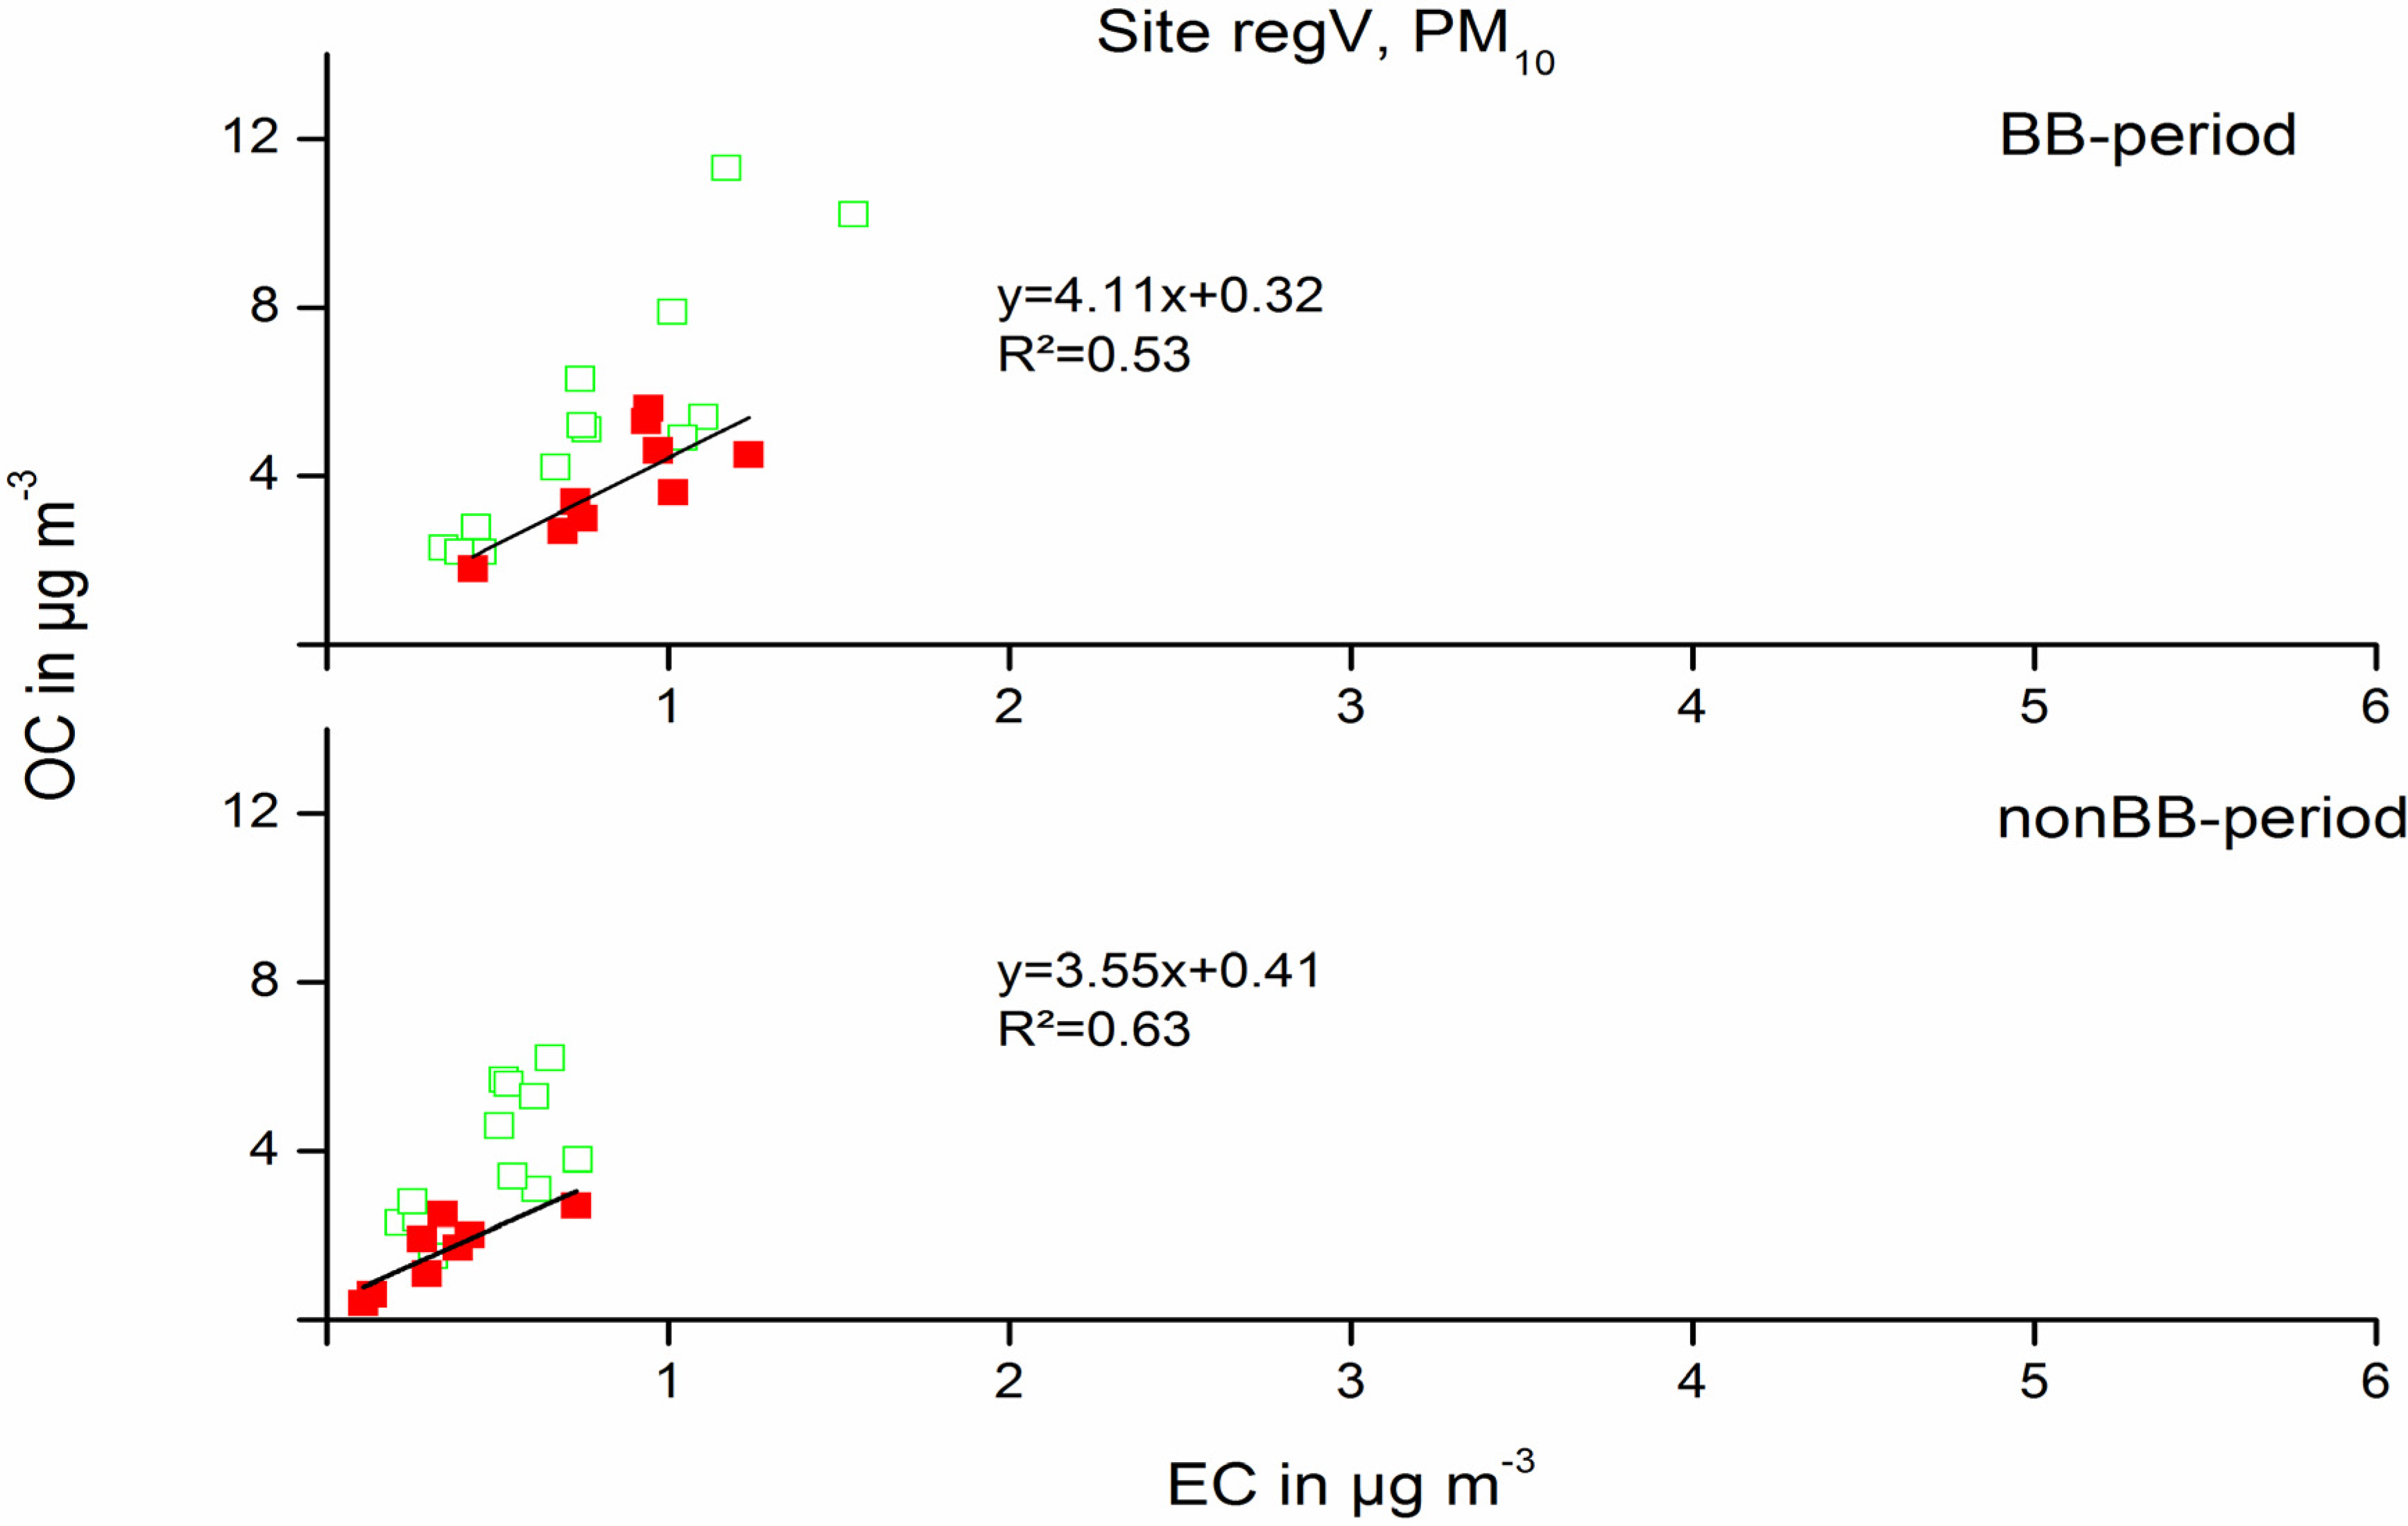
3.2. Results by EC-Tracer-Method

3.2.1. [OC/EC]p-Ratio
As the OC/EC ratio varies significantly between days with high and low biomass burning events at the LV site, it was reasonable to apply the EC-tracer-method separated for these two periods. The separation into both periods, which is almost identical with colder and warmer season, was also conducted for the HV and regV sites, so data evaluations for all sites were comparable. The determined [OC/EC]p-ratios for all sites and PM-fractions are given in Table 3 and in the Figures A1–A5 in the supplementary information. In this data evaluation, fits between OC and EC were between R2 = 0.49 and 0.93, except of site LV in PM10 for the BB-period. The fits in the BB-period show lower correlations than those of the nonBB-period, indicating that significant emissions of two different combustion inventories (traffic and biomass burning) adversely affect the application. Prior studies reported R2-values between 0.53 and 0.99 [16,18,30].
Table 3. Estimated parameters of the linear fit and mean (median) SOC- and POC-concentrations in µg∙m−3 calculated with EC-Tracer method and PMF analysis.
BB-PeriodR2[OC/EC]pInterceptConc. SOC% conc.PMF SOCPMF POCbio
PM10HV0.802.6 ± 0.50.8 ± 0.21.33 (0.69)21 (21)0.83 (0.41)0.8 (0.6)
PM1HV0.492.1 ± 0.81.0 ± 0.50.72 (0.29)11 (9)0.86 (0.83)0.2 (0.1)
PM10LV0.301.0 ± 0.41.5 ± 1.11.12 (0.46)16 (14)0.60 (0.20)0.6 (0.5)
PM1LV0.931.1 ± 0.10.03 ± 0.10.49 (0.22)11 (9)0.56 (0.34)0.2 (0.1)
regV0.534.1 ± 1.30.3 ± 0.80.82 (0.53)12 (12)0.76 (0.42)0.8 (0.5)
NonBB-Period
PM10HV0.925.6 ± 0.6−0.3 ± 0.30.45 (0.49)15 (16)1.00 (1.30)0.9 (0.6)
PM1HV0.942.0 ± 0.20.3 ± 0.10.65 (0.56)33 (43)1.01 (0.93)0.2 (0.2)
PM10LV0.580.7 ± 0.20.8 ± 0.50.98 (1.06)18 (23)0.8 0 (0.50)0.8 (0.7)
PM1LV0.580.3 ± 0.10.6 ± 0.10.44 (0.45)17 (22)0.71 (0.39)0.3 (0.2)
regV0.633.6 ± 1.00.4 ± 0.21.21 (0.88)26 (33)1.59 (0.91)0.9 (0.7)
Note: POCbio is obtained from the sum of the 2 biogenic POA-factors bio primary and bio/urban primary in PM10 and from the bio urban primary factor in PM1 determined in source apportionment with PMF [14].
Primary OC/EC ratios have been reported for several places in California or Atlanta, US, in the range of 1.8–2.4 for PM2.5 samples [19,29] which represent urban [OC/EC]p-ratios with no direct exposure to traffic. Lower ratios were found by Yuan et al. [18] (between 0.41 and 0.88) in PM10 summer and winter samples in Hong Kong. Castro et al. [31] found ratios of 1.1 OC/BC for urban PM10 samples in Portugal and the UK and of 1.5 for rural and remote sites in Portugal and Ireland under the assumption of negligible or constant noncombustion primary OC. Plaza et al. [37] and Pio et al. [21] also found ratios < 1.02 for summer and winter PM2.5 samples in a suburban area of Madrid or PM10 and PM2.5 urban background samples in cities in Portugal, respectively. In this evaluation here (Table 3), the ratios at site HV in PM1 meet the values found in the US. The ratios at the HV and regV sites with 2.6 to 5.6 in PM10 are higher. Ratios from site LV are the lowest (0.3–1.1) for both PM-fractions and seasons and are better comparable with those found in Madrid or urban background samples in Portugal [21,37]. However, [OC/EC]p-ratios described for vehicle combustion emissions in Lisbon, Portugal were lower than observed in most cases for the traffic site in this study [21]. Ratios between the BB and the nonBB-periods are partly comparable. Keywood et al. [38], who also investigated samples with differing influence of biomass burning separately, calculated a ratio of 2.09 for days with domestic heating instead of 2.25 for the non-affected days. Lonati et al. [5] found a considerable higher primary ratio in the cold season in PM2.5 samples in Milan (9.5) preventing them from performing the calculations for this period.
Even though the secondary contribution were tried to be reduced in the data, SOA-events still occurred at all sites and had consequently to be included in the calculation for [OC/EC]p. The lowest SOA-concentrations occurred at site LV (Table A1), what might contribute to a lower [OC/EC]p at the traffic related site. However, lower traffic [OC/EC]p are also in accordance with the findings of Pio et al. [21] for several kerbsides in Portugal and Spain compared to urban background measurement sites. One reason can be major incidence of diesel vehicle use. Many diesel vehicles pass the urban motorway, but do not or less use the inner-city roads due to the implement of the low-emission-zone, and diesel vehicles were found to have lower [OC/EC]p-ratios compared to gasoline-powered vehicles [21,39,40]. Keywood et al. [38], who also described similar tendencies, furthermore considered additional contributions from natural gas and paved road dust at the urban site for which a higher [OC/EC]p-ratio was determined compared to a tunnel measurement site, and some remaining contribution of SOA from the previous sampling day. Further explanation is also that the traffic emissions detected at the HV- and regV sites are of aged aerosol that is increased in SOA and water soluble organic compounds, compared to the fresh aerosol detected at site LV [29,41] which is difficult to exclude from the data set since it constitutes a rather permanent contribution.

3.2.2. SOC-Concentrations

The EC-tracer method revealed estimated SOC-concentrations between 0.44 µg∙m−3 and 1.33 µg∙m−3. Mean concentrations are predominantly higher in the BB-period reaching between 0.49 and 1.33 µg∙m−3 compared to 0.44 to 1.21 µg∙m−3 in the nonBB-period, which is between 11% and 21% and 15% up to 33% of OC, respectively. Emanating from higher biogenic SOC contributions in the warmer period, it must be supposed that SOC formed during biomass burning contributes quite strongly to SOA-formation in the BB-period, at least on single days affecting the mean value, as median values are rather higher in the nonBB-period. Lonati et al. [5] found higher SOC concentrations up to 6.1 µg∙m−3 in summer PM2.5 samples in Milan, which made up 84% of total OC. Cabada et al. [16] found SOC contributions to total OC of about 19% in summer PM2.5 samples in Pittsburgh.

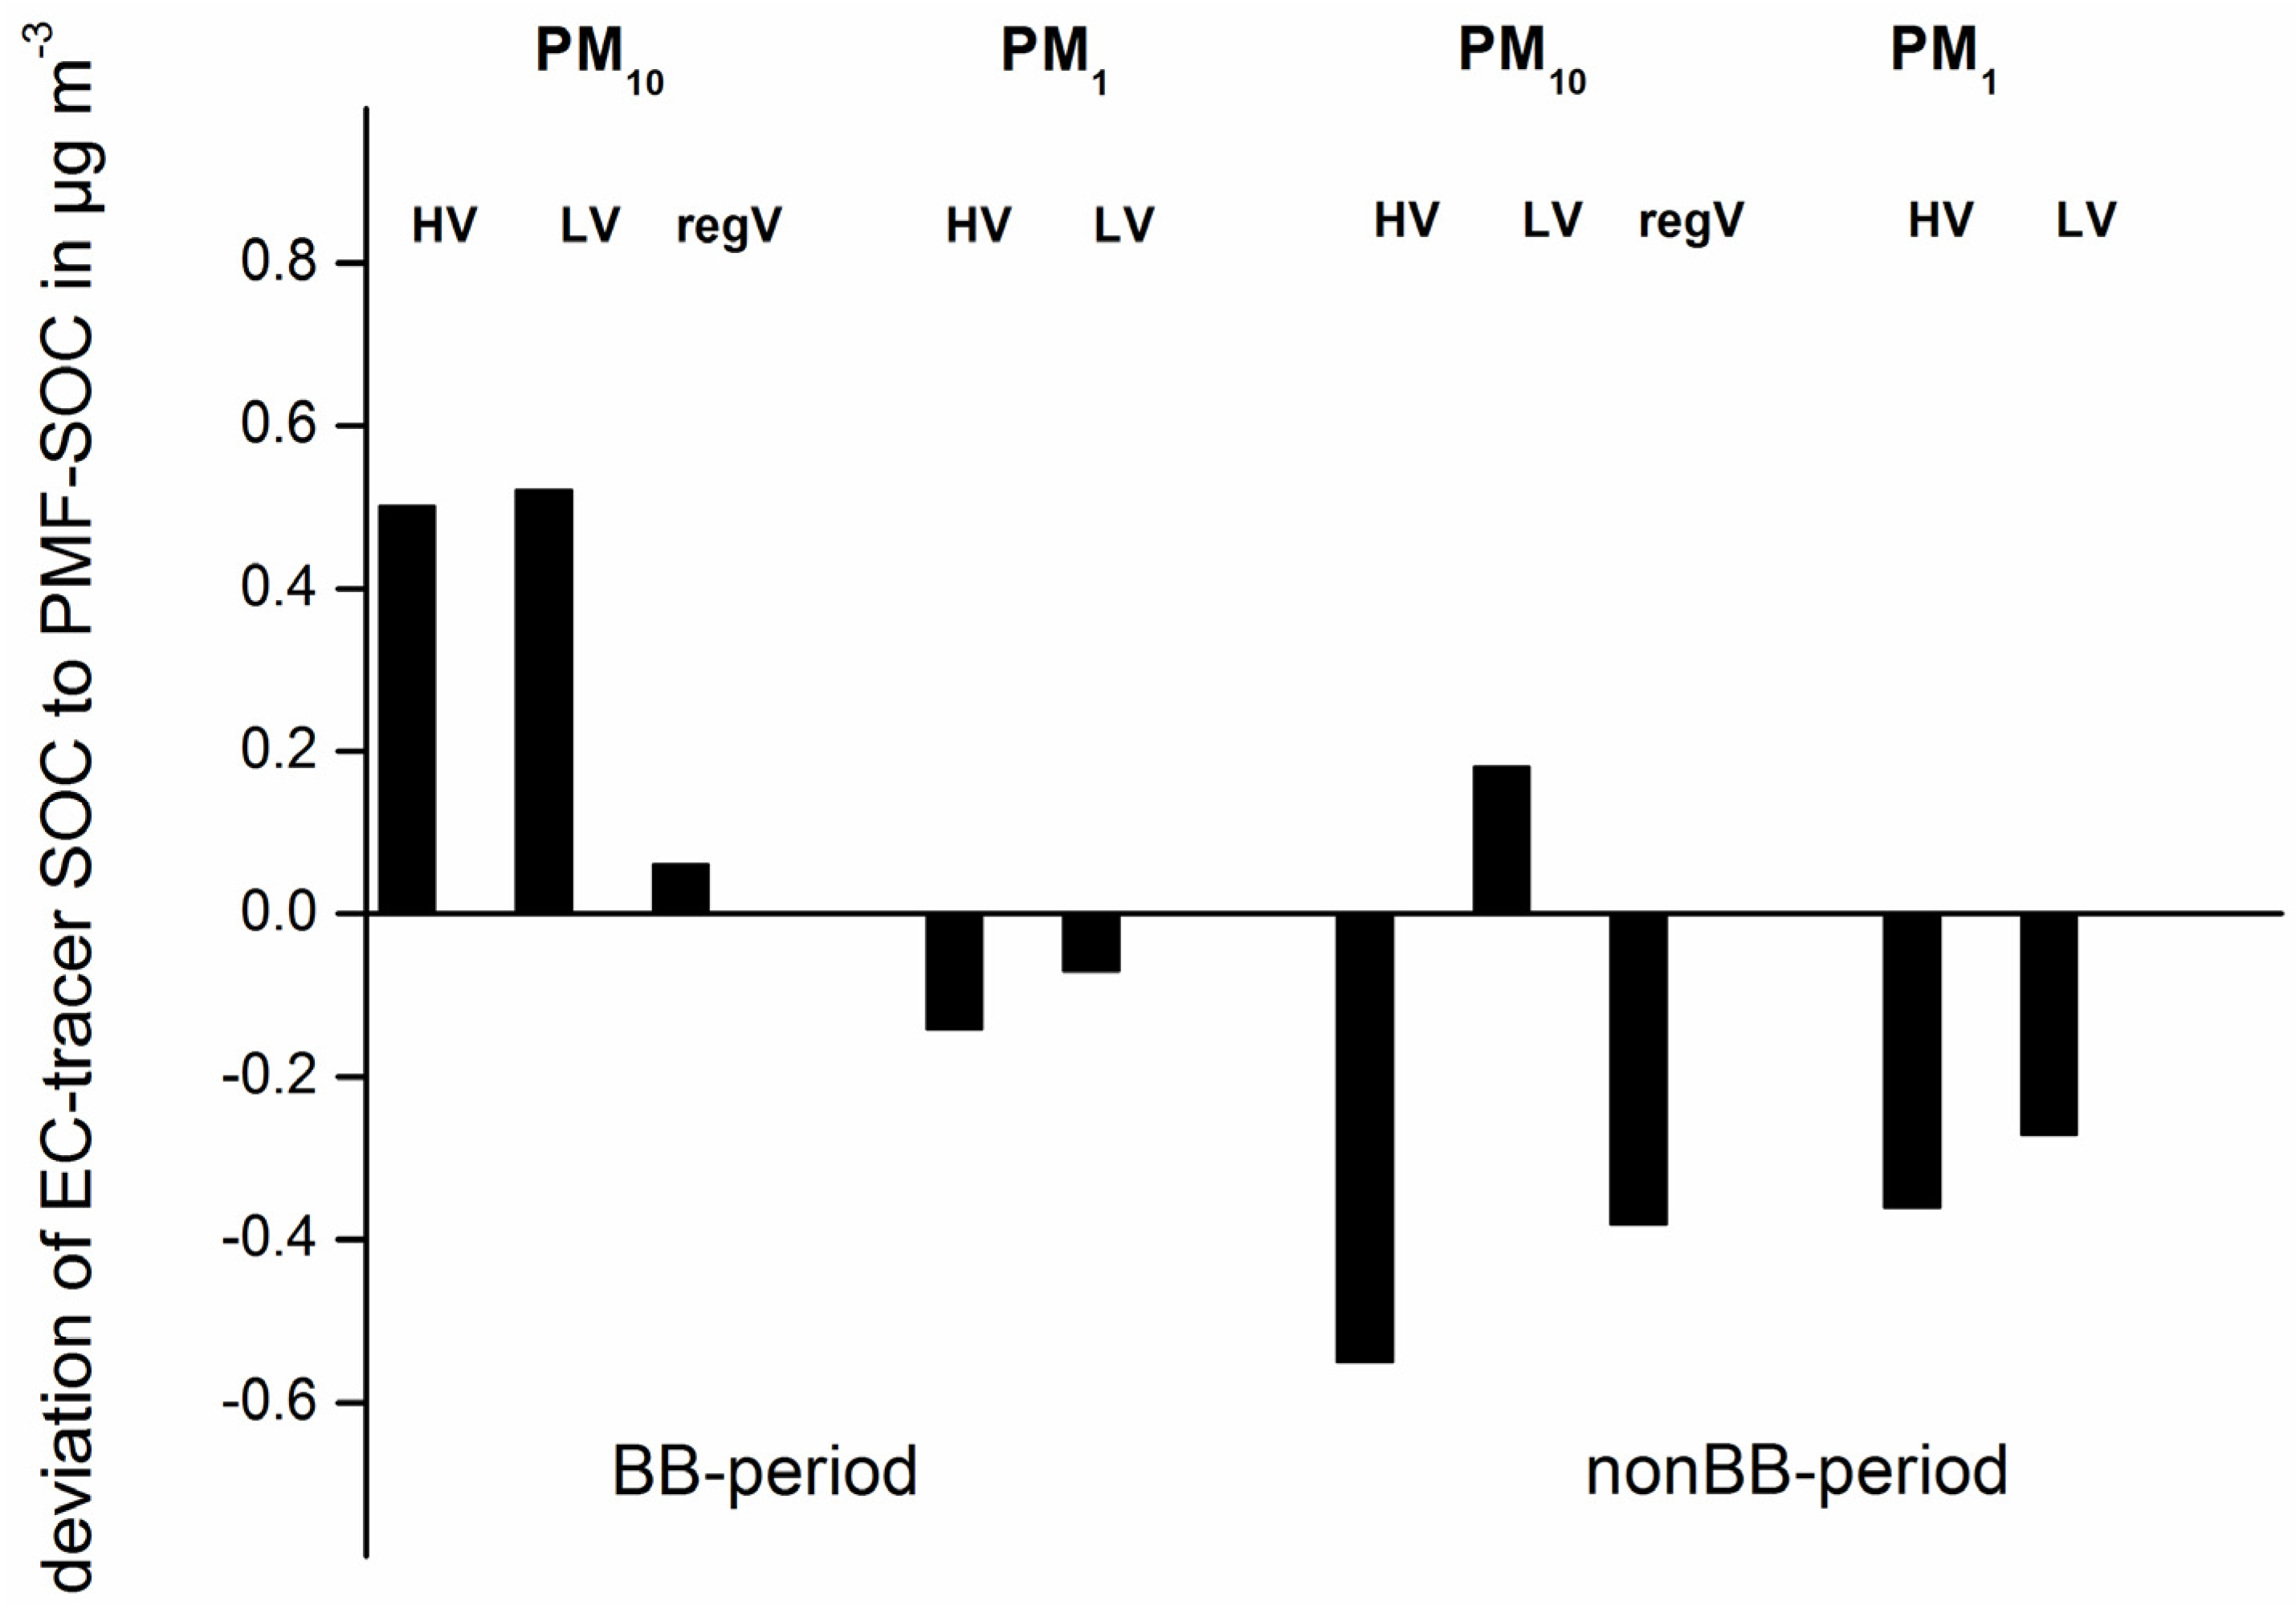
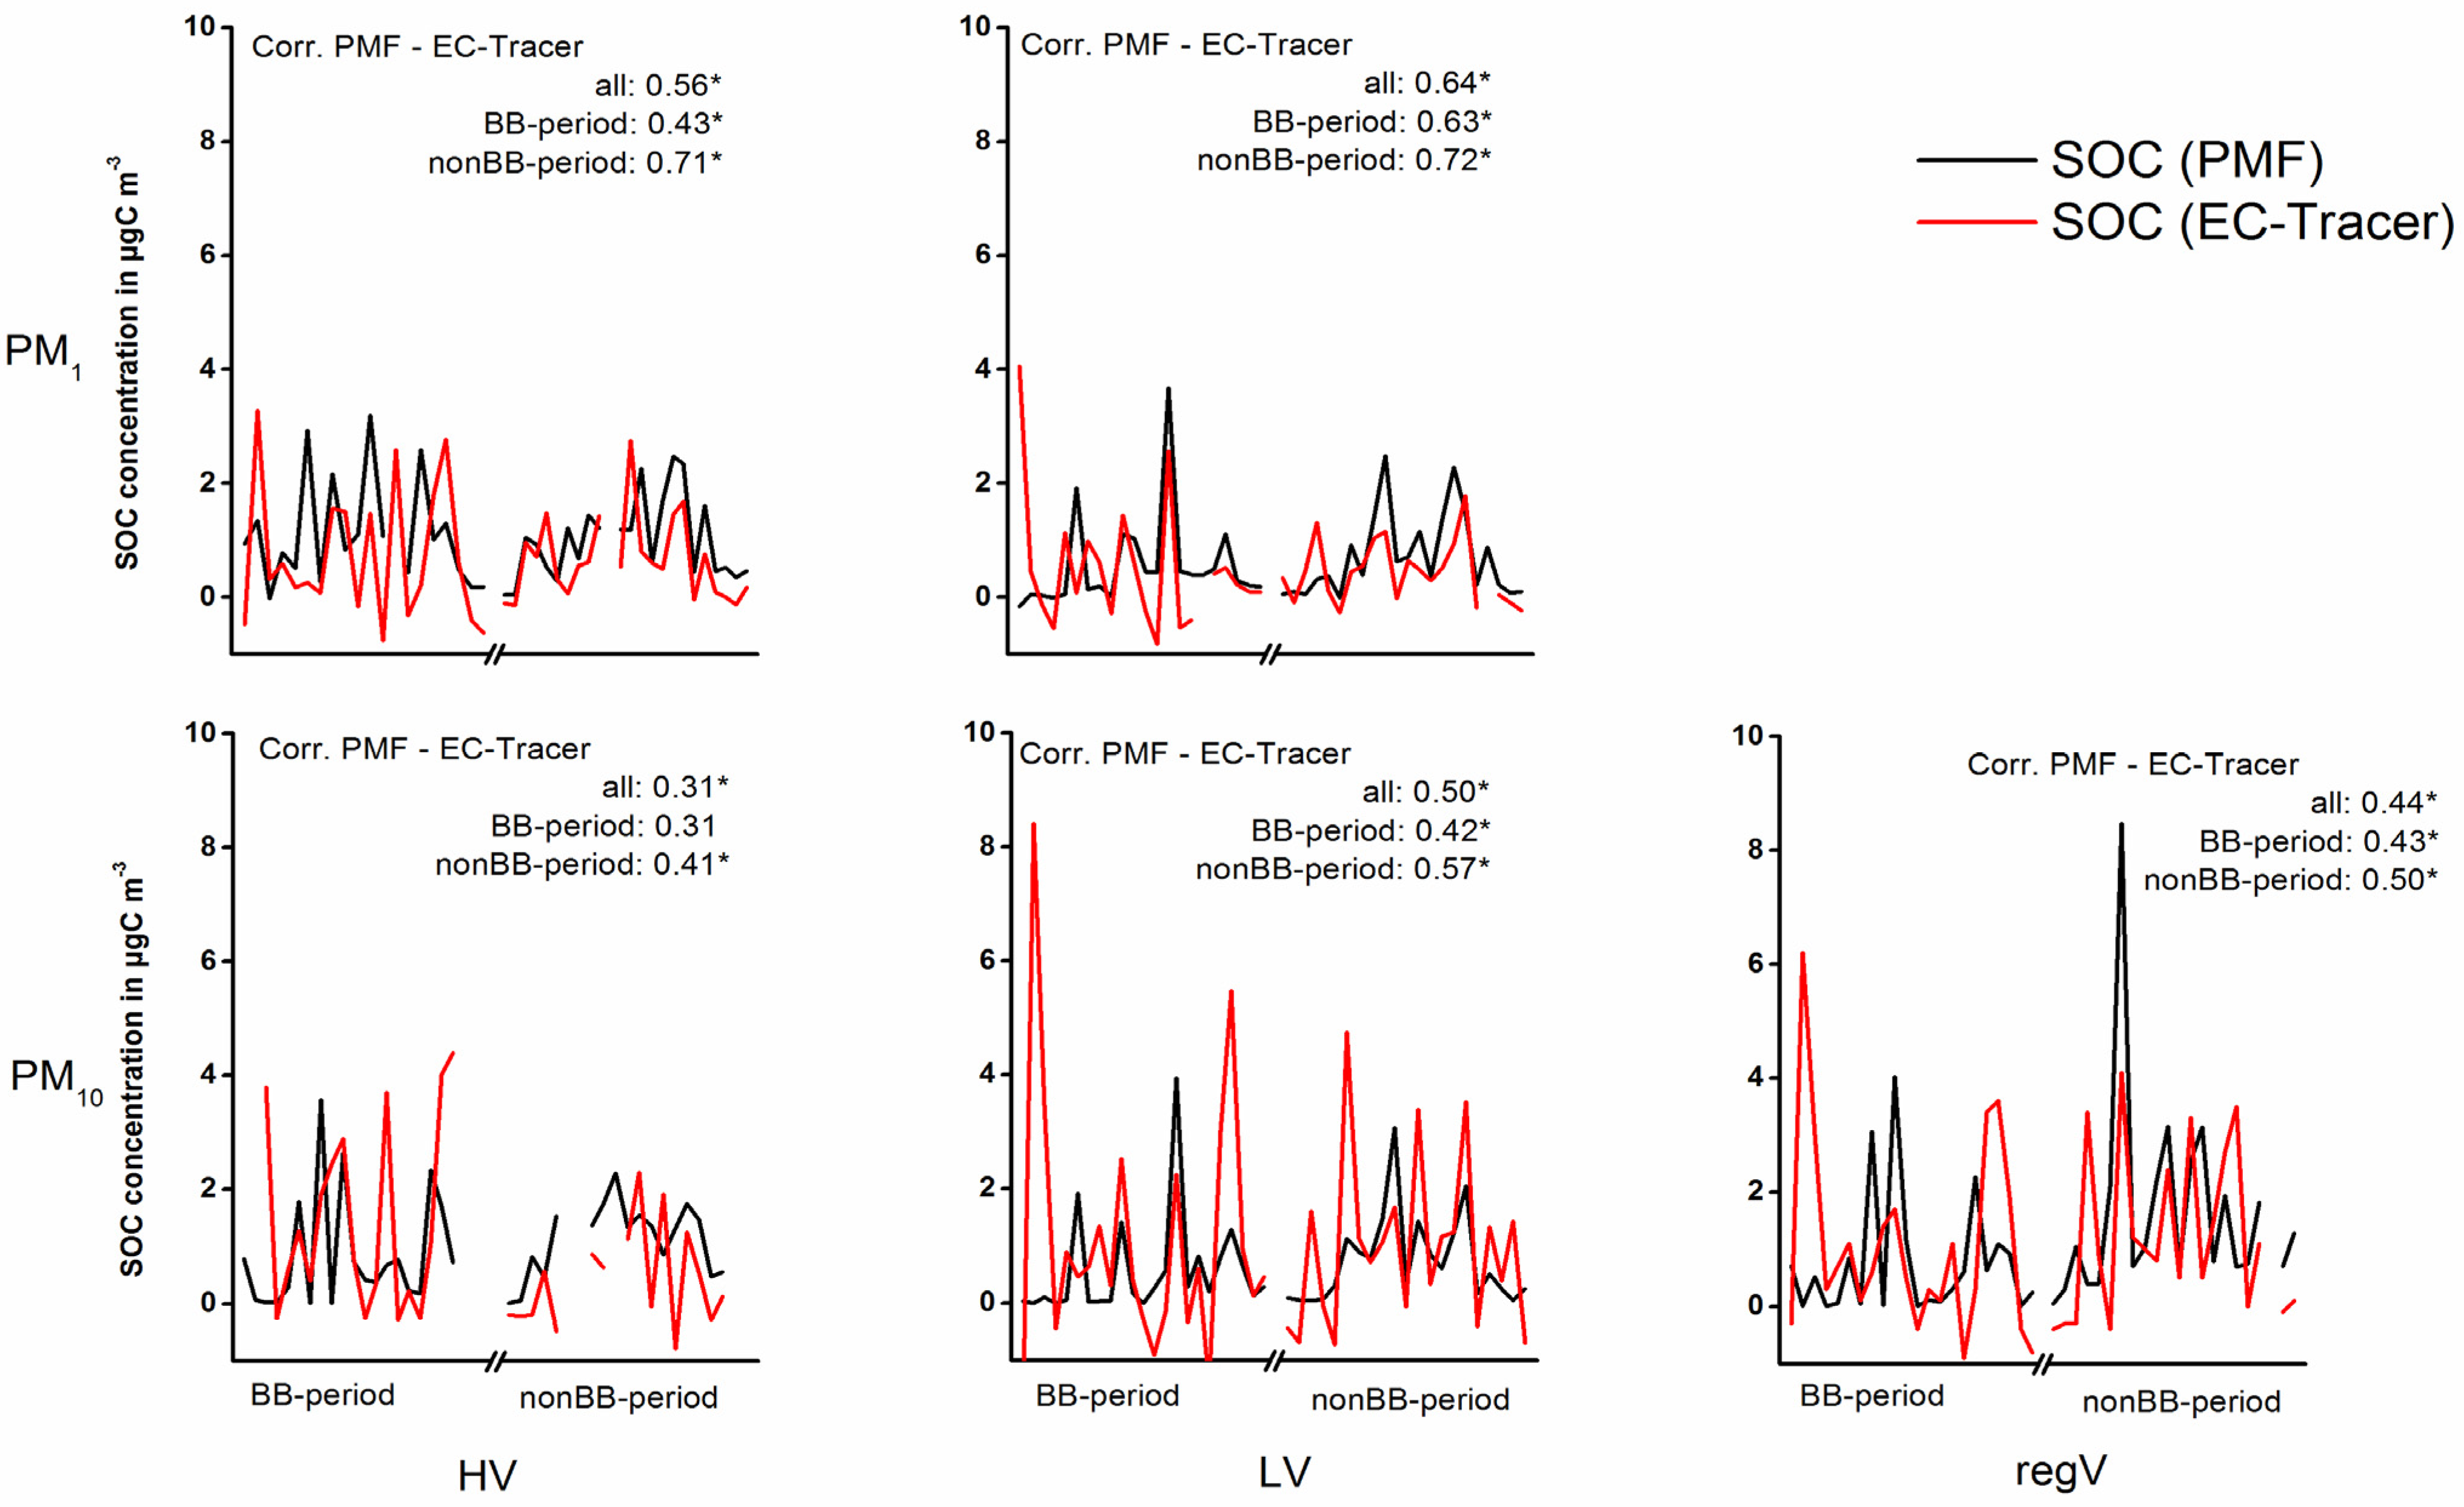
3.3. Comparison of SOC-Concentrations and Noncombustion OC between EC-Tracer and PMF

The application of the EC-tracer-method to the different sampling sites and periods is assessed on the basis of PMF-results (Table 3, Figure 3), which are subdivided into samples of high and low biomass burning emissions, according to EC-tracer-results. It has to be reminded that some of the OC in PMF analysis was unapportioned (approximately 0.5 µg∙m−3 at sites HV and regV, and −0.2 µg∙m−3 in the colder months at site LV), which must be considered to be in part secondary [14]. The results will be discussed station wise.
Figure 3. Deviation between EC-tracer and PMF results.
Atmosphere 05 00252 g003
Traffic station (site LV): At site LV in PM10, [OC/EC]p is higher in the BB-period than in the nonBB-period. SOC-concentrations of 1.12 µg∙m−3 almost double estimated PMF-concentrations of 0.6 µg∙m−3 in the BB-period. Even though events with no SOA concentration hardly exist (Figure 1), [OC/EC]p in the BB-period is so strongly influenced by combustion related OC/EC-ratios, that SOC-concentrations are still higher than derived with PMF, even though a contribution of anthropogenic SOC additional to PMF-concentrations has to be considered. For the nonBB-period, SOC concentrations are very well comparable between both methods. Figure 4 presents the correlations between the SOC-time series derived from both methods, confirming good comparability for the results, especially for those obtained in the nonBB-period. The intercept of BB-samples in PM10, representing the primary noncombustion OC given in µg∙m−3, appears quite high compared to POCbio, which is the representative fraction obtained with PMF (Table 3), and also compared to the nonBB-period. It can be supposed that it contains some of the biomass burning OC. For the nonBB-period, the intercept meets perfectly the concentrations calculated with PMF. In PM1, [OC/EC]p is also higher in the BB-period. In contrast to PM10, SOC-concentrations of 0.44 and 0.49 µgC∙m−3 are lower compared to PMF results. For the nonBB-period this can probably be explained by an overestimated intercept, most probably reflecting an integration of SOC, as in PM1, a contribution of noncombustion primary OC is expected to be low. This assumption is verified when taking the POCbio derived from PMF as reference.
Park (site HV): At site HV in PM10, [OC/EC]p is clearly lower in the BB-period compared with the nonBB-period. The BB-period shows higher SOC-concentrations estimated with EC-tracer compared to PMF (Figure 3), like observed for the LV site. However, considering an additional contribution of unapportioned OC for PMF concentrations, results are well comparable. The intercept corresponds very well with the POCbio calculated with PMF. In the nonBB-period, concentrations are lower with the EC-tracer method, which is due to a very high [OC/EC]p. These deviations become higher considering a potential contribution of unapportioned PMF-OC. The high [OC/EC]p ratio and the negative intercept indicate that primary OC from biogenic emissions may be included in [OC/EC]p, explaining the very high primary ratio compared to the literature, additionally to the already assumed anthropogenic SOA-uptake and remaining biogenic SOA. A contribution of noncombustion POC and anthropogenic SOC to [OC/EC]p would lead to higher primary OC and to lower SOC. Concerning the concentration deviations, site HV is better comparable with PMF results in the BB-period. Site HV is situated near a road which carries about 35,000 vehicles per working day (Senate Department for Urban Development and the Environment [42]). It is separated by a narrow tree population of deciduous trees, so in the BB-period, where trees have less leaves, the site is stronger exposed to traffic. Thus, the influence of primary biomass burning emissions and also of higher/direct traffic emissions lead to lower OC/EC ratios (Figure 2) and consequently to a lower [OC/EC]p. The lower fit between PMF and EC-tracer in the nonBB-period exceeding 100% deviation probably results from the low contribution of anthropogenic emissions and relatively high biogenic emissions during this time, dominating the ratios and determining the calculation of primary OC. In PM1, [OC/EC]p-ratios are similar in both periods and correspond to the usually observed ratios at other urban background places. The lower concentrations compared to PMF in the BB-period is therefore an effect of an overestimated intercept, as can be seen by comparison with POCbio from PMF-analysis. In the nonBB-period however, the noncombustion contribution corresponds well with PMF results and can not explain the differences. As seen for PM10, the deviation between PMF and EC-tracer are higher in the nonBB-period. Nevertheless, correlations of the concentrations obtained with EC-tracer and PMF for PM1 are significant, especially for the nonBB-period.
Figure 4. PMF- and EC-tracer-SOC and correlations between SOC derived with both methods (after Pearson). Time series are represented for the BB- and nonBB-period.
Atmosphere 05 00252 g004
Background station (site regV): At site regV, [OC/EC]p and the intercept are similar in both periods. In the BB-period, SOC-concentrations of 0.82 µg∙m−3 derived from EC-tracer match well with the 0.76 µg∙m−3 from PMF. As elucidated for site HV, a potential contribution of unapportioned OC to PMF results must additionally be considered. Estimations in the nonBB-period are slightly lower (1.21 to 1.59 µg∙m−3) and again unapportioned OC to PMF results must be considered. Site regV fits best of all stations between both models in the BB-period. Furthermore, fits in the nonBB-period between both methods are considerably better compared to site HV. The better fit is at first surprising, as biogenic, secondary as well as primary, concentrations are similar for site regV and HV, but traffic emissions are even slightly lower at site regV (Table 1 and Table 3). This is contrary to the earlier discussion that relatively high biogenic concentrations compared to anthropogenic concentrations additionally lead to underestimated SOC-concentrations like observed at site HV. One explanation could be the direct exposure to vegetation at site HV in the nonBB-period, which may lead to higher primary biogenic emissions. The proximity causes a lack of events with low primary biogenic emissions, whereas at the regV site, which is neither directly exposed to traffic nor to vegetation, the events used for calculations show lower total primary biogenic concentrations compared to site HV (red bars in Figure 5). Similar or even higher concentrations at site regV which lead to increased mean concentrations also at this site, rather occurred on days which were excluded from the calculations (green bars). In contrast, the direct vicinity of site HV to traffic in the BB-period, when vegetation stock is low and biomass burning emissions are similar at both sites, lead to lower OC/EC-ratios used for the calculations and may lead to lower calculated [OC/EC]p-ratios compared to site regV. These observations provide another aspect to the aforementioned discussion that the distance to traffic emissions have an influence on the calculation. An altered [OC/EC]p might not only be caused by different vehicle types, aged aerosol or a higher contribution of biogenic SOC and POC being included in events used for calculations at the non-traffic related sites, but also by a direct exposure to vegetation. The vicinity causes that OC/EC-ratios representing combustion-related ratios do not exist in vegetation periods at a vegetation-exposed site compared to a background site, were such events are also rare, but rather may occur.
However, even though [OC/EC]p is lower compared to site HV, it is still higher than observed in earlier studies. According to site HV it can be supposed that some of the noncombustion OC is still included in the [OC/EC]p-ratio, which might explain the lower intercepts at site regV compared to PMF POCbio in both seasons.
The observed tendencies distinguish that the EC-tracer-method provides well comparable results if sites are strongly influenced by one characteristic primary combustion source, whereas a mixture of biomass burning and traffic emissions as dominant anthropogenic sources but with deviating OC/EC-ratios may adversely affect the approach. At site LV, this refers to the nonBB-period, at least in PM10, where traffic is the only combustion source, compared to the BB-period, when biomass burning also plays a major role. At sites HV and regV, where traffic emissions are of minor importance, this refers to the BB-period, when biomass burning strongly influences and decreases the OC/EC-ratios. Furthermore, at sites which are directly exposed to vegetation, the application of EC-tracer seems to provide underestimated results. This refers above all to primary biogenic emissions, as this effect seems to be higher in the PM10-fraction compared to PM1, where primary emissions are low (PMF POCbio, Table 3).
Figure 5. Primary biogenic carbon (POCbio) for the HV and regV sites, separated by BB- and nonBB-period (obtained from PMF-analysis [14]).
Atmosphere 05 00252 g005
Note: The red bars indicate the events being used to calculate [OC/EC]p. Events with lower primary biogenic emissions rather occur in the nonBB-period and at site regV compared to site HV, leading to a lower [OC/EC]p. Similar or even higher concentrations at site regV only occurred on those days which were excluded from the calculations (green bars).

4. Summary and Conclusions

The EC-tracer method was applied to OC and EC PM10 and PM1 data of three different sampling sites in the City of Berlin, characterized by differing exposure to traffic and vegetation. The aim was to determine the SOC-contribution to total OC. Considering the difficulty to determine a representative [OC/EC]p-ratio, the first step was to select data sets collected under conditions of low SOA abundance using results of SOC compound analysis [22]. The second step was to calculate the [OC/EC]p-ratio considering spatial and seasonal variations. To compile a potential effect of the station characteristics on the determination of [OC/EC]p and SOC, estimations were conducted by calculating all data separated by stations. As an influence of biomass burning on the OC/EC-ratio could be stated, the EC-tracer method was additionally applied separated for periods with low and strong biomass burning emissions. To assess the results, comparisons with SOC-concentrations obtained with PMF from a prior study were performed. Uncertainties joining EC-tracer results derived especially from the fact that days with no SOA-emissions hardly exist, and that different combustion emissions characterized by different [OC/EC]p-ratios concur in the atmosphere. For PMF results it has to be reminded that a fraction was unapportioned which had in part to be considered as being secondary, probably leading to underestimated PMF-SOC. In the nonBB-period in PM10, SOC-concentrations obtained with PMF-results at the park exceeded EC-tracer concentrations more than 100%. At the background station deviations were observable, but lower compared to the park. The high deviations at the park were attributed to aged aerosol, the high ratio of biogenic to combustion emissions and to direct exposure to vegetation. When the biogenic contribution is relatively high and biogenic sources are close, OC/EC-ratios representing only combustion-related ratios hardly exist, leading to overestimated [OC/EC]p-ratios and thus to underestimated SOC-concentrations. This was stronger attributed to primary biogenic emissions than to remaining SOC being included in the ratio, as this effect was considerably higher in the PM10-fraction, where primary emissions are higher than in PM1. In the BB-period in PM10, EC-tracer-SOC exceeded PMF-SOC, but showed well fits for the park and especially for the background station. The intercept, representing the noncombustion OC, showed major deviations to POCbio, which is the representative fraction for noncombustion OC obtained with PMF. POCbio concentrations show no clear seasonal variation between BB- and nonBB-period, but a clear decreasing tendency from PM10 to PM1 concentrations. For EC-tracer results, noncombustion concentrations between periods as well as between PM fractions are inconsistent with no clear observable tendencies. Adverse effects on the application of the EC-tracer method can finally be attributed to (1) high and direct vegetation emissions, leading to overestimated [OC/EC]p-ratios and an underestimated intercept; and (2) to the occurrence of two major combustion emissions with different primary OC/EC ratios. This results in better comparable concentrations with PMF in the nonBB-period at the traffic site, and in the BB-period at the park. At the background station with no direct exposure to any sources, neither vegetation nor biomass burning significantly alter [OC/EC]p, and well comparable SOC results with PMF regarding the whole season are obtained. Nevertheless, the noncombustion fraction seems to be underestimated, and it cannot be excluded that some of this fraction is still included in the [OC/EC]p-ratio.
It can be concluded that the EC-tracer method partly provides very well comparable results with PMF-analysis, but it seems that a direct exposure to biogenic sources adversely influences the approach. It has to be stated that results presented here are based on 24 h-samples. Previous studies often used higher resolution samples [16,20] and suggested OC/EC ratios of samples collected in the early morning to be suitable for the determination of [OC/EC]p due to low radiation intensity and ozone concentrations, which prevent SOA-formation. It could be assumed that lower solar radiation also leads to lower emissions of primary biogenic aerosol. Thus, further studies shall investigate if high resolution data may lead to better fits also for vegetation-dominated sites.

Acknowledgments

This work was supported by the German Research Foundation (DFG) in the framework of RTG 780 Urban Ecology. The authors are thankful to the colleagues of the Institute for Environment and Sustainability of the EC Joint Research Center in Ispra, Italy, for the opportunity to perform OC/EC analysis in their labs and especially Kevin Douglas for support during measurements.

Author Contributions

The corresponding author conducted the literature search, developed the study design in agreement with Marcel Langner and collected all relevant data. The corresponding author performed the EC-tracer- and PMF-analysis and all other statistical methods and predominantly analysed and interpreted the data. The corresponding author wrote the manuscript. Marcel Langner, Ute Hansen and Wilfried Endlicher created the first ideas of the work and laid the foundation for the project. They discussed the findings and interpretations, critically reviewed the manuscript, gave hints for improvement and advised the whole process. Heinz-Joern Moriske discussed the findings and interpretations, critically reviewed the manuscript, gave useful ideas to improve the manuscript and advised the whole process.

Conflicts of Interest

The authors declare no conflict of interest.

References

  1. Ramanathan, V.; Crutzen, P.J.; Kiehl, J.T.; Rosenfeld, D. Aerosols, climate, and the hydrological cycle. Science 2001, 294, 2119–2124. [Google Scholar] [CrossRef]
  2. Facchini, M.C.; Mircea, M.; Fuzzi, S.; Charlson, R.J. Cloud albedo enhancement by surface-active organic solutes in growing droplets. Nature 1999, 401, 257–259. [Google Scholar] [CrossRef]
  3. Pope, C.A.; Burnett, R.T.; Thurston, G.D.; Thun, M.J.; Calle, E.E.; Krewski, D.; Godleski, J.J. Cardiovascular mortality and long-term exposure to particulate air pollution—Epidemiological evidence of general pathophysiological pathways of disease. Circulation 2004, 109, 71–77. [Google Scholar]
  4. Ruckerl, R.; Schneider, A.; Breitner, S.; Cyrys, J.; Peters, A. Health effects of particulate air pollution: A review of epidemiological evidence. Inhal. Toxicol. 2011, 23, 555–592. [Google Scholar] [CrossRef]
  5. Lonati, G.; Ozgen, S.; Giugliano, M. Primary and secondary carbonaceous species in PM2.5 samples in Milan (Italy). Atmos. Environ. 2007, 41, 4599–4610. [Google Scholar] [CrossRef]
  6. Kim, B.M.; Teffera, S.; Zeldin, M.D. Characterization of PM2.5 and PM10 in the south coast air basin of southern California: Part 1—Spatial variations. J. Air Waste Manag. 2000, 50, 2034–2044. [Google Scholar] [CrossRef]
  7. Lee, H.S.; Kang, B.W. Chemical characteristics of principal PM2.5 species in Chongju, South Korea. Atmos. Environ. 2001, 35, 739–746. [Google Scholar] [CrossRef]
  8. Yang, F.M.; He, K.B.; Ma, Y.L.; Zhang, Q.; Cadle, S.H.; Chan, T.; Mulawa, P.A. Characterization of carbonaceous species of ambient PM2.5 in Beijing, China. J. Air Waste Manag. 2005, 55, 984–992. [Google Scholar] [CrossRef]
  9. Ye, B.M.; Ji, X.L.; Yang, H.Z.; Yao, X.H.; Chan, C.K.; Cadle, S.H.; Chan, T.; Mulawa, P.A. Concentration and chemical composition of PM2.5 in Shanghai for a 1-year period. Atmos. Environ. 2003, 37, 499–510. [Google Scholar] [CrossRef]
  10. Seinfeld, J.H.; Pandis, S.N. Atmospheric Chemistry and Physics, 2nd ed.; John Wiley & Sons: New York, NY, USA, 2006. [Google Scholar]
  11. Tsigaridis, K.; Kanakidou, M. Global modelling of secondary organic aerosol in the troposphere: A sensitivity analysis. Atmos. Chem. Phys. 2003, 3, 1849–1869. [Google Scholar] [CrossRef]
  12. Paatero, P.; Tapper, U. Positive matrix factorization: A non-negative factor model with optimal utilization of error estimates of data values. Environmetrics 1994, 5, 111–126. [Google Scholar] [CrossRef]
  13. Hu, D.; Bian, Q.J.; Lau, A.K.H.; Yu, J.Z. Source apportioning of primary and secondary organic carbon in summer PM2.5 in Hong Kong using positive matrix factorization of secondary and primary organic tracer data. J. Geophys. Res. Atmos. 2010. [Google Scholar] [CrossRef]
  14. Wagener, S.; Langner, M.; Hansen, U.; Moriske, H.-J.; Endlicher, W. Source apportionment of organic compounds in Berlin using positive matrix factorization—Assessing the impact of biogenic aerosol and biomass burning on urban particulate matter. Sci. Total Environ. 2012, 435–436, 392–401. [Google Scholar]
  15. Zhang, Y.; Sheesley, R.J.; Schauer, J.J.; Lewandowski, M.; Jaoui, M.; Offenberg, J.H.; Kleindienst, T.E.; Edney, E.O. Source apportionment of primary and secondary organic aerosols using positive matrix factorization (PMF) of molecular markers. Atmos. Environ. 2009, 43, 5567–5574. [Google Scholar] [CrossRef]
  16. Cabada, J.C.; Pandis, S.N.; Subramanian, R.; Robinson, A.L.; Polidori, A.; Turpin, B. Estimating the secondary organic aerosol contribution to PM2.5 using the EC tracer method. Aerosol. Sci. Technol. 2004, 38, 140–155. [Google Scholar]
  17. Turpin, B.J.; Huntzicker, J.J. Identification of secondary organic aerosol episodes and quantitation of primary and secondary organic aerosol concentrations during scaqs. Atmos. Environ. 1995, 29, 3527–3544. [Google Scholar] [CrossRef]
  18. Yuan, Z.B.; Yu, J.Z.; Lau, A.K.H.; Louie, P.K.K.; Fung, J.C.H. Application of positive matrix factorization in estimating aerosol secondary organic carbon in Hong Kong and its relationship with secondary sulfate. Atmos. Chem. Phys. 2006, 6, 25–34. [Google Scholar] [CrossRef]
  19. Strader, R.; Lurmann, F.; Pandis, S.N. Evaluation of secondary organic aerosol formation in winter. Atmos. Environ. 1999, 33, 4849–4863. [Google Scholar] [CrossRef]
  20. Seguel, R.; Morales, R.G.E.; Leiva, M.A. Estimations of primary and secondary organic carbon formation in PM2.5 aerosols of Santiago City, Chile. Atmos. Environ. 2009, 43, 2125–2131. [Google Scholar] [CrossRef]
  21. Pio, C.; Cerqueira, M.; Harrison, R.M.; Nunes, T.; Mirante, F.; Alves, C.; Oliveira, C.; de la Campa, A.S.; Artinano, B.; Matos, M. OC/EC ratio observations in Europe: Re-thinking the approach for apportionment between primary and secondary organic carbon. Atmos. Environ. 2011, 45, 6121–6132. [Google Scholar] [CrossRef]
  22. Wagener, S.; Langner, M.; Hansen, U.; Moriske, H.-J.; Endlicher, W.R. Spatial and seasonal variations of biogenic tracer compounds in ambient PM10 and PM1 samples in Berlin, Germany. Atmos. Environ. 2012, 47, 33–42. [Google Scholar] [CrossRef]
  23. Niosh, Elemental Carbon (Diesel Particulate): Method 5040. In NIOSH Manual of Analytical Methods, 4th ed. (1st Supplement), Eller, P.M.; Cassinelli, M.E. (Eds.) National Institute for Occupational Safety and Health: Cincinatti, OH, USA, 1996. Available online: http://www.cdc.gov/niosh/docs/2003-154/pdfs/5040f3.pdf (accessed on 15 April 2012).
  24. Cavalli, F.; Viana, M.; Yttri, K.E.; Genberg, J.; Putaud, J.P. Toward a standardised thermal-optical protocol for measuring atmospheric organic and elemental carbon: The EUSAAR protocol. Atmos. Meas. Tech. 2010, 3, 79–89. [Google Scholar] [CrossRef] [Green Version]
  25. Turpin, B.J.; Huntzicker, J.J. Secondary formation of organic aerosol in the los-angeles basin—A descriptive analysis of organic and elemental carbon concentrations. Atmos. Environ. Part AGen. Top. 1991, 25, 207–215. [Google Scholar] [CrossRef]
  26. Jordan, T.B.; Seen, A.J.; Jacobsen, G.E. Levoglucosan as an atmospheric tracer for woodsmoke. Atmos. Environ. 2006, 40, 5316–5321. [Google Scholar] [CrossRef]
  27. Yan, B.; Zheng, M.; Hu, Y.T.; Ding, X.; Sullivan, A.P.; Weber, R.J.; Baek, J.; Edgerton, E.S.; Russell, A.G. Roadside, urban, and rural comparison of primary and secondary organic molecular markers in Ambient PM(2.5). Environ. Sci. Technol. 2009, 43, 4287–4293. [Google Scholar] [CrossRef]
  28. Park, S.S.; Bae, M.S.; Schauer, J.J.; Ryu, S.Y.; Kim, Y.J.; Cho, S.Y.; Kim, S.J. Evaluation of the TMO and TOT methods for OC and EC measurements and their characteristics in PM2.5 at an urban site of Korea during ACE-Asia. Atmos. Environ. 2005, 39, 5101–5112. [Google Scholar] [CrossRef]
  29. Lim, H.J.; Turpin, B.J. Origins of primary and secondary organic aerosol in Atlanta: Results of time-resolved measurements during the Atlanta supersite experiment. Environ. Sci. Technol. 2002, 36, 4489–4496. [Google Scholar] [CrossRef]
  30. Turpin, B.J.; Huntzicker, J.J.; Larson, S.M.; Cass, G.R. Los-Angeles summer midday particulate carbon—primary and secondary aerosol. Environ. Sci. Technol. 1991, 25, 1788–1793. [Google Scholar] [CrossRef]
  31. Castro, L.M.; Pio, C.A.; Harrison, R.M.; Smith, D.J.T. Carbonaceous aerosol in urban and rural European atmospheres: Estimation of secondary organic carbon concentrations. Atmos. Environ. 1999, 33, 2771–2781. [Google Scholar] [CrossRef]
  32. Castanho, A.D.A.; Artaxo, P. Wintertime and summertime Sao Paulo aerosol source apportionment study. Atmos. Environ. 2001, 35, 4889–4902. [Google Scholar] [CrossRef]
  33. He, K.B.; Yang, F.M.; Ma, Y.L.; Zhang, Q.; Yao, X.H.; Chan, C.K.; Cadle, S.H.; Chan, T.; Mulawa, P.A. The characteristics of PM2.5 in Beijing, China. Atmos. Environ. 2001, 35, 4959–4970. [Google Scholar] [CrossRef]
  34. Na, K.S.; Sawant, A.A.; Song, C.; Cocker, D.R. Primary and secondary carbonaceous species in the atmosphere of western riverside county, California. Atmos. Environ. 2004, 38, 1345–1355. [Google Scholar] [CrossRef]
  35. Gelencser, A.; May, B.; Simpson, D.; Sanchez-Ochoa, A.; Kasper-Giebl, A.; Puxbaum, H.; Caseiro, A.; Pio, C.; Legrand, M. Source apportionment of PM2.5 organic aerosol over Europe: Primary/secondary, natural/anthropogenic, and fossil/biogenic origin. J. Geophys. Res.: Atmos. 2007. [Google Scholar] [CrossRef]
  36. Fine, P.M.; Cass, G.R.; Simoneit, B.R.T. Chemical characterization of fine particle emissions from the wood stove combustion of prevalent United States tree species. Environ. Eng. Sci. 2004, 21, 705–721. [Google Scholar] [CrossRef]
  37. Plaza, J.; Gomez-Moreno, F.J.; Nunez, L.; Pujadas, M.; Artinano, B. Estimation of secondary organic aerosol formation from semicontinuous OC-EC measurements in a Madrid suburban area. Atmos. Environ. 2006, 40, 1134–1147. [Google Scholar] [CrossRef]
  38. Keywood, M.; Guyes, H.; Selleck, P.; Gillett, R. Quantification of secondary organic aerosol in an Australian urban location. Environ. Chem. 2011, 8, 115–126. [Google Scholar] [CrossRef]
  39. Robert, M.A.; Kleeman, M.J.; Jakober, C.A. Size and composition distributions of particulate matter emissions: Part 2—Heavy-duty diesel vehicles. J. Air Waste Manag. 2007, 57, 1429–1438. [Google Scholar] [CrossRef]
  40. Robert, M.A.; VanBergen, S.; Kleeman, M.J.; Jakober, C.A. Size and composition distributions of particulate matter emissions: Part 1—Light-duty gasoline vehicles. J. Air Waste Manag. 2007, 57, 1414–1428. [Google Scholar] [CrossRef]
  41. Tritscher, T.; Juranyi, Z.; Martin, M.; Chirico, R.; Gysel, M.; Heringa, M.F.; DeCarlo, P.F.; Sierau, B.; Prevot, A.S.H.; Weingartner, E.; et al. Changes of hygroscopicity and morphology during ageing of diesel soot. Environ. Res. Lett. 2011, 6. [Google Scholar]
  42. Senate Department for Urban Development and the Environment, 2010. Available online: http://fbinter.stadt-berlin.de/fb/index.jsp?loginkey=showAreaSelection%20&mapId=k07_01verkmeng2005@senstadt&areaSelection=address (accessed on 20 March 2011).

Appendix

Figure A1, Figure A2, Figure A3, Figure A4 and Figure A5 present the OC concentrations in relation to EC concentrations, separated by periods with high and low biomass burning concentrations, by stations and by PM-fraction. The red boxes present the data with lowest SOA-events which were finally used for the calculation of [OC/EC]p. The [OC/EC]p-ratio is given by the slope, the intercept represents the noncombustion contribution.
Data on biogenic SOA were used to differentiate between events with high or low SOA-contribution. Days with SOA-concentrations higher than given in the table were deleted from the data pool to determine an [OC/EC]p-ratio. This table (Table A1), and also Figure 1 point out that events of no SOA-concentrations hardly occur, preventing a complete exclusion of SOA and presenting a critical step in the calculation of [OC/EC]p.
Table A1. Conditions for including samples for the calculation of [OC/EC]p-ratio.
PM10PM1
HVLVregVHVLV
BB-periodSOA < 10SOA < 5SOA < 10SOA < 6
SOA < 7
Non-BB-periodSOA < 12SOA < 7SOA < 17
Note: SOA is given as the sum of the α-pinene marker and the isoprene marker concentrations (ng∙m−3) determined in a previous study [22].
Figure A1. Evaluation of [OC/EC]p at site HV, PM10.
Atmosphere 05 00252 g006
Note: Red boxes present the data included for calculation.
Figure A2. Evaluation of [OC/EC]p at site HV, PM1.
Atmosphere 05 00252 g007
Figure A3. Evaluation of [OC/EC]p at site LV, PM10.
Atmosphere 05 00252 g008
Figure A4. Evaluation of [OC/EC]p at site LV, PM1.
Atmosphere 05 00252 g009
Figure A5. Evaluation of [OC/EC]p at site regV, PM10.
Atmosphere 05 00252 g010

