Article

Palmitic Acid on Salt Subphases and in Mixed Monolayers of Cerebrosides: Application to Atmospheric Aerosol Chemistry

Department of Chemistry and Biochemistry, The Ohio State University, 100 West 18th Ave, Columbus, OH 43210, USA
*
Author to whom correspondence should be addressed.
Atmosphere 2013, 4(4), 315-336; https://doi.org/10.3390/atmos4040315
Submission received: 1 July 2013 / Revised: 24 September 2013 / Accepted: 26 September 2013 / Published: 10 October 2013
(This article belongs to the Special Issue Atmospheric Surfactants and Humic-like Substances)

Abstract

:
Palmitic acid (PA) has been found to be a major constituent in marine aerosols, and is commonly used to investigate organic containing atmospheric aerosols, and is therefore used here as a proxy system. Surface pressure-area isotherms (π-A), Brewster angle microscopy (BAM), and vibrational sum frequency generation (VSFG) were used to observe a PA monolayer during film compression on subphases of ultrapure water, CaCl2 and MgCl2 aqueous solutions, and artificial seawater (ASW). π-A isotherms indicate that salt subphases alter the phase behavior of PA, and BAM further reveals that a condensation of the monolayer occurs when compared to pure water. VSFG spectra and BAM images show that Mg2+ and Ca2+ induce ordering of the PA acyl chains, and it was determined that the interaction of Mg2+ with the monolayer is weaker than Ca2+. π-A isotherms and BAM were also used to monitor mixed monolayers of PA and cerebroside, a simple glycolipid. Results reveal that PA also has a condensing effect on the cerebroside monolayer. Thermodynamic analysis indicates that attractive interactions between the two components exist; this may be due to hydrogen bonding of the galactose and carbonyl headgroups. BAM images of the collapse structures show that mixed monolayers of PA and cerebroside are miscible at all surface pressures. These results suggest that the surface morphology of organic-coated aerosols is influenced by the chemical composition of the aqueous core and the organic film itself.

1. Introduction

Marine aerosols are ubiquitous in the troposphere and are known to play an important role in regulation of the Earth’s climate [1]. Marine aerosols can be derived from both primary and secondary sources. Formation of primary marine aerosols results from sea spray [2]. Sea salts and organic compounds are the main components of these aerosols, with organics being the more abundant constituent [3,4]. The concentration of organic components in aerosols depend upon the seasonality of biological productivity from ocean waters and results in particulates with markedly different physical and chemical properties, such as differing size distribution and light scattering coefficients [5,6]. Chemical composition plays an important role in determining the morphological [7,8], optical [9,10], and chemical properties [11,12] of the aerosols. For instance, chemical composition affects the aerosol’s ability to act as a cloud condensation nuclei [13,14], or its efficiency at scattering light [15].
The organic composition of aerosols has been shown to be highly variable [16], but several different chemical species including alkanes [17,18], alcohols [19], polycyclic aromatic hydrocarbons (PAHs) [20], sterols [21], free fatty acids (FFAs) [22,23,24], and carbohydrates [25] have been detected. Of these species FFAs are commonly identified. The chain length of these molecules is typically between 12 and 18 carbons, with palmitic acid (PA), a saturated 16 carbon chain, being the most abundant. Unsaturated FAs are also common, as studies have shown that oleic acid (18:1) is a major constituent of marine aerosols. Field studies have further revealed that these molecules partition to the air-water interface, forming an organic coating [26,27]. Aqueous aerosols with an organic coating have been proposed to have an inverted micelle structure, in which the aqueous core is encased by a layer of insoluble organic lipids [2,28,29]. As the organic coating acts as a barrier between the aerosol and its environment, its chemical composition is ultimately responsible for the physical and chemical properties of the aerosol. For example, surface morphology of an aerosol is dependent upon the nature of the organic film, as soluble and insoluble surfactants form expanded and close-packed films, respectively [29,30]. Packing of the surface film affects uptake and evaporation of the water, which can then alter other properties of the aerosol [10,12]. The outer film of an aerosol, however, is not limited to one component and contains a complex mixture of organics. Therefore it is likely that the morphology of the surface film is dependent upon the chemical composition of the organic film. However, the chemical composition of the aqueous core of the inverted micelle aerosol will also play an important role.
Several studies have shown that the replacement of a pure water subphase with inorganic salt solutions causes alterations in the phase behavior of the monolayer, especially for FAs and phospholipids [31,32,33,34,35,36,37]. The effect of Ca2+ has been widely investigated due to its relevance in biological membranes [38,39,40,41]. Imaging techniques such as Brewster angle microscopy (BAM) and fluorescence microscopy have shown that introduction of salts into the aqueous subphase results in different surface morphologies compared to pure water subphases [42,43]. Furthermore, spectroscopic studies indicate that ions slightly influence the orientation of alkyl chains, but more so the hydration and dehydration of polar headgroups [40,41]. These properties of marine aerosols may be affected by the chemical composition pertaining to ions in the aqueous core.
It is well known that many of the organics found in marine aerosols derive from biogenic sources [44], in which hydrophobic cellular components rise to the ocean surface upon marine organism death and decomposition, and are then transferred to aerosol droplets during sea spray production. Cerebrosides, a type of glycosphingolipid, are a typical component of membranes in marine organisms [45], but, to our knowledge, have yet to be detected on the ocean surface microlayer or in marine aerosols. However, recent studies have revealed that lipopolysaccharides are found within the ocean surface microlayer [46] and in atmospheric aerosols, where the majority of organic content in aerosol particles is composed of polysaccharides or sugar-like lipids (glycolipids) [25,47,48], and that these species are more abundant in the water insoluble fraction [49]. Cerebrosides are the simplest water insoluble lipids with a saccharide group. These molecules are especially important in E. huxleyi, a type of coccolithophore, that forms abundant algal blooms [50]. In recent years, large numbers of these algal blooms have deceased prematurely. It was determined that the virus EhV-86 in conjunction with its host, E. huxleyi, produce a cerebroside whose introduction causes cell apoptosis [51,52]. While it is not known if cerebrosides become incorporated into marine aerosols, these molecules can serve as a proxy for more complex glycolipids. Investigation of cerebrosides at an aqueous surface may provide information in understanding how glycosylated lipids affect aerosol properties.
In this study Langmuir films are used as a laboratory model for atmospheric aerosols. Due to the complex composition of aerosols, salt subphases and mixed films better represent an organic-coated aerosol. Mg2+, Ca2+, and Cl ions are abundant in natural seawater [53,54], and are used as a simplified version of seawater. Artificial seawater (ASW) was also employed to better mimic the complex nature of ocean water. Lipid molecules chosen for this study were based on their atmospheric relevance. PA is one of the most abundant long chain FAs in marine aerosols, and cerebrosides represent a simple glycosphingolipid. Films of PA, cerebrosides, and mixtures are studied using a Langmuir trough in conjunction with BAM. Further investigation of PA films on various subphases is done using VSFG spectroscopy.

2. Experimental Section
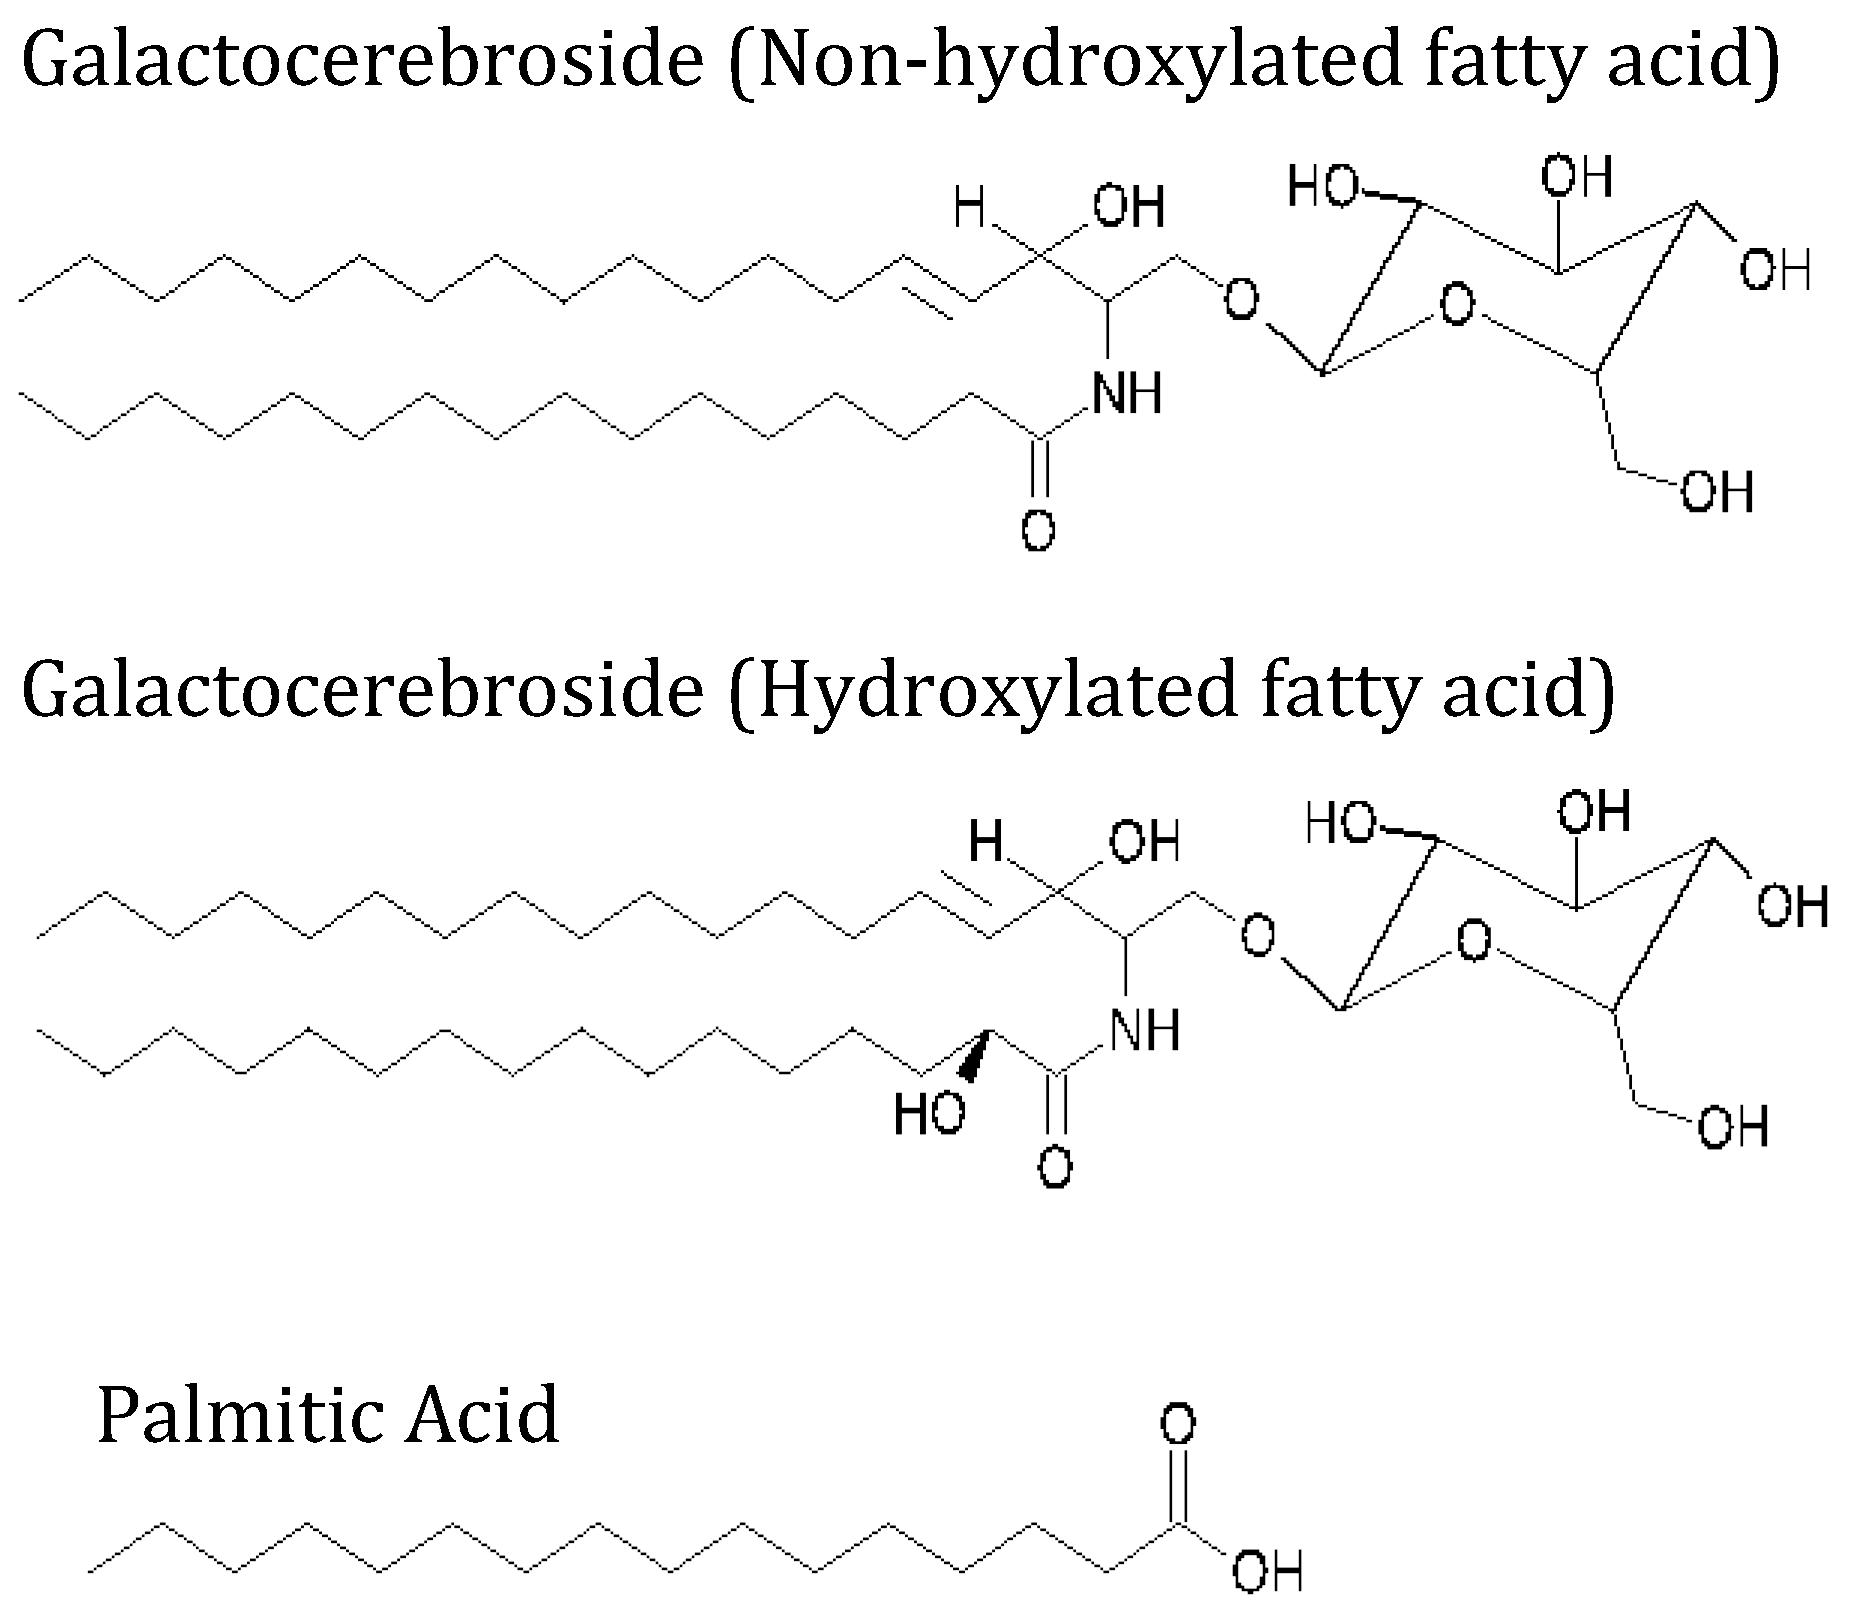
2.1. Materials

All solvents and lipid reagents were used without further purification. PA with a purity of 99% was obtained from Sigma-Aldrich and then dissolved in chloroform (HPLC grade, Fisher Scientific). Porcine galactocerebrosides were purchased from Avanti Polar Lipids and are composed of a mixture of non-hydroxylated FA (NFA) and hydroxylated FA (HFA) acyl chains (Figure 1). NFA chains were more abundant, making up approximately 58% of total cerebrosides and were composed of palmitoyl (16:0), stearoyl (18:0), arachidoyl (20:0), behenoyl (22:0), lignoceroyl (24:0) and nervonoyl (24:1) chains. Numbers in parenthesis represent the FA carbon chain length and the degree of unsaturation in the chain. The specific composition of the HFA chains was not provided. Solutions of cerebrosides were prepared by dissolution in a 1:1 (v/v) mixture of chloroform and methanol (HPLC grade, Fisher Scientific). ACS certified grade CaCl2 and MgCl2 salts with purities >99% were purchased from Fisher Scientific. Synthetic sea salt (Instant Ocean®) was purchased commercially. Chemical composition and ion concentration in the synthetic sea salt can be found in Table 1. Stock solutions of aqueous salts were prepared by dissolution in ultrapure water with a resistivity of 18.0 MΩ cm (Barnstead Nanopure filtration system, model D4741, Thermolyne Corporation, Dubuque, IA, USA) and a measured pH of 5.6. CaCl2 and MgCl2 salt solutions were filtered twice using activated carbon filters (Whatman Carbon-Cap 75, Fisher Scientific, Pittsburgh, PA, USA) to remove any organic contaminants. The concentration of these solutions was then standardized by the Mohr titration technique [55], and serial dilution was used to prepare 0.1 and 0.3 M solutions. The pH of the diluted CaCl2 and MgCl2 solutions were 5.1 and 5.4, respectively. The ASW solution was prepared to a concentration of 0.6 M and had a measured pH of 8.2, a value representative of the ocean. Lipid monolayers were either prepared on ultrapure water or on aqueous solutions of CaCl2, MgCl2, or ASW. All experiments were performed at room temperature (22 ± 1 °C) and atmospheric pressure.
Figure 1. Molecular structures of non-hydroxylated fatty acid (NFA) galactocerebroside, hydroxylated fatty acid (HFA) galactocerebroside, and palmitic acid.
Atmosphere 04 00315 g001

2.2. Methods

2.2.1. Langmuir Film Balance

Surface pressure-area (π-A) isotherms were obtained using a KSV Teflon Minitrough (KSV Instruments, Espoo, Finland) with dimensions of 168 mm × 85 mm. Symmetric compression of the monolayer is completed using two barriers made of Delrin, a hydrophilic material. Surface pressure and mean molecular area (MMA) were monitored during compression by the Wilhelmy plate method. Filter paper (Ashless grade, Whatman, Pittsburgh, PA, USA) served as the Wilhelmy plate. Prior to each experiment the trough was thoroughly cleaned with ethanol and rinsed several times with ultrapure water. The trough was then filled with ultrapure water or an aqueous salt solution. To check for impurities the aqueous surface was swept with the barriers to ensure no significant rise in surface pressure (≤0.2 mN/m) was observed during compression. Stock solutions of PA and cerebrosides were prepared to a concentration of 1 mM. PA/cerebrosides mixtures were prepared by mixing desired amounts of stock solutions. Four molar ratios of PA to cerebrosides were used, 1:4, 2:3, 3:2, and 4:1. A measured volume of PA, cerebrosides or mixtures was spread dropwise on the subphase using a microsyringe (Hamilton) and 10 min was allowed for solvent evaporation. The barriers were then compressed at a constant rate of 5 mm/min/barrier. Error bars of one standard deviation were within the experimental lines shown for collected isotherms.
Table 1. Chemical composition and ion concentration in Instant Ocean® synthetic sea salt.
IonConcentration (g ion/kg Water)Concentration (mol/L)
Na+10.7800.4521
K+0.4200.0104
Mg2+1.3200.0530
Ca2+0.4000.0096
Sr2+0.00889.64 × 10−5
Cl19.2900.5315
SO42−2.6600.0267
HCO30.2000.0032
Br0.0566.75 × 10−4
F0.0015.11 × 10−5

2.2.2. Brewster Angle Microscopy

BAM images of the monolayers were collected simultaneously with π-A isotherms using a custom-built BAM similar to one previously described [40,56]. The laser source (Research Electro-Optics) emits 5 mW p-polarized light at 543 nm. The incident beam is first attenuated by a half-wave plate and then filtered by a Glan-Thompson polarizer before reaching the aqueous surface at the Brewster angle (~53°). The reflected beam is collected by an infinity-corrected Nikon 10° objective lens and is then focused by a tube lens. A back-illuminated electron multiplying CCD camera (Andor, model DV887-BV, 512 × 512 pixels) was used to record BAM images. The inclined position of the imaging optics results in images focused along a central narrow stripe. Final images taken were cropped from a 800 µm × 800 µm size to show the most resolved regions, which was typically the center of the image where the beam was the most intense. In the BAM images shown here the darkest (black or dark blue) regions represent areas with negligible surfactant coverage, bright regions (light blue) correspond to areas of condensed films, and very bright areas (white) represent the formation of 3-D aggregates.

2.2.3. Vibrational Sum Frequency Generation Spectroscopy

Spectra were collected on a broad bandwidth vibrational sum frequency generation (VSFG) setup that has been described elsewhere [36,40,41,57,58]. Briefly, a Ti:sapphire oscillator (Spectra Physics, Tsunami) with a sub-50 fs pulse width and a wavelength centered at 785 nm seeds two 1 kHz regenerative amplifiers (Spectra Physics, Spitfire, femtosecond and picosecond versions). The amplifiers are pumped by a solid-state Nd:YLF laser (Spectra Physics, Evolution 30) at 527 nm. Laser beams produced from the two amplifiers are centered at 785 nm, have pulse durations of 85 fs and 2 ps, and bandwidths of 22 nm and 17 cm−1, respectively. Parametric waves (signal and idler) are generated with a BBO crystal by sending the amplified femtosecond laser pulses to an optical parametric amplifier (Light Conversion, TOPAS-800). An infrared beam is then created via a AgGaS2 crystal by non-collinear overlap of the signal and idler in a non-collinear difference-frequency generation system (Light Conversion, NDFG coupled to TOPAS).
The visible beams and infrared are incident at incident angles of 53° and 70°, respectively, and are overlapped spatially and temporally at the sample stage to generate SFG signal. Measured energies of the infrared and visible beams at the sample are 14 and 300 µJ, respectively. The generated VSFG signal is detected in the reflection direction. A monochromator (Acton Research, SpectraPro SP-500 with 1,200 g/mm grating blazed at 750 nm) disperses the SFG signal before being detected by a liquid nitrogen-cooled back-illuminated CCD camera (Roper Scientific, LN400EB with 1,340 × 400 pixels array). The ssp (s-SFG, s-visible, p-infrared) polarization combination was utilized in these experiments. The collected VSFG spectra are first corrected by subtraction of the background and are then normalized against the broadband infrared beam energy profile using a nonresonant VSFG spectrum generated from a GaAs crystal (Lambda Precision Optics). Spectral distortion resulting from the infrared beam energy distribution in the region of interest is eliminated during the normalization process. Spectral fitting was done with custom-built routines (IgorPro4.3) in which Lorentzian lineshapes with global constraints are employed. Polystyrene absorption bands obtained from a nonresonant GaAs spectrum were compared to reference FTIR spectra to spectrally calibrate the VSFG peaks positions. VSFG peaks reported here are accurate to 1 cm−1 [40].

3. Results and Discussion

3.1. Effect of Subphase Composition on Surface Morphology of Palmitic Acid

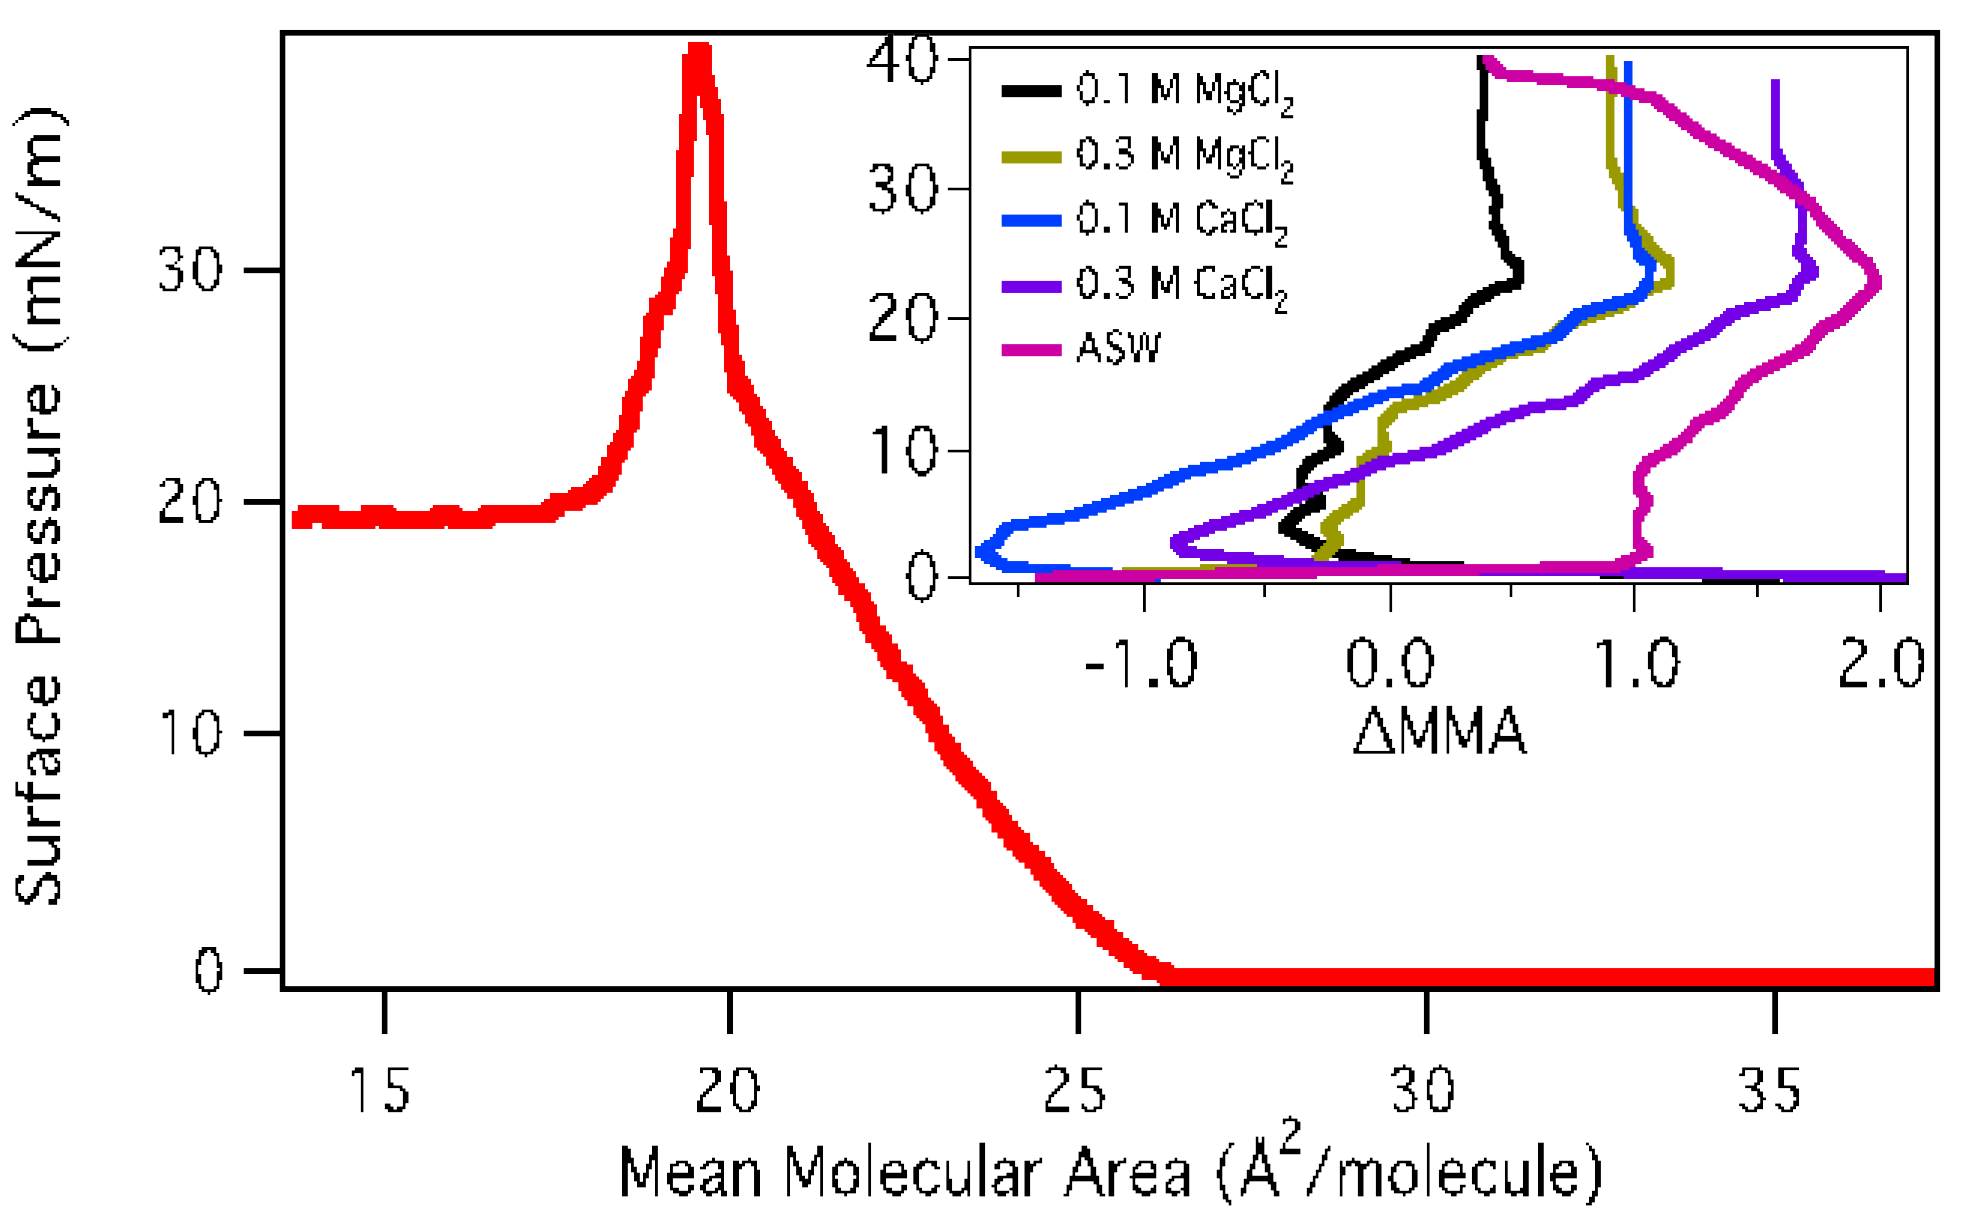
3.1.1. Surface Pressure-Area Isotherms
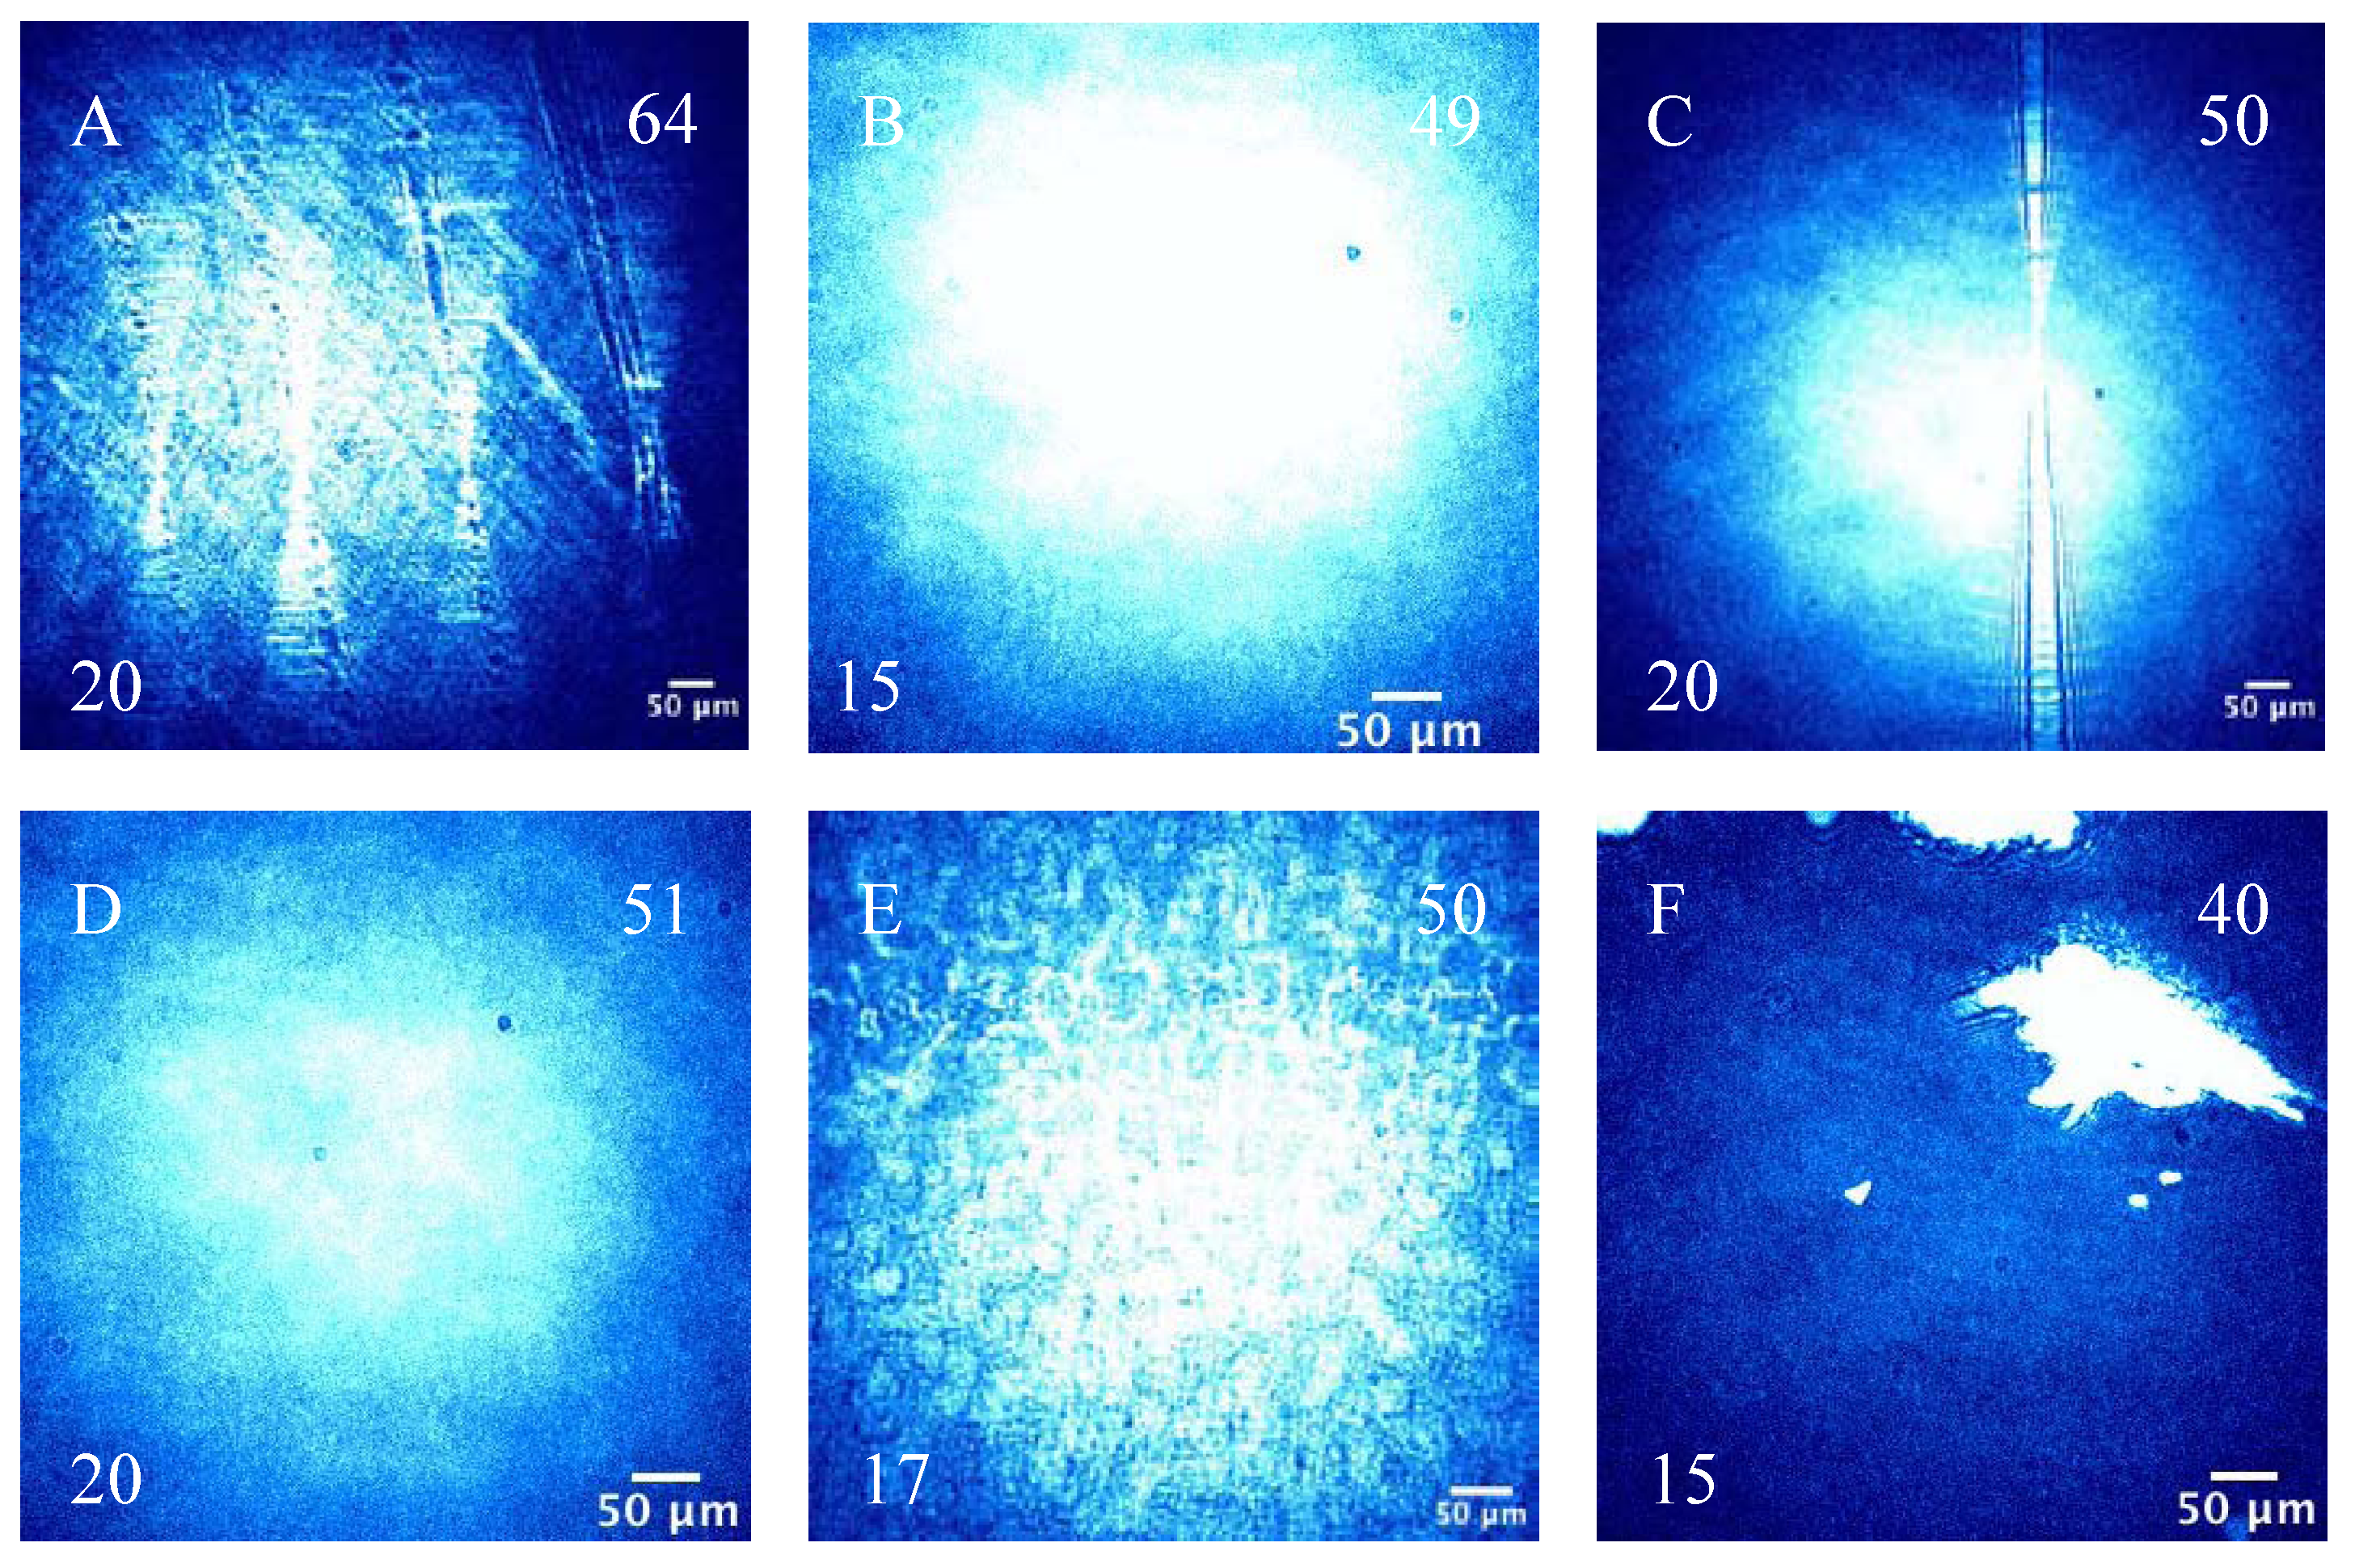
The phase behavior of Langmuir monolayers are described by π-A isotherms [59]. The isotherm of a PA monolayer is shown in Figure 2. Results reported here are consistent with previous studies [8,60,61]. The regions in the isotherm have previously been attributed to the gas-tilted condensed (G-TC) coexistence region, tilted condensed (TC), untilted condensed (UC), and collapse phases [36,62]. The G-TC to TC transition (evidenced by BAM) occurs at 26 Å2/molecule. A kink at 25 mN/m indicates a molecular reorganization and has previously been attributed to a second-order transition from the TC phase to the UC phase [63]. Collapse of the monolayer occurs at 40 mN/m.
Figure 2. π-A isotherm of palmitic acid (PA) monolayer on water. Inset shows isotherms of PA on various salt subphases relative to the isotherm on water.
Atmosphere 04 00315 g002
Isotherms obtained here for PA monolayers on MgCl2 and CaCl2 subphases are consistent with results obtained by Tang et al. [40]. The inset of Figure 2 shows π-A isotherms of PA on various salt subphases relative to that of pure water. Negative or positive values on the x-axis indicate that the molecules on the salt subphase occupied a smaller or a greater MMA than when on pure water. As can be seen from the plot, the MgCl2 and CaCl2 caused the PA monolayer to condense at low surface pressures (TC phase), but at higher surface pressure the monolayer was expanded (UC phase). ASW, however, caused the molecules to occupy a larger molecular area throughout the whole compression.

3.1.2. BAM Images

BAM images of a PA monolayer on water are given in Figure 3. At large MMAs (G-TC phase) small circular domains are observed that are consistent with previous reports [8,42,64,65]. As the monolayer is further compressed these domains begin to fuse together to form a fully condensed monolayer (TC phase). Further compression results in the formation of white aggregates at the surface. These aggregates begin to form at surface pressures as low as 17 mN/m and are visible in both the TC and UC phases. These aggregates grow in number and size until monolayer collapse.
The effect of the MgCl2 subphase on the PA surface morphology can be observed in Figure 3. It has been previously shown that MgCl2 salt solution alters the phase behavior of PA compared to a pure water subphase. To clarify how BAM images correspond to the π-A isotherms, images shown in the G-TC phase were recorded at a surface pressure of 0 mN/m, in the TC phase between 1 and 6 mN/m, and in the UC phase at surface pressures greater than 25 mN/m. The images show that the surface morphology of the PA monolayer on MgCl2 has changed compared to pure water. While domains in the gas phase have boundaries with circular characteristics, similar to PA on water, it appears that the monolayer has condensed as large domains are now visible. Furthermore, as the concentration is increased to 0.3 M MgCl2, the monolayer appears to be even more condensed because circular domains are no longer observed. At higher surface pressures smaller or a complete lack of white aggregates is observed, indicating that the monolayer is more stable in the presence of Mg2+ ions than with pure water.
CaCl2 has a larger effect on the PA monolayer surface morphology than MgCl2 (Figure 3). Concentration changes of CaCl2 have little effect on the surface morphology as the monolayer displays similar surface morphology in all phases for 0.1 M and 0.3 M solutions. At 0.1 M, in the G-LC phase, Ca2+ has a greater ability to condense, and hence to order the monolayer than Mg2+. These results are consistent with those reported by Tang et al., which indicated that the Ca2+ binds more strongly to the PA carboxylic headgroup than Mg2+ [40].
Also shown in Figure 3 are BAM images of a PA monolayer on an ASW subphase. In the G-TC region the monolayer has condensed and large voids with irregular boundaries are occasionally observed. A similar surface morphology is observed in the TC region, while in the UC region the monolayer fully condenses and has uniform brightness. In addition, small white aggregates are observed in all phases measured.
Figure 3. Brewster angle microscopy (BAM) images in various phases and vibrational sum frequency generation (VSFG) spectra in the CH region (2,800–3,100 cm−1) of PA monolayer on water, MgCl2, CaCl2, and ASW subphases. VSFG spectra adapted from [40].
Atmosphere 04 00315 g003
Comparison of the BAM images on CaCl2, MgCl2, and ASW subphases reveals that all three salt solutions have a condensing effect on PA monolayers. Visually, it appears that ASW has the most pronounced condensing effect. The concentration of Ca2+ and Mg2+ ions in ASW is significantly less than in the 0.1 M solutions (4 g/kg and 2.4 g/kg, respectively). In ASW due to the high concentration of Na+ vs. Mg2+ and Ca2+, it likely that Na+ contributes substantially to the observed condensing effect. A review of the literature found that no BAM images for a PA monolayer on concentrated NaCl solution have been reported; therefore a comparison of ASW and NaCl solutions could not be made. VSFG studies, however, suggest that NaCl causes condensation of the PA monolayer, similar to the trend observed here for divalent cations and ASW [36].
Although the pH of the ASW is significantly greater than those of CaCl2 and MgCl2 solutions (8.2 vs. 5.1 and 5.4), the difference in pH likely contributes little to the observed condensing effect for ASW. The pKa of the PA carboxylic headgroup at the surface is approximately 8.7, which varies from the bulk value of 4.5. Accordingly, at pH 5 the monolayer should be fully protonated, while at pH 8.2 the monolayer will have an equal distribution of protonated and deprotonated species. Previous studies, however, indicate that at a pH of 5.5 both monovalent (Na+ and K+) and divalent (Mg2+ and Ca2+) cations deprotonate the carboxylic headgroup of PA [36,40]. In contrast, other studies have shown that monovalent ions (Na+) do not interact with the fatty acid monolayer unless the subphase pH is relatively high (>9) [66]. In the aforementioned studies, the concentrations of Na+ ions in the subphase differed by a factor of 10. The discrepancy between these two studies suggests that deprotonation of the headgroup by monovalent ions is dependent upon the availability of ions in the subphase. In the study presented here the concentration of Na+ ions in ASW is significantly higher than previous studies (0.4 M vs. 0.2 M and 0.01 M, respectively). As it was demonstrated that the PA monolayer was fully deprotonated at pH 5.5 and with 0.2 M Na+ present, ASW will accordingly also cause deprotonation of the monolayer, despite the difference in pH.

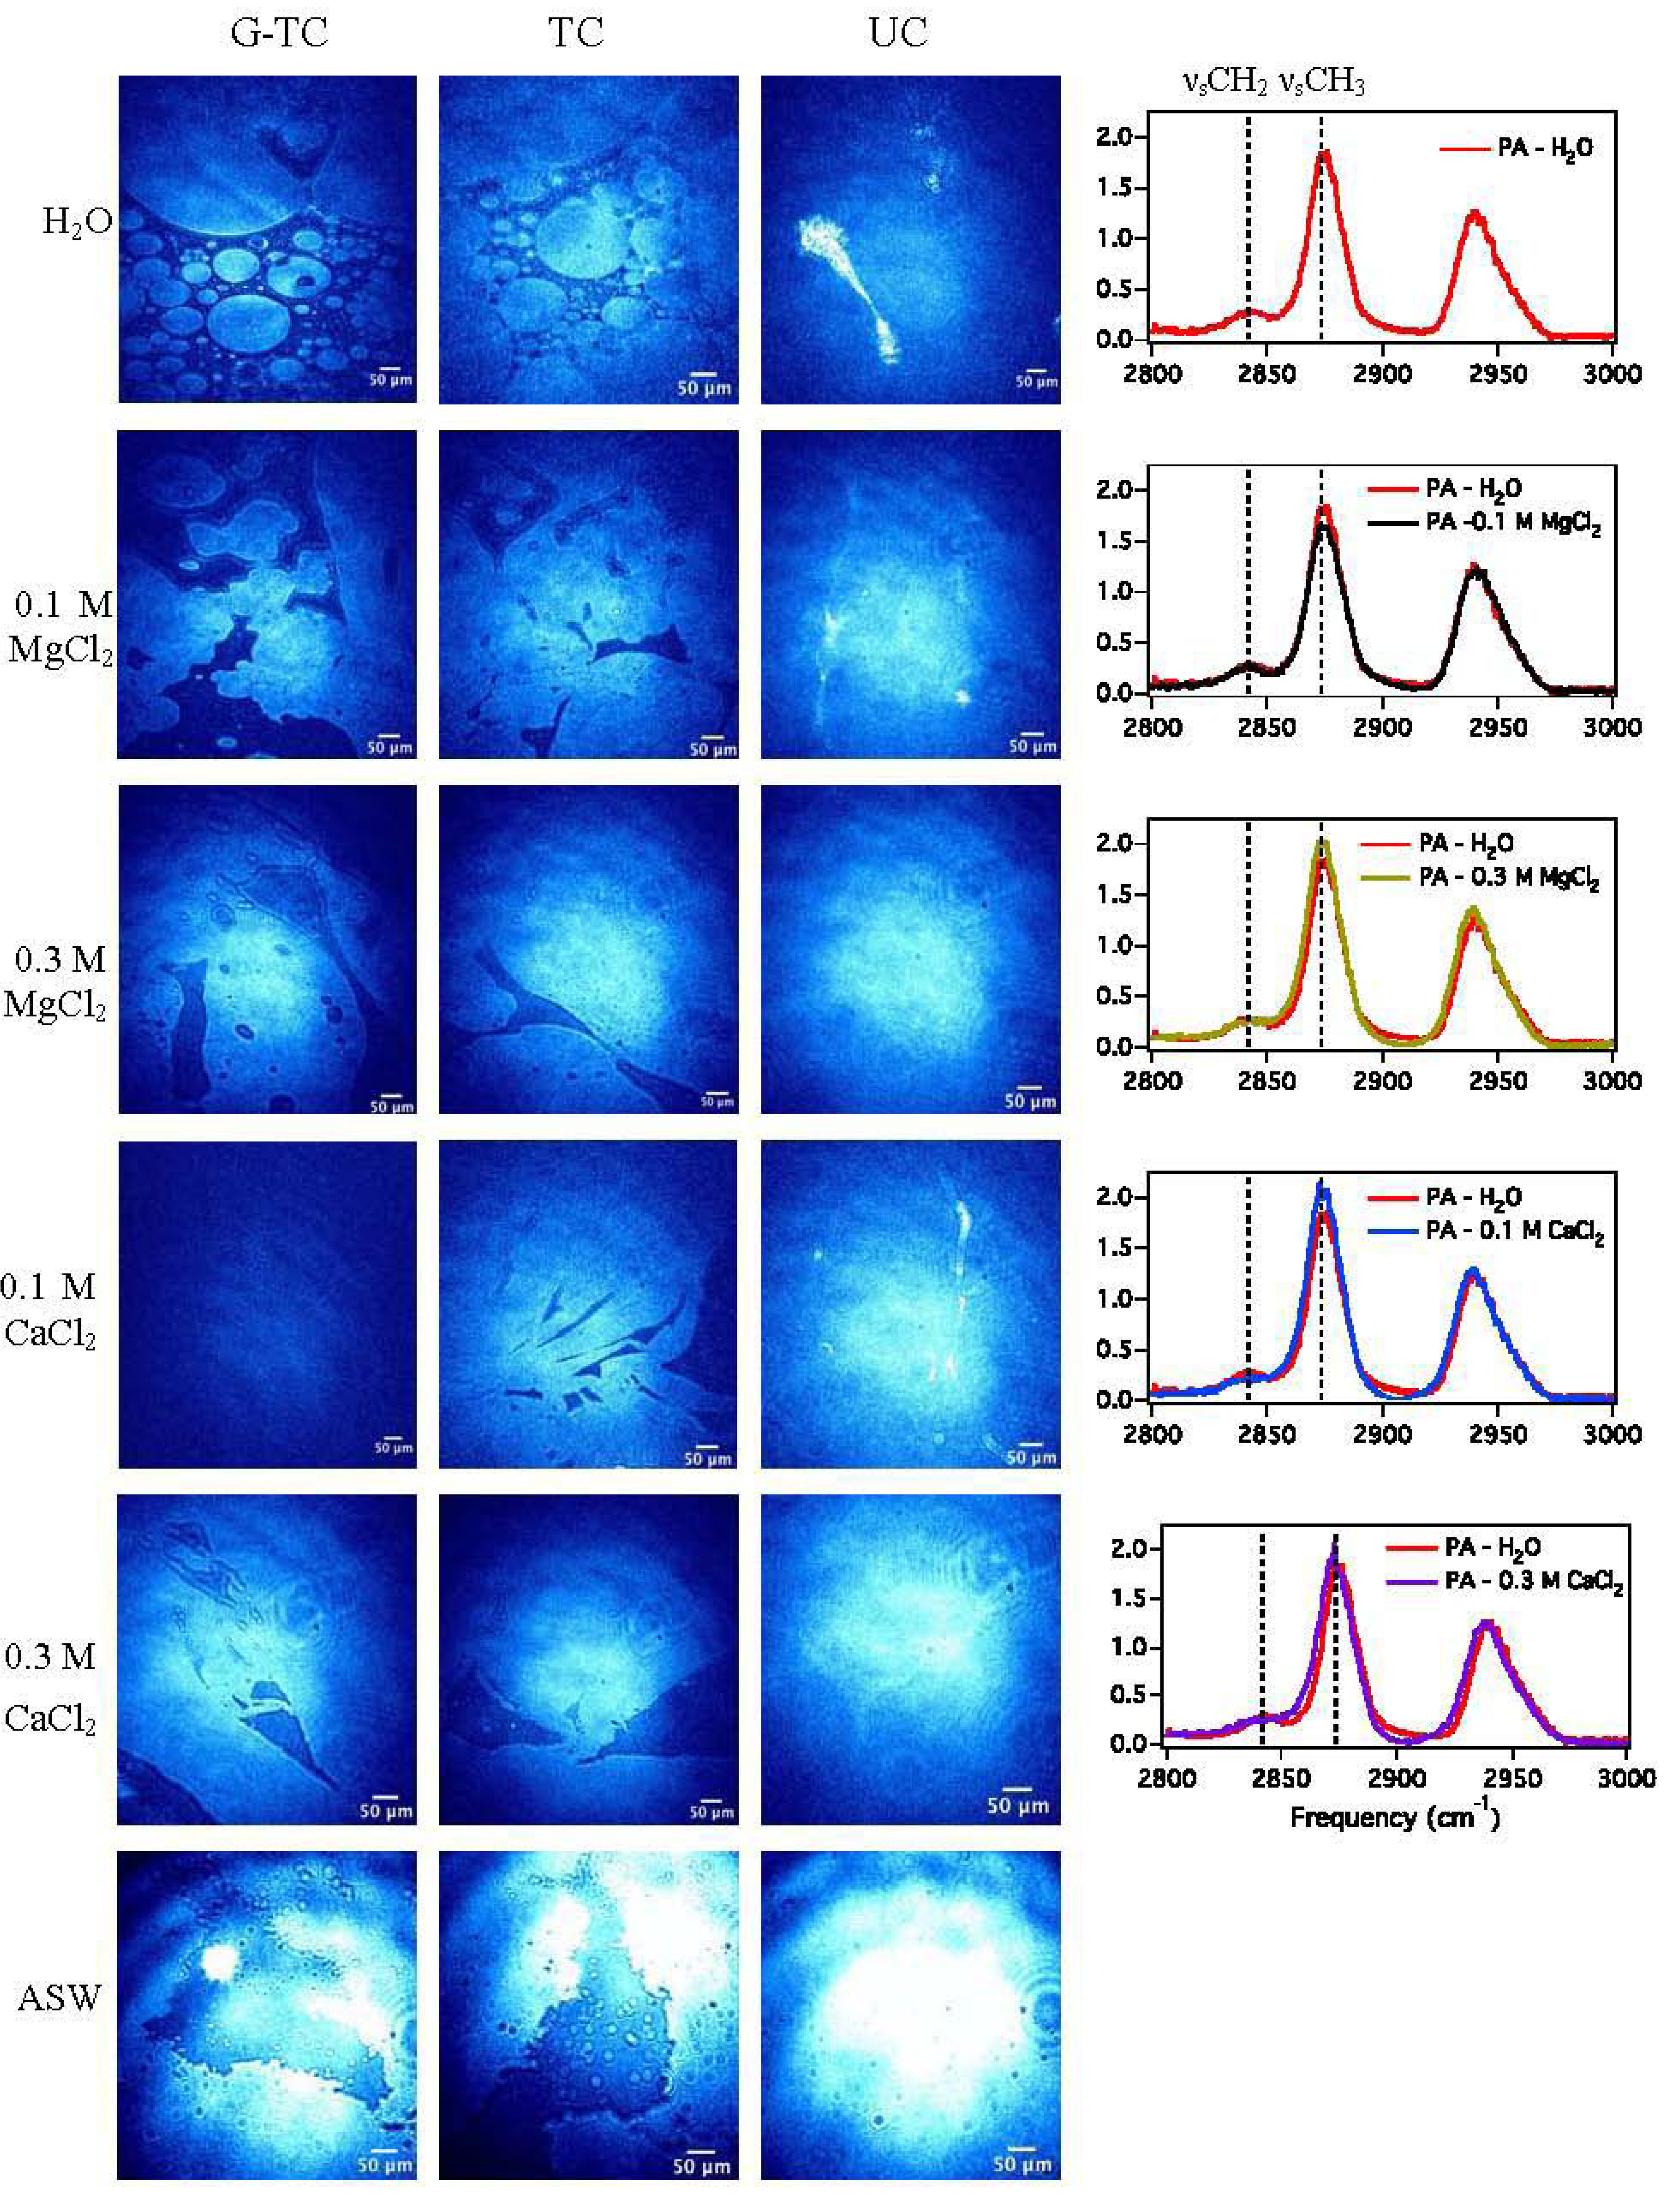
3.1.3. Sum Frequency Generation

Because BAM images reveal that the presence of salts results in the condensation of the PA monolayer, VSFG spectroscopy is used to understand the molecular-level organization of the monolayer in the TC phase. Thus, also shown in Figure 3 are VSFG spectra of PA on MgCl2 and CaCl2 aqueous solutions in the CH stretching region (2,800–3,100 cm−1), which are used to determine the extent of conformational ordering of the acyl chains induced by the ions in the subphase (i.e., trans vs. gauche ordering). All spectra were collected at a surface pressure of 10 mN/m.
Four vibrational modes are present in the spectrum of the PA monolayer on pure water: the CH2 symmetric stretch (νsCH2) at 2,842 cm−1, the CH3 symmetric stretch (νsCH3) at 2,874 cm−1, the CH3 Fermi resonance (νFRCH3) at 2,940 cm−1, and the CH3 asymmetric stretch (νaCH3) at 2,960 cm−1. The VSFG spectrum shows that the νsCH3 and νFRCH3 peak intensities are more intense, while those of the νsCH2 and νaCH3 modes are relatively weaker. Of these peaks, the νsCH3 and νsCH2 are indicative of the conformational ordering of the acyl chain. Based on the electric dipole approximation, SFG is forbidden for medium or chemical groups with an inversion center. Therefore, a strong νsCH3 peak with a corresponding weak νsCH2 peak indicates a highly ordered acyl chain with little gauche defects. In contrast, a weak νsCH3 peak accompanied by a strong νsCH2 peak represents a weakly ordered acyl chain with many gauche defects. In the VSFG spectrum of a PA monolayer on water, the νsCH3 peak is strong while the νsCH2 peak is weak, which reflects a highly ordered acyl chain in which the CH2 stretches are centrosymmetric, and thus in an all-trans conformation.
Comparison of the MgCl2 and CaCl2 spectra (regardless of concentration) to pure water shows a similar pattern, revealing that the acyl chains are in a trans configuration for all subphases. However, the degree to which Mg2+ or Ca2+ ions order the acyl chain can be determined from the ratio of the νsCH3 to νsCH2 peak intensity. Acyl chains that are more ordered have a larger ratio, indicating that the chains are nearer to an all-trans organization. Comparison of 0.1 M MgCl2 with pure water shows that the intensity of the νsCH3 has decreased slightly. The νsCH3 to νsCH2 peak ratio is larger for 0.1 M MgCl2 than water though (Table 2), thus suggesting that Mg2+ induces a greater ordering of the acyl chains than water. For 0.3 M MgCl2 a stronger νsCH3 peak is observed, indicating that the ability of Mg2+ to order the monolayer increases with concentration. This is consistent with BAM images, which showed that the PA monolayer became more condensed as Mg2+ concentration increased. Comparison of the CaCl2 solutions with pure water shows that concentration has little effect on the intensity of the νsCH3 peak; however, the peak is stronger than that on pure water. This indicates that Ca2+ interacts more strongly with the monolayer than Mg2+ at a concentration of 0.1 M, although the effect is minimal, but observable and significant. The peak intensity is comparable at 0.3 M, indicating that the interaction of the ion with the monolayer is similar. These results are also consistent with BAM images, which revealed that Ca2+ has a larger effect on surface morphology at lower concentrations. The greater ability of Ca2+ to perturb the PA monolayer surface morphology is most likely due to difference in binding of Ca2+ and Mg2+ ions to the COO headgroup. Ca2+ is believed to interact with two COO groups, either by forming a bidentate or bridging complex. Mg2+, however, is more likely to form ionic or monodentate complexes with one COO headgroup [40].
Table 2. νsCH3sCH2 mode ratio for various subphases.
SubphaseνsCH3sCH2
H2O6.7
0.1 M MgCl26.8
0.3 M MgCl27.9
0.1 M CaCl211.3
0.3 M CaCl28.1

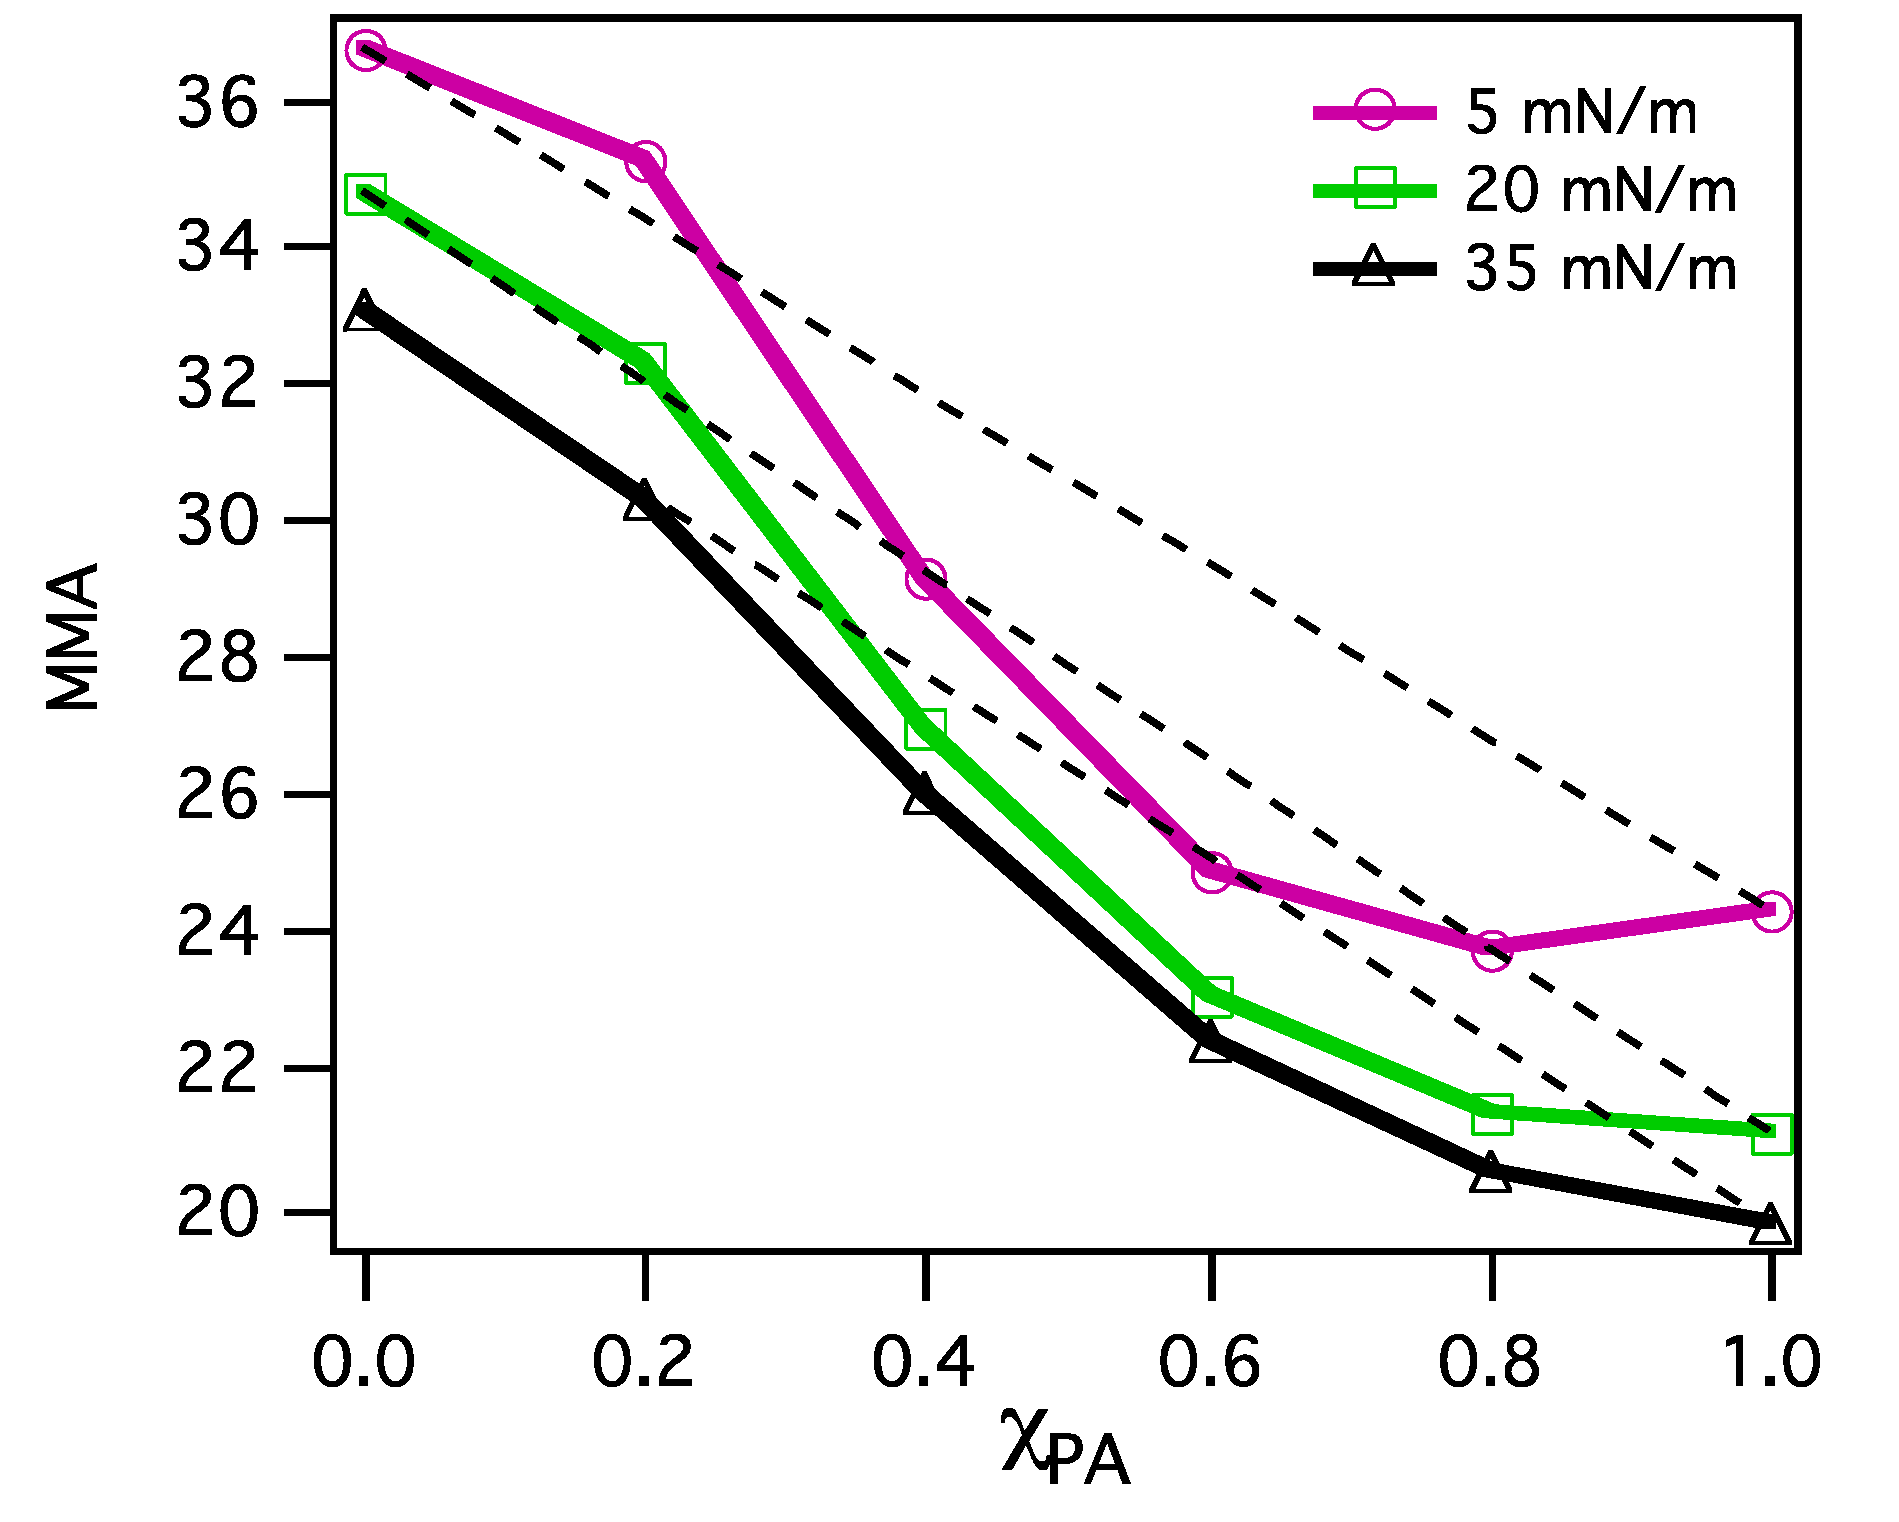
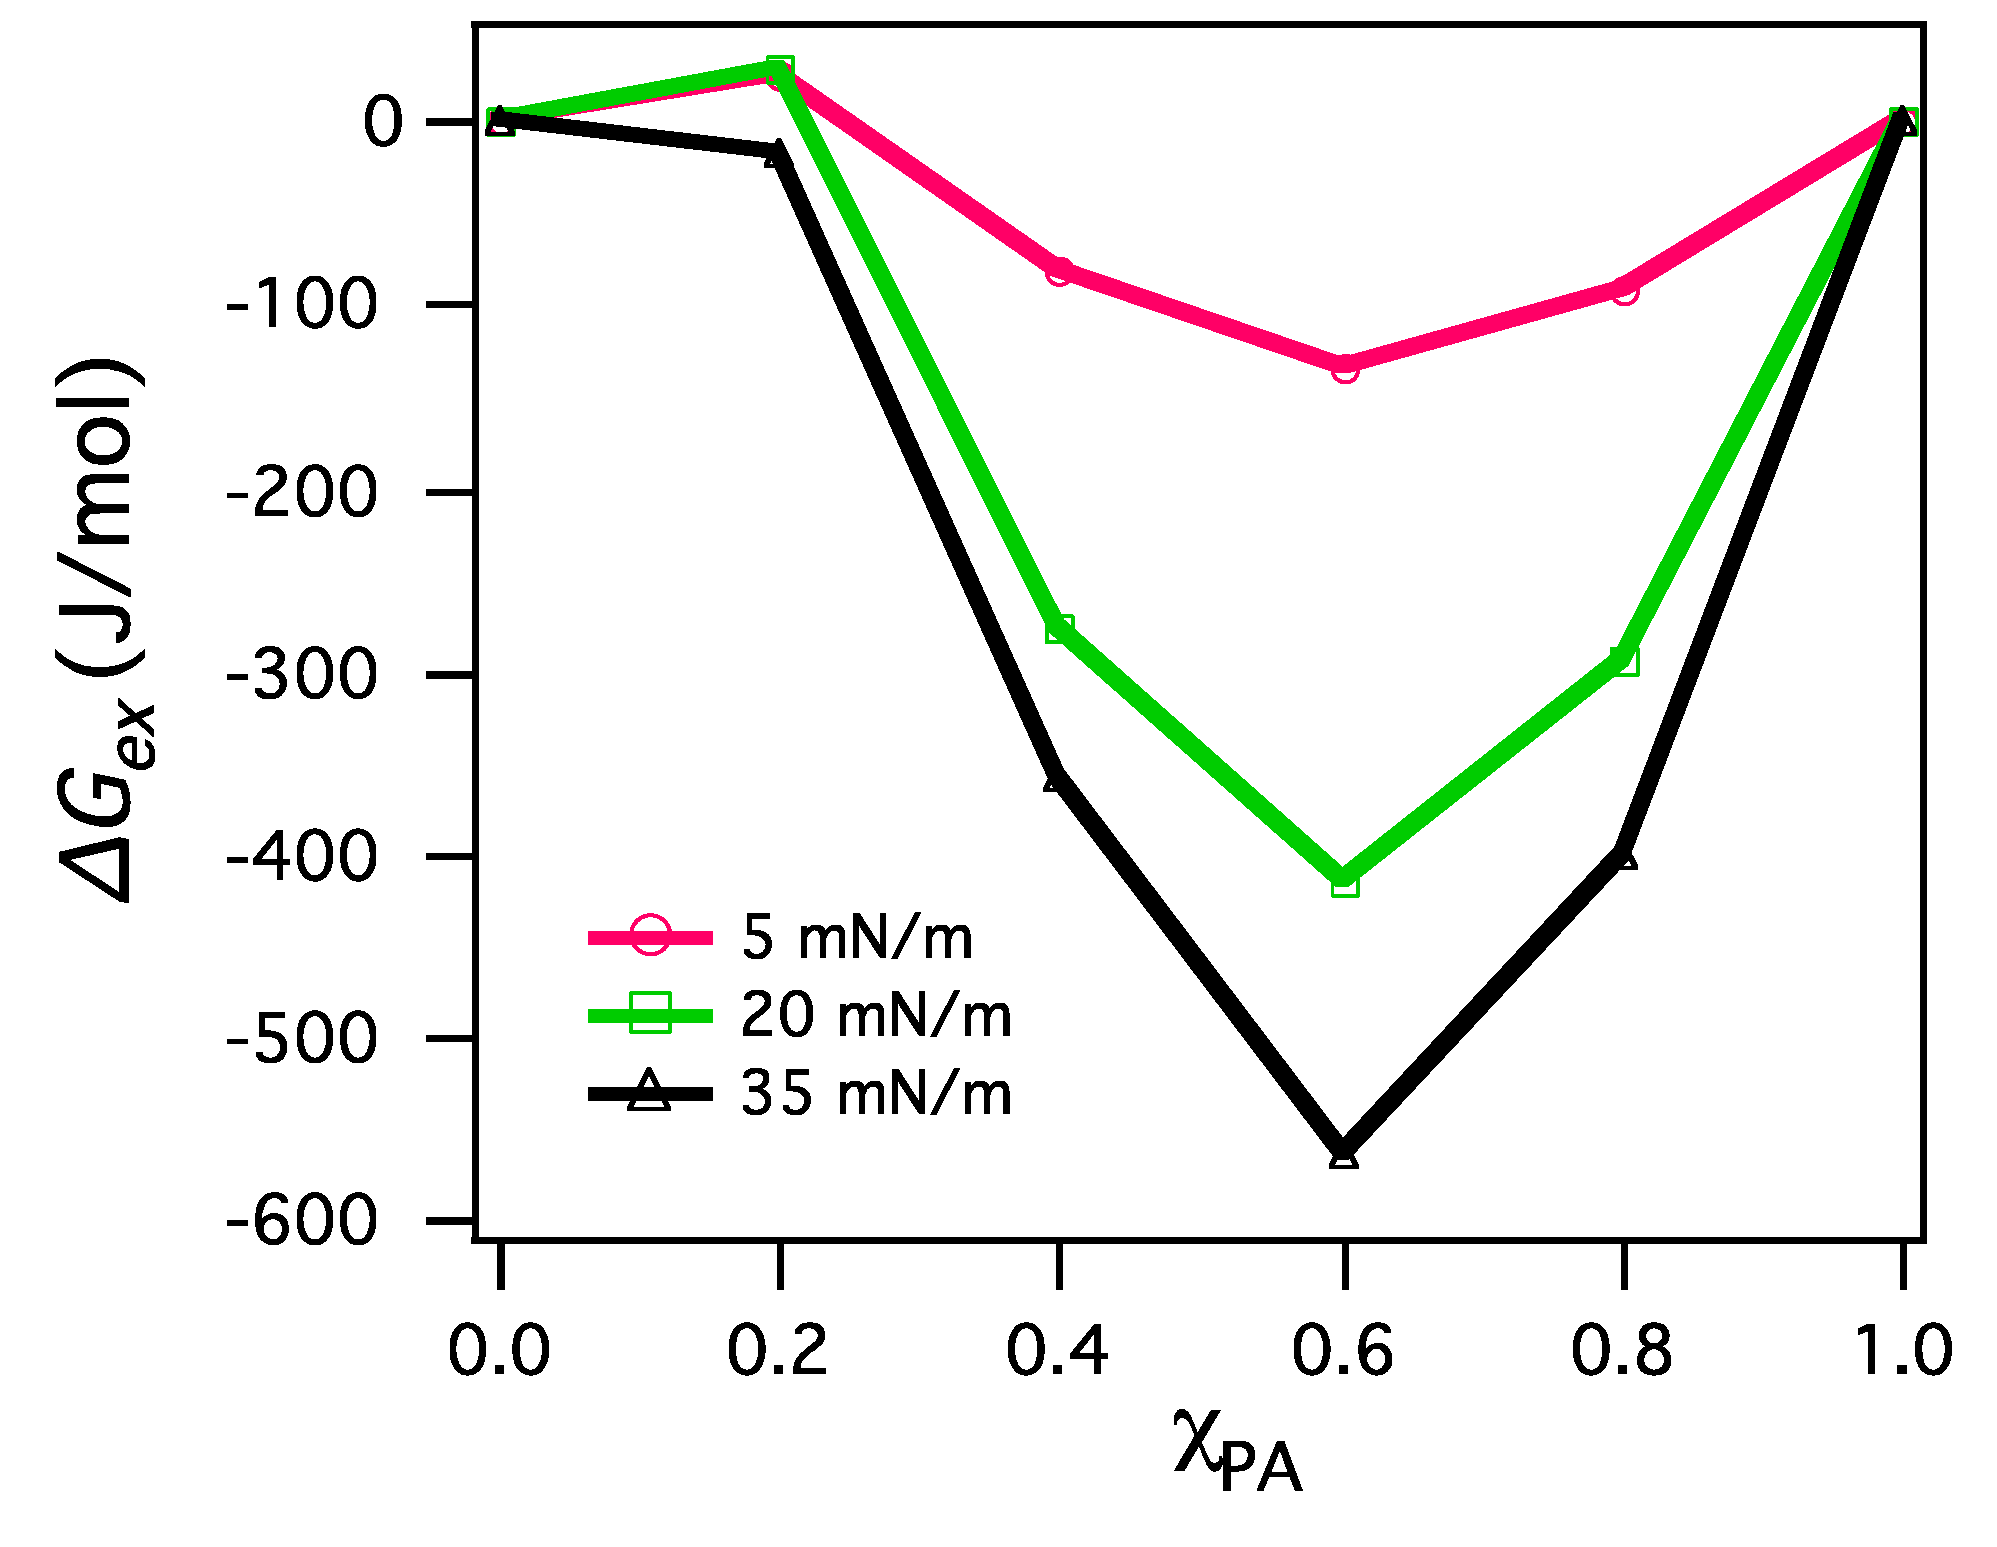
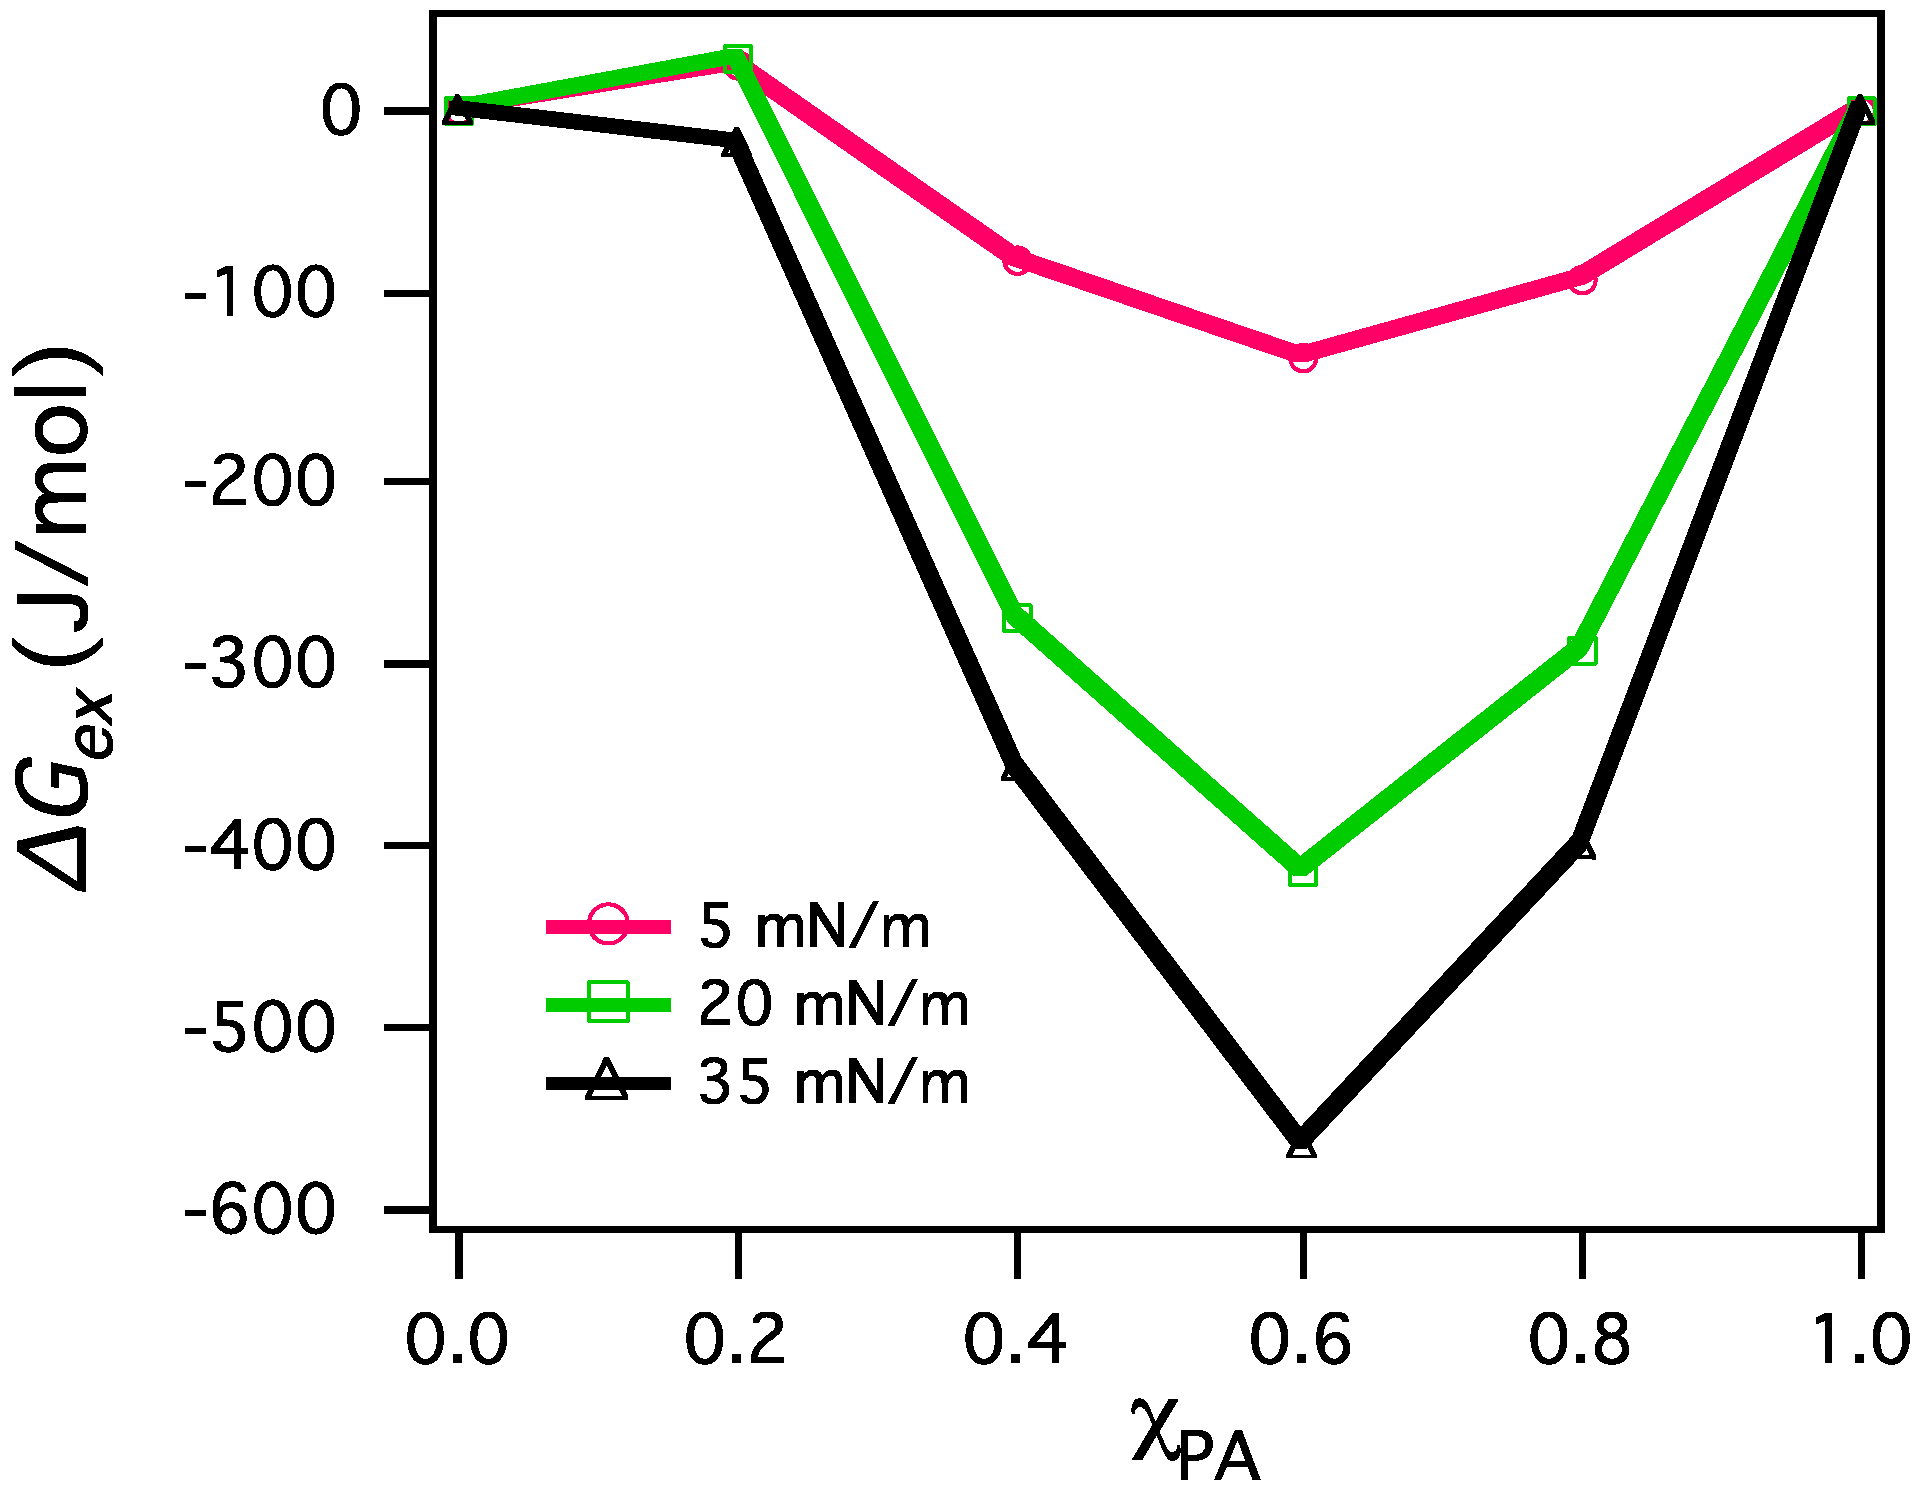
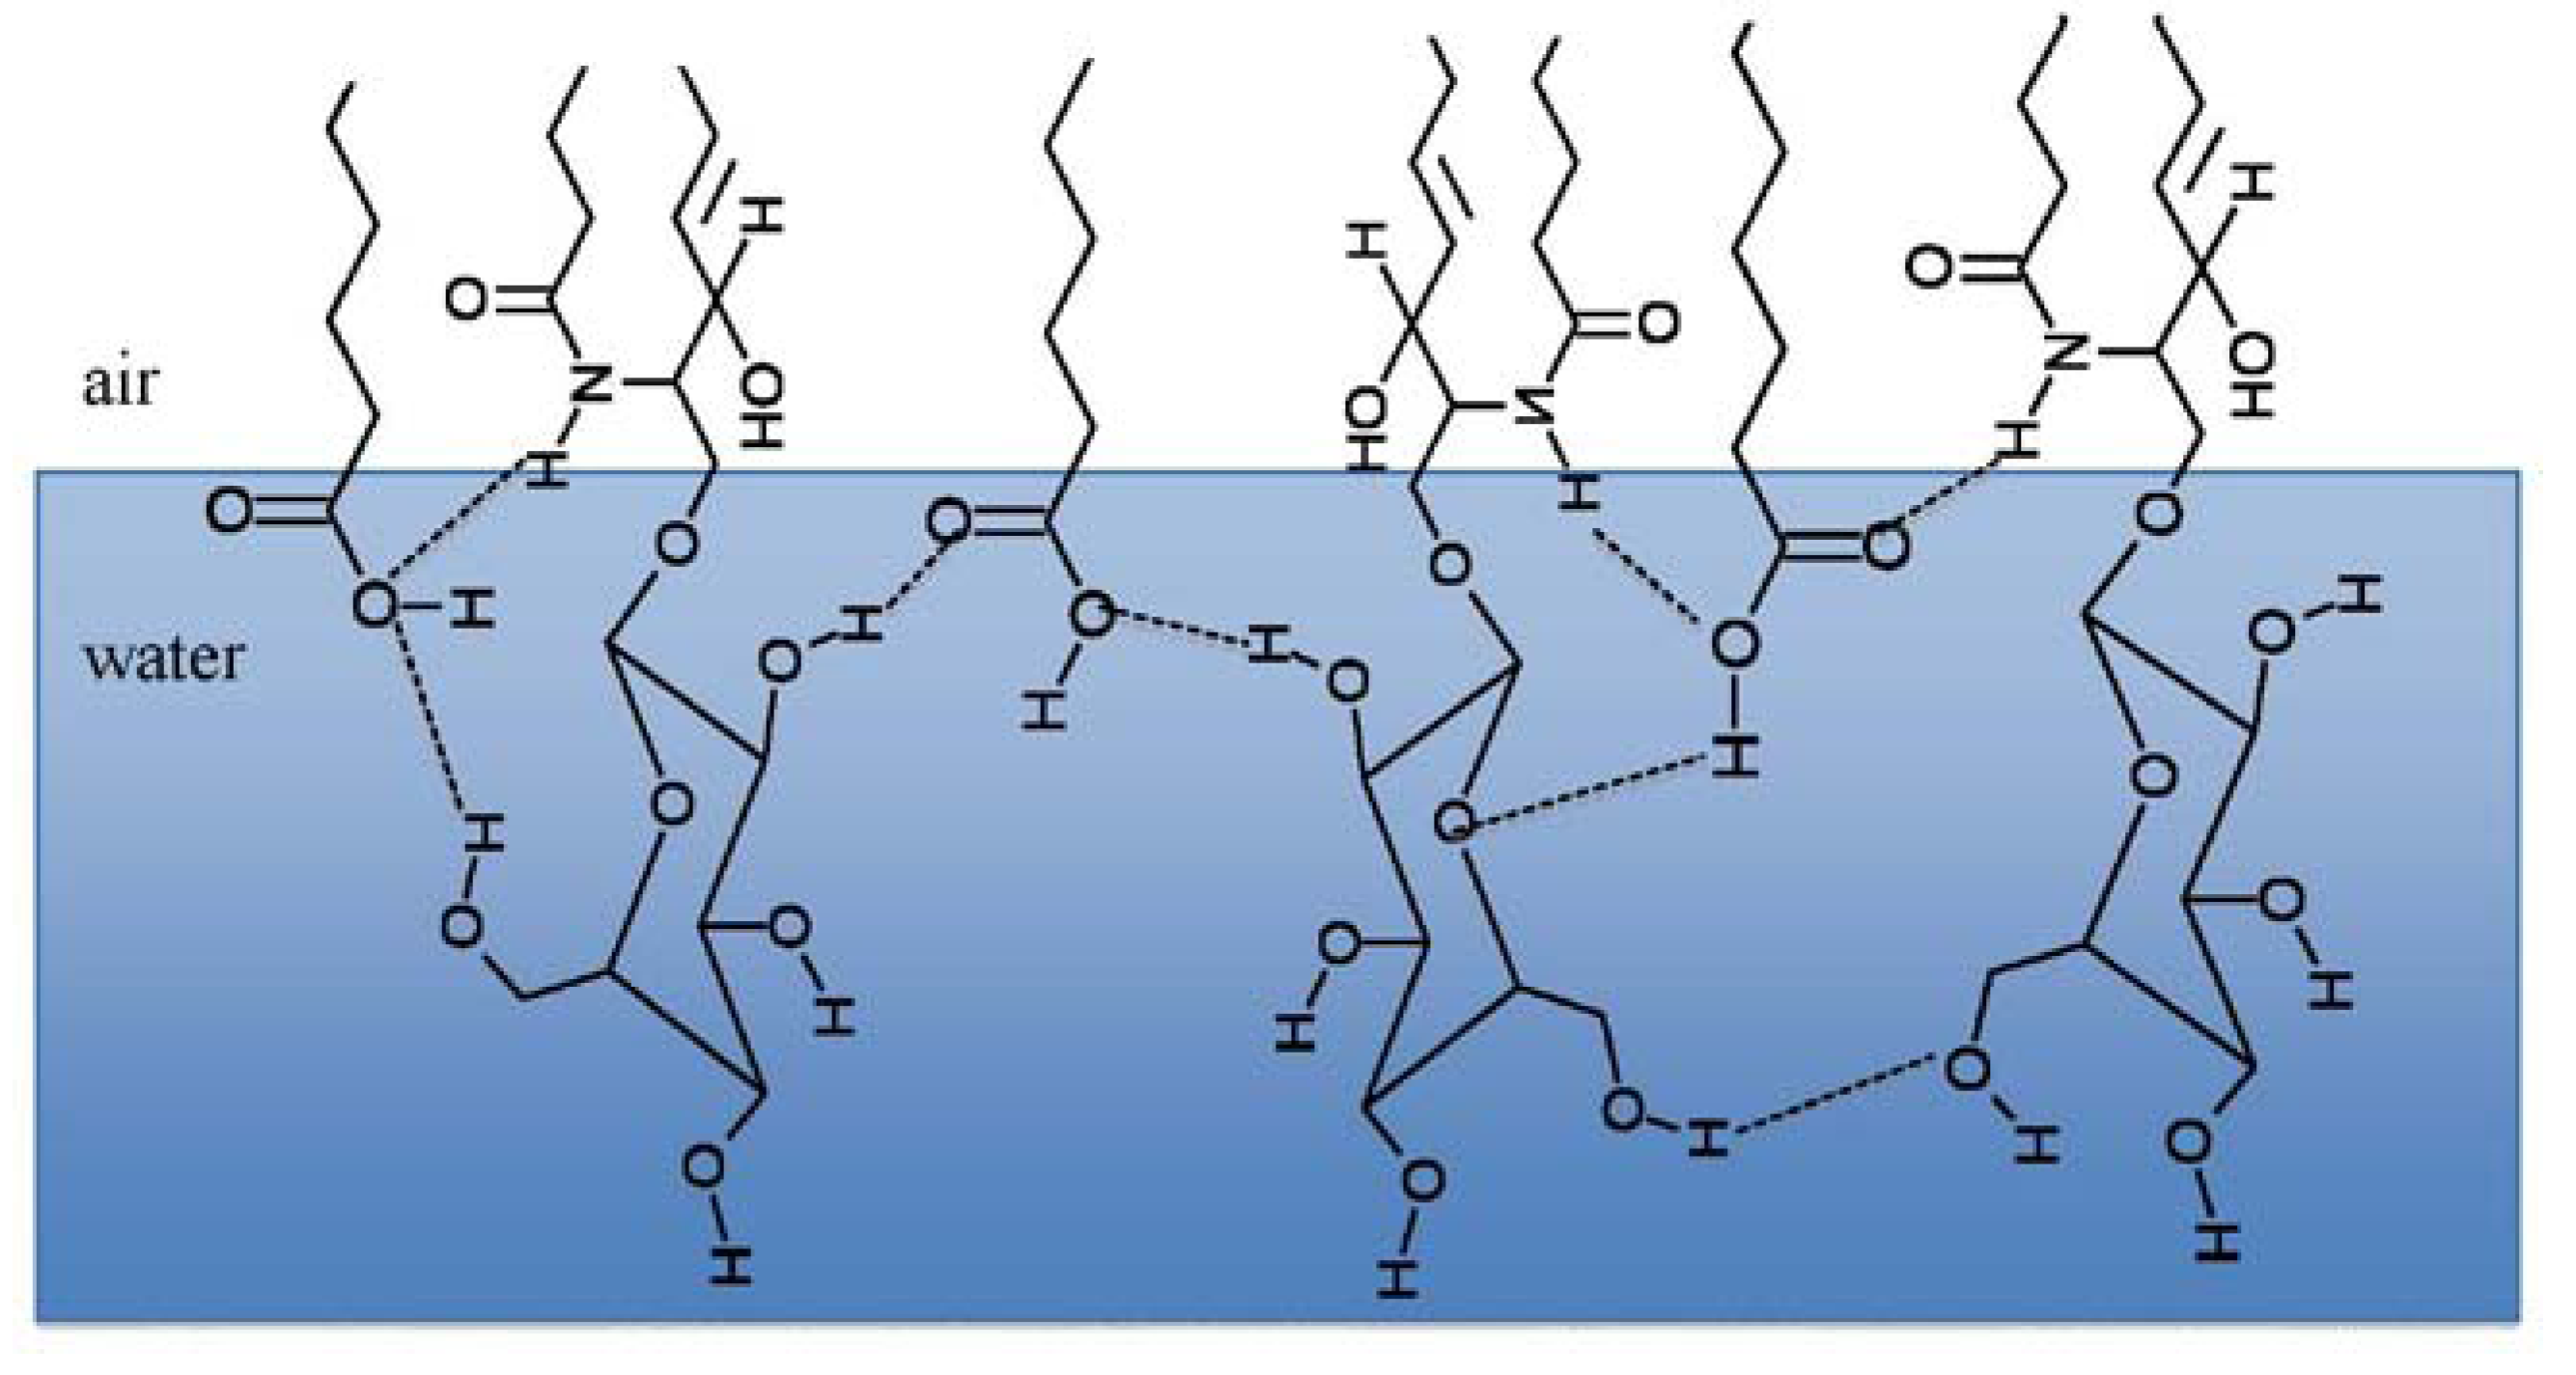
3.2. Miscibility and Surface Morphology of Mixed Monolayers of PA and Cerebrosides

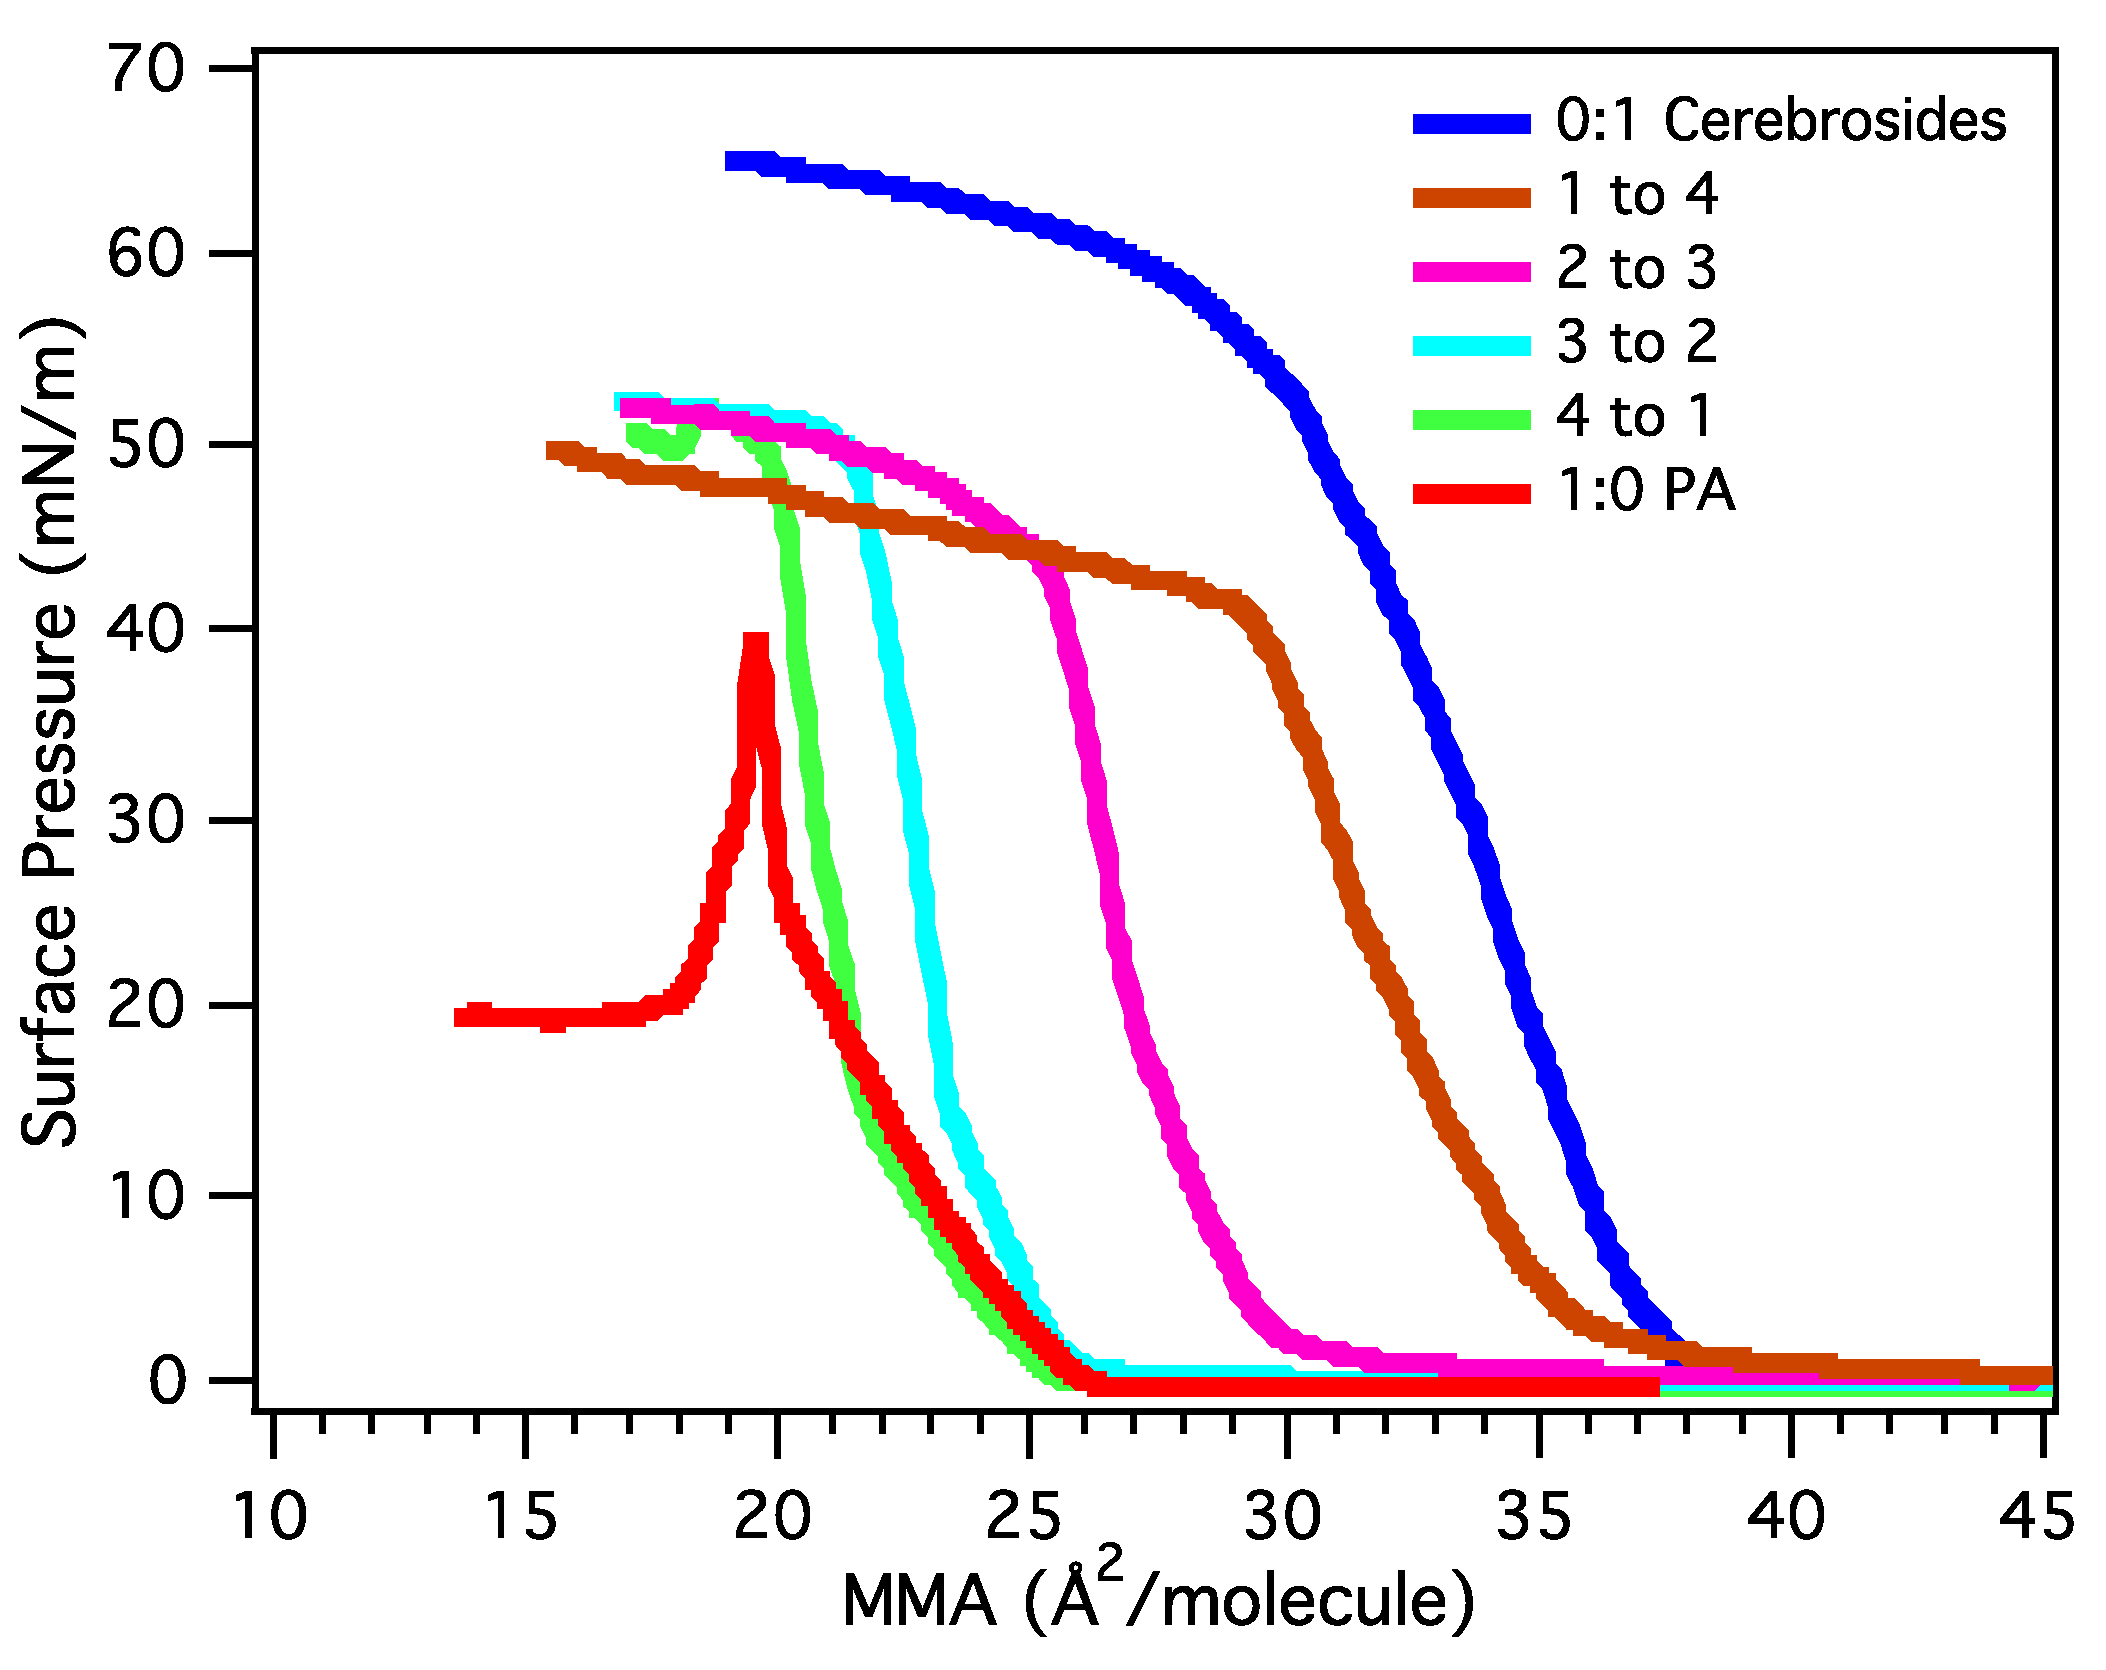
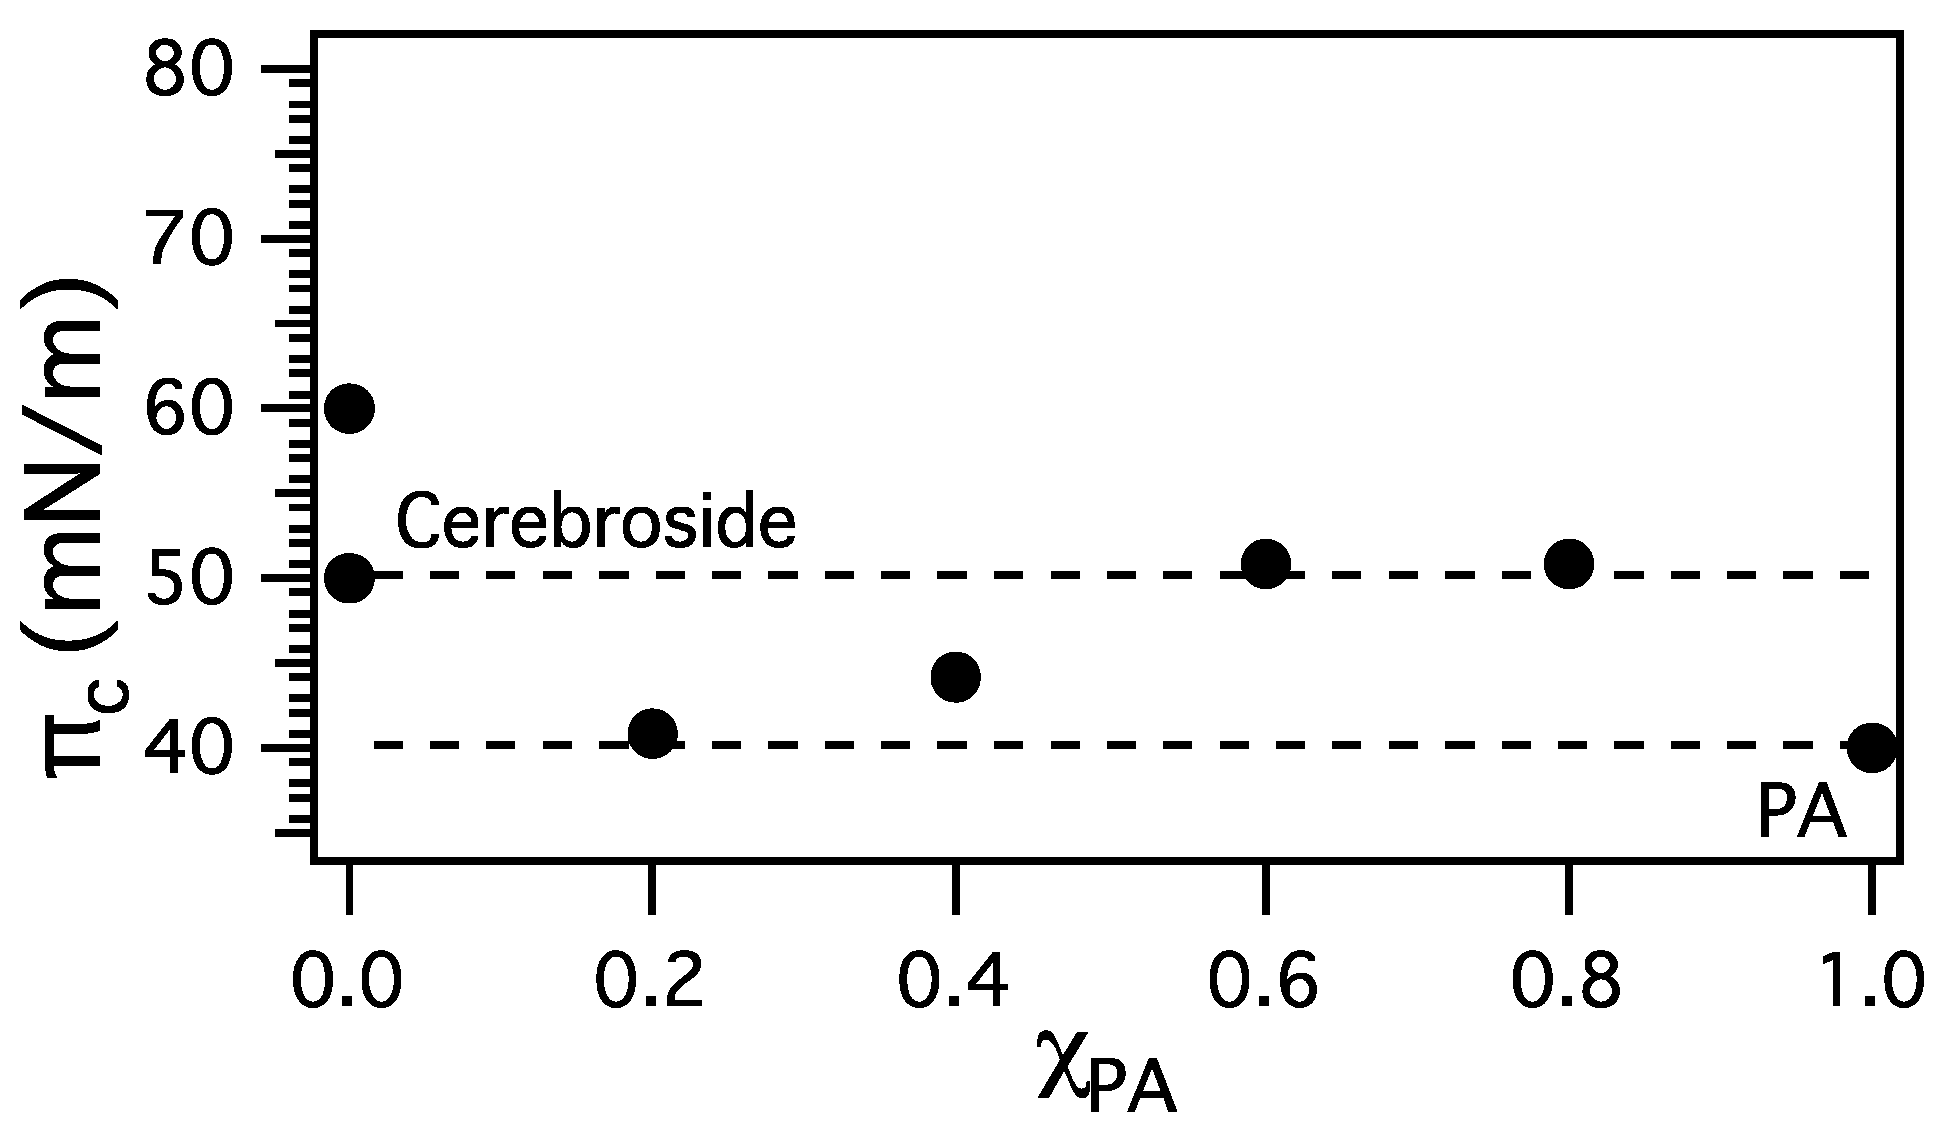
3.2.1. Surface Pressure-Area Isotherms
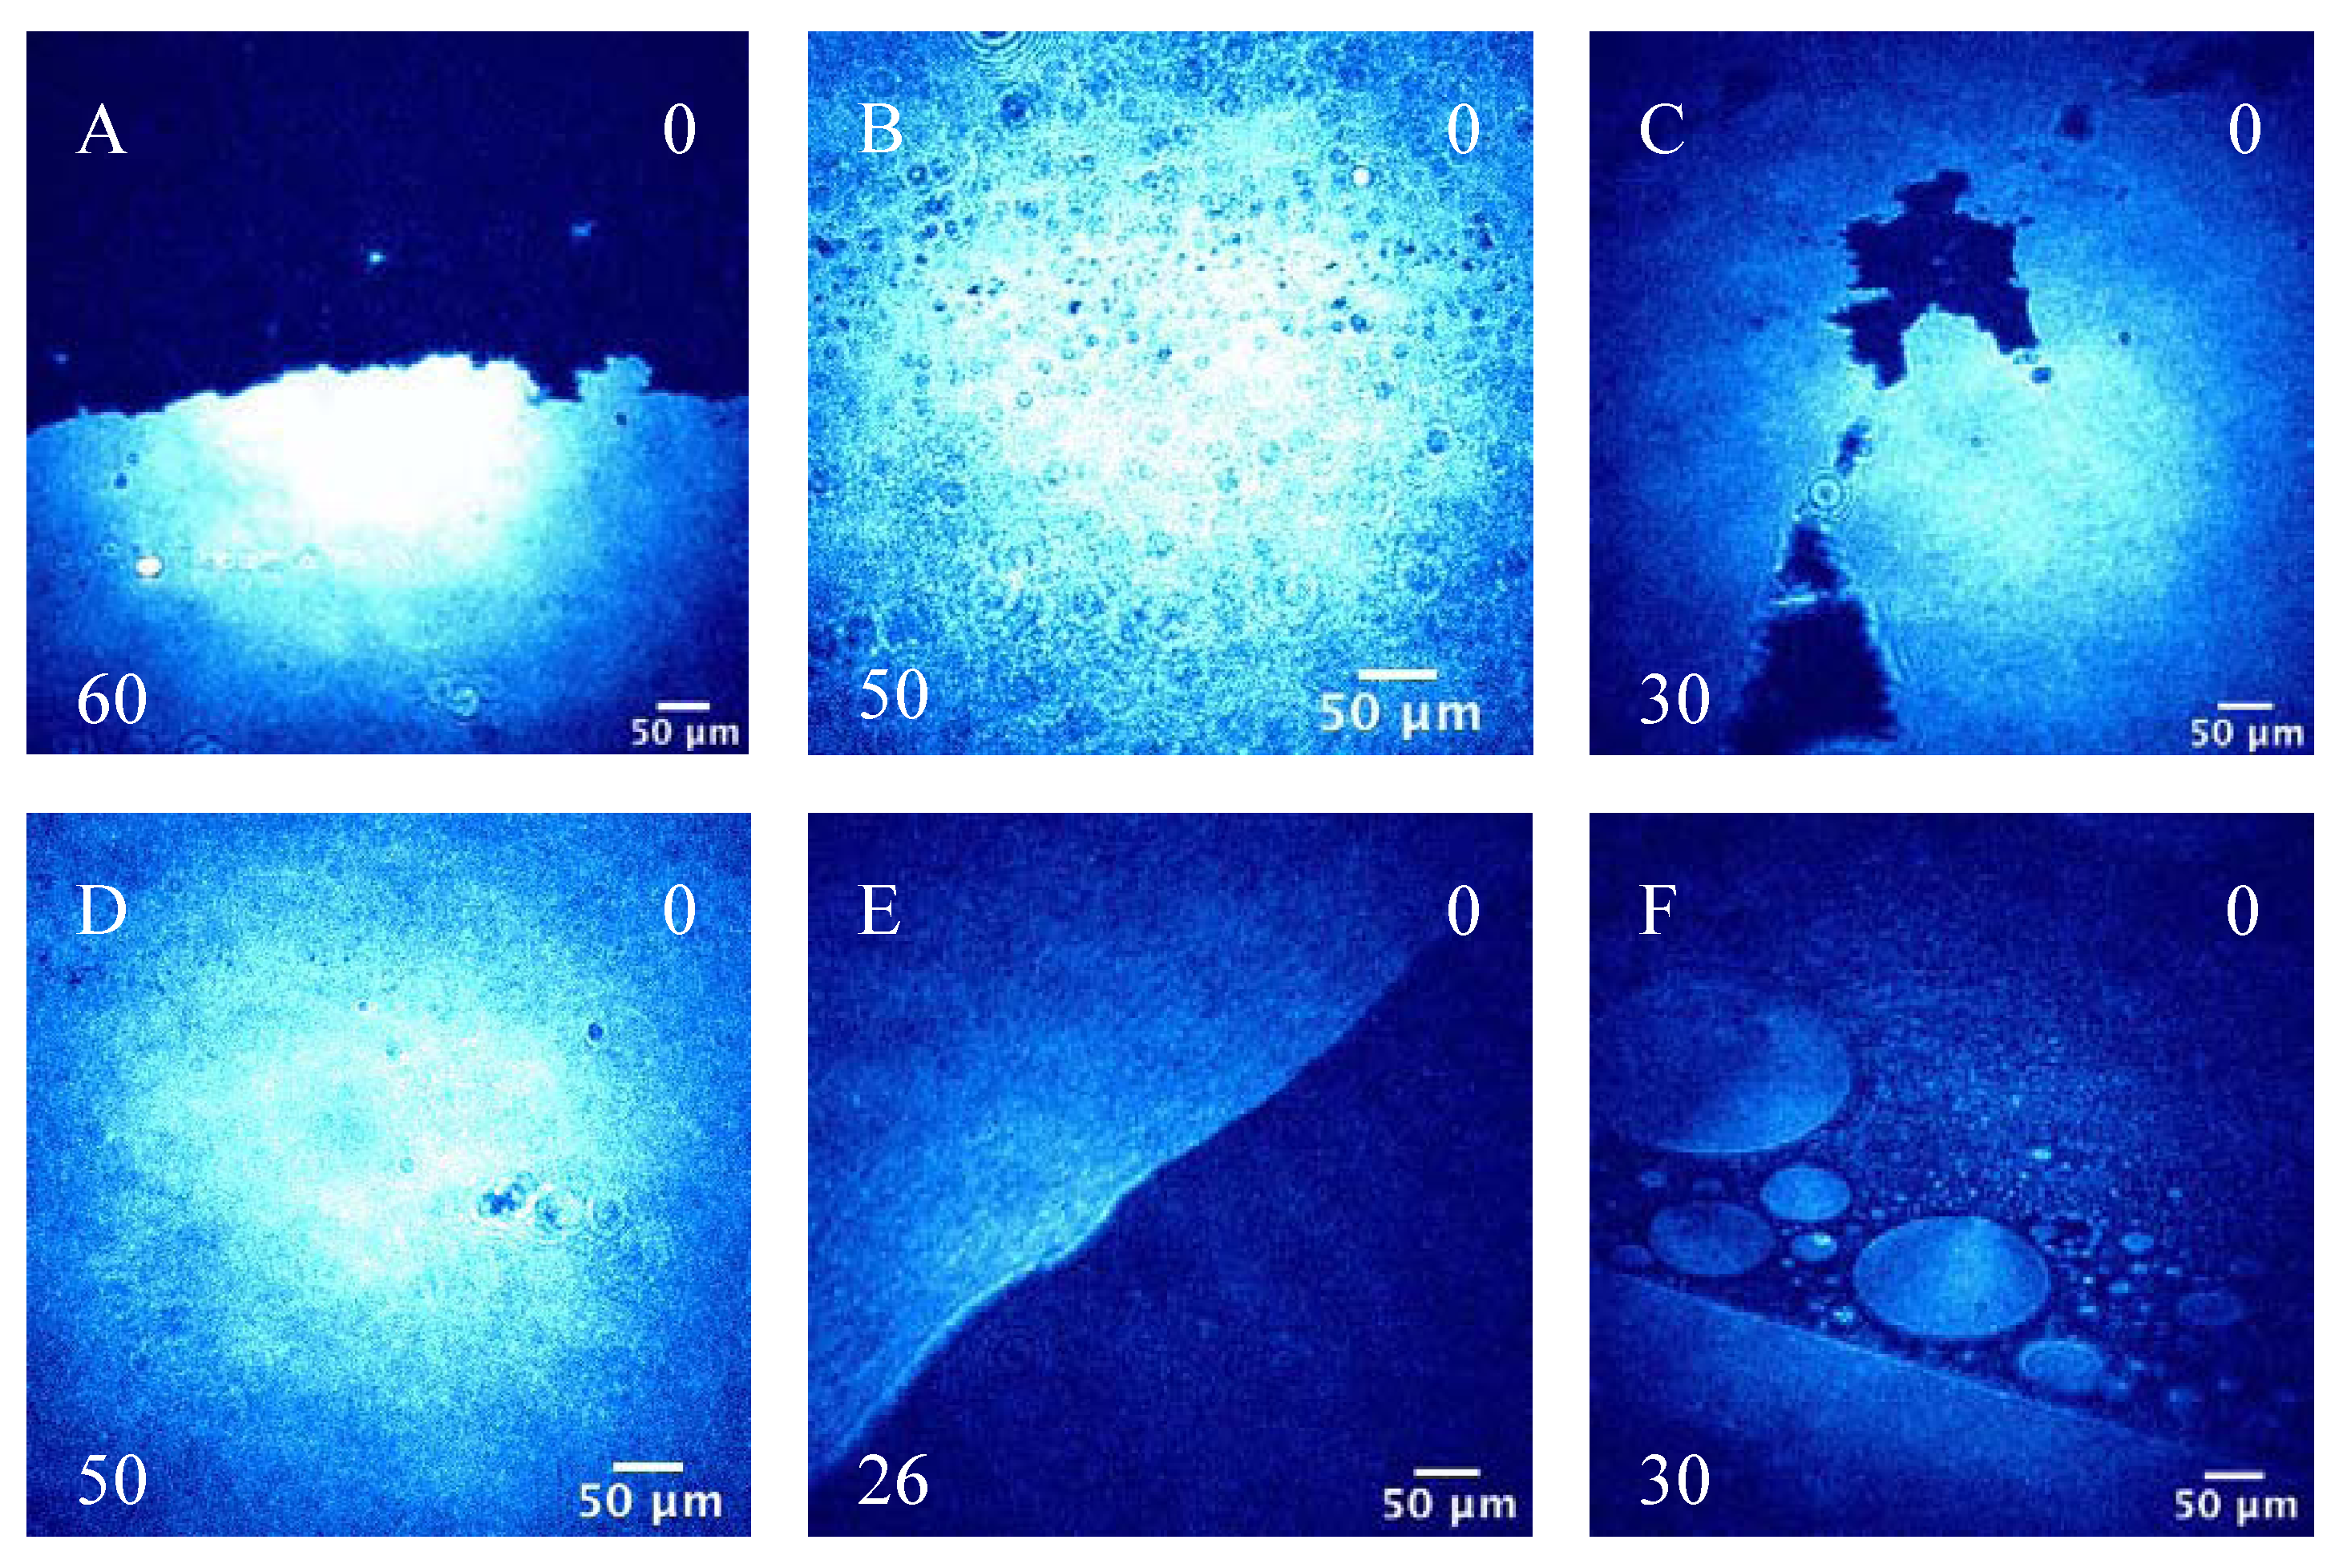
The π-A isotherms of mixed PA/cerebrosides monolayers at various compositional ratios on pure water can be seen in Figure 4. To the best of the author’s knowledge the phase behavior for a mixture of porcine cerebrosides with HFAs and NFAs has not been previously reported. Compared to results reported for bovine HFA and NFA cerebrosides, the shape of the isotherms is similar [67,68]. The MMA of the G-LC transition and the collapse pressure differ, but this is mostly attributed to variations in acyl chain composition. The G-LC to LC transition (evidenced by BAM) of cerebrosides occurs at 38 Å2/molecule. The transition is fluid-like and lacks discontinuities. Surface pressure steadily increases up to approximately 50 mN/m, where the collapse phase begins. Variability in the onset of collapse was observed and typically ranged between 50–60 mN/m. Beyond this point the surface pressure still increases, but more gradually.
Figure 4. π-A isotherms of mixed PA/cerebrosides monolayers with various compositional ratios on water.
Atmosphere 04 00315 g004
From Figure 4 it can be seen that isotherms of PA/cerebrosides mixtures generally lay between that of the pure components, which suggests that PA has a condensing effect on cerebrosides. The exception to this is the 4:1 mixture, which can be compressed to slightly smaller MMAs than pure PA at low surface pressures. A change in phase behavior can be observed between the 3:2 and 2:3 mixtures. The 4:1 and 3:2 mixtures, and the 1:4 and 2:3 mixtures have similar phase behaviors. However a different phase behavior is found between these two pairs of mixtures. Both the 4:1 and 3:2 mixtures have G-LC to LC transitions at approximately 26 Å2/molecule. Two LC phases are present, in which a kink occurs at 15 mN/m for both mixtures. The collapse phase also occurs at the same surface pressure (51 mN/m) for these mixtures. However, only one LC phase is observed for the 1:4 and 2:3 mixtures, and their collapse phases are at lower surface pressures, at 41 and 44 mN/m, respectively.
Notable for the 1:4 and 2:3 mixtures is that the surface pressure begins increasing at a molecular area larger than that of pure cerebrosides. For the 4:1 mixture this occurs at 47 Å2/molecule. The surface pressure slowly increases to about 2 mN/m until 36 Å2/molecule, where the surface pressure rapidly increases. Similarly, for the 2:3 mixture, the surface pressure begins increasing at 46 Å2/molecule until it reaches a value of 2 mN/m at 30 Å2/molecule, where it then rapidly increases. The expansion of these monolayers relative to pure cerebrosides indicates that repulsive interactions occur in the low-pressure regime.
Miscibility of mixed monolayers can be determined from the collapse pressures. Typically, if components in a binary mixture are immiscible two distinct collapse pressures corresponding to the pure components will be observed. Collapse pressures for mixed PA/cerebrosides monolayers at various compositions can be seen in Figure 5. Dashed lines indicate collapse pressures of pure components. Two data points at χ PA = 0 show the range of collapse pressures observed for cerebrosides. Only one collapse pressure was observed for each mixture, and values are between those of the pure components. The presence of one collapse pressure for each mixture indicates that “squeezing out” of PA did not occur, resulting in a collapse at 40 mN/m. As no such feature is observed in the π-A isotherms, it was determined that binary mixtures of PA/cerebrosides are miscible. The decrease in collapse pressure as cerebrosides content increases indicates that stability of the mixed films decreases with increasing cerebrosides content. The observed trend suggests that the interactions between the cerebrosides and PA are more favorable when a small amount of cerebroside is present. This may be due to a preferential hydrogen-bonding network between the cerebrosides and PA headgroups, which becomes disrupted when more cerebroside molecules are present.
Figure 5. Collapse pressures of mixed PA/cerebrosides monolayers as a function of PA chemical composition.
Atmosphere 04 00315 g005
Miscibility of mixed films can also be determined from the additivity rule [59,69].
Atmosphere 04 00315 i001
The additivity rules states that at a specific surface pressure the MMA of a mixed film, A12, is related to the molecular area (A1 and A2) and mole fraction (χ1 and χ2) of the pure components. If the two components obey the additivity rule the film is immiscible or behaves ideally, i.e., the interactions between the two components are the same as the interactions between molecules of a single component. Therefore any deviation from the additivity rule indicates miscibility and non-ideal behavior. Figure 6 shows plots of A12 vs. χ PA at 5, 20, and 35 mN/m. Since deviations from the additivity rule are seen for all surface pressures, PA and cerebrosides mixtures are miscible. Negative deviations are observed for most mole fractions, which suggest that the interactions between PA and cerebrosides molecules are stronger than the interactions of each molecule with itself. However, at χ PA = 0.2 small positive deviations were seen for low surface pressures, suggesting interactions between the two components are weaker. As surface pressure increases the deviation disappears, suggesting that interactions between molecules are stronger as they are forced closer together.
Interactions between molecules can also be evaluated from the excess free energy of mixing, ∆Gex. For a mixed monolayer at constant surface pressure and temperature ∆Gex is defined by
Atmosphere 04 00315 i002
where π is the surface pressure. Figure 7 shows ∆Gex as function of composition of mixed the PA/cerebrosides monolayers. Values for ∆Gex are all negative with the exception of χ PA = 0.2 at 5 and 20 mN/m. This indicates that interactions between cerebrosides and PA are mostly attractive. The values of ∆Gex become more negative with increasing surface pressure, suggesting that the mixed monolayer is more stable at higher surface pressures. This may be due to stronger interactions between molecules as the monolayer is condensed. A minimum in the ∆Gex values can be seen in each curve at χ PA = 0.6, indicating that this composition is the most thermodynamically stable.
Figure 6. Mean molecular areas (MMAs) of PA/cerebrosides mixtures as a function of PA chemical composition at various surface pressures.
Atmosphere 04 00315 g006
Figure 7. Excess free energies of mixing of PA/cerebrosides mixtures as a function of PA chemical composition at various surface pressures.
Atmosphere 04 00315 g007
The thermodynamic stability of the mixed monolayer compared to the pure components can also be determined from the free energy of mixing
Atmosphere 04 00315 i003
where ∆Gideal can be calculated based on experimental conditions,
Atmosphere 04 00315 i004
where R is the ideal gas constant and T is the (absolute) temperature. Figure 8 shows ∆Gmix as a function of monolayer composition. All values of ∆Gmix are negative, indicating that mixed films of cerebrosides and PA are thermodynamically stable, especially at χ PA = 0.6.
Figure 8. Free energies of mixing of PA/cerebrosides mixtures as a function of PA chemical composition at various surface pressures.
Atmosphere 04 00315 g008
As mentioned above, it is observed that PA has a condensing effect on cerebrosides. Such an effect may be due to hydrogen bonding between the different headgroups. PA has a carboxyl headgroup with a pKa of ~8.7 on pure water [70,71]. The surface pKa of carboxylic acids differs greatly from the bulk value (~4.5). The pKa is an indirect measure of the protonation state and indicates that the carboxyl groups are mostly protonated at a subphase pH of 5.6. The cerebrosides have a galactose headgroup with several hydroxyl groups. The carboxyl group of PA may serve as a bridging structure onto which hydroxyl groups from neighboring galactose groups preferentially hydrogen bond instead with neighboring water molecules (Figure 9). Such behavior would result in closely packed headgroups, as the solvation shell of the galactose is now partially replaced with PA carboxyl groups. Van der Waals interactions most likely also help facilitate condensation, as acyl chains of similar length and structure could easily pack together.
Figure 9. Possible hydrogen bonding network between PA and cerebroside headgroups. Hydrogen bonds are indicated by dashed lines.
Atmosphere 04 00315 g009

3.2.2. BAM Images

BAM images of mixed PA/cerebrosides monolayers at a surface pressure of 0 mN/m are shown in Figure 10. Domains are visible at large surface areas for all compositions, indicating the presence of a G-LC coexistence region. Pure cerebrosides (Figure 10A) have bright, irregularly shaped condensed-like domains. Results reported here for the G-LC coexistence region differ from BAM images of pure bovine galactocerebrosides, where asymmetrical, wire-shaped domains were observed [72]. However, the authors described the domains as rigid clusters with irregular boundaries, which is consistent with results reported here. Differences in visual appearance of the domains in the G-LC coexistence phase may be due to experimental conditions or fatty acid composition of the respective cerebrosides.
Mixtures of PA/cerebrosides are shown in Figure 10B–E. The surface morphology of all mixtures in the G-LC coexistence region resembles that of pure cerebrosides, where mixtures have large domain structures similar to cerebrosides. However, the 1:4 mixture varies in appearance when compared to pure cerebrosides and all other mixtures, in which the domains have a foam-like appearance. Circular domains similar to pure PA (Figure 10F) were not observed for any mixture. This indicates that in the G-LC coexistence region PA and cerebrosides form a homogeneous mixture with no phase separation. The resemblance of mixtures to pure cerebrosides suggests that the galactose headgroup is the dominant factor in determining surface morphology. As discussed previously, hydrogen bonding between PA and cerebrosides headgroups may be favorable, which may result in a surface structure that resembles cerebrosides.
Figure 10. BAM images of the G-LC coexistence region of mixed PA/cerebrosides monolayers for various compositions: (A) 0:1; (B) 1:4; (C) 2:3; (D) 3:2; (E) 4:1; (F) 1:0. Mean molecular area (Å2/molecule) and surface pressure (mN/m) values are indicated in the bottom left and top right corners, respectively.
Atmosphere 04 00315 g010
BAM images of the collapse phase of PA/cerebrosides mixtures as a function of monolayer composition are shown in Figure 11. Condensed phase BAM images of all monolayers appeared similar in morphology when compared to each other and did not provide additional information on miscibility and are therefore not shown. The collapse phase of pure cerebrosides (Figure 11A) shows crystalline-like line-shaped collapse structures. A cross-hatched pattern behind the white line structures is also visible in the image. Pure PA (Figure 11F) has bright, large aggregate collapse structures that are consistent with previously obtained results [42]. Collapse structures of PA/cerebrosides mixtures depended upon the monolayer composition. The 4:1 PA/cerebrosides mixture (Figure 11E) had the most unique collapse phase of the mixtures, in that a web-like pattern is present. This suggests that the mechanism of collapse for the 4:1 mixture is different compared to the three other mixtures, as those had similar collapse phase morphologies. Collapse of these films appeared as a uniformly condensed film in which a line-shaped collapse structure may (Figure 11C) or may not (Figure 11B,D) be visible. Line-shaped collapse structures were observed for all three of these compositions, but were not consistently observed for every experiment. Appearance of the line-shaped structure may have been out of the CCD field of view; thus accounting for the inconsistent observation. Although collapse structures for the 1:4, 2:3, and 3:2 mixtures appear similar to that of pure cerebrosides, collapse structures of PA, indicative of “squeezing out” of PA, were not observed for any of the mixed monolayer systems studied. This demonstrates that the line-shaped collapse structures are unique to the monolayer composition, meaning that they cannot be attributed to either of the pure components, and therefore mixed films of PA/cerebrosides are miscible.
Figure 11. BAM images of the collapse phase of mixed PA/cerebrosides monolayers for various compositions: (A) 0:1; (B) 1:4; (C) 2:3; (D) 3:2; (E) 4:1; (F) 1:0. Mean molecular area (Å2/molecule) and surface pressure (mN/m) values are indicated in the bottom left and top right corners, respectively.
Atmosphere 04 00315 g011

4. Conclusions

In this study surface pressure-area isotherms, BAM, and VSFG spectroscopy were used to investigate the effect of several salt solutions on a PA monolayer. It was determined that all salt solutions used, CaCl2, MgCl2, and ASW, altered the phase behavior and surface morphology of the monolayer film. VSFG spectra revealed that Mg2+ and Ca2+ ions induced ordering of the acyl chains. At lower concentrations, Ca2+ had a larger effect on the surface morphology and chain ordering, which suggests that Ca2+ interacts with the monolayer more strongly than Mg2+. At higher concentrations the effect of Ca2+ and Mg2+ were comparable. ASW caused a condensation of the monolayer, resulting in a surface morphology that is markedly different from that of pure water. From these studies it is concluded the surface morphology of a monolayer depends upon the subphase composition, mainly the nature of the salt and the concentration.
Also investigated were mixed monolayers of PA and cerebrosides using Langmuir surface pressure–area isotherms and BAM. Collapse pressures and surface morphology of PA/cerebrosides films indicated that the two components are miscible. Phase behavior of the mixtures was observed to lie between those of the pure components. This condensing effect is most likely facilitated by hydrogen bonding between the different headgroups. Surface morphology of mixtures in the low-pressure regime varied little from pure cerebrosides, also suggesting hydrogen bonding of headgroups occurs. Thermodynamic analysis of the surface pressure-area isotherms also indicated that the mixed films were miscible, and that the mixed monolayer with χ PA = 0.6 appears to be the most stable.

5. Atmospheric Implications

PA Langmuir films were used as a proxy for atmospheric aerosols. It is clear that salts significantly affect the surface morphology of PA films on the aqueous surface. Here, MgCl2, CaCl2, and ASW caused condensation of the surface film, leading to tightly packed molecules. Packing of molecules affects the rate of water transfer in aerosols, and it is likely that a tightly packed film would impede water evaporation and uptake. In contrast, condensation of the monolayer results from molecules occupying a smaller mean molecular area, which could lead to the formation of pores within the organic layer. The presence of pores would facilitate water transfer in this region, causing the size of the aerosol to change as water content is lost or gained. Alteration in aerosol size affects other aerosol properties, such as scattering efficiency. Subphase composition, therefore, does not only directly effect surface morphology, but also indirectly influences all properties of the aerosol. Thus, to better understand the nature of organic-coated aerosols the complexity of the aqueous core should be accurately represented.
The surface morphology of PA films is also observed to vary in different phases, which is indicative of the surface concentration of PA molecules. The different phases are representative of aerosols with varying surfactant coverage. Aerosols with little surfactant coverage (as seen in the G-LC region) have large regions of exposed subphase, while aerosols with sufficient coverage (UC region) have a uniform, tightly packed monolayer. As discussed earlier, the rate of water evaporation and uptake is determined by molecular packing, and aerosols with varying surfactant coverage are expected to experience different rates of water transfer. The molecular organization of the surface film is effected by the chemical composition, as is evident from the condensing effect that PA has on cerebrosides. Interaction of different molecules, whether favorable or unfavorable, will determine the packing density on the aerosol surface. Surfactant coverage also influences heterogeneous chemical reactions at the surface. Acyl chains that are tightly packed in an all trans configuration, indicative of sufficient aerosol coverage, may less likely undergo chemical processes, such as oxidation. From these studies it is evident that surface morphology of aerosol particles is dependent upon surface concentration and chemical composition.

Acknowledgments

We thank National Science Foundation, NSF CHE-1111762, for funding this work. E.M.A. thanks Zishuai Huang for the contribution of BAM images.

Conflicts of Interest

The authors declare no conflict of interest.

References

  1. Finlayson-Pitts, B.J.; Pitts, J.N., Jr. Chemistry of the Upper and Lower Atmosphere; Academic Press: San Diego, CA, USA, 2000. [Google Scholar]
  2. Ellison, G.B.; Tuck, A.F.; Vaida, V. Atmospheric processing of organic aerosols. J. Geophys. Res. 1999, 104, 11633–11641. [Google Scholar] [CrossRef]
  3. Jimenez, J.L.; Canagaratna, M.R.; Donahue, N.M.; Prevot, A.S.H.; Zhang, Q.; Kroll, J.H.; DeCarlo, P.F.; Allan, J.D.; Coe, H.; Ng, N.L.; et al. Evolution of organic aerosols in the atmosphere. Science 2009, 326, 1525–1529. [Google Scholar] [CrossRef]
  4. Rinaldi, M.; Decesari, S.; Finessi, E.; Giulianelli, L.; Carbone, C.; Fuzzi, S.; O’Dowd, C.D.; Ceburnis, D.; Facchini, M.C. Primary and secondary organic marine aerosol and oceanic biological activity: recent results and new perspectives for future studies. Adv. Meterol. 2010. [Google Scholar] [CrossRef]
  5. O’Dowd, C.D.; Facchini, M.C.; Cavalli, F.; Ceburnis, D.; Mircea, M.; Decesari, S.; Fuzzi, S.; Yoon, Y.J.; Putaud, J.P. Biogenically driven organic contribution to marine aerosol. Nature 2004, 431, 676–680. [Google Scholar] [CrossRef]
  6. Yoon, Y.J.; Ceburnis, D.; Cavalli, F.; Jourdan, O.; Putaud, J.P.; Facchini, M.C.; Decesari, S.; Fuzzi, S.; Sellegri, K.; Jennings, S.G.; et al. Seasonal characteristics of the physiochemical properties of North Atlantic marine atmospheric aerosols. J. Geophys. Res. 2007, 112. [Google Scholar] [CrossRef]
  7. Laurain, A.M.; Reid, J.P. Characterizing internally mixed insoluble organic inclusions in aqueous aerosol droplets and their influence on light absorption. J. Phys. Chem. 2009, 113, 7039–7047. [Google Scholar] [CrossRef]
  8. Sierra-Hernandez, M.R.; Allen, H.C. Incorporation and exclusion of long chain alkyl halides in fatty acid monolayers at the air-water interface. Langmuir 2010, 26, 18806–18816. [Google Scholar] [CrossRef]
  9. Quinn, P.K.; Kapustin, V.N.; Bates, T.S.; Covert, D.S. Chemical and optical properties of marine boundary layer aerosol particles of the mid-Pacific in relation to sources and meteorological transport. J. Geophys. Res. 1996, 101, 6931–6951. [Google Scholar] [CrossRef]
  10. Beaver, M.R.; Freedman, M.A.; Hasenkopf, C.A.; Tolbert, M.A. Cooling enhancement of aerosol particles due to surfactant precipitation. J. Phys. Chem. 2010, 114, 7070–7076. [Google Scholar] [CrossRef]
  11. Novakov, T.; Corrigan, C.E.; Penner, J.E.; Chuang, C.C. Organic aerosols in the Caribbean trade winds: A natural source? J. Geophys. Res. 1997, 102, 21307–21313. [Google Scholar]
  12. Garland, R.M.; Wise, M.E.; Beaver, M.R.; Dewitt, H.L.; Aiken, A.C.; Jimenez, J.L.; Tolbert, M.A. Impact of palmitic acid coating on the water uptake and loss of ammonium sulfate particles. Atmos. Chem. Phys. 2005, 5, 1951–1961. [Google Scholar] [CrossRef]
  13. Abbatt, J.P.D.; Broekhuizen, K.; Kumar, P.P. Cloud condensation nucleus activity of internally mixed ammonium sulfate/organic acid aerosol particles. Atmos. Envrion. 2005, 39, 4767–4778. [Google Scholar] [CrossRef]
  14. Fuzzi, S.; Andreae, M.O.; Huebert, B.J.; Kulmala, M.; Bond, T.C.; Boy, M.; Doherty, S.J.; Guenther, A.; Kanakidou, M.; Kawamura, K.; et al. Critical assessment of the current state of scientific knowledge, terminology, and research needs concerning the role of organic aerosols in the atmosphere, climate, and global change. Atmos. Chem. Phys. 2006, 6, 2017–2038. [Google Scholar] [CrossRef]
  15. Rudlich, Y. Laboratory perspectives on the chemical transformations of organic matter in atmospheric particles. Chem. Rev. 2003, 103, 5097–5124. [Google Scholar] [CrossRef]
  16. Rogge, W.F.; Mazurek, M.A.; Hildenmann, L.M.; Cass, G.R. Qualification of urban organic aerosols at a molecular level: Identification, abundance, and seasonal variation. Atmos. Environ. 1993, 27A, 1309–1330. [Google Scholar]
  17. Simoneit, B.R.T. Application of molecular marker analysis to reconcile sources of carbonaceous particulates in tropospheric aerosols. Sci. Total Environ. 1984, 36, 61–72. [Google Scholar] [CrossRef]
  18. Sicre, M.A.; Marty, J.C.; Saliot, A. n-Alkanes, fatty acid esters, and fatty acid salts in size fractioned aerosols collected over the Mediterranean Sea. J. Geophys. Res. 1990, 95, 3649–3657. [Google Scholar] [CrossRef]
  19. Gogou, A.I.; Apostolaki, M.; Stephanou, E.G. Determination of organic molecular markers in marine aerosols and sediments: one-step flash chromatography compound class fractionation and capillary gas chromatographic anaylsis. J. Chromatogr. 1998, 799, 215–231. [Google Scholar] [CrossRef]
  20. Gogou, A.; Stratigakis, N.; Kanakidou, M.; Stephanou, E.G. Organic aerosols in Eastern Mediterranean: Components source reconciliation by using molecular markers and atmospheric back trajectories. Org. Geochem. 1996, 25, 79–96. [Google Scholar] [CrossRef]
  21. Barbier, M.; Tusseau, D.; Marty, J.C.; Saliot, A. Sterols in aerosols, surface microlayer, and subsurface water in the North-Eastern tropical Atlantic. Ocean. Acta 1981, 4, 77–84. [Google Scholar]
  22. Barger, W.R.; Garrett, W.D. Surface active organic material in the marine atmosphere. J. Geophys. Res. 1970, 75, 4561. [Google Scholar] [CrossRef]
  23. Barger, W.R.; Garrett, W.D. Surface active organic material in air over the mediterranean and over the Eastern Equatorial Pacific. J. Geophys. Res. 1976, 81, 3151. [Google Scholar] [CrossRef]
  24. Duce, R.A.; Mohnen, V.A.; Zimmerman, P.R.; Grosjean, D.; Cautreels, W.; Chatfield, R. Organic material in the global troposphere. Rev. Geophys. Space Phys. 1983, 21, 921–952. [Google Scholar] [CrossRef]
  25. Crahan, K.K.; Hegg, D.A.; Covert, D.S.; Jonsson, H.; Reid, J.S.; Khelif, D.; Brooks, B.J. Speciation of organic aerosols in the tropical mid-pacific and their relationshipe to light scattering. J. Atmos. Sci. 2004, 61, 2544–2558. [Google Scholar] [CrossRef]
  26. Tervahattu, H.; Hartonen, K.; Kerminen, V.; Kupiainen, K.; Aarnio, P.; Koskentalo, T.; Tuck, A.F.; Vaida, V. New evidence of an organic layer on marine aerosols. J. Geophys. Res. 2002, 107. [Google Scholar] [CrossRef]
  27. Tervahattu, H.; Juhanoja, J.; Kupiainen, K. Identification of an organic coating on marine aerosol particles by TOF-SIMS. J. Geophys. Res. 2002, 107. [Google Scholar] [CrossRef]
  28. Dobson, C.M.; Ellison, G.B.; Tuck, A.F.; Vaida, V. Atmospheric aerosols as prebiotic chemical reactors. Proc. Natl. Acad. Sci. USA 2000, 97, 11864–11868. [Google Scholar] [CrossRef]
  29. Donaldson, D.J.; Vaida, V. The influence of organic films at the air-aqueous boundary on atmospheric processes. Chem. Rev. 2006, 106, 1445–1461. [Google Scholar] [CrossRef]
  30. Lawrence, J.R.; Glass, S.V.; Nathanson, G.M. Evaporation of water through butanol films at the surface of supercooled sulfuric acid. J. Phys. Chem. 2005, 109, 7449–7457. [Google Scholar] [CrossRef]
  31. Langmuir, I.; Schaefer, J. The effect of dissolved salts on insoluble monolayers. J. Am. Chem. Soc. 1937, 59, 2400–2414. [Google Scholar] [CrossRef]
  32. Deamer, D.W.; Cornwell, D.G. Calcium action on fatty acid and phospholipid monolayers and its relation to the cell membrane. Biochim. Biophys. Acta 1966, 116, 555–562. [Google Scholar] [CrossRef]
  33. MacDonald, R.C.; Simon, S.A.; Baer, E. Ionic influences on the phase transitions of dipalmitoylphosphatidylserine. Biochemistry 1976, 15, 885–891. [Google Scholar] [CrossRef]
  34. Seimiya, T.; Ishiwata, S.; Watanabe, N.; Miyasaka, H.; Iwahashi, M.; Tajima, K.; Hayashi, M.; Muramatsu, T. Effect of structural separation between phosphate and ammonium groups of phospholipids on calcium binding properties as studied by pressure-area analysis of the monolayer. J. Colloid Interface Sci. 1984, 101, 267–276. [Google Scholar] [CrossRef]
  35. Virden, J.W.; Berg, J.C. NaCl-induced aggregation of dipalmitoylphosphatidylglycerol small unilamellar vesicles with varying amounts of incorporated cholesterol. Langmuir 1992, 8, 1532–1537. [Google Scholar] [CrossRef]
  36. Tang, C.Y.; Allen, H.C. Ionic binding of Na+ versus K+ to the carboxylic acid headgroup of palmitic acid monolayers studied by vibrational sum frequency generation spectroscopy. J. Phys. Chem. 2009, 113, 7383–7393. [Google Scholar] [CrossRef]
  37. Casillas-Ituarte, N.N.; Chen, X.; Castada, H.; Allen, H.C. Na+ and Ca2+ effect on the hydration and orientation of the phosphate group of DPPC at air-water and air-hydrated silica surface. J. Phys. Chem. B 2010, 114, 9485–9495. [Google Scholar] [CrossRef]
  38. Quinn, P.J.; Sherman, W.R. Monolayer characteristics and calcium adsorption to cerebroside and cerebroside sulphate oriented at the air-water interface. Biochim. Biophys. Acta 1971, 233, 734–752. [Google Scholar] [CrossRef]
  39. Colacicco, G.; Buckelew, A.R., Jr.; Scarpelli, E.M. Lipid monolayers: surface viscosity of dipalmitoyl lecithin in relation to surface potential and ion binding. J. Colloid Interface Sci. 1974, 46, 147–151. [Google Scholar] [CrossRef]
  40. Tang, C.Y.; Huang, Z.; Allen, H.C. Binding of Mg2+ and Ca2+ to palmitic acid and deprotonation of the COOH headgroup studied by vibrational sum frequency generation spectroscopy. J. Phys. Chem. B 2010, 114, 17068–17076. [Google Scholar] [CrossRef]
  41. Tang, C.Y.; Huang, Z.; Allen, H.C. Interfacial water structure and effects of Mg2+ and Ca2+ binding to the COOH headgroup of a palmitic acid monolayer studied by sum frequency spectroscopy. J. Phys. Chem. B 2011, 115, 34–40. [Google Scholar] [CrossRef]
  42. Lipp, M.M.; Lee, K.Y.C.; Waring, A.; Zasadzinski, J.A. Fluorescence, polarized fluoresence, and brewster angle microscopy of palmitic acid and lung surfactant protein B monolayers. Biophys. J. 1997, 72, 2783–2804. [Google Scholar] [CrossRef]
  43. Cuvillier, N.; Bernon, R.; Doux, J.-C.; Merzeau, P.; Mingotaud, C.; Delhaes, P. Adsorption of Inorganic poylanions along a langmuir film: A brewster angle microscopy study. Langmuir 1998, 14, 5573–5580. [Google Scholar] [CrossRef]
  44. Aller, J.Y.; Kuznetsova, M.R.; Jahns, C.J.; Kemp, P.F. The sea surface microlayer as a source of viral and bacterial enrichment in marine aerosols. Aerosol Sci. 2005, 36, 801–812. [Google Scholar] [CrossRef]
  45. Muralidhar, P.; Radhika, P.; Krishna, N.; Rao, D.V.; Rao, C.B. Sphingolipids from marine organisms: A Review. Nat. Prod. Sci. 2003, 9, 117–142. [Google Scholar]
  46. Lass, K.; Friedrichs, G. Revealing structural properties of the marine nanolayer from vibrational sum frequency generation spectra. J. Geophys. Res. 2011, 116, C08042. [Google Scholar] [CrossRef]
  47. Hawkins, L.N.; Russell, L.M. Polysaccharides, proteins, and phytoplankton fragments: Four chemically distinct types of marine primary organic aerosol classified by single particle spectromicroscopy. Adv. Meterol. 2010. [Google Scholar] [CrossRef]
  48. Russell, L.M.; Hawkins, L.N.; Frossard, A.A.; Quinn, P.K.; Bates, T.S. Carbohydrate-like composition of submicron atmosphere particles and their production from ocean bubble bursting. Proc. Natl. Acad. Sci. USA 2010, 107, 6652–6657. [Google Scholar]
  49. Facchini, M.C.; Rinaldi, M.; Decesari, S.; Carbone, C.; Finessi, E.; Mircea, M.; Fuzzi, S.; Ceburnis, D.; Flanagan, R.; Nilsson, E.D.; et al. Primary submicron marine aerosol dominated by insoluble organic colloids and aggregates. Geophys. Res. Lett. 2008, 35, L17814. [Google Scholar] [CrossRef]
  50. Pagarete, A.; Allen, M.J.; Wilson, W.H.; Kimmance, S.A.; de Vargas, C. Host-virus shift of the sphingolipid pathway along an Emiliania huxleyi bloom: Survival of the fattest. Env. Microbiol. 2009, 11, 2840–2848. [Google Scholar] [CrossRef]
  51. Michaelson, L.V.; Dunn, T.M.; Napier, J.A. Viral trans-dominant manipulation of algal sphingolipids. Trends Plant Sci. 2010, 15, 651–655. [Google Scholar] [CrossRef]
  52. Vardi, A.; Haramaty, L.; Van Mooy, B.A.S.; Fredricks, H.F.; Kimmance, S.A.; Larsen, A.; Bidle, K.D. Host-virus dyanmics and subcellular controls of cell fate in a natural coccolithophore population. Proc. Natl. Acad. Sci. USA 2012, 109, 19327–19332. [Google Scholar]
  53. Kester, D.R.; Duedall, I.W.; Connors, D.N.; Pytkowicz, R.M. Preparation of artificial seawater. Limnol. Oceanogr. 1967, 12, 176–179. [Google Scholar] [CrossRef]
  54. Millero, F.J.; Feistal, R.; Wright, D.G.; McDougall, T.J. The composition of Standard Seawater and the definition of the References-Composition Salinity Scale. Deep Sea Res. Part I Oceanogr. Res. Pap. 2008, 55, 50–72. [Google Scholar] [CrossRef]
  55. Finlayson, A.C. The pH range of the mohr titration for chloride ion can be usefully extended to 4-10.5. J. Chem. Educ. 1992, 69, 559. [Google Scholar] [CrossRef]
  56. Chen, X.; Huang, Z.; Hua, W.; Castada, H.; Allen, H.C. Reorganization and caging of DPPC, DPPE, DPPG, and DPPS monolayers caused by dimethylsulfoxide observed using brewster angle microscopy. Langmuir 2010, 26, 18902–18908. [Google Scholar] [CrossRef]
  57. Hommel, E.L.; Allen, H.C. Broadband sum frequency generation with two regenerative amplifiers: Temporal overlap of femtosecond and picosecond light pulses. Anal. Sci. 2001, 17, 137–139. [Google Scholar] [CrossRef]
  58. Ma, G.; Allen, H.C. Surface studies of aqueous methanol solutions by vibrational broad bandwidth sum frequency generation spectroscopy. J. Phys. Chem. B 2003, 107, 6343–6349. [Google Scholar] [CrossRef]
  59. Gaines, G.L., Jr. Insoluble Monolayers at Liquid-Gas Interfaces; Interscience Publishers: New York, NY, USA, 1966. [Google Scholar]
  60. Nutting, G.C.; Harkins, W.D. Pressure-area relations of fatty acid and alcohol monolayers. J. Am. Chem. Soc. 1939, 61, 1180–1187. [Google Scholar] [CrossRef]
  61. Fischer, A.; Sackmann, E. Electron microscopy and electron diffraction study of coexisting phases of pure and mixed monolayers transferred onto solid substrates. J. Colloid Interface Sci. 1986, 112, 1–14. [Google Scholar] [CrossRef]
  62. Ma, G.; Allen, H.C. Condensing effect of palmitic Acid on DPPC in mixed langmuir monolayers. Langmuir 2007, 23, 589–597. [Google Scholar] [CrossRef]
  63. Kaganer, V.M.; Moehwald, H.; Dutta, P. Structure and Phase transitions in langmuir monolayers. Rev. Mod. Phys. 1999, 71, 779–819. [Google Scholar] [CrossRef]
  64. Flach, C.R.; Mendelsohn, R.; Rerek, M.E.; Moore, D.J. Biophysical studies of model stratum corneum lipid monolayers by infrared reflection-absorption spectroscopy and brewster angle microscopy. J. Phys. Chem. B 2000, 104, 2159–2165. [Google Scholar] [CrossRef]
  65. Qi, S.; Roser, S.J.; Deutsch, D.; Barker, S.A.; Craig, D.Q.M. A laser imaging and neutron reflection investigation into the monolayer behavior of fatty acids used for taste making microspheres. J. Pharm. Sci. 2008, 97, 1864–1877. [Google Scholar] [CrossRef]
  66. Kundu, S.; Langevin, D. Fatty acid monolayer dissociation and collapse: Effect of pH and cations. Colloids Surf. Physiochem. Eng. Asp. 2008, 325, 81–85. [Google Scholar] [CrossRef]
  67. Johnston, D.S.; Coppard, E.; Chapman, D. A langmuir film balance study of the interactions of ionic and polar solutes with glycolipid monolayers. Biochim. Biophys. Acta 1985, 815, 325–333. [Google Scholar] [CrossRef]
  68. Johnston, D.S.; Chapman, D. The properties of brain galactocerebroside monolayers. Biochim. Biophys. Acta 1988, 937, 10–22. [Google Scholar] [CrossRef]
  69. Chou, T.; Chang, C. Thermodynamic behavior and relaxation processes of mixed DPPC/cholesterol monolayers at the air/water interface. Colloid Surf. B 2000, 17, 71–79. [Google Scholar] [CrossRef]
  70. Gomez-Fernandez, J.C.; Villalain, J. The use of FT-IR for quantitative studies of the apparent pKa of lipid carboxyl groups and dehydration degree of the phosphate group of phospholipids. Chem. Phys. Lipids 1998, 96, 41–52. [Google Scholar] [CrossRef]
  71. Gershevitz, O.; Sukenik, C.N. In situ FTIR-ATR analysis and titration of carboxylic acid-terminated SAMs. J. Am. Chem. Soc. 2004, 126, 482–483. [Google Scholar] [CrossRef]
  72. Rosetti, C.M.; Oliveira, R.G.; Maggio, B. Reflectance and topography of glycosphingolipid monolayers at the air-water interface. Langmuir 2003, 19, 377–384. [Google Scholar] [CrossRef]

