Article

Concentration and Size Distribution of Fungi Aerosol over Oceans along a Cruise Path during the Fourth Chinese Arctic Research Expedition

1
Institute of Polar Environment, School of Earth and Space Sciences, University of Science and Technology of China, Hefei 230026, China
2
School of Life Science, University of Science and Technology of China, Hefei 230026, China
*
Author to whom correspondence should be addressed.
Atmosphere 2013, 4(4), 337-348; https://doi.org/10.3390/atmos4040337
Submission received: 17 September 2013 / Revised: 10 October 2013 / Accepted: 23 October 2013 / Published: 5 November 2013

Abstract

:
Bioaerosol can act as nuclei and thus may play an important role in climate change. During the Fourth Chinese National Arctic Research Expedition (CHINARE 2010) from July to September 2010, the concentrations and size distributions of airborne fungi, which are thought to be one of important bioaerosols, in the marine boundary layer were investigated. The concentrations of airborne fungi varied considerably with a range of 0 to 320.4 CFU/m3. The fungal concentrations in the marine boundary layer were significantly lower than those in most continental ecosystems. Airborne fungi over oceans roughly displayed a decreasing trend with increasing latitudes. The mean concentrations of airborne fungi in the region of offshore China, the western North Pacific Ocean, the Chukchi Sea, the Canada Basin, and the central Arctic Ocean were 172.2 ± 158.4, 73.8 ± 104.4, 13.3 ± 16.2, 16.5 ± 8.0, and 1.2 ± 1.0 CFU/m3, respectively. In most areas airborne fungi showed a unimodal size distribution pattern, with the maximum proportion (about 36.2%) in the range of 2.1~3.3 µm and the minimum proportion (about 3.5%) in the range of 0.65~1.1 µm, and over 50% occurred on the fine size (<3.3 µm). Potential factors influencing airborne fungal concentrations, including the origin of air mass, meteorological conditions, and sea ice conditions, were discussed.

Graphical Abstract

1. Introduction

Bioaerosols are airborne particles that are either released from living organisms or contain living organisms [1,2]. One of the important components of bioaerosols is fungi and fungal spores, as well as their fragments [3]. Fungi in the atmosphere are generally derived from soil, water, animals, plants and human activities. Airborne fungi can cause or exacerbate human, animal and plant diseases [4,5]. In addition, the composition and dynamics of airborne fungi are recently found to play an important role in the transport and reproduction of biological organic matter, and in the changes of atmospheric chemistry and physics [6,7,8]. Airborne fungi may metabolize chemical components of aerosols, thereby modifying the property of atmospheric chemistry. As an important constituent of aerosols, fungal aerosols may affect earth’s radiation budget directly by scattering and absorbing sunlight and by serving as cloud condensation nuclei (CCN) and ice nuclei (IN) [8]. Furthermore, fungal particles are able to act as seeds that could be coated by secondary organic aerosols (SOA) [9] and directly influence the chemical composition of aerosols and CCN.
Concentrations and sizes of airborne fungi have been determined at many sites on land or indoors [10,11,12]. However, information on marine fungal aerosols is still scarce. Atmospheric fungi over oceans can be emitted from the oceanic surface, or transported from continents [13]. Until now, only a few reports on fungal aerosols over oceans have been published. Some previous studies were undertaken over the East China Sea [14], the Atlantic Ocean [15], the Baltic Sea [16], the Pacific Ocean [17,18], the Mediterranean Sea [19], the Indian Ocean, and the Southern Ocean [20]. Nevertheless, most of these studies were conducted in the coastal regions or in the upper atmosphere through aircrafts. More studies about fungi in the marine boundary layer, especially over remote oceans, are needed for a better understanding of their levels, size distributions, sources, and climatic effects.
The Xuelong expeditionary ship set out from Shanghai Harbor in China on 28 June 2010 and came back to Shanghai Harbor on 20 September 2010. During the CHINARE 2010 (July–September 2010) expedition, airborne fungi samples were collected over the East China Sea, the Sea of Japan, the Okhotsk Sea, the Bering Sea, and the Arctic Ocean. Here we report, for the first time, the concentrations and size distributions of airborne fungi by using the six-stage culturable microorganism FA-1 cascade impactor over oceans. The project provides an opportunity to understand airborne fungal particles in the marine boundary layer from low latitude to high latitude. The potential factors influencing the variation of airborne fungi over oceans, including the origin of air mass, meteorological conditions, and the sea ice conditions, were also discussed.

2. Experimental Methods

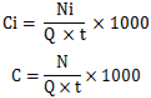
2.1. Sample Collection and Fungi Cultivation
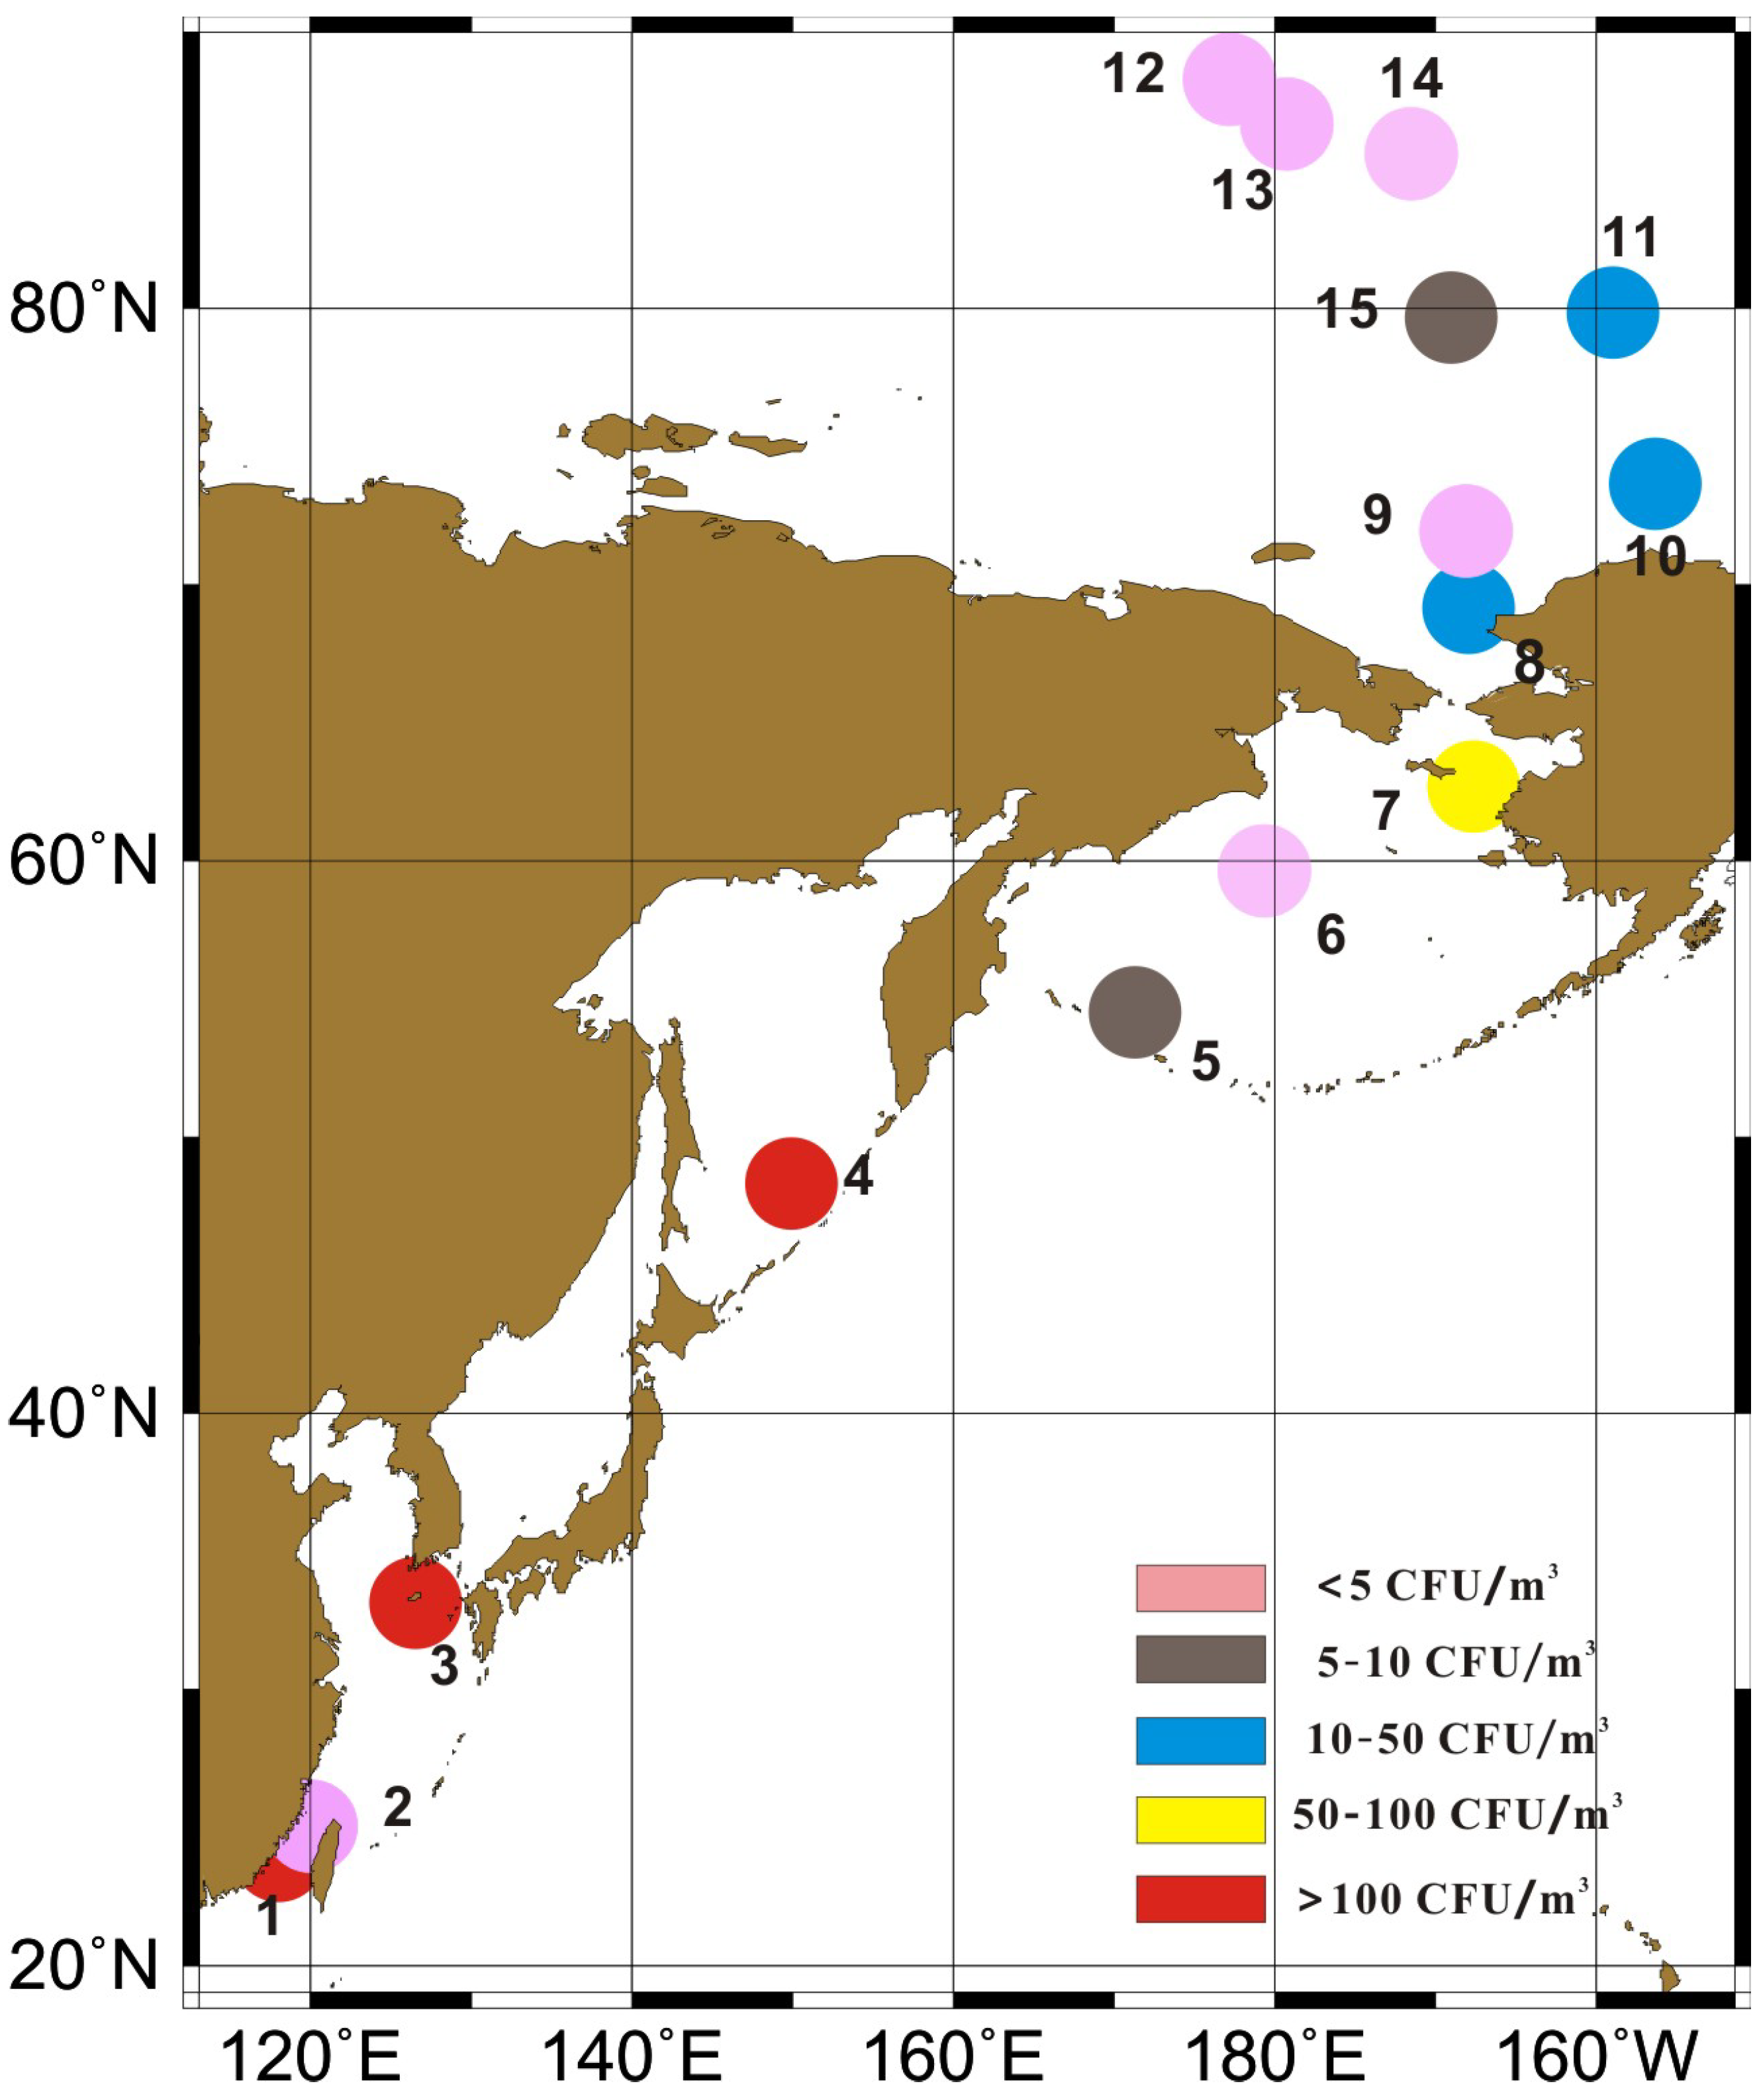
Bioaerosol sampling was conducted during CHINARE 2010. The sampling site was situated on the third deck of the Xuelong ship, which was about 15 m above sea level. The sampling instrument was outside the Xuelong ship, and no personnel were near the instrument during sampling, thus possible contamination from personnel was minimal. Sample collections started on 28 June at Shanghai Harbor and stopped on 25 August over the Arctic Ocean. Samples were collected at 15 locations (Figure 1) during CHINARE 2010, which covered almost every sea region. Eight of these samples were in the Arctic Ocean and the most northern sampling site is located at 88°22′. Detailed sampling information is listed in Table 1. In addition, the air temperature, pressure, wind speed, ship speed and relative humidity on the oceanic surface were simultaneously recorded to investigate the effects of these factors on the airborne fungal concentrations.
Figure 1. Concentrations of airborne fungi in the marine boundary layer during the CHINARE 2010.
Atmosphere 04 00337 g001
Table 1. Sampling location, date, fungal concentrations and meteorological conditions during the CHINARE 2010.
SiteDateTimeLatitude/LongitudeCRHTRVWeather
128 June11:2024°02.17′N 118°04.15′E320.48026.3/Sunny
21 July11:2525°03.511′N 120°06.776′E5.39127.26.7Sunny
34 July01:4033°13.686′N 126°35.142′E190.810024.25.1Heavy fog
48 July01:4048°22.811′N 149°54.791′E224.49011.525.5Light fog
511 July07:3054°34.097′N 171°22.092′E7.1817.68.8Sunny
614 July11:0559°39.629′N 179°25.230′E0.01007.210.5Heavy fog
718 July04:4062°42.473′N 167°38.746′W63.61007.531.0Sprinkle
821 July08:4569°11.664′N 167°54.724′W24.7846.94.6Sunny
924 July06:2071°59.675′N 168°7.530′W1.8863.313.3Sunny
1028 July09:0073°41.119′N 156°22.381′W24.71002.715.3Light fog
111 August09:1579°56.070′N 158°54.212′W15.9880.812.3Light fog
127 August04:3586°41.363′N 179°16.989′E1.886−0.916.7Little snow
1320 August05:5588°22.974′N 177°11.646′W1.887019.0Sunny
1422 August03:2085°37.956′N 171°29.714′W0.0100016.7Light fog
1525 August05:2079°43.302′N 169°3.438′W8.810002.7Light fog
C: Concentration (CFU/m3); RH: Relative humidity (%); T: Temperature (°C); RV: Relative velocity (m/s); /: No data.
The bioaerosol samples were collected by using the six-stage culturable microorganism FA-1 cascade impactors (Applied Technical Institute of Liaoyang, Liaoyang, China) with a flow rate of 28.3 L/min. Each sampling lasted for about 20 min. The aerosol particle sizes were fractionated into six size ranges: Stage I (>7.0 µm), Stage II (4.7–7.0 µm), Stage III (3.3–4.7 µm), Stage IV (2.1–3.3 µm), Stage V (1.1–2.1 µm) and Stage VI (0.65–1.1 µm). The particles were captured by the sampler at different stages depending upon their air dynamic equivalent diameters, and the particles in the same dynamic equivalent diameter settled down in the same Petri dish. These impactors used 9.0 cm Petri dishes containing modified Martin media to collect bioaerosol samples.
The airborne fungi were cultured with the modified Martin media at 37 °C for 3 days [16]. The media were provided by Nanjing Bianzhen biotechnology limited company. After cultivation, the airborne fungal colony number (CFU) for each stage was counted. According to airborne fungal colony number and air flow, the total number of fungal colonies from Stages 1 to 6 was calculated for each sample.
The concentration of airborne fungi was calculated as follows:
Atmosphere 04 00337 i001
where ci and c represent the concentrations on stage i and the total fungal concentrations (CFU/m3), respectively; Ni and N represent the number of fungi on each stage and the total number (CFU), respectively; Q is the sampler air flow (L/min); and t is the sampling time (min).
The colony percentage of airborne fungi for each stage (Pi) was then calculated as:
Atmosphere 04 00337 i002
SPSS 18.0 (SPSS Inc., Chicago, IL, USA) was used to analyze the experimental result. Pearson correlation analysis was also used to test the airborne fungi with meteorological parameters. In addition, we applied a multiple linear regression analysis to interpret the independent influence of meteorological parameters on airborne fungi.

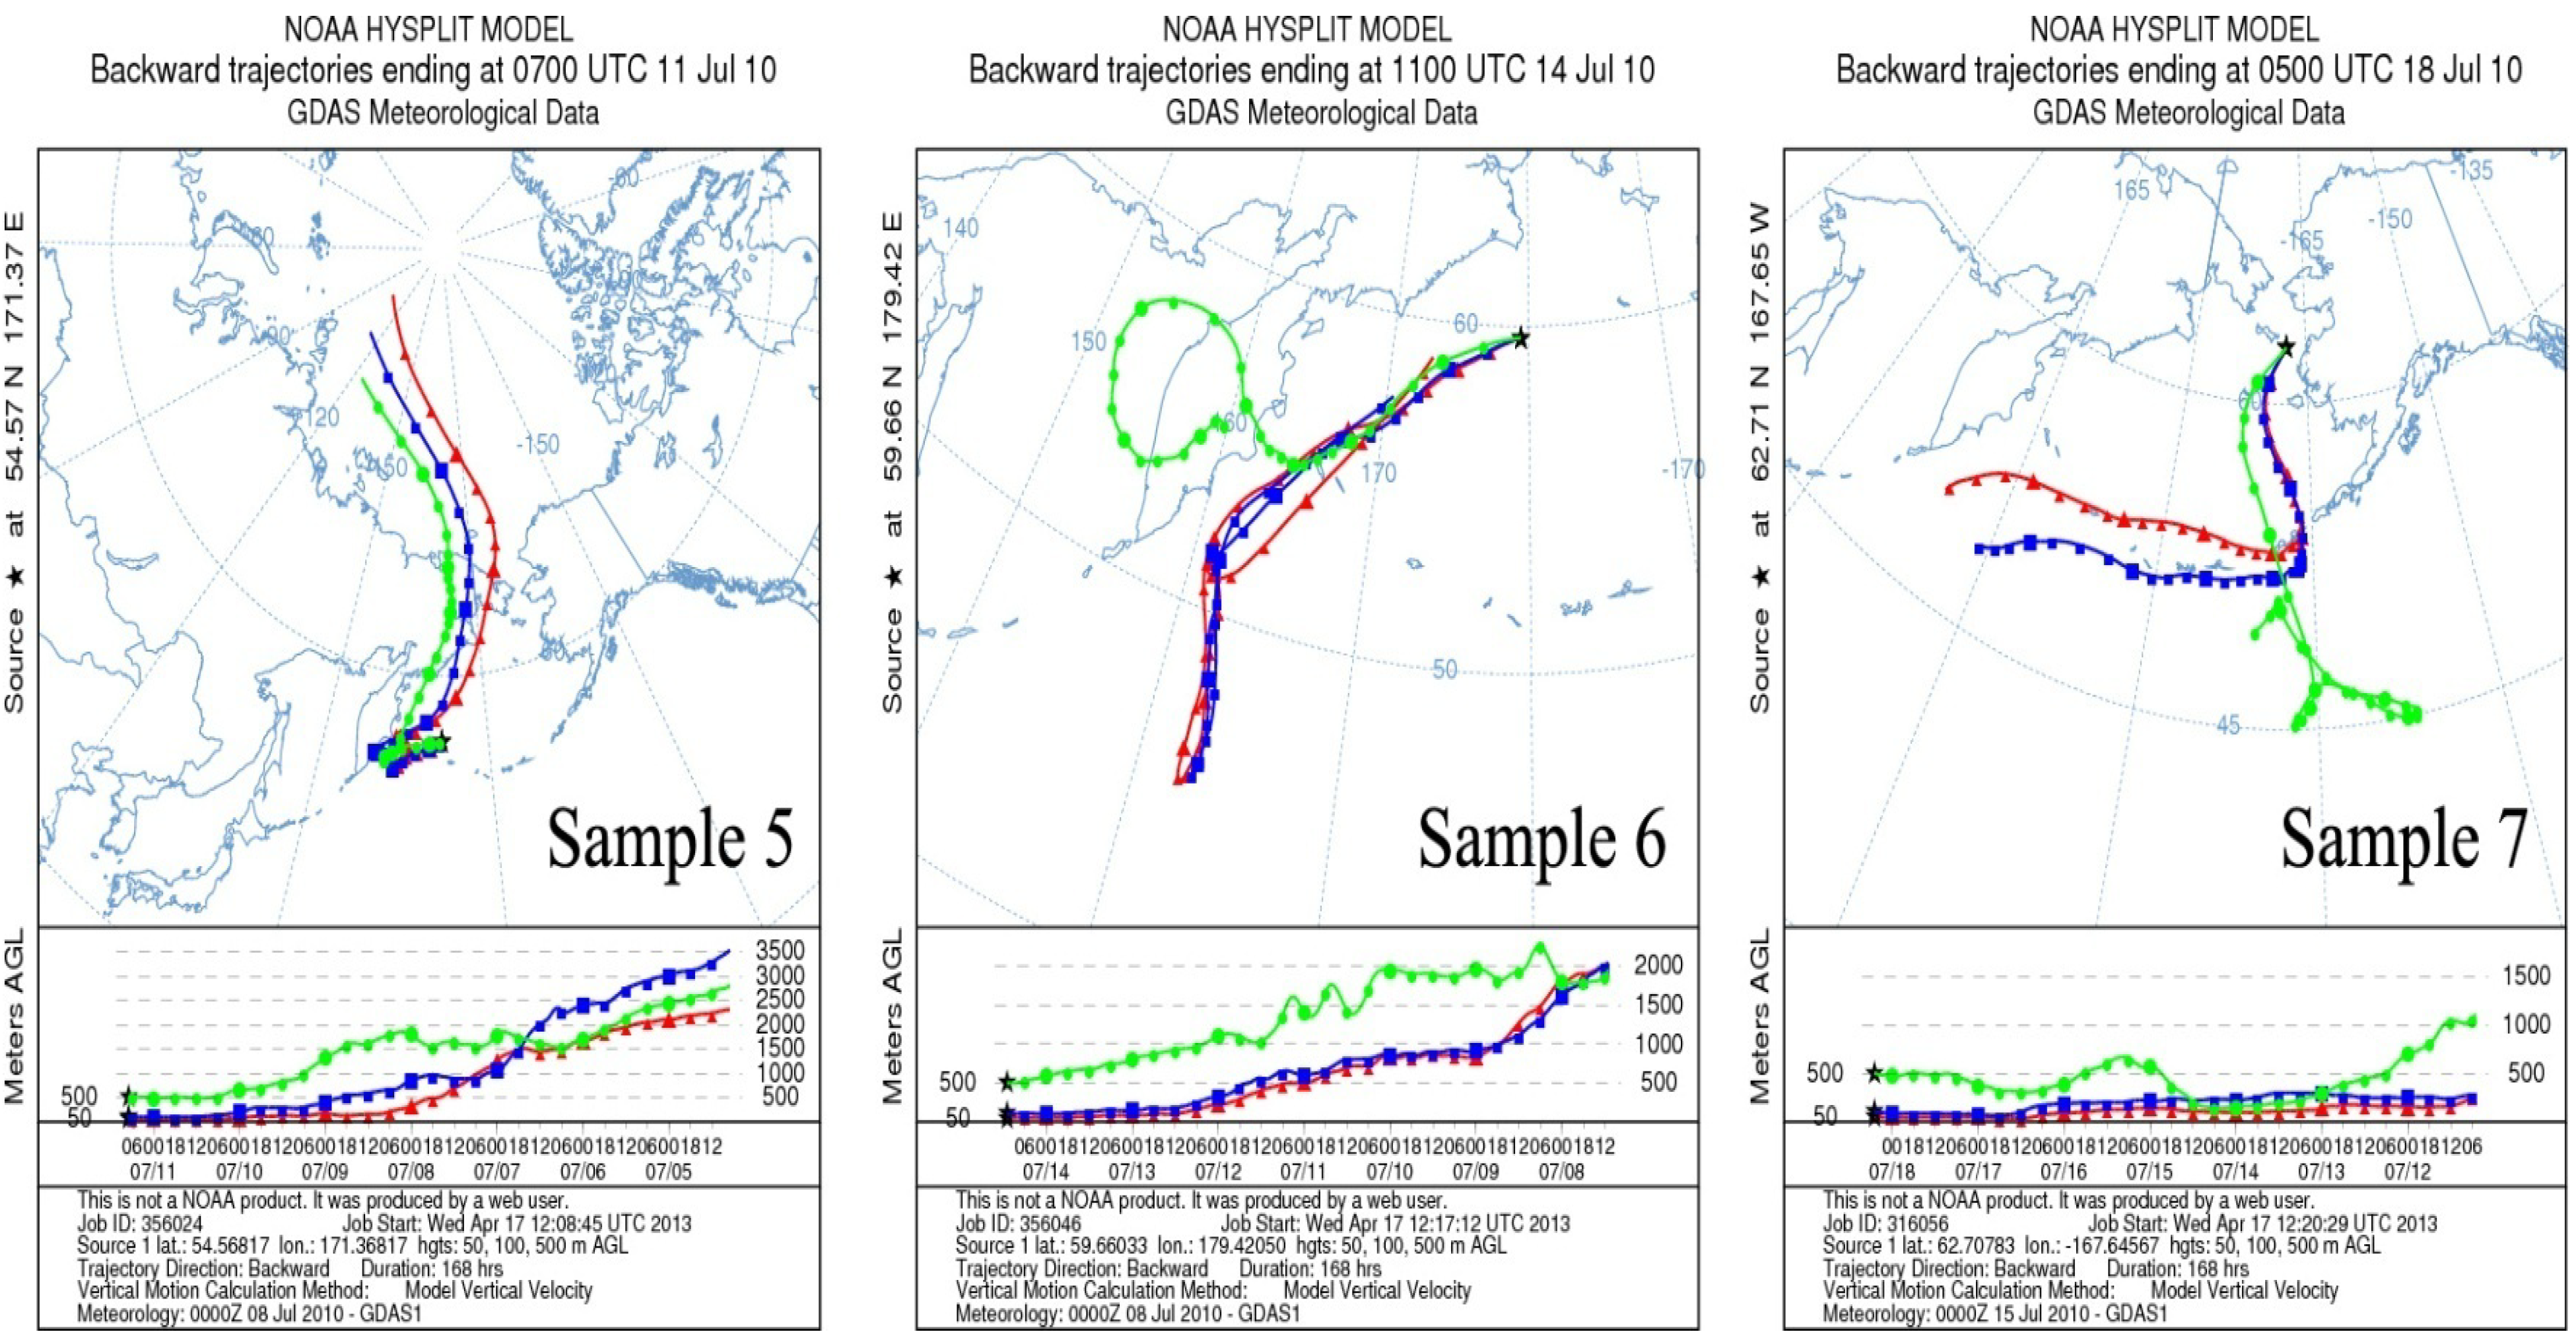
2.2. Air Mass Back Trajectories

In order to identify the origin of air mass origin and the source of airborne fungi, air mass back trajectories (BTs) were traced by the transmission diffusion model of HYSPLIT (HYbrid Single-Particle Lagrangian Integrated Trajectory) from the Air Resources Laboratory of the United States National Oceanic and Atmospheric Administration [21]. Seven-day BTs were shown for each sampling site at three starting altitudes above sea level: 50 m, 100 m and 500 m [13].

3. Results and Discussion

3.1. Concentrations of Cultivable Fungi

The concentrations of airborne fungi along the CHINARE 2010 are shown in Figure 1 and Table 1. During the entire sampling period, the total concentration of airborne fungi ranged from 0 to 320.4 CFU/m3 and varied roughly with latitude. A previous study [22] reported the concentration of airborne fungi in typical ecosystems: 970 CFU/m3 (jungle), 1,015 CFU/m3 (forest), 6,015 CFU/m3 (shrub), 12,545 CFU/m3 (crop), 825 CFU/m3 (grass) and 40 CFU/m3 (moss). Compared to these terrestrial ecosystems, the concentrations of airborne fungi over oceans was clearly lower.
Sampling locations were separated into five geographic groups for further analysis (Table 2): offshore China, the northwestern Pacific Ocean (including the Okhotsk Sea and Bering Sea), the Chukchi Sea, the Canada Basin, and the central region of the Arctic Ocean. The concentrations of airborne fungi over oceans showed an obvious decreasing trend from the Chinese offshore to the Arctic Ocean. The highest concentration was observed in offshore China (5.3–320.4 CFU/m3 with an average of 172 ± 158 CFU/m3). Compared with previous studies, our results were close to those over the East China Sea (0–2,829 CFU/m3, with a mean of 350 CFU/m3) [14], the coast of the Mediterranean (414 ± 340 CFU/m3) [19], and coastal regions of Qingdao (63–815 CFU/m3) [1]. It is evident that the concentrations of airborne fungi in the coastal regions were higher than those in the remote oceans or open sea, e.g., the western North Pacific Ocean, the Chukchi Sea, the Canada Basin, and the central region of the Arctic Ocean. This phenomenon may be ascribed to the influence of continental source, which contains many more fungal spores [23] than the marine air in coastal areas. Few articles have reported the concentration of airborne fungi in remote oceans, e.g., from 0.1 to 6.5 CFU/m3 over the open Baltic Sea [16] and from 3.5 to 34.8 CFU/m3 over the Atlantic Ocean [24]. The observation in the center region of the Arctic Ocean was comparable to these values, indicating that the concentrations of airborne fungi in the Arctic Ocean are low.
Table 2. Concentrations, sea ice and sample site of airborne fungi in different Sea areas.
RegionSample SiteCR CFU/m3Mean ± SD CFU/m3Sea ice Area
Offshore China 1,2,35.3–320.4172.2 ± 158.4/
Northwestern Pacific Ocean4,5,6,70–224.473.8 ± 104.4/
Chuckchi Sea8,91.8–24.713.3 ± 16.2Open sea
Canada Basin10,11,158.8–24.716.5 ± 8.0Floating sea ice
Central Arctic ocean12,13,140–1.81.2 ± 1.0Pack ice region
CR: Concentration Range; /: No data.

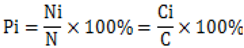
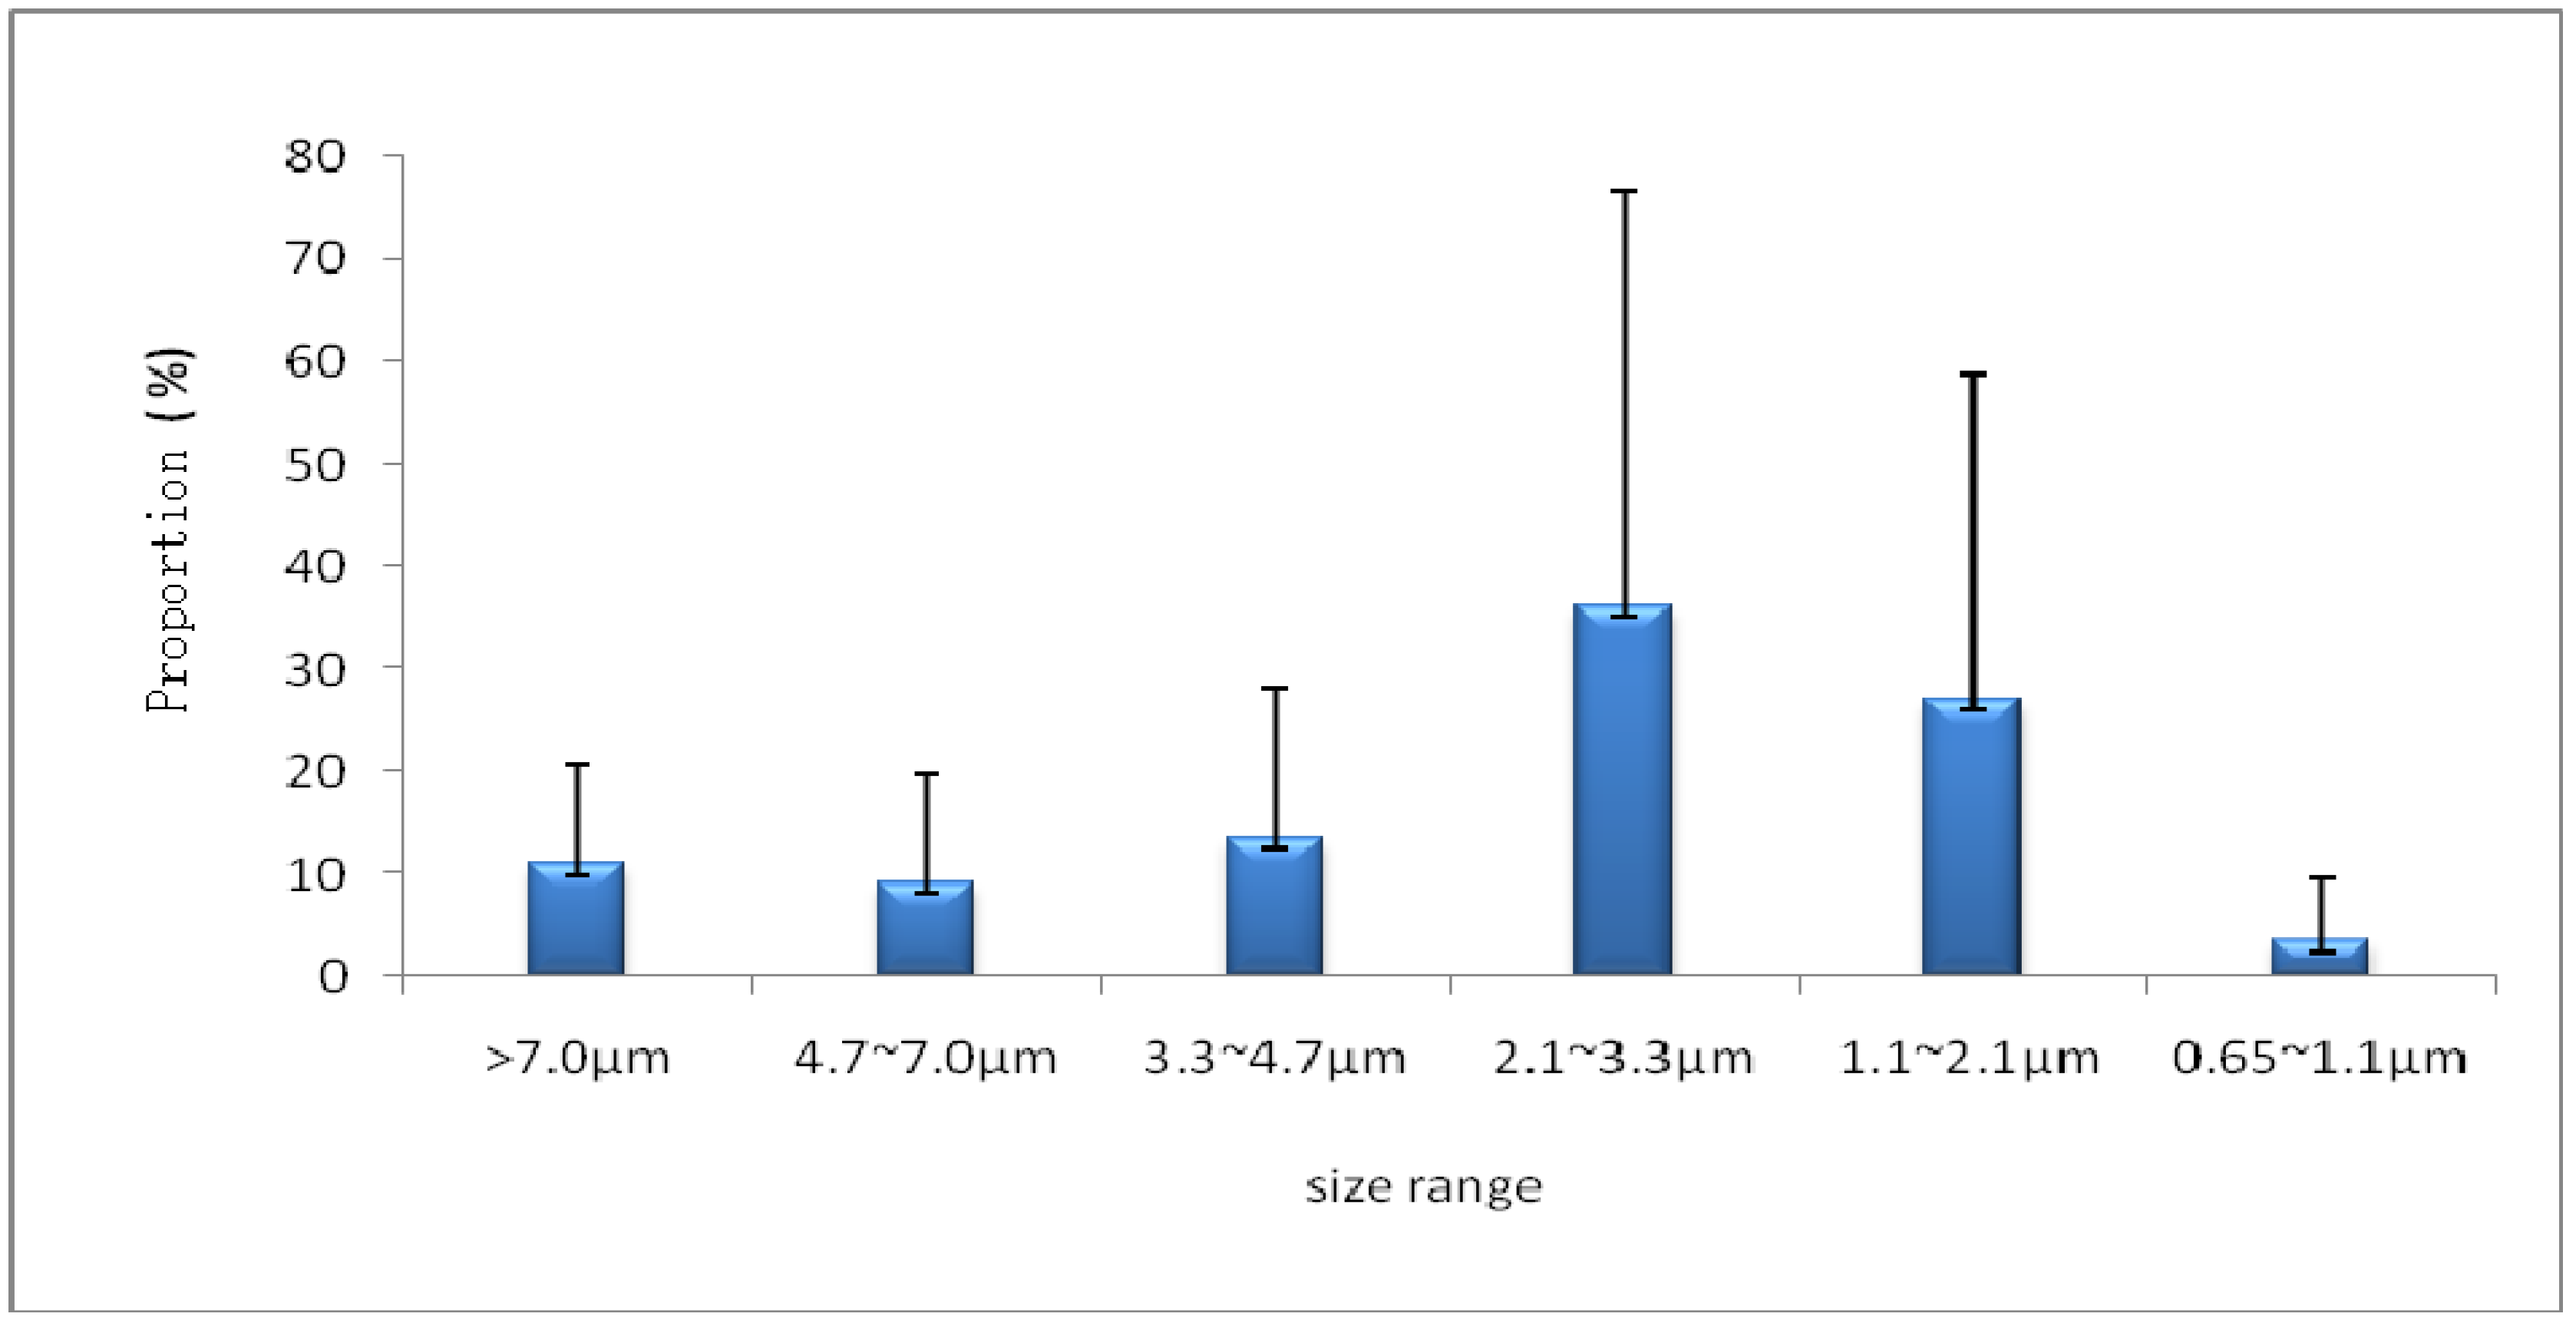
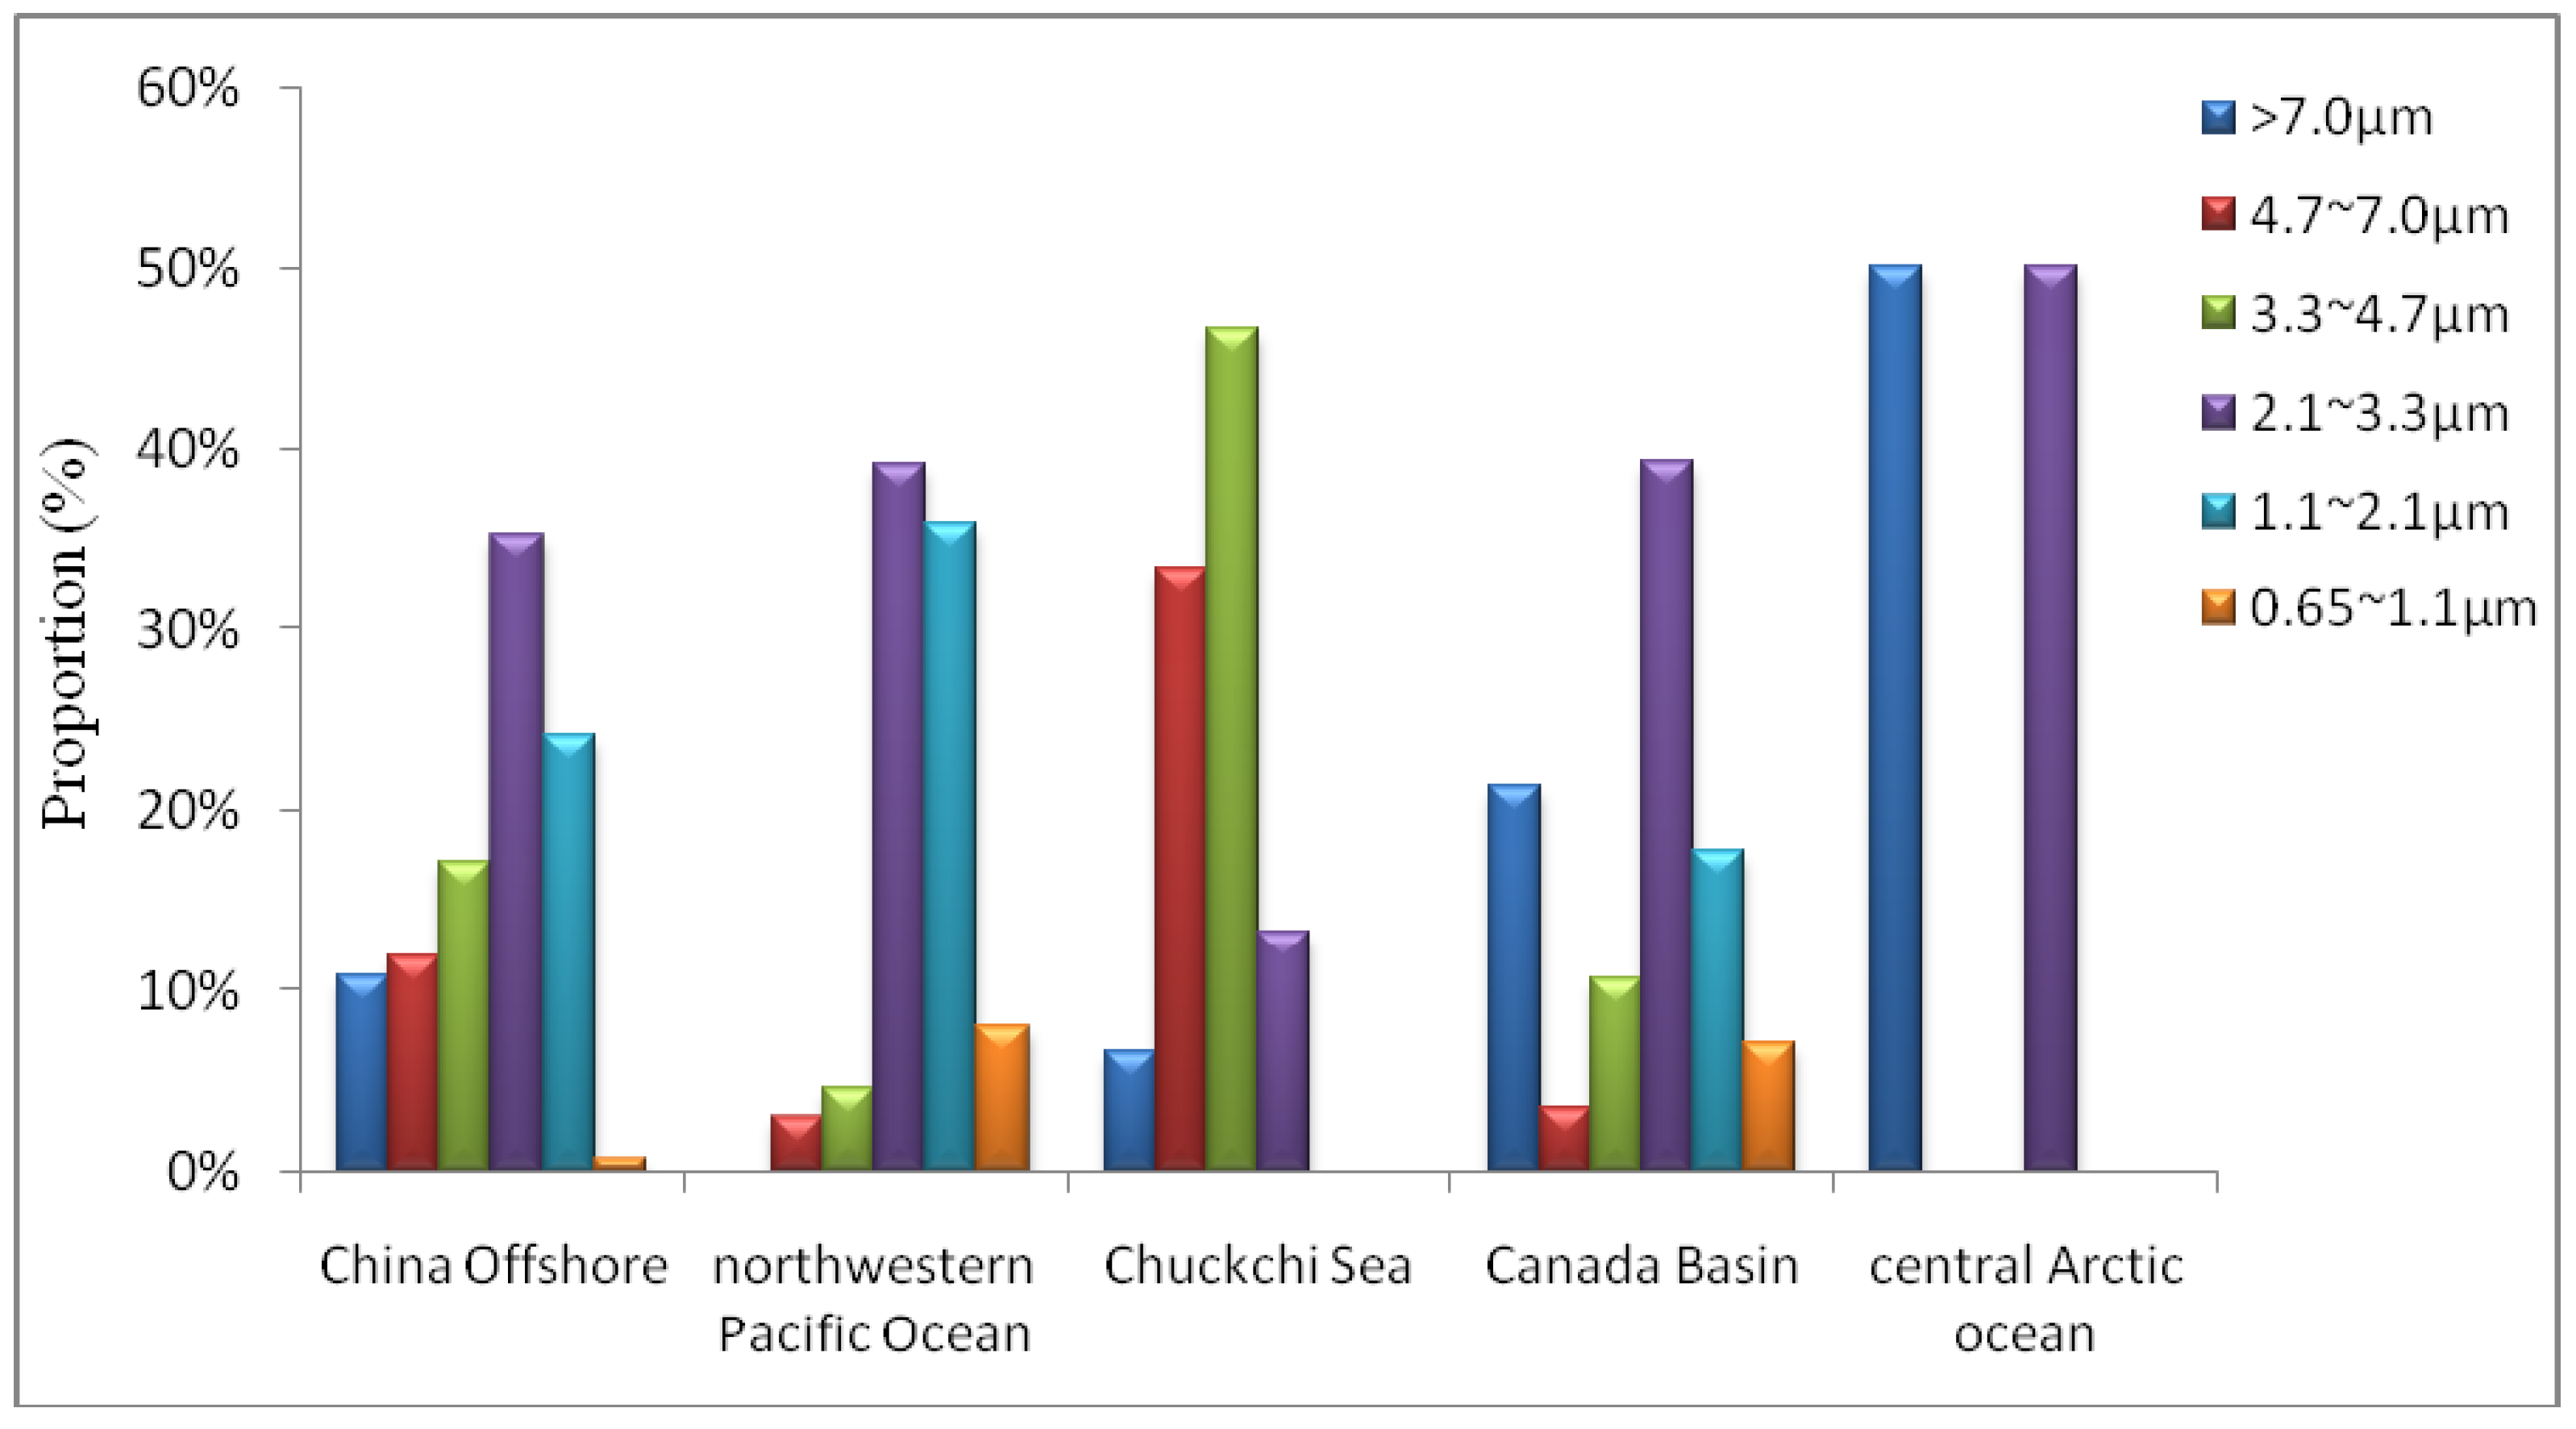
3.2. Size Distributions

The size distributions of airborne fungi during this cruise are shown in Figure 2. Biological aerosol dynamic particle size ranged from larger than 7 µm to 0.65 µm. This wide size range could be due to the fact that airborne fungi may be in the form of a single cell suspension, or adsorbed on the surface of particles, such as soil particles or leaf segments [25]. The size distribution displayed a unimodal distribution pattern. The maximum proportion of airborne fungi (about 36.2%) was detected in the range of 2.1~3.3 µm, whereas the minimum proportion (about 3.5%) was found in the range of 0.65~1.1 µm. Similar results were found in the coast of Qingdao [1], Mediterranean site [19], and indoors [26]. The proportion of the size range of 1.1–3.3 µm could reach about 63.1% in our study. More than a half of airborne fungi were observed in finer particles (<3.3 µm), which is different from previous studies in terrestrial [27] and coastal sites [1], but is similar to the result in Singapore, where the highest distribution of airborne fungi ranged from 1.1 to 3.3 µm [5]. The size distribution pattern of the samples may be influenced by both marine sources and continental sources. It has previously been reported that cultivable bioaerosols originating from continents in coarse particles cannot undergo long-range transport in marine air, whereas continental air particulates in the fine fraction (<3 µm) can be transported [20]. In addition, marine sources were supposed to mainly contribute bioaerosols in particles about 2~5 µm [23].
Figure 2. Average size distribution of airborne fungi during the CHINARE 2010. The error bars represent standard deviation.
Atmosphere 04 00337 g002
As shown in Figure 3, the size distributions for airborne fungi varied markedly in different regions. A unimodal distribution pattern for airborne fungi was with the Shapiro–Wilk test (significant level > 0.05) in the Chinese offshore, the west North Pacific Ocean, and the Canada Basin. The highest proportion of airborne fungi over offshore China, the west North Pacific Ocean, and the Canada Basin were mainly distributed in the range of 2.1~3.3 µm. Over the Chukchi Sea, the peak presented in the range of 3.3~4.7 µm, similar to the total microbe in Qingdao coast region [28]. However, the pattern over the central Arctic Ocean was notably different from the other regions. It showed a bimodal size distribution, which distributed almost equally in the ranges of 2.1–3.3 µm and >7 µm. This phenomenon may be due to very low concentration of fungal bioaerosols. In contrast, the other regions displayed unimodal size distributions. For example, the highest proportion of airborne fungi over the Chinese offshore, the west North Pacific Ocean, and the Canada Basin were mainly distributed in the range of 2.1–3.3 µm. Over the Chukchi Sea, the peak presented in the range of 3.3–4.7 µm, similar to the total microbe in Qingdao coast region [28]. The fungi in coarse particles over the Arctic Ocean may be derived from local sources as large particles are unfavorable for long-range transport. Indeed, microbes have been found to be coated by sea salt or coarse particles to protect itself due to the influence of environmental factors such as drying, temperature and ultraviolet radiation [29,30].
Figure 3. Size distributions of airborne fungi in different regions.
Atmosphere 04 00337 g003

4. Impact of Potential Factors on Airborne Fungi

4.1. Air Mass Origin

Generally, fungi are introduced into the air by either uplifting or horizontally moving air masses. Both types of air masses can take away fungi at the beginning of or during the air mass transport. Samples 5–7 collected over the Bering Sea were selected to examine the influence of air masses. Sample 7 had the highest fungal concentration, followed by Samples 5 and 6 (Figure 1). As shown in Figure 4, the BTs revealed that the air mass of Sample 6 originated from the Pacific Ocean, while the air mass for Sample 5 originated from the Aleutian Islands. For Sample 7, the air mass was derived from the Alaska Peninsula and passed through the Bering Sea. This sample thus may be impacted by both marine and continent sources. It is known that the Bering Sea region is rich in productivity. Consequently, marine contribution may be relatively high. On the other hand, lands are important sources for viable microorganisms of long-range transport, e.g., cultivable organisms have been found to be strongly associated with African dust [13]. The continental contribution will then enhance the concentration as well.
Figure 4. Backward trajectories indicating the origin of air masses for selected samples.
Atmosphere 04 00337 g004

4.2. Influence of Meteorological Conditions

4.2.1. Temperature

We analyzed the correlation between concentrations of airborne fungi and meteorological parameters, such as relative humidity (RH), temperature (T) and relative wind velocity (RV). Statistically, we found that the most important meteorological factor for the variation of airborne fungal concentrations was temperature (T), with the Pearson correlation coefficient of 0.496 (Table 3). Other meteorological factors (RH and RV) were not significantly correlated with airborne fungi in this study. The analysis with fungi as the dependent variable resulted in the following relationship (n = 14, R2 = 0.400, F = 2.224): Fungi (sum of 6 stages) = −120.5 + 4.839x(T) where x(T) is the temperature (°C). The positive correlation between temperature and the concentration of airborne fungi was similar to results published previously [1,19]. The role of ambient temperature may be ascribed to the fact that enzymes in fungi require appropriate temperature to maintain fungal activities. With elevated latitudes, fungi may not normally metabolize due to the decrease of enzymatic activity under cold conditions [31]. This may explain the change of airborne fungal concentrations with latitudes.
Table 3. Pearson correlation coefficients between concentrations of airborne fungi and meteorological factors during sampling (n = 14).
PearsonConcentrationRHTRV
Concentration1.0000.1850.496 *0.246
* p < 0.05; RH: Relative humidity; T: Temperature; RV: Relative velocity.

4.2.2. Weather

Samples collected at adjacent locations under different weather conditions were selected to examine the impact of weather conditions. For example, Samples 2 and 3 collected over China’s offshore, Samples 4 and 5 over the western North Pacific Ocean, Samples 9–11 and 15 over the Arctic Ocean were selected. It is clear that the concentrations of fungi in Samples 3, 4, 10 and 11 were relatively high (Figure 1). Especially, there was a significant difference between Samples 2 and 3, and between Samples 9 and 10. Samples with relative high content of fungi were almost collected in foggy days. According to previous studies, inversion layer phenomenon often occurs over the Arctic Ocean in summer [32]. Under the inversion layer, there are a large number of aerosol particles and droplets, which would promote the formation of clouds and fog, and increase the residence time of particles (including fungal particles) in the atmosphere. Moreover, the droplets in the fog can act as a culture medium for atmospheric microorganisms, reduce the gravitational sedimentation velocity of aerosols, and relieve the adverse influence of ultraviolet radiation, drying, and oligotrophic state [33,34]. All of these are beneficial for fungal metabolism and reproduction. Fog or cloudy conditions could thus increase the concentrations of airborne fungi.

4.3. Sea Ice

Sea ice affects airborne fungal concentrations over the Arctic Ocean through influencing the air–sea exchange. The status of sea ice area in the summer of 2010 was obtained from the report of the CHINARE 2010. It showed that the concentrations of airborne fungi were the highest in floating sea ice regions, followed by those over open sea regions. The lowest concentrations were found over pack ice regions (Table 2). Generally, when the sea ice concentrations are less than 70%, these regions are identified as “floating sea ice region”. The central Arctic Ocean is often covered by multiyear sea ice, identified as “pack ice region.” In the peripheral regions of the Arctic Ocean, there are normally open waters without sea ice in the summer [35]. Previously, Gunde–Cimerman et al. [36] found that fungal concentrations reached 1,000–3,000 CFU/L in seawater, 6,000–7,000 CFU/L in melting sea ice and 13,000 CFU/L in melting ice caps. Fungi in the water could reduce the water surface tension and hence escape from the aqueous phase to form aerial structures [37] via the bubble injection mechanism [38]. The emission of fungi from sea water should be an important source of airborne fungi. In addition, the sea ice contains abundant microbes and nutrients [16,39], including living fungi or fungi with low activity. In the pack ice region, permanent thick sea ice prevents the air–sea exchange and is disadvantageous for the metabolism of fungi [30]. However, with temperature increasing, the process of sea ice melting will be accelerated, so microorganisms or nutrient substances in the sea ice will probably be released to the atmosphere and increase the concentration of airborne fungi.

5. Summary

During the CHINARE 2010, the concentrations of airborne fungi ranged from 0 to 320.4 CFU/m3. The fungal concentrations in the marine boundary layer were significantly lower than those in most of the continental ecosystems. The mean concentrations of airborne fungi in the regions of the Chinese offshore, the western North Pacific Ocean, the Chukchi Sea, the Canada Basin and the central Arctic Ocean were 172.2 ± 158.4, 73.8 ± 104.4, 13.3 ± 16.2, 16.5 ± 8.0, and 1.2 ± 1.0 CFU/m3, respectively. It displayed roughly a decreasing trend from low latitude to high latitude.
Airborne fungi have wide size distributions. The maximum proportion of airborne fungi (about 36.2%) was detected in the range of 2.1~3.3 µm, whereas the minimum proportion (about 3.5%) was found in the range of 0.65~1.1 µm. The proportion of the size range of 1.1–3.3 µm could reach about 63.1% in our study. Airborne fungi presented a unimodal distribution pattern except over the central Arctic Ocean.
The concentration and size distribution of airborne fungi were influenced by the origin of air mass, air temperature, weather condition, sea ice concentration and so on. Among these parameters, temperature is the dominant factor. Suitable ambient air temperature and foggy weather are likely to favor the growth of fungi. In addition, the melting of sea ice will probably enhance the concentrations of airborne fungi.

Acknowledgments

This study was supported by the China National Natural Science Foundation (Project No. 41025020, 41176170), the Fourth China Arctic Research Expedition and the Chinese Arctic and Antarctic Administration (CHINARE2013). The authors acknowledge the NOAA Air Resources Laboratory (ARL) for the HYSPLIT transport and dispersion model on the internet.

Conflicts of Interest

The authors declare no conflict of interest.

References

  1. Li, M.; Qi, J.; Zhang, H.; Huang, S.; Li, L.; Gao, D. Concentration and size distribution of bioaerosols in an outdoor environment in the Qingdao coastal region. Sci. Total Environ. 2011, 409, 3812–3819. [Google Scholar] [CrossRef]
  2. Ariya, P.A.; Amyot, M. New directions: The role of bioaerosols in atmospheric chemistry and physics. Atmos. Environ. 2004, 38, 1231–1232. [Google Scholar] [CrossRef]
  3. Urbano, R.; Palenik, B.; Gaston, C.; Prather, K. Detection and phylogenetic analysis of coastal bioaerosols using culture dependent and independent techniques. Biogeosciences 2011, 8, 301–309. [Google Scholar] [CrossRef] [Green Version]
  4. Shelton, B.G.; Kirkland, K.H.; Flanders, W.D.; Morris, G.K. Profiles of airborne fungi in buildings and outdoor environments in the United States. Appl. Environ. Microbiol. 2002, 68, 1743–1753. [Google Scholar] [CrossRef]
  5. Zuraimi, M.; Fang, L.; Tan, T.; Chew, F.; Tham, K. Airborne fungi in low and high allergic prevalence child care centers. Atmos. Environ. 2009, 43, 2391–2400. [Google Scholar] [CrossRef]
  6. Morris, C.; Sands, D.; Bardin, M.; Jaenicke, R.; Vogel, B.; Leyronas, C.; Ariya, P.; Psenner, R. Microbiology and atmospheric processes: Research challenges concerning the impact of airborne micro-organisms on the atmosphere and climate. Biogeosciences 2011, 8, 17–25. [Google Scholar] [CrossRef]
  7. Georgakopoulos, D.; Després, V.; Fröhlich-Nowoisky, J.; Psenner, R.; Ariya, P.; Pósfai, M.; Ahern, H.; Moffett, B.; Hill, T. Microbiology and atmospheric processes: Biological, physical and chemical characterization of aerosol particles. Biogeosciences 2009, 6, 721–737. [Google Scholar] [CrossRef]
  8. Dusek, U.; Frank, G.; Hildebrandt, L.; Curtius, J.; Schneider, J.; Walter, S.; Chand, D.; Drewnick, F.; Hings, S.; Jung, D. Size matters more than chemistry for cloud-nucleating ability of aerosol particles. Science 2006, 312, 1375–1378. [Google Scholar] [CrossRef]
  9. Pöhlker, C.; Wiedemann, K.T.; Sinha, B.; Shiraiwa, M.; Gunthe, S.S.; Smith, M.; Su, H.; Artaxo, P.; Chen, Q.; Cheng, Y. Biogenic potassium salt particles as seeds for secondary organic aerosol in the Amazon. Science 2012, 337, 1075–1078. [Google Scholar] [CrossRef]
  10. Fang, Z.; Ouyang, Z.; Hu, L.; Wang, X.; Zheng, H.; Lin, X. Culturable airborne fungi in outdoor environments in Beijing, China. Sci. Total Environ. 2005, 350, 47–58. (in Chinese). [Google Scholar] [CrossRef]
  11. Menetrez, M.; Foarde, K.; Esch, R.; Schwartz, T.; Dean, T.; Hays, M.; Cho, S.; Betancourt, D.; Moore, S. An evaluation of indoor and outdoor biological particulate matter. Atmos. Environ. 2009, 43, 5476–5483. [Google Scholar] [CrossRef]
  12. Kalogerakis, N.; Paschali, D.; Lekaditis, V.; Pantidou, A.; Eleftheriadis, K.; Lazaridis, M. Indoor air quality—Bioaerosol measurements in domestic and office premises. J. Aerosol Sci. 2005, 36, 751–761. [Google Scholar] [CrossRef]
  13. Prospero, J.M.; Blades, E.; Mathison, G.; Naidu, R. Interhemispheric transport of viable fungi and bacteria from Africa to the Caribbean with soil dust. Aerobiologia 2005, 21, 1–19. [Google Scholar] [CrossRef] [Green Version]
  14. Chen, H.; Wang, B. Research on airborne microbes over some areas of the East China Sea and the Yellow Sea. Donghai Marine Sci. 1998, 16, 33–39. [Google Scholar]
  15. Pady, S.; Kapica, L. Air-borne fungi in the arctic and other parts of Canada. Can. J. Bot. 1953, 31, 309–323. [Google Scholar] [CrossRef]
  16. Marks, R.; Kruczalak, K.; Jankowska, K.; Michalska, M. Bacteria and fungi in air over the Gulf of Gdańsk and Baltic sea. J. Aerosol Sci. 2001, 32, 237–250. [Google Scholar] [CrossRef]
  17. Smith, D.J.; Jaffe, D.A.; Birmele, M.N.; Griffin, D.W.; Schuerger, A.C.; Hee, J.; Roberts, M.S. Free tropospheric transport of microorganisms from Asia to North America. Microb. Ecol. 2012, 64, 973–985. [Google Scholar] [CrossRef]
  18. Kramer, C.L.; Holzapfel, E.P. Air biota of the upper atmosphere over the Pacific Ocean and continental United States. Agric. Meteorol. 1973, 12, 83–93. [Google Scholar] [CrossRef]
  19. Raisi, L.; Aleksandropoulou, V.; Lazaridis, M.; Katsivela, E. Size distribution of viable, cultivable, airborne microbes and their relationship to particulate matter concentrations and meteorological conditions in a Mediterranean site. Aerobiologia 2013, 29, 223–248. [Google Scholar]
  20. Fröhlich-Nowoisky, J.; Burrows, S.; Xie, Z.; Engling, G.; Solomon, P.; Fraser, M.; Mayol-Bracero, O.; Artaxo, P.; Begerow, D.; Conrad, R. Biogeography in the air: Fungal diversity over land and oceans. Biogeosciences 2012, 9, 1125–1136. [Google Scholar] [CrossRef] [Green Version]
  21. Rolph, G.D.; Draxler, R.R. HYSPLIT (HYbrid Single-Particle Lagrangian Integrated Trajectory); NOAA Air Resources Laboratory: College Park, MD, USA, 2013. [Google Scholar]
  22. Sesartic, A.; Dallafior, T. Global fungal spore emissions, review and synthesis of literature data. Biogeosciences 2011, 8, 1181–1192. [Google Scholar] [CrossRef] [Green Version]
  23. Després, V.R.; Huffman, J.A.; Burrows, S.M.; Hoose, C.; Safatov, A.S.; Buryak, G.; Fröhlich-Nowoisky, J.; Elbert, W.; Andreae, M.O.; Pöschl, U. Primary biological aerosol particles in the atmosphere: A review. Tellus B 2012, 64, 15598. [Google Scholar]
  24. Pady, S.; Kelly, C. Aerobiological studies of fungi and bacteria over the Atlantic Ocean. Can. J. Bot. 1954, 32, 202–212. [Google Scholar] [CrossRef]
  25. Jaenicke, R. Abundance of cellular material and proteins in the atmosphere. Science 2005, 308, 73. [Google Scholar] [CrossRef]
  26. Hyvärinen, A.; Vahteristo, M.; Meklin, T.; Jantunen, M.; Nevalainen, A.; Moschandreas, D. Temporal and spatial variation of fungal concentrations in indoor air. Aerosol Sci. Technol. 2001, 35, 688–695. [Google Scholar]
  27. Fang, Z.; Ouyang, Z.; Hu, L.; Lin, X.; Wang, X. Granularity distribution of airborne microbes in summer in Beijing. Huan Jing Ke Xue 2004, 25, 1–5. (in Chinese). [Google Scholar]
  28. Xu, W.; Qi, J.; Jin, C.; Gao, D.; Li, M.; Li, L.; Huang, S.; Zhang, H. Concentration distribution of bioaerosol in summer and autumn in the Qingdao coastal region. Huan Jing Ke Xue 2011, 32, 9–17. (in Chinese). [Google Scholar]
  29. Jiang, H.; Dong, H.; Zhang, G.; Yu, B.; Chapman, L.R.; Fields, M.W. Microbial diversity in water and sediment of Lake Chaka, an athalassohaline lake in northwestern China. Appl. Environ. Microbiol. 2006, 72, 3832–3845. [Google Scholar] [CrossRef]
  30. Baleux, B.; Caro, A.; Lesne, J.; Got, P.; Binard, S.; Delpeuch, B. Survival and virulence changes in the VNC state of Salmonella Typhimurium in relation to simultaneous UV radiation, salinity and nutrient deprivation exposure. Oceanol. Acta 1998, 21, 939–950. [Google Scholar] [CrossRef]
  31. Robinson, C.H. Cold adaptation in Arctic and Antarctic fungi. New Phytol. 2001, 151, 341–353. [Google Scholar] [CrossRef]
  32. Kahl, J.D.W.; Martinez, D.A. Long-term variability in the low-level inversion layer over the Arctic Ocean. Int. J. Climatol. 1996, 16, 1297–1313. [Google Scholar] [CrossRef]
  33. Dueker, M.E.; O’Mullan, G.D.; Weathers, K.C.; Juhl, A.R.; Uriarte, M. Coupling of fog and marine microbial content in the near-shore coastal environment. Biogeosciences 2012, 9, 803–813. [Google Scholar] [CrossRef]
  34. Fuzzi, S.; Mandrioli, P.; Perfetto, A. Fog droplets—an atmospheric source of secondary biological aerosol particles. Atmos. Environ. 1997, 31, 287–290. [Google Scholar] [CrossRef]
  35. Lu, P.; Li, Z.; Cheng, B.; Lei, R.; Zhang, R. Sea ice surface features in Arctic summer 2008: Aerial observations. Remote Sens. Environ. 2010, 114, 693–699. [Google Scholar] [CrossRef]
  36. Gunde-Cimerman, N.; Sonjak, S.; Zalar, P.; Frisvad, J.C.; Diderichsen, B.; Plemenitaš, A. Extremophilic fungi in arctic ice: A relationship between adaptation to low temperature and water activity. Phys. Chem. Earth Parts A/B/C 2003, 28, 1273–1278. [Google Scholar] [CrossRef]
  37. Wösten, H.; van Wetter, M.; Lugones, L.; van der Mei, H.; Busscher, H.; Wessels, J. How a fungus escapes the water to grow into the air. Curr. Biol.: CB 1999, 9, 85–88. [Google Scholar] [CrossRef]
  38. Blanchard, D.C.; Syzdek, L. Mechanism for the water-to-air transfer and concentration of bacteria. Science 1970, 170, 626–628. [Google Scholar]
  39. Schlichting, H.E., Jr. Ejection of microalgae into the air via bursting bubbles. J. Allergy Clin. Immunol. 1974, 53, 185–188. [Google Scholar] [CrossRef]

