Article

Attribution of Runoff Variation in Reservoir Construction Area: Based on a Merged Deep Learning Model and the Budyko Framework

1
Guangdong Research Institute of Water Resources and Hydropower, Guangzhou 510620, China
2
Institute for Ocean Engineering, Shenzhen International Graduate School, Tsinghua University, Shenzhen 518055, China
3
School of Civil Engineering, Sun Yat-sen University, Guangzhou 510275, China
*
Author to whom correspondence should be addressed.
Atmosphere 2024, 15(2), 164; https://doi.org/10.3390/atmos15020164
Submission received: 5 December 2023 / Revised: 19 January 2024 / Accepted: 24 January 2024 / Published: 27 January 2024

Abstract

:
This study presents a framework to attribute river runoff variations to the combined effects of reservoir operations, land surface changes, and climate variability. We delineated the data into natural and impacted periods. For the natural period, an integrated Long Short-Term Memory and Random Forest model was developed to accurately simulate both mean and extreme runoff values, outperforming existing models. This model was then used to estimate runoff unaffected by human activities in the impacted period. Our findings indicate stable annual and wet season mean runoff, with a decrease in wet season maximums and an increase in dry season means, while extreme values remained largely unchanged. A Budyko framework incorporating reconstructed runoff revealed that rainfall and land surface changes are the predominant factors influencing runoff variations in wet and dry seasons, respectively, and land surface impacts become more pronounced during the impacted period for both seasons. Human activities dominate dry season runoff variation (93.9%), with climate change at 6.1%, while in the wet season, the split is 64.5% to 35.5%. Climate change and human activities have spontaneously led to reduced runoff during the wet season and increased runoff during the dry season. Only reservoir regulation is found to be linked to human-induced runoff changes, while the effects of land surface changes remain ambiguous. These insights underscore the growing influence of anthropogenic factors on hydrological extremes and quantify the role of reservoirs within the impacts of human activities on runoff.

1. Introduction

Both climate change and human activities have exerted a significant influence on the river flow regime [1,2,3,4,5]. Flow regime changes have consequential impacts on various aspects such as aquatic ecosystems, sediment movement, and water supply [6,7,8,9,10]. In response to the escalating demand for clean, renewable energy and fresh water, numerous countries have embarked on the construction of multi-purpose reservoirs [11]. However, the operation of these reservoirs can disrupt the continuity of the river system [12,13], and the roles of reservoir operation, aquatic ecosystem protection, energy production, and flood control become increasingly complex under the changing climate [1,8,11,14]. The objective of this paper is to explore how human activities, represented by reservoir regulation, influence the variation in water resources against the circumstances of climate change.
Identifying the primary factors that contribute to changes in runoff has become a crucial area of research in hydrology [15]. At present, the predominant methods for analyzing the factors contributing to changes in runoff encompass the paired catchment method [16,17], statistical analysis [18,19], hydrology models [20,21], and the Budyko framework [22,23,24]. These methodologies offer diverse perspectives and approaches to understanding the complex dynamics of runoff changes. Among the aforementioned methods, the Budyko framework is constructed purely based on the principle of water balance [22,25]. Given its comprehensive consideration of meteorological and hydrological elements, as well as its simplicity and convenience, it has been widely applied in hydrology researches [23,24,26,27]. The elastic coefficient is commonly used with the Budyko framework to reflect the sensitivity of runoff to various indicators [28,29]. With the rapid process of urbanization, the hardening of the ground surface has altered the rhythm of runoff generation, and the impact of human activities is becoming increasingly significant. Scholars have proposed parameterizing land use to characterize the impact of human activities [30,31,32,33]. However, some studies indicate that changes in the land surface mainly alter the evapotranspiration process, and their interaction with human activities remains complex [34,35,36,37]. Furthermore, there is relatively less research characterizing the role of reservoirs, thus necessitating further improvements in related methods to clarify how the role of reservoirs attributes to runoff variation.
Hang et al. [38] designed experiments to apply the Budyko framework at annual, monthly, and daily time scales. The results indicated that an increase in the complexity of the Budyko framework is necessary to accurately reflect the water balance relationship at the monthly scale and finer time scales. That is, while the Budyko framework is expected to achieve parsimony in hydrological model parameters, it is typically applied to annual water–heat relationship reasoning [18,23,38]. Meanwhile, prior studies have indicated that short-duration extreme precipitation events are becoming more frequent due to climate change and human activities, while changes in long-duration precipitation remain negligible [39].
In summary, on the one hand, the Budyko framework’s ability to identify human activities based on empirical inference is limited, and it struggles to explicitly consider the role of reservoir regulation. On the other hand, the Budyko framework’s capacity to reflect hydrological effects at fine time scales is lacking, obscuring the changes in short-duration extremes. Given this context, in order to carry out the attribution analysis of runoff variation in the reservoir construction area, reconstructing the runoff affected by the reservoir emerged as an appealing approach. The Long Short-term Memory network (LSTM) [40], with its aptitude for learning long-term, feature-rich data, demonstrated its suitability for hydrological modeling in recent studies [41,42,43,44,45]. As previously mentioned, the variation in short-duration extremes also holds significant information for water resource management, and the accurate simulation of extreme values is both a focal point and a challenge [46,47]. However, current research on how LSTM expresses extreme values in hydrology is still relatively scarce. Therefore, enhancing the ability of runoff extreme simulation using advanced deep learning technology is of considerable importance and can reveal more information in terms of attribution of runoff variation.
Flood and drought events are occurring more frequently due to the impacts of climate change and human activities [39,48]. The operation of reservoirs plays a crucial role in flood prevention and water supply [49]. Understanding the natural hydrological regime and identifying changes in river flows after the construction of a reservoir is essential for effective flood control and clean water supply in a changing climate. Therefore, the overall objective of this study is to identify the variation in runoff under the multiple influences such as reservoir regulation, land surface changes, and climate change, and then identify the contribution of each factor. Firstly, in order to identify the changes in runoff to the greatest extent, we use deep learning methods to reconstruct runoff and eliminate the impact of human activities on runoff series, and at this stage, we propose a combined model to deal with the insufficient response of data-driven models to extreme values. Secondly, based on the reconstructed runoff from the previous step, we construct a Budyko framework to carry out the attribution analysis of runoff variation and explore the differences with the existing Budyko framework, identifying the impact of reservoir regulation.

2. Materials and Methods
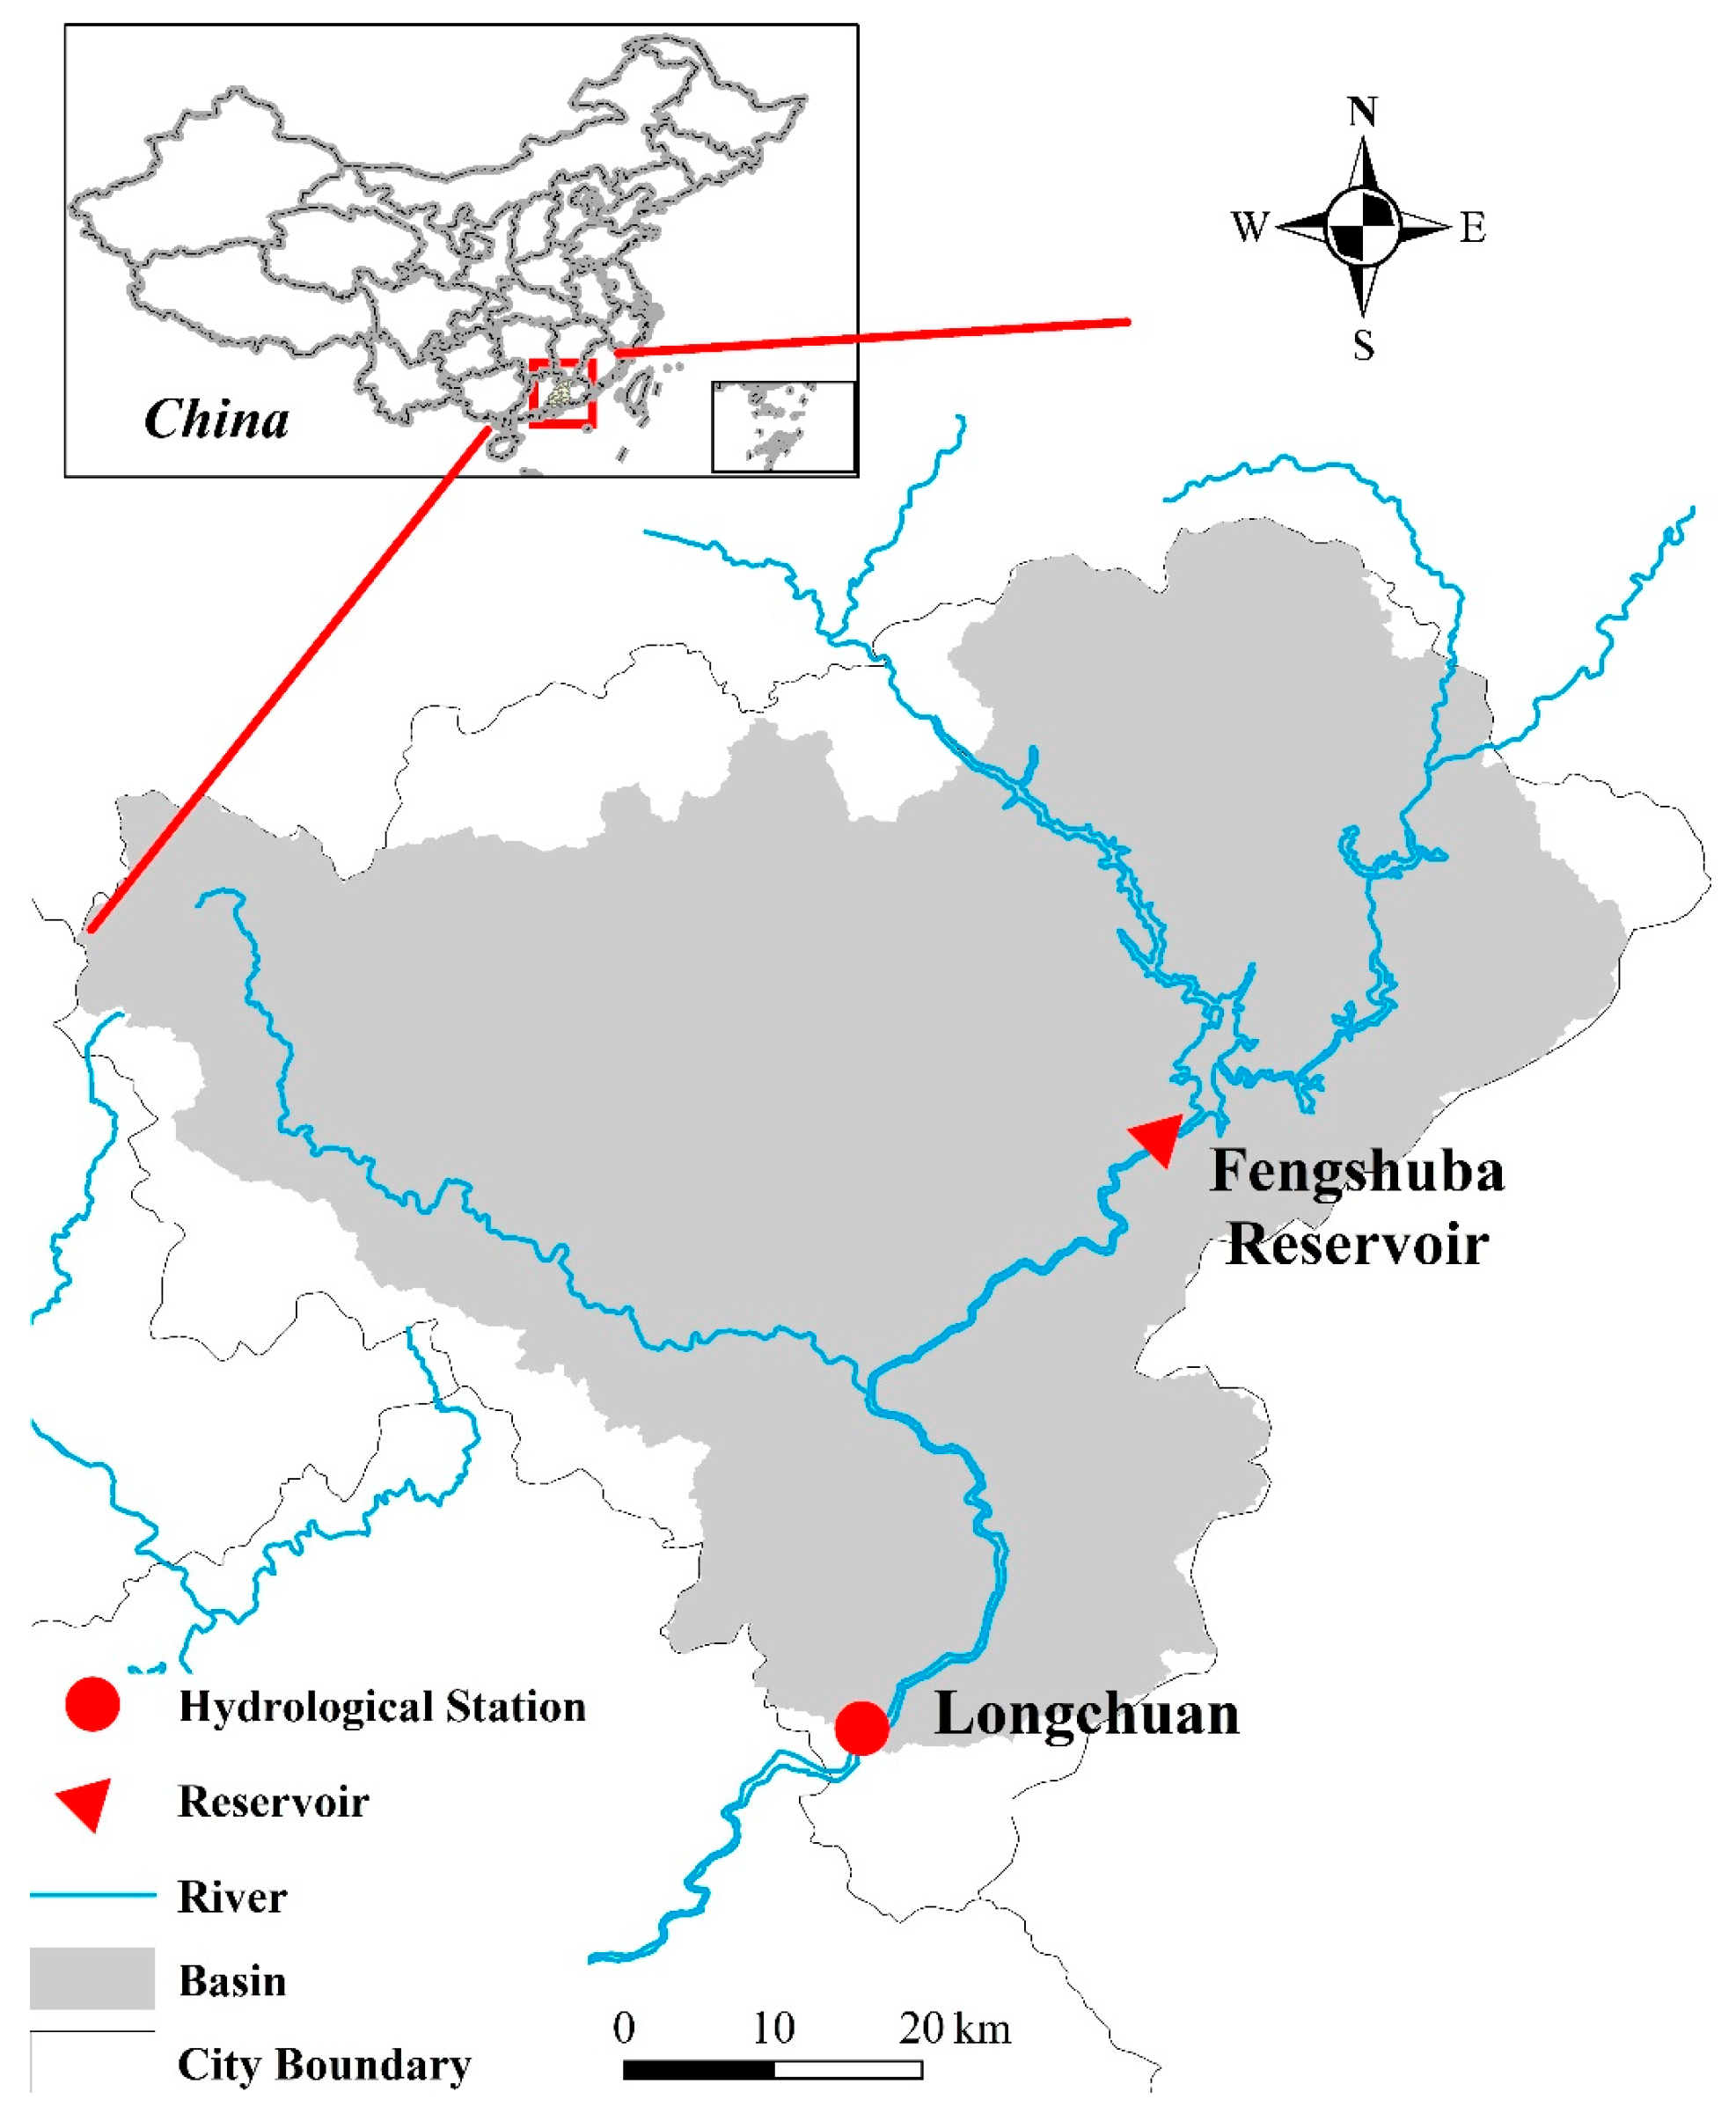
2.1. Study Area

This paper focuses on the Longchuan hydrological station control basin (LCB) in southern China, as shown in Figure 1. The study area includes the Fengshuba reservoir (FsbR), which is located 30 km upstream of the Longchuan hydrological station (LC) and was built between January 1970 and 1974. FsbR is a multi-purpose reservoir integrating flood control, power generation, and water supply. The dam is 91.5 m high and the crest is 418 m long, with a total storage capacity of 1.94 billion m3. LCB is situated in the subtropical monsoon climate zone, with seasonal precipitation that is mainly concentrated in the wet season (April to September), as shown in Figure 2.

2.2. Methodology

The methodology is structured as the following steps and the overview in Figure 3:
Step 1: Based on change-point detection, the hydrological and meteorological data are partitioned into a natural period and an impacted period. The specific methods for consistency inspection are elaborated in Section 2.2.1.
Step 2: A rainfall–runoff model is constructed based on the data from the natural period, with the aim of quantifying the influence of overall human activities on runoff during the impacted period. Here, we assumed that the reconstructed runoff only includes the impact of climate change, and therefore, the difference between the reconstructed and the observed runoff can be used to quantify the influence of all types of human activities on runoff. Furthermore, in response to the challenges in simulating hydrological extremes, this study proposes a coupled data-driven framework with the aim of improving the simulation of extreme runoff. The specific method is elaborated in Section 2.2.2.
Step 3: The Budyko framework is applied to assess the contribution rates of climate change and human activities to the runoff in the study area. As shown in Figure 3, the impact of climate change is represented by precipitation and evapotranspiration, while human activities are represented by reservoir regulation and land surface changes. The overall change in human activities is characterized by the difference between the reconstructed and the observed runoff, then the contribution of the reservoir storage water volume and the Normalized Difference Vegetation Index (NDVI) series is compared. The differences and reasonableness between the proposed framework and the traditional Budyko framework will be discussed for insights into dispatching impacts of multiple human activities on runoff variations. The specific method is elaborated in Section 2.2.3.
Owing to the pronounced seasonality of reservoir operation, this study will divide the hydrological and meteorological data into two distinct seasons: the wet season (from April to September) and the dry season (from October to March of the following year). These seasons will be analyzed separately. The complete framework is illustrated in Figure 3.

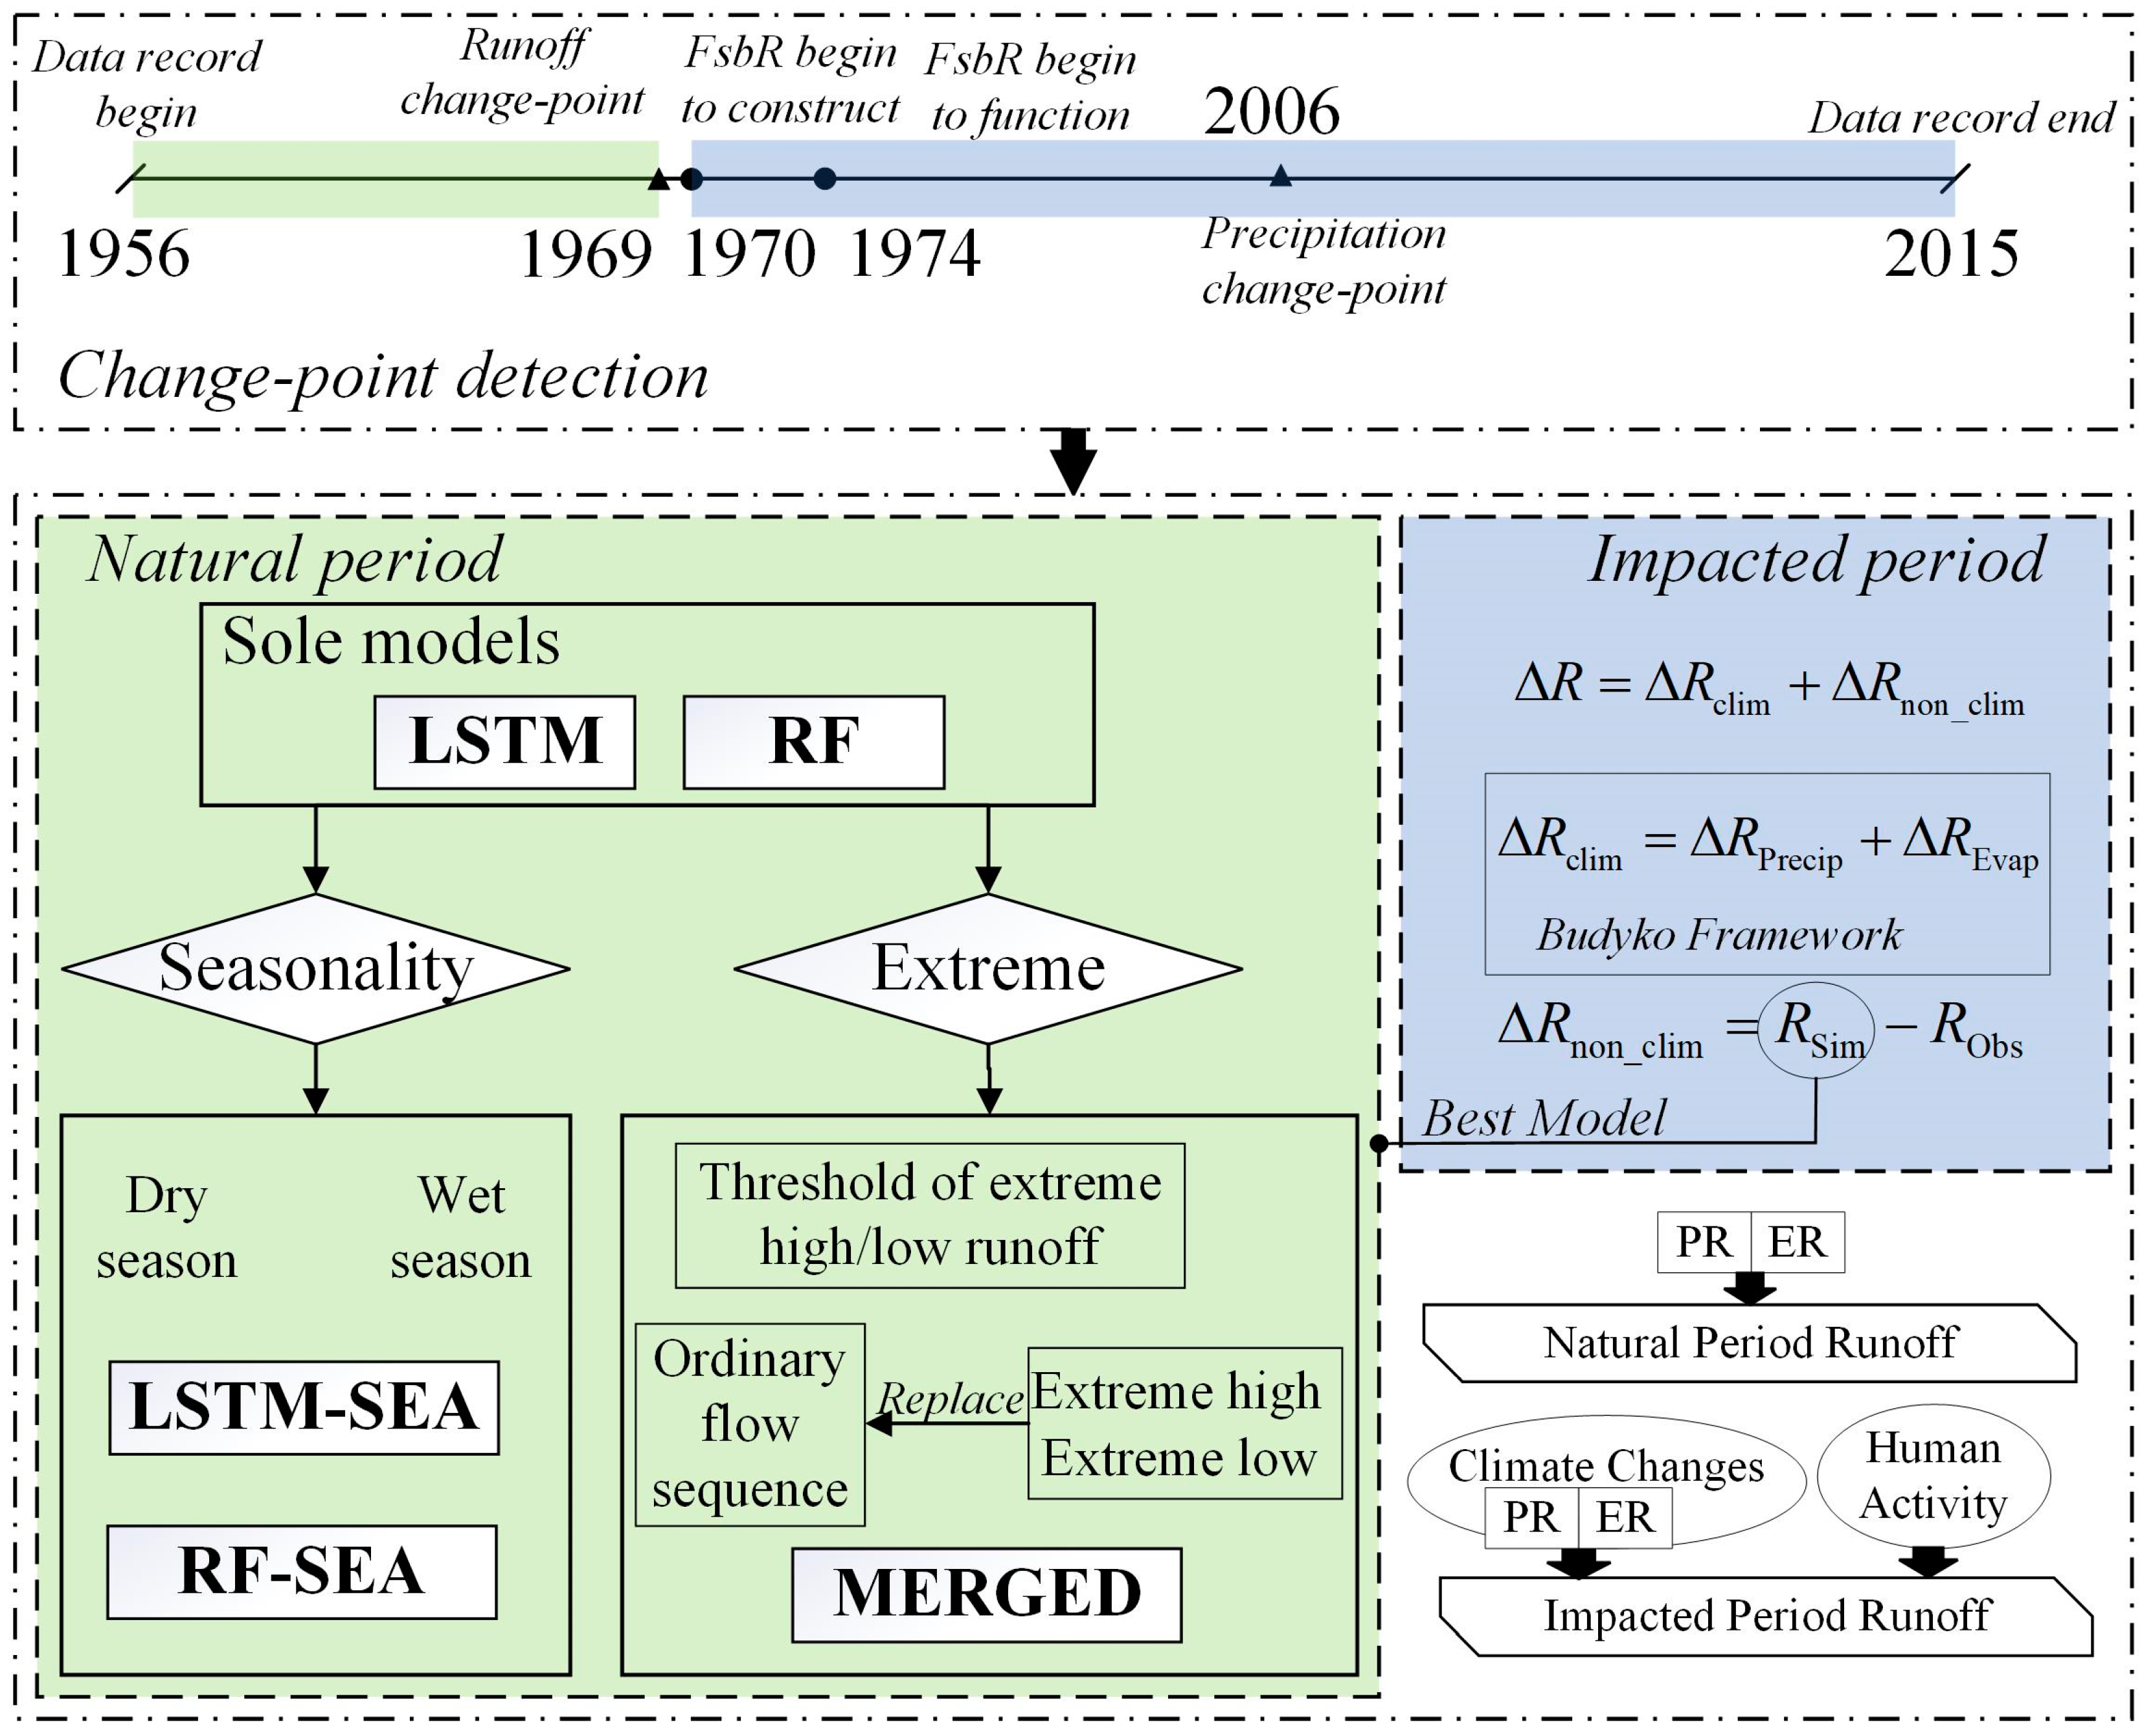
2.2.1. Change-Point Detection

In this study, the Pettit’s test [50], Standard Normal Homogeneity Test (SNHT) [51], and Buishand U test [52] were applied to the detect the change-point in the annual average and maximum precipitation series and the annual average, maximum, and minimum runoff series. If any of the three methods detect a change point, the earliest occurrence time is identified as the breakpoint of the corresponding hydrological/meteorological series. Based on the results of the change-point test, we separate the study period into natural period and impacted period.

2.2.2. A LSTM and RF Coupled Rainfall–Runoff Simulation Model

Given its ability to handle long-term information, LSTM has emerged as a competitive option for runoff prediction and simulation [53,54]. Random forest (RF), on the other hand, is an ensemble learning algorithm introduced by Breiman et al. [55] and has been widely used in rainfall–runoff models due to its excellent anti-overfitting ability and capacity to handle multiple predictors [56,57]. This paper compares the advantages and disadvantages of the two algorithms in runoff simulation and couples LSTM with Random Forest in the hope of establishing a more reliable runoff restoration model. Considering the significant seasonal variations in the wet and dry seasons of the study area, the design of the scheme is as follows:
(1)
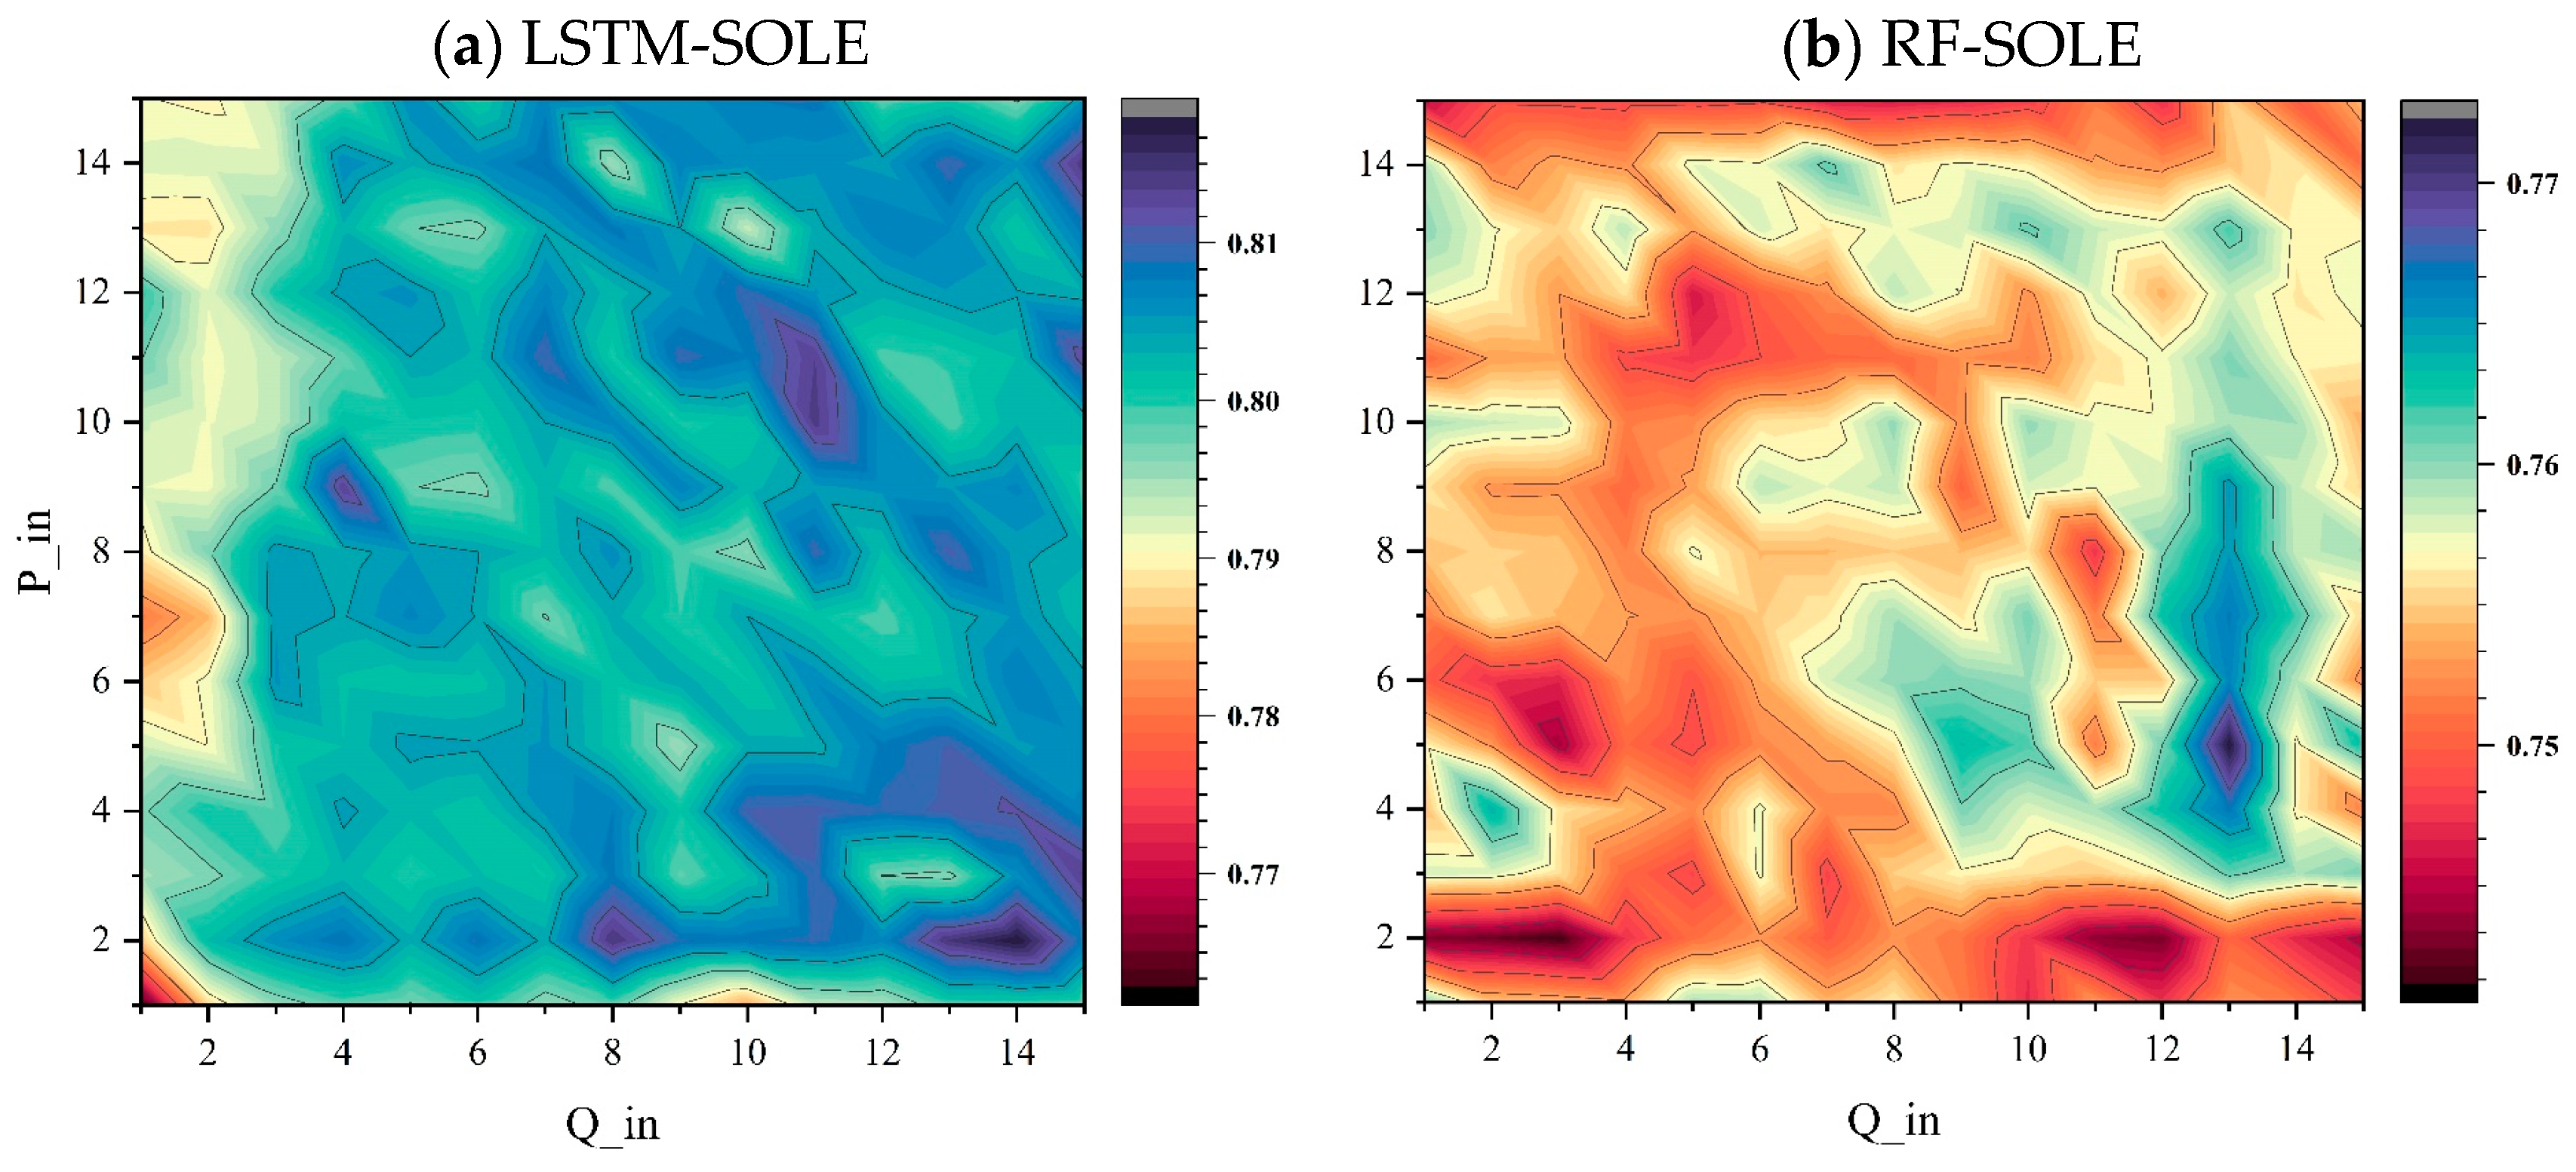
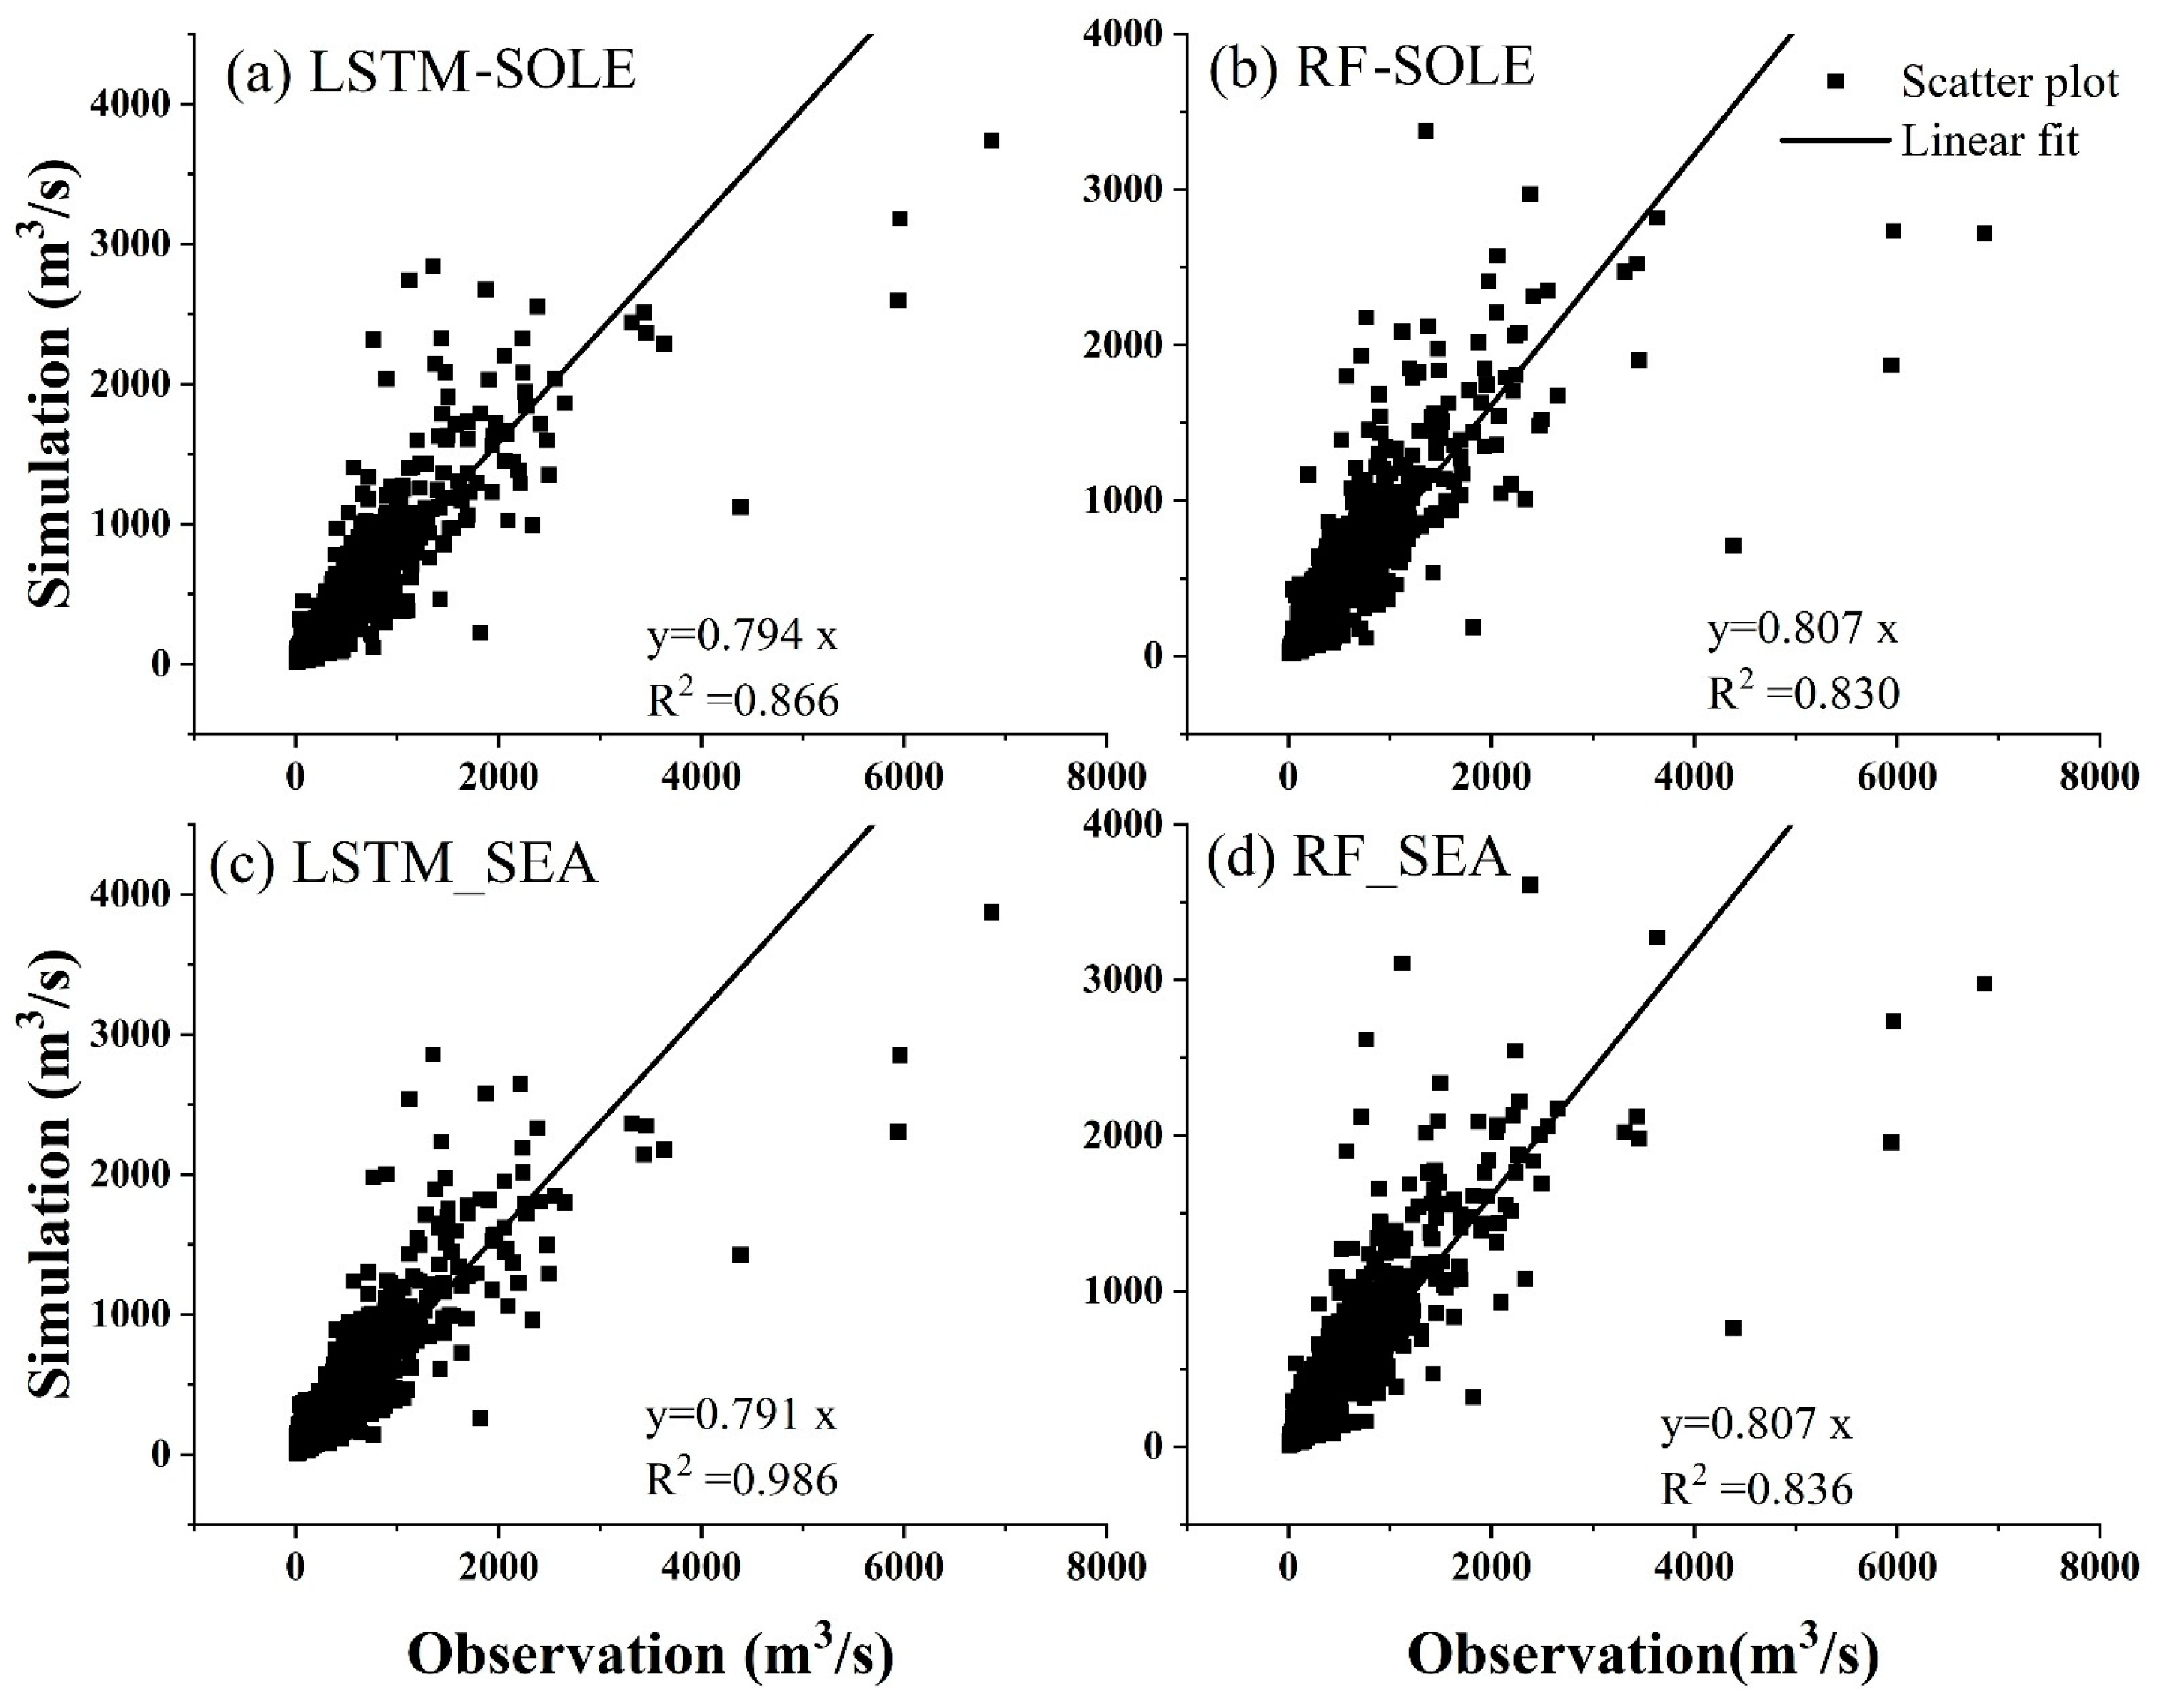
Runoff simulation is performed separately using LSTM and RF, and the results are marked as LSTM-SOLE and RF-SOLE, respectively;
(2)
Based on the characteristics of significantly uneven annual distribution of basin rainfall runoff, LSTM and RF are used separately for runoff simulation during the wet and dry seasons, referred to LSTM-SEA and RF-SEA;
(3)
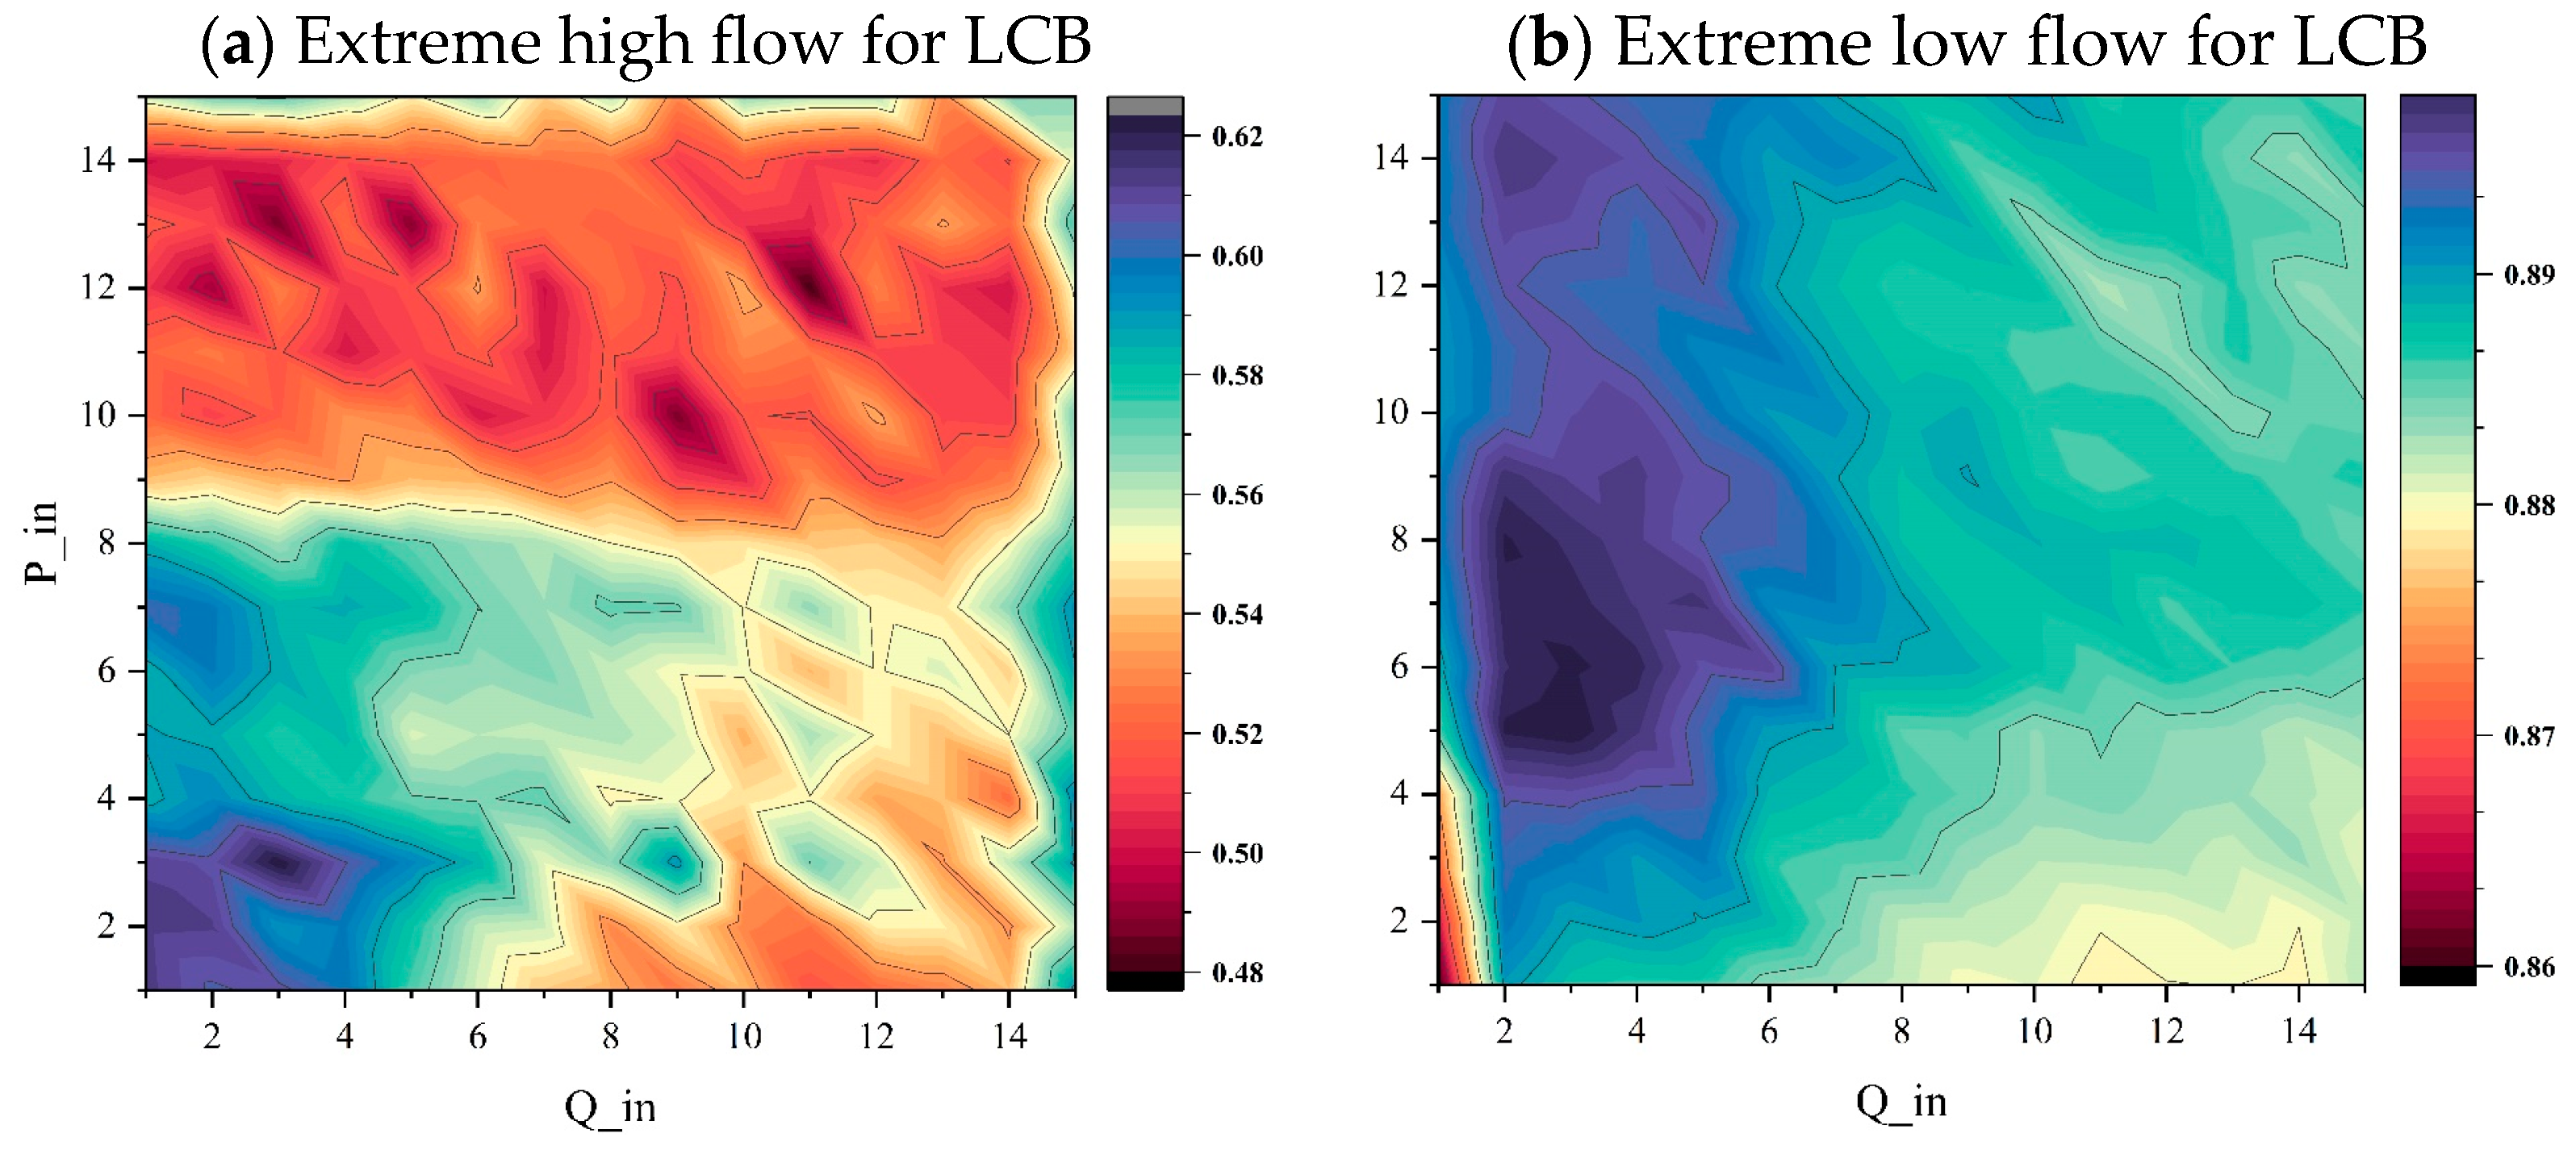
The 90th percentile and 10th percentile of the runoff sequence are used as thresholds for extremely high and low flows, respectively, and the runoff extremes are trained separately. In the MERGED model, when the input measured runoff exceeds the threshold range of extremes, the simulation results of (1) or (2) are replaced with simulated extremes.
By setting up the experiments with the aforementioned three steps, we aim to identify the strengths and weaknesses of the LSTM and RF algorithms on the one hand, and on the other hand, we hope to obtain the model that best reflects the rainfall–runoff process for subsequent attribution analysis in the impacted period.
For machine learning algorithms, the selection of impacted factors is critical for the accuracy of the training outcomes. Prior to initiating model training, we determine the most appropriate factors by selecting the optimal inputs based on the preceding 0–15 days of runoff and rainfall data. This period was chosen based on the assumption that 15 days is an adequate timespan for flow confluence within the study area. The performance of the model is assessed using the Nash–Sutcliffe efficiency coefficient ( N s e ) [58] as the evaluation criterion. The input combination yielding the highest N s e is deemed the optimal set of inputs. It is important to note that the input of rainfall and runoff are continuous over time to ensure temporal consistency in the simulation. Furthermore, as the models in this section are designed primarily for the reconstruction of natural runoff, the rainfall data from the simulation day are included by default in all input factor combinations to maximize the simulation’s reliability. Based on the results of the change-point test, the model is trained using data from the natural period. To validate the model’s robustness, 5-fold cross-validation is employed during the training phase.
In order to evaluate the model results, an evaluation metric as listed in Table 1 was constructed. It includes general indexes to investigate the mean and variance of the sequence, the extreme indexes to represent the accuracy of extreme value prediction, and the indexes to represent the accuracy of capturing runoff peaks. The names, definitions, and calculation equations of these indicators are shown in Table 1.
Table 1. Evaluation metrics for the rainfall–runoff models.
MetricsDetailEquations
N s e [58]Nash–Sutcliffe efficiency N s e = 1 t = 1 T ( Q s t Q o t ) 2 t = 1 T ( Q o t Q ¯ o ) 2 (1)
Pearson rPearson correlation between observed and simulated flow r = t = 1 T ( Q s t Q ¯ s ) ( Q o t Q ¯ o ) t = 1 T ( Q s t Q ¯ s ) 2 t = 1 T ( Q o t Q ¯ o ) 2 (2)
K G E [59]Kling–Gupta efficiency K G E = 1 ( r 1 ) 2 + ( σ s / σ o 1 ) 2 + ( μ s / μ o 1 ) 2 (3)
FHV [60]Top 2% peak flow bias % B i a s F H V = h = 1 H ( Q s h Q o h ) h = 1 H ( Q o h ) × 100 % (4)
FLV [60]Bottom 30% low flow bias % B i a s F L V = 1 l L log ( Q s l ) log ( Q ¯ s ) l L log ( Q o l ) log ( Q ¯ o ) l L log ( Q o l ) log ( Q ¯ o ) × 100 % (5)
FMS [60]Bias of the slope of the low-duration curve between the 20% and 80% percentile % B i a s F M S = log ( Q s m 1 ) log ( Q s m 2 ) log ( Q o m 1 ) log ( Q o m 2 ) log ( Q o m 1 ) log ( Q o m 2 ) × 100 % (6)
Peaking PODProbability of detection of the flow peaks * P O D = H H + M (7)
Peaking FARFalse alarm ratio of the flow peaks * F A R = F H + F (8)
Peaking CSICritical success index of flow peaks * C S I = H H + M + F (9)
* In Equations (7)–(9), H , M , and F represent hit events, miss events, and false events in detecting peaks. A hit event is when both the observed sequence and simulated sequence detect peaks; a miss event is when only the gauge sequence report peaks, and vice versa for false event. In this study, the peaks are determined using SciPy toolkits (https://www.scipy.org/) in Python 3.6.

2.2.3. Attribution Based on the Budyko Frameworks

The Budyko framework is an effective method for quantitatively decomposing the influence of climatic factors (precipitation and evaporation n ) and human activities on the river runoff [22,25]. This framework has been widely used in various studies [15,23,32,61]. For a long time scale, the water balance of a basin can be expressed as follow:
R = P A E P + Δ S
where R , P , and A E P denote the annual runoff, precipitation, and actual evaporation of the basin, and Δ S denotes the terrestrial water storage change in the catchment; in the long-term hydrological procedures, Δ S is generally considered to be 0. In this study, A E P was calculated using the water–energy balance equation proposed by Ang et al. [62]:
A E P = P × E T o P n + E T o n 1 n
where n denotes the landscape parameter to represent the impact of overall human activities; E T o denotes the potential evapotranspiration. In this paper, n is determined by simulating R based on Equations (10) and (11). Incrementing by 0.001, the value of n is calculated from 0 to 10, and the value that minimizes the error of the equation is taken as the value of the underlying surface parameter n for the basin. E T o is calculated using the equations recommended by the Food and Agriculture Organization (FAO), and specific equations refer to Allen et al. [63]. Combining Equations (10) and (11), R can be completely expressed by P , E T o , and n as R = f ( P , E T o , n ) , and then the variation in runoff can be represented as follows:
d R = R P d P + R E T o d E T o + R n d n
The elastic coefficient ε was defined as the degree of change in basin runoff caused by the change in a climate variable, such as the percentage change in annual runoff relative to the multi-year average caused by a 1% increase in annual potential evapotranspiration. For example, factor x ’s elastic coefficient ε x can be represented as follows:
ε x = R x · x R
Thus, dividing both sides of Equation (12) by R , we obtain the following:
d R R = ε P d P P + ε E T o d E T o E T o + ε n d n n
Set φ = E T o P , the elastic coefficient of P , E T o , and n can be represented as follows:
ε P = ( 1 + φ n ) 1 / n + 1 φ n + 1 ( 1 + φ n ) [ ( 1 + φ n ) 1 / n φ ]
ε E T o = 1 ( 1 + φ n ) [ 1 ( 1 + φ n ) 1 / n ]
ε n = ln ( 1 + φ n ) + φ n ln ( 1 + φ n ) n [ ( 1 + φ n ) ( 1 + φ n ) 1 / n + 1 ]
As previously mentioned, the area selected in this study is subject to reservoir regulation. Using only land surface parameters to represent human activities lacks feedback on the regulation effect of the reservoir. Therefore, in this study, we first determine the elasticity coefficient of rainfall and runoff according to the above formulas and calculate their overall variation during the impacted period. Subsequently, the overall difference between the reconstructed runoff ( R Sim ) and observed runoff ( R Obs ) from Section 2.2.2 is used to represent the overall impact of human activities. In summary, we assume that the total runoff variation ( Δ R ) is composed of climate change-induced variation ( Δ R clim ), which can be divided into precipitation-induced ( Δ R precip ) and evapotranspiration-induced ( Δ R evap ) runoff variation, and human activity-induced variation ( Δ R non _ clim ). Finally, Δ R clim and Δ R non _ clim are used to analyze the contribution rate of human activities and climate change to runoff variation. Lastly, since the Δ R non _ clim contains the impact of both reservoir and land use changes, the difference in reservoir inflow and outflow and the NDVI index are used to explore the proportion of reservoir operation and underlying surface changes in human activities.
The above-mentioned runoff changes can be represented by the following equations:
Δ R = Δ R clim + Δ R non _ clim
Δ R clim = Δ R precip + Δ R evap
Δ R non _ clim = R Obs R Sim
The cumulative variation in total runoff Δ R and climate and other factor-induced variation in runoff ( Δ R clim and Δ R non _ clim , respectively) are denoted by Δ R c , Δ R c _ clim , and Δ R c _ nc , respectively. (Specifically for the impacted period, we neglected the simulation bias, assuming that the model established using the method in Section 2.2.2 during the natural period can fully reflect the relationship between rainfall and runoff under natural conditions. We have taken the difference between the simulated/reconstructed runoff and the observed values as the quantity of runoff influenced by human activities.) The contribution rate of impact factor x will be calculated by the following equation:
Δ C x = Δ R c _ x Δ R × 100 %

2.3. Data

The precipitation data employed in this paper are the Asian Precipitation-Highly-Resolved Observational Data Integration Towards Evaluation (APHRODITE) [64] daily-scale precipitation from 1956 to 2015 extracted using the LCB mask. APHRODITE is a precipitation dataset covering Asia and has now released gridded data at a 0.25° × 0.25° (Lon × Lat) scale from 1956 to 2015. Since APHRODITE is derived based on a dense network of rain-gauge data, it could be used as gauge precipitation. The APHRODITE precipitation can be downloaded at http://aphrodite.st.hirosaki-u.ac.jp/download/ (product version V1101 and V1101EX_R1 ).
The runoff data used in this paper are the daily runoff data of LC from 1956 to 2015 and inflow and outflow of FsbR from 1980 to 2015. The location of the hydrological station is shown in Figure 1. To calculate E T o based on the FAO recommended equations [63], meteorological data from Longchuan meteorological station are used, including daily maximum/minimum/average temperature, daily average wind speed, pressure, sunshine duration, and relative humidity. These meteorological data have been recorded since 1959. The NDVI was used to assess the impact of vegetation cover on non-climate factor-induced runoff variation. The NDVI used in this study is the provided by the National Ecosystem Science Data Center, the National Science and Technology Infrastructure of China (http://www.nesdc.org.cn), on a monthly scale, recorded from 1981 to 2015.

3. Results

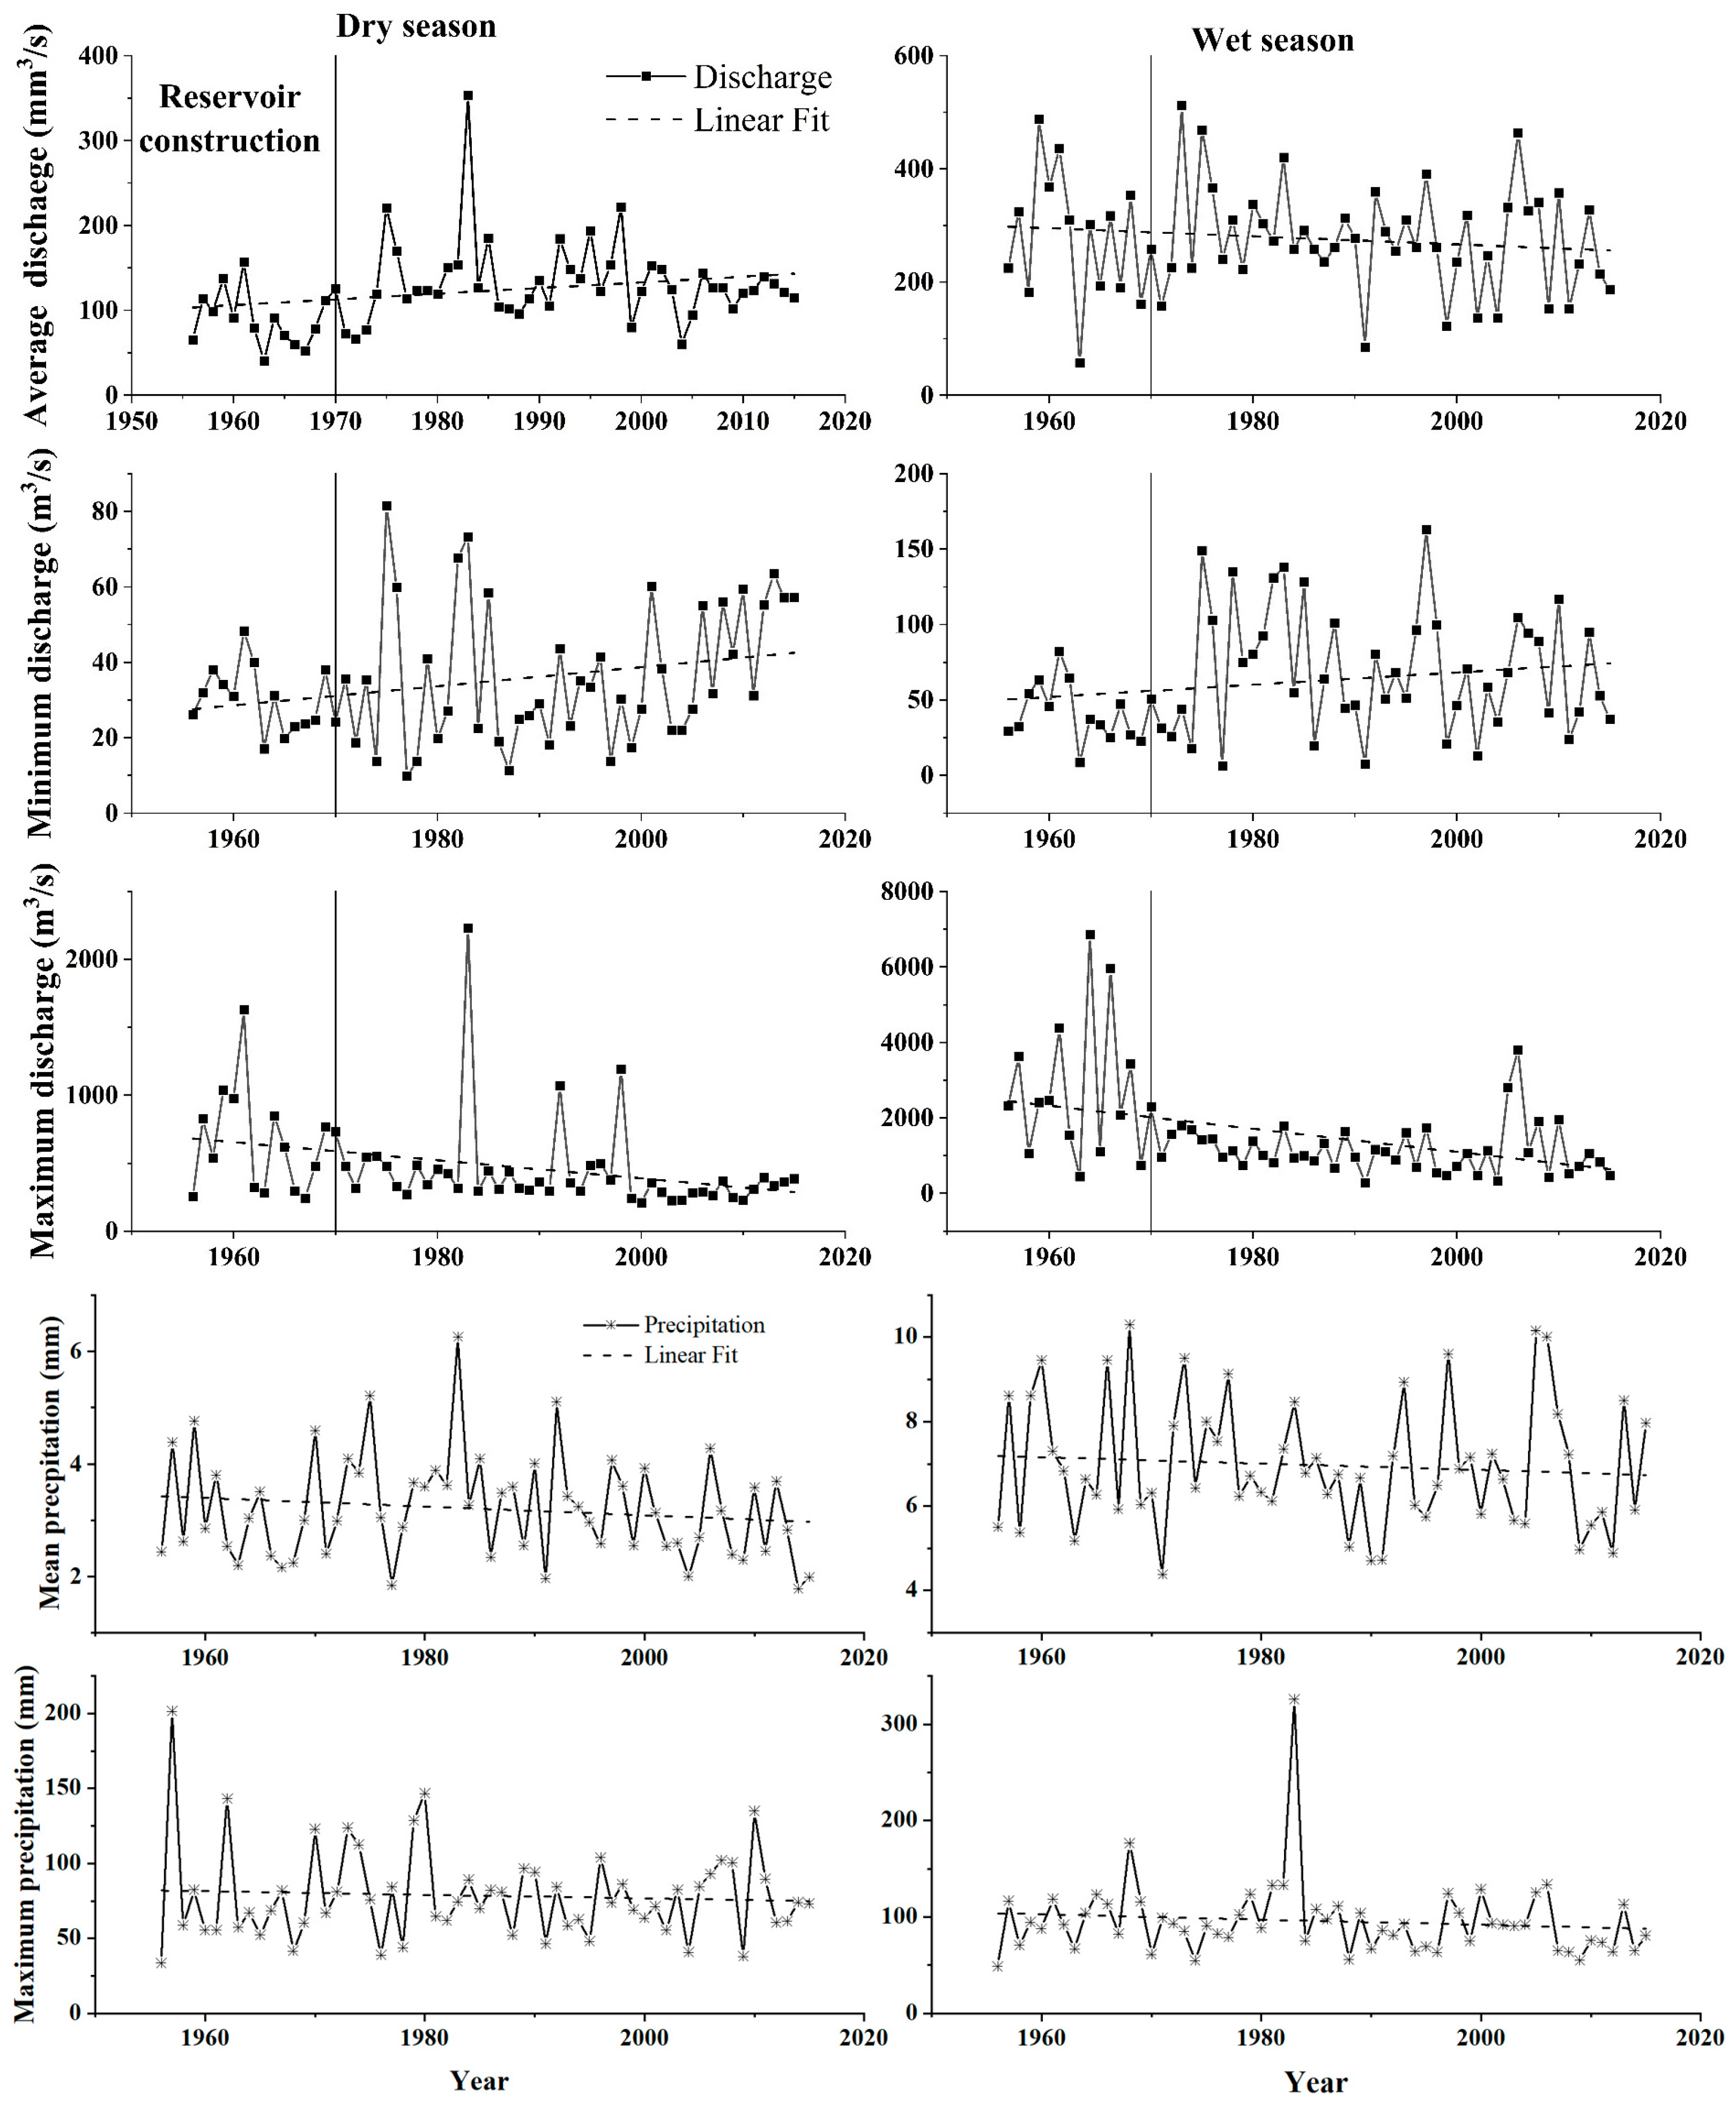
3.1. Statistical Characteristics of the Precipitation and Runoff Series

Figure 2 depicts the annual average, minimum, and maximum daily runoff in LCB in the wet season and dry season, respectively. It can be seen from the figure that the runoff showed strong seasonal characteristics, with the runoff in the wet season much larger than that in the dry season. On the other hand, during the wet or dry season, the average annual runoff did not change much, while the maximum and minimum annual runoff showed a decreasing and increasing trend, respectively. These trends are most obvious after the construction of the FsbR (1970s). We also present a linear regression for each subplot in Figure 2. The linear trends of the annual maximum and annual minimum runoff in the wet and dry period have passed the significance test.
Further, we performed a change-point test on the runoff and rainfall series of the LCB; the results are shown in Table 2. The change points detected by each method are very similar. The breaktime of average annual runoff and annual precipitation are both in 1973. The annual maximum runoff breaks in 1969, before precipitation did. The FsbR was built in 1970, and the change point in the annual maximum runoff may be highly related to the construction of the reservoir, but this does not seem to have an impact on the annual minimum runoff (no change point in the annual minimum runoff sequence has been detected until 2006). We conducted a significance test for the identified change points. The results indicate that rainfall is only significant during the abrupt change that occurred in 2005–2006, while the different runoff sequences passed the significance test for abrupt changes in the years 1969, 1973, and 2006. Based on the above analysis, we can deem the runoff before 1969 as natural runoff; after 1970, with the construction of the reservoir, the LCB’s runoff was impacted, resulting in a significant decrease in the annual maximum runoff and an increase in the annual minimum runoff. Climate factors (precipitation) break after 1973 and begin to have an impact on runoff variation.

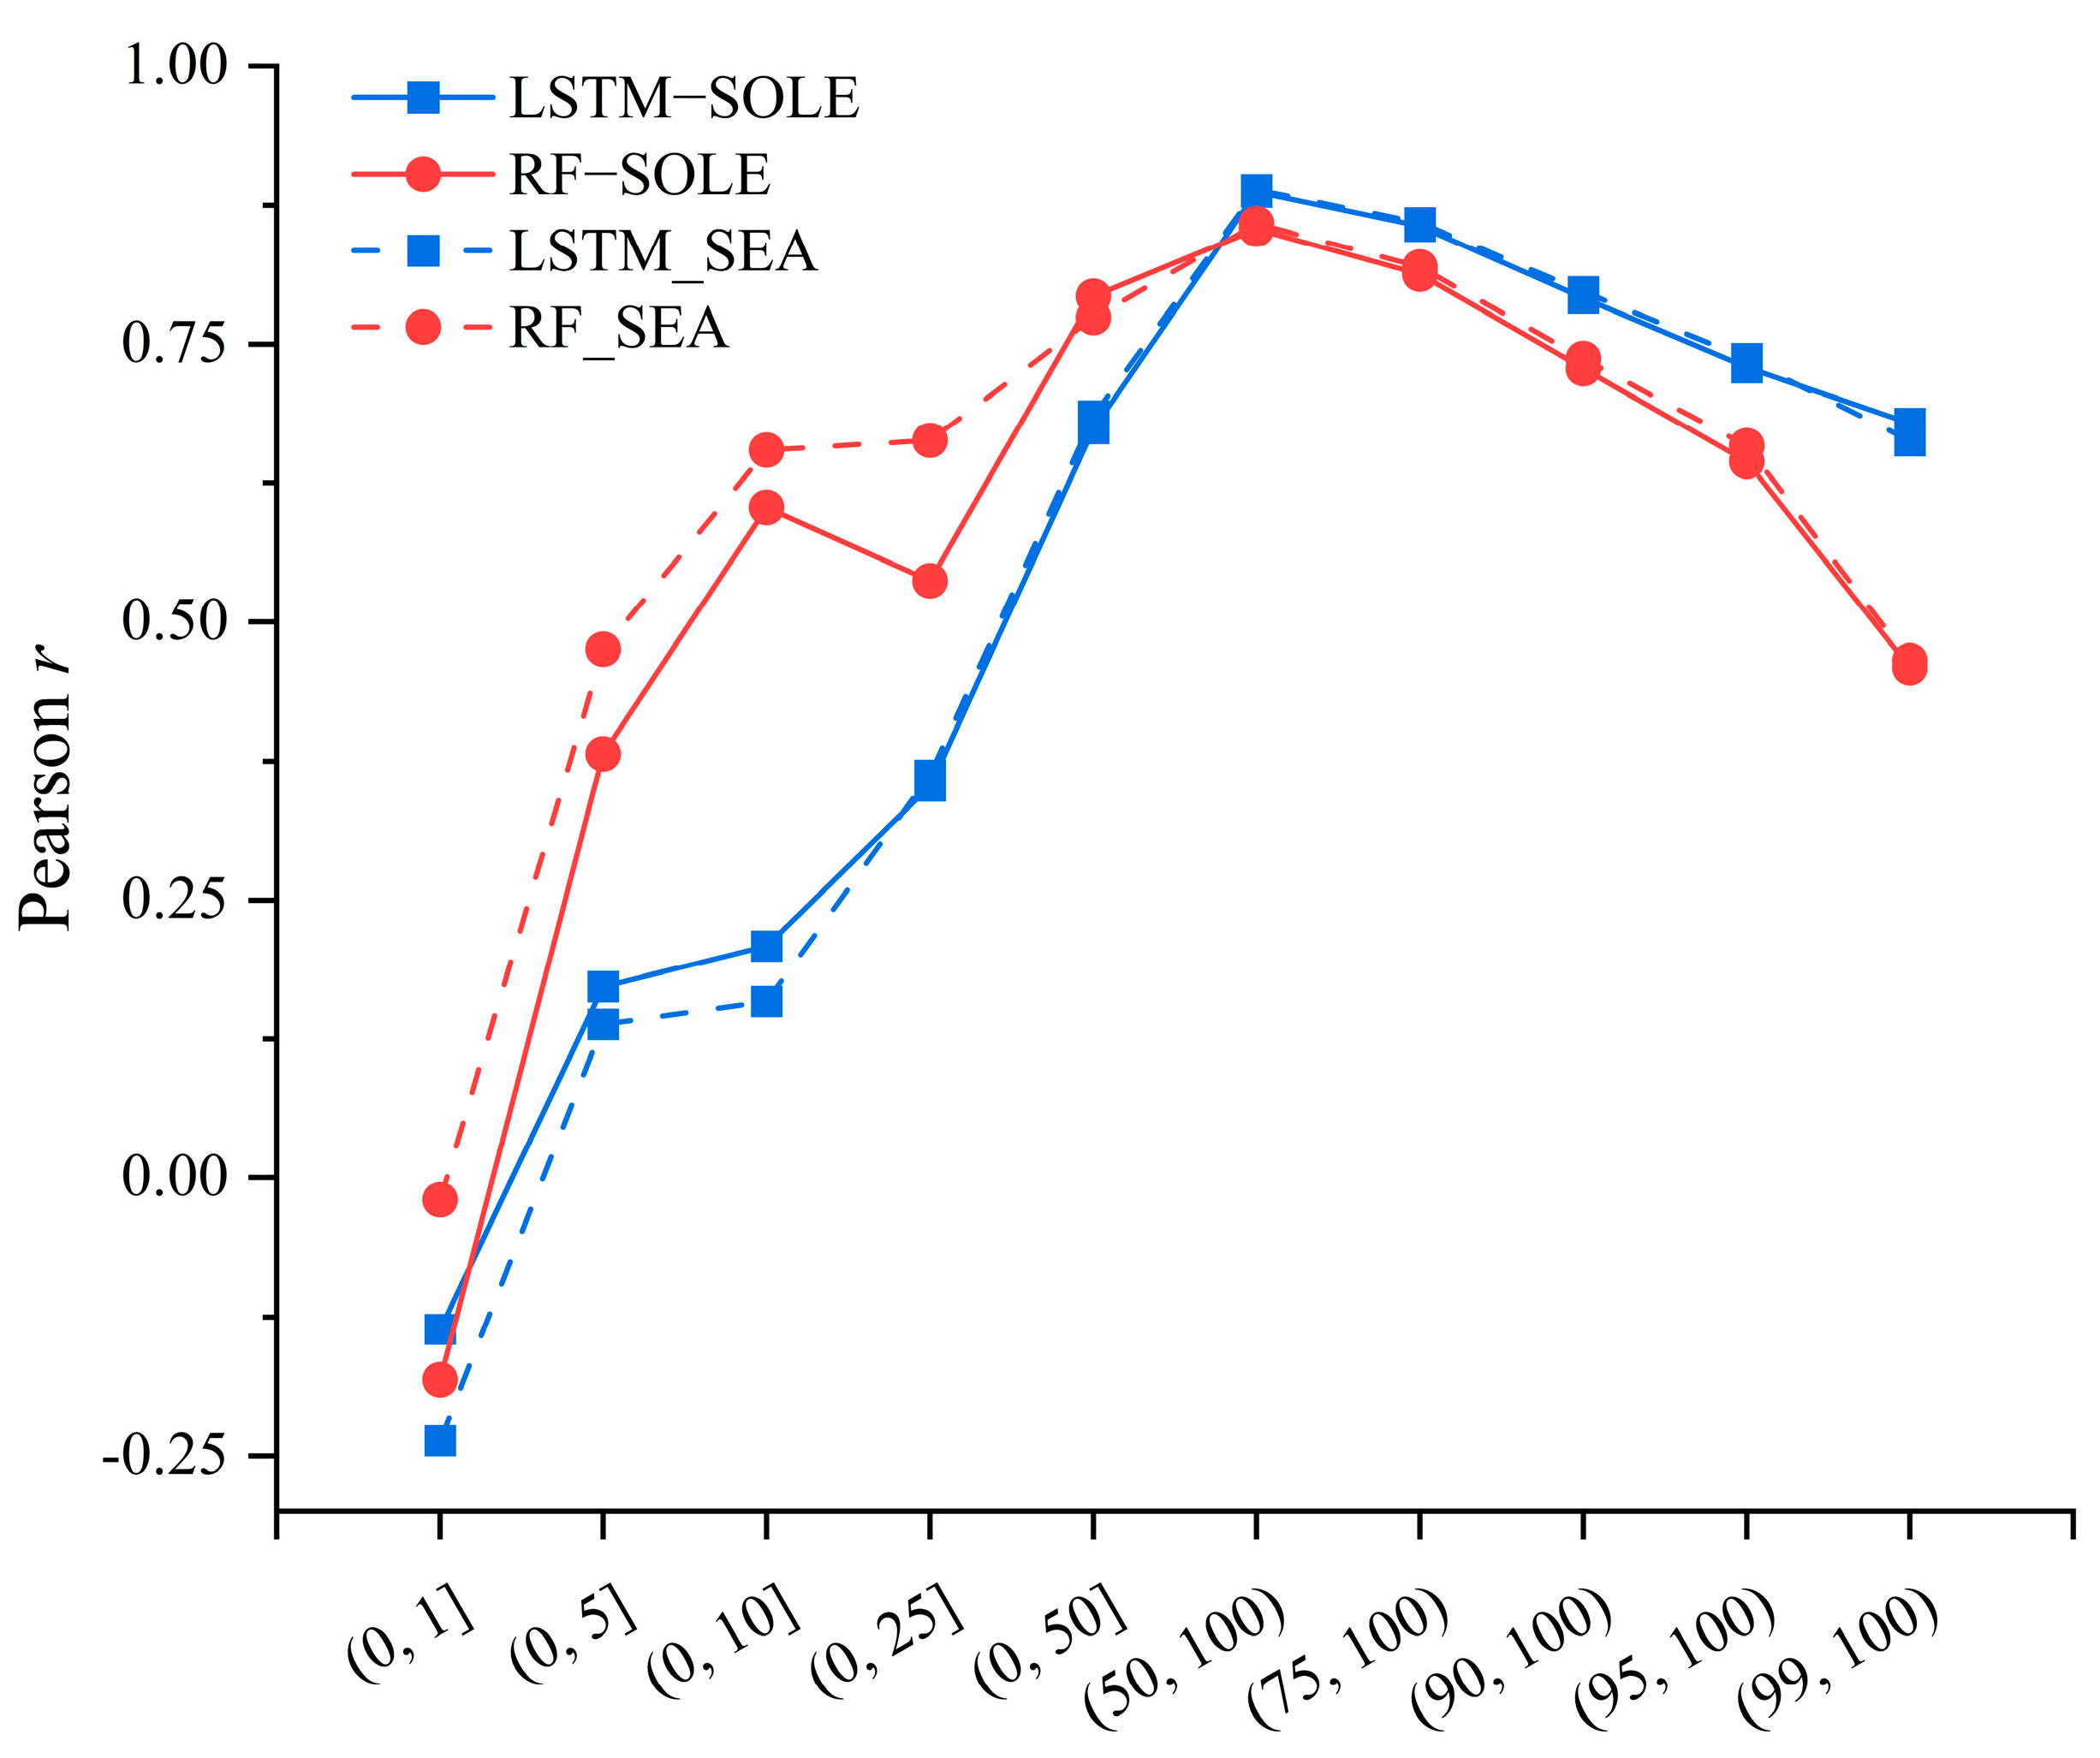
3.2. Comparison of the Rainfall—Runoff Simulation Models

The rainfall distribution in the study area has obvious seasonal characteristics. In order to verify the MERGED model proposed in Section 2.2.2 step by step, in this part, we first verify whether the season-distinguishing model (i.e., simulating the wet season and dry season separately) can enhance the effectiveness of the data-driven model. Further analysis is then carried out for extreme value models through integrated modeling, namely, the MERGED model.

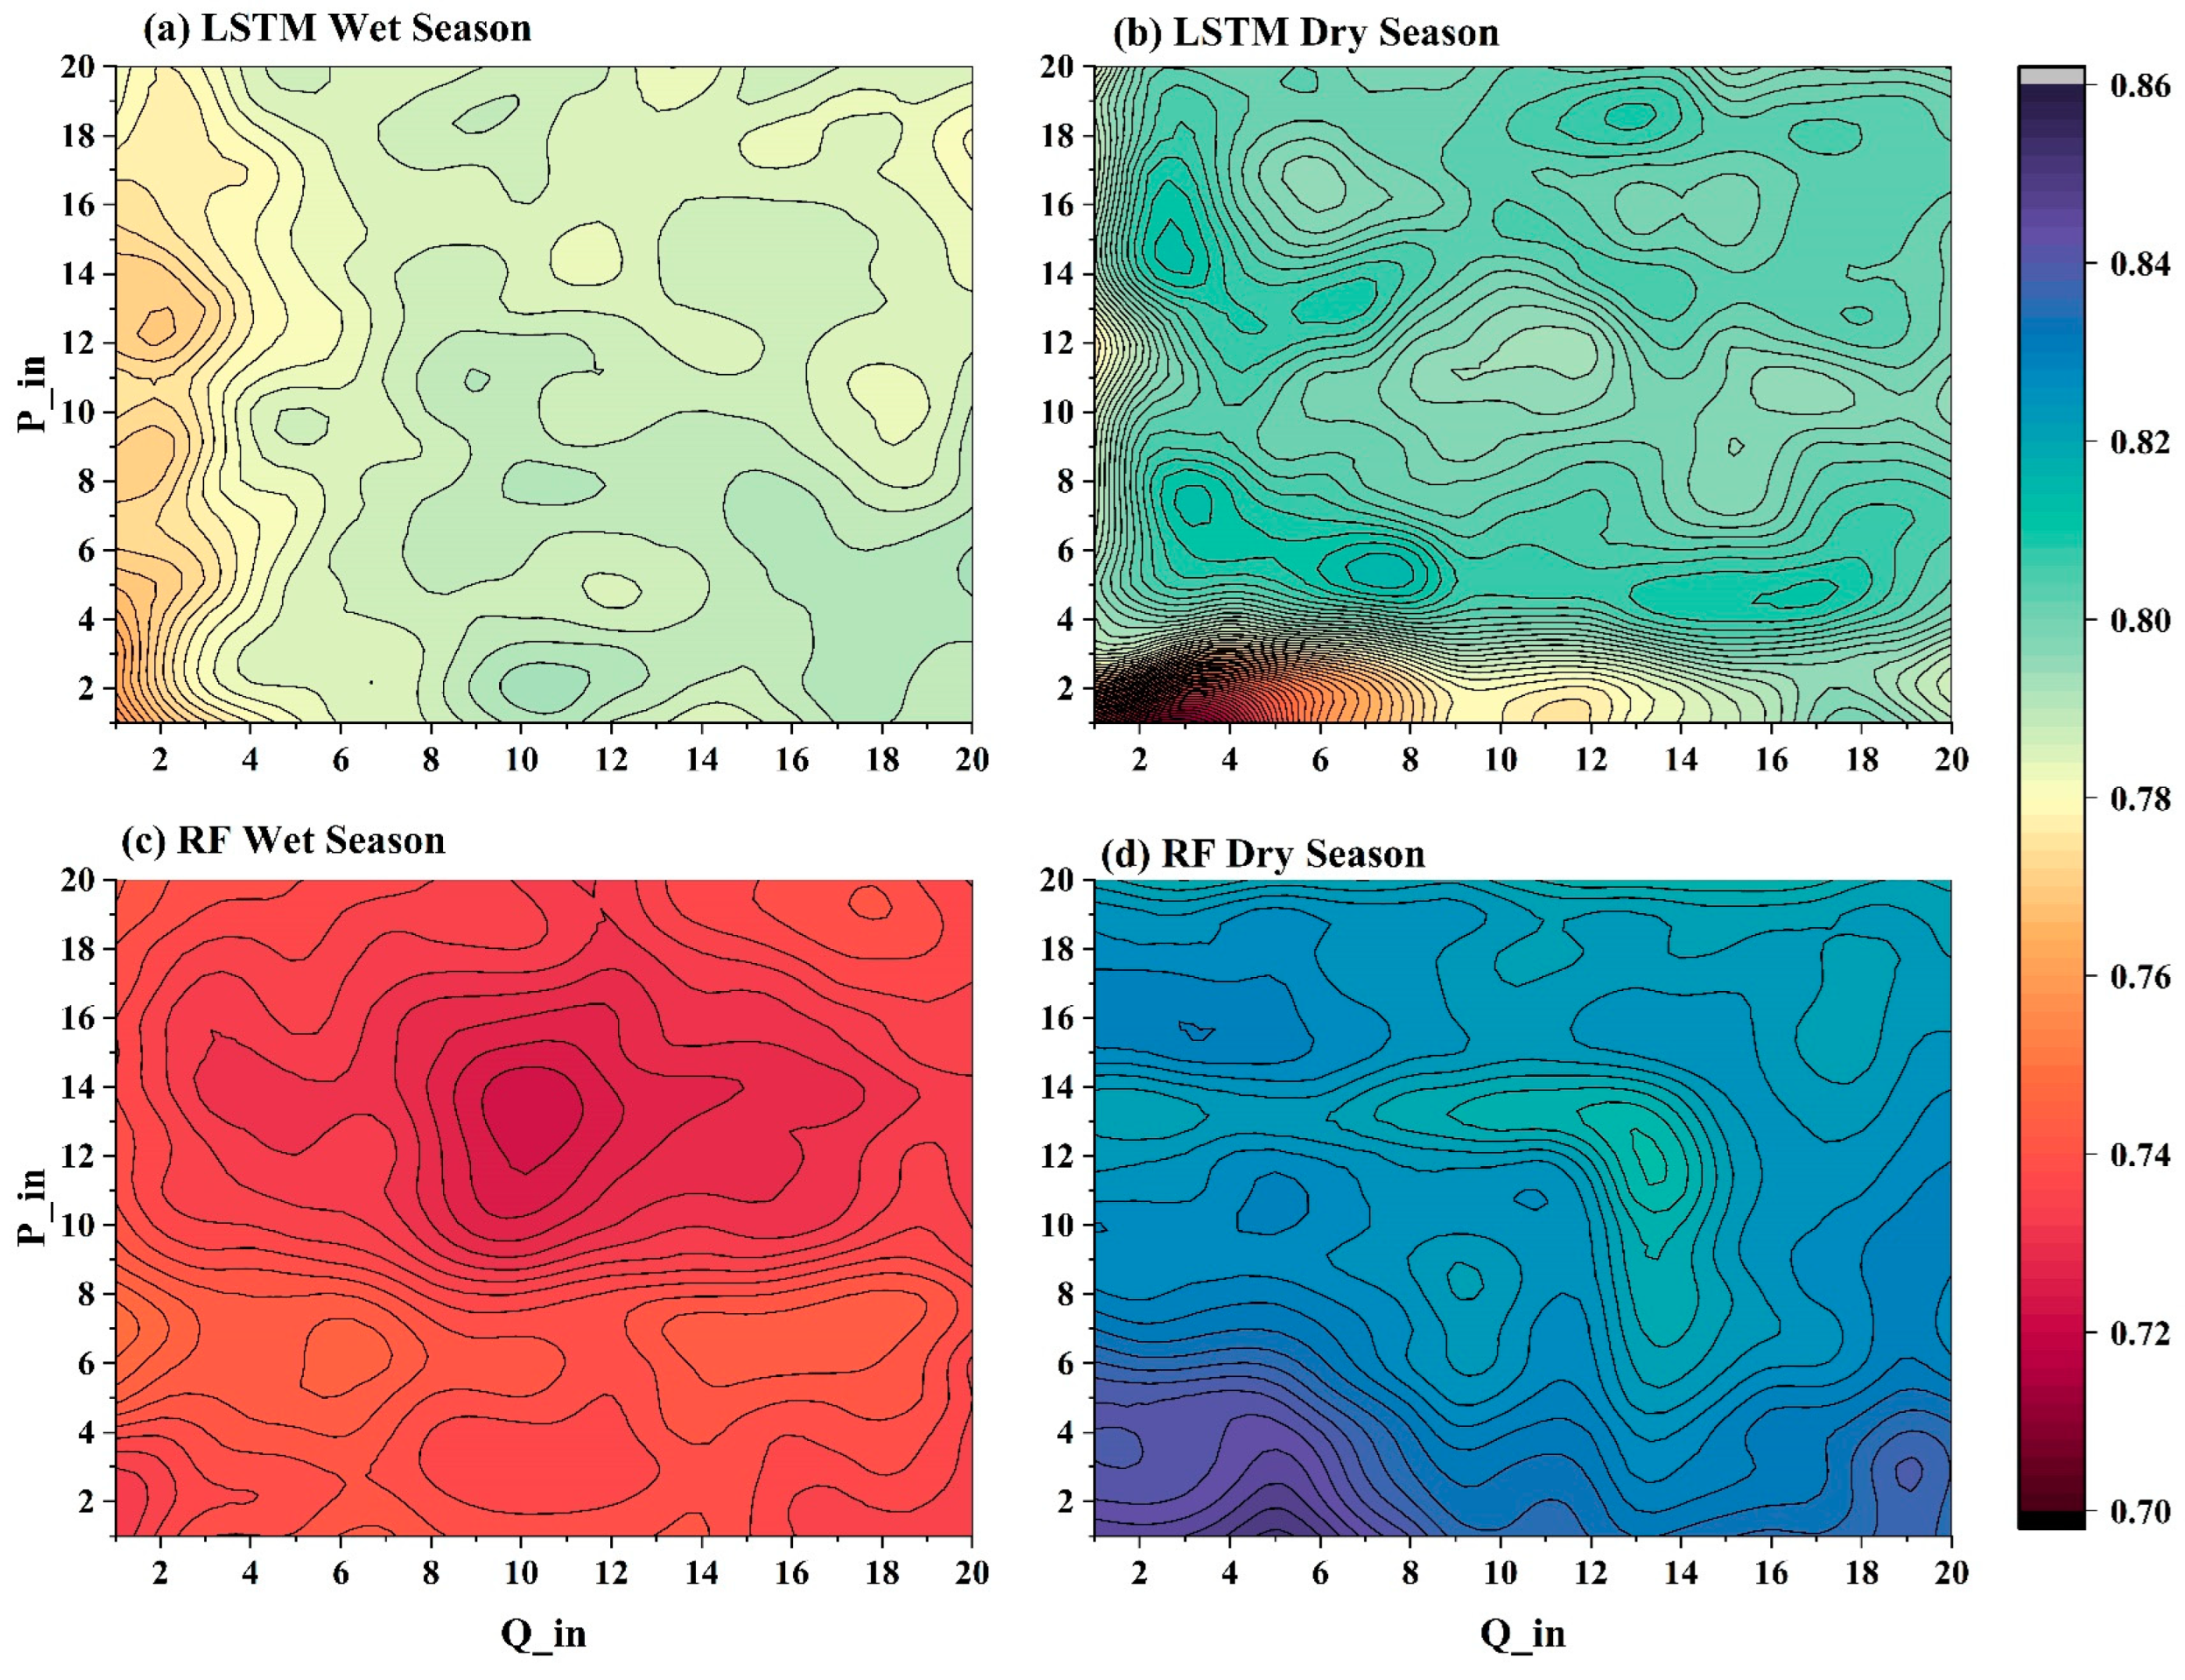
3.2.1. The Performance of Season-Distinguished Models

Figure 4 depict the N s e results of RF-SOLE and LSTM-SOLE with different combinations of previous rainfall and runoff inputs under the scenario of not distinguishing seasons, while the simulation results of the two models distinguishing wet and dry seasons are shown in Figure 5. The inputs for previous rainfall and runoff are denoted as P_in and Q_in, respectively.
Overall, as shown in Figure 4, LSTM-SOLE has better performance than RF-SOLE in all input combinations. The optimal input for LSTM-SOLE is the rainfall from the previous 2 days and the runoff from the previous 14 days. The N s e of the RF-SOLE reaches its maximum when taking the runoff from the previous 13 days and the rainfall from the previous 5 days. It can be seen from Figure 4 that there is a certain similarity in the optimal values of both models. The most significant difference is that the range of the optimal input combination for RF is very clear, while LSTM can achieve good results in several combinations. We further compare the season-distinguished models.
From the results in Figure 5, it can be seen that the performance of LSTM in wet/dry seasons is basically consistent with the non-season-distinguished models. In contrast, the optimal input combination of the RF-SEA model exhibits a more pronounced distinction between dry and wet seasons. Furthermore, the optimal input combination for the RF-based models has a more defined input range than the LSTM models, akin to the RF-SOLE model. Both models demonstrate superior performance during the dry season, which may be attributed to the more direct correlation between rainfall and runoff in this period, along with the comparatively less complex nature of precipitation events.
Table 3 shows the accuracy of LSTM-SOLE and RF-SOLE and season-distinguishing LSTM-SEA and RF-SEA. The optimal values of each metric are marked by underlining, italics, and bold. The results showed that SEA models improved the evaluation metrics that represent the mean values (RMSE, MAE, N s e , Pearson r, and K G E ) to a certain extent. Especially for LSTM, the ability to capture peak events (POD, FAR, and CSI) has been slightly improved. However, there is no improvement in the simulation of extreme values (FHV, FLV, and FMV) for both LSTM-SEA and RF-SEA. Scatter plots of the simulated sequence and the observed sequence are also shown in Figure 6; the results indicated that all models underestimated the high value of observed runoff, with the slope of the linear fit fluctuating at around 0.80. Season-distinguishing models showed no improvement in the aspect of linear slope. We further used Pearson r as an indicator to evaluate the simulation abilities of each runoff at varied percentiles. The results are shown in Figure 7. For runoff series below the 25th percentile, the simulation accuracy of the RF-based models is significantly higher than that of the LSTM-based ones. On the contrary, for runoff above the 50th percentile, the simulation results of the LSTM-based models are higher than those of RF. However, no matter whether using RF-based models or LSTM-based models, the wet/dry season division did not significantly improve the simulation results. It is worth noting that K G E is a comprehensive index that can reflect the simulation capabilities of models. RF-based models both have higher K G E than LSTM-based rainfall–runoff models. Although LSTM shows a good ability to simulate time series with rich features, the metric value of K G E is inferior to that of RF because of its insufficient ability to capture extreme values, resulting in smaller standard variance (STD, shown in Supplemental Table S1). Based on the above analysis, we expect that using RF will improve the extreme runoff forecasting capability of LSTM.

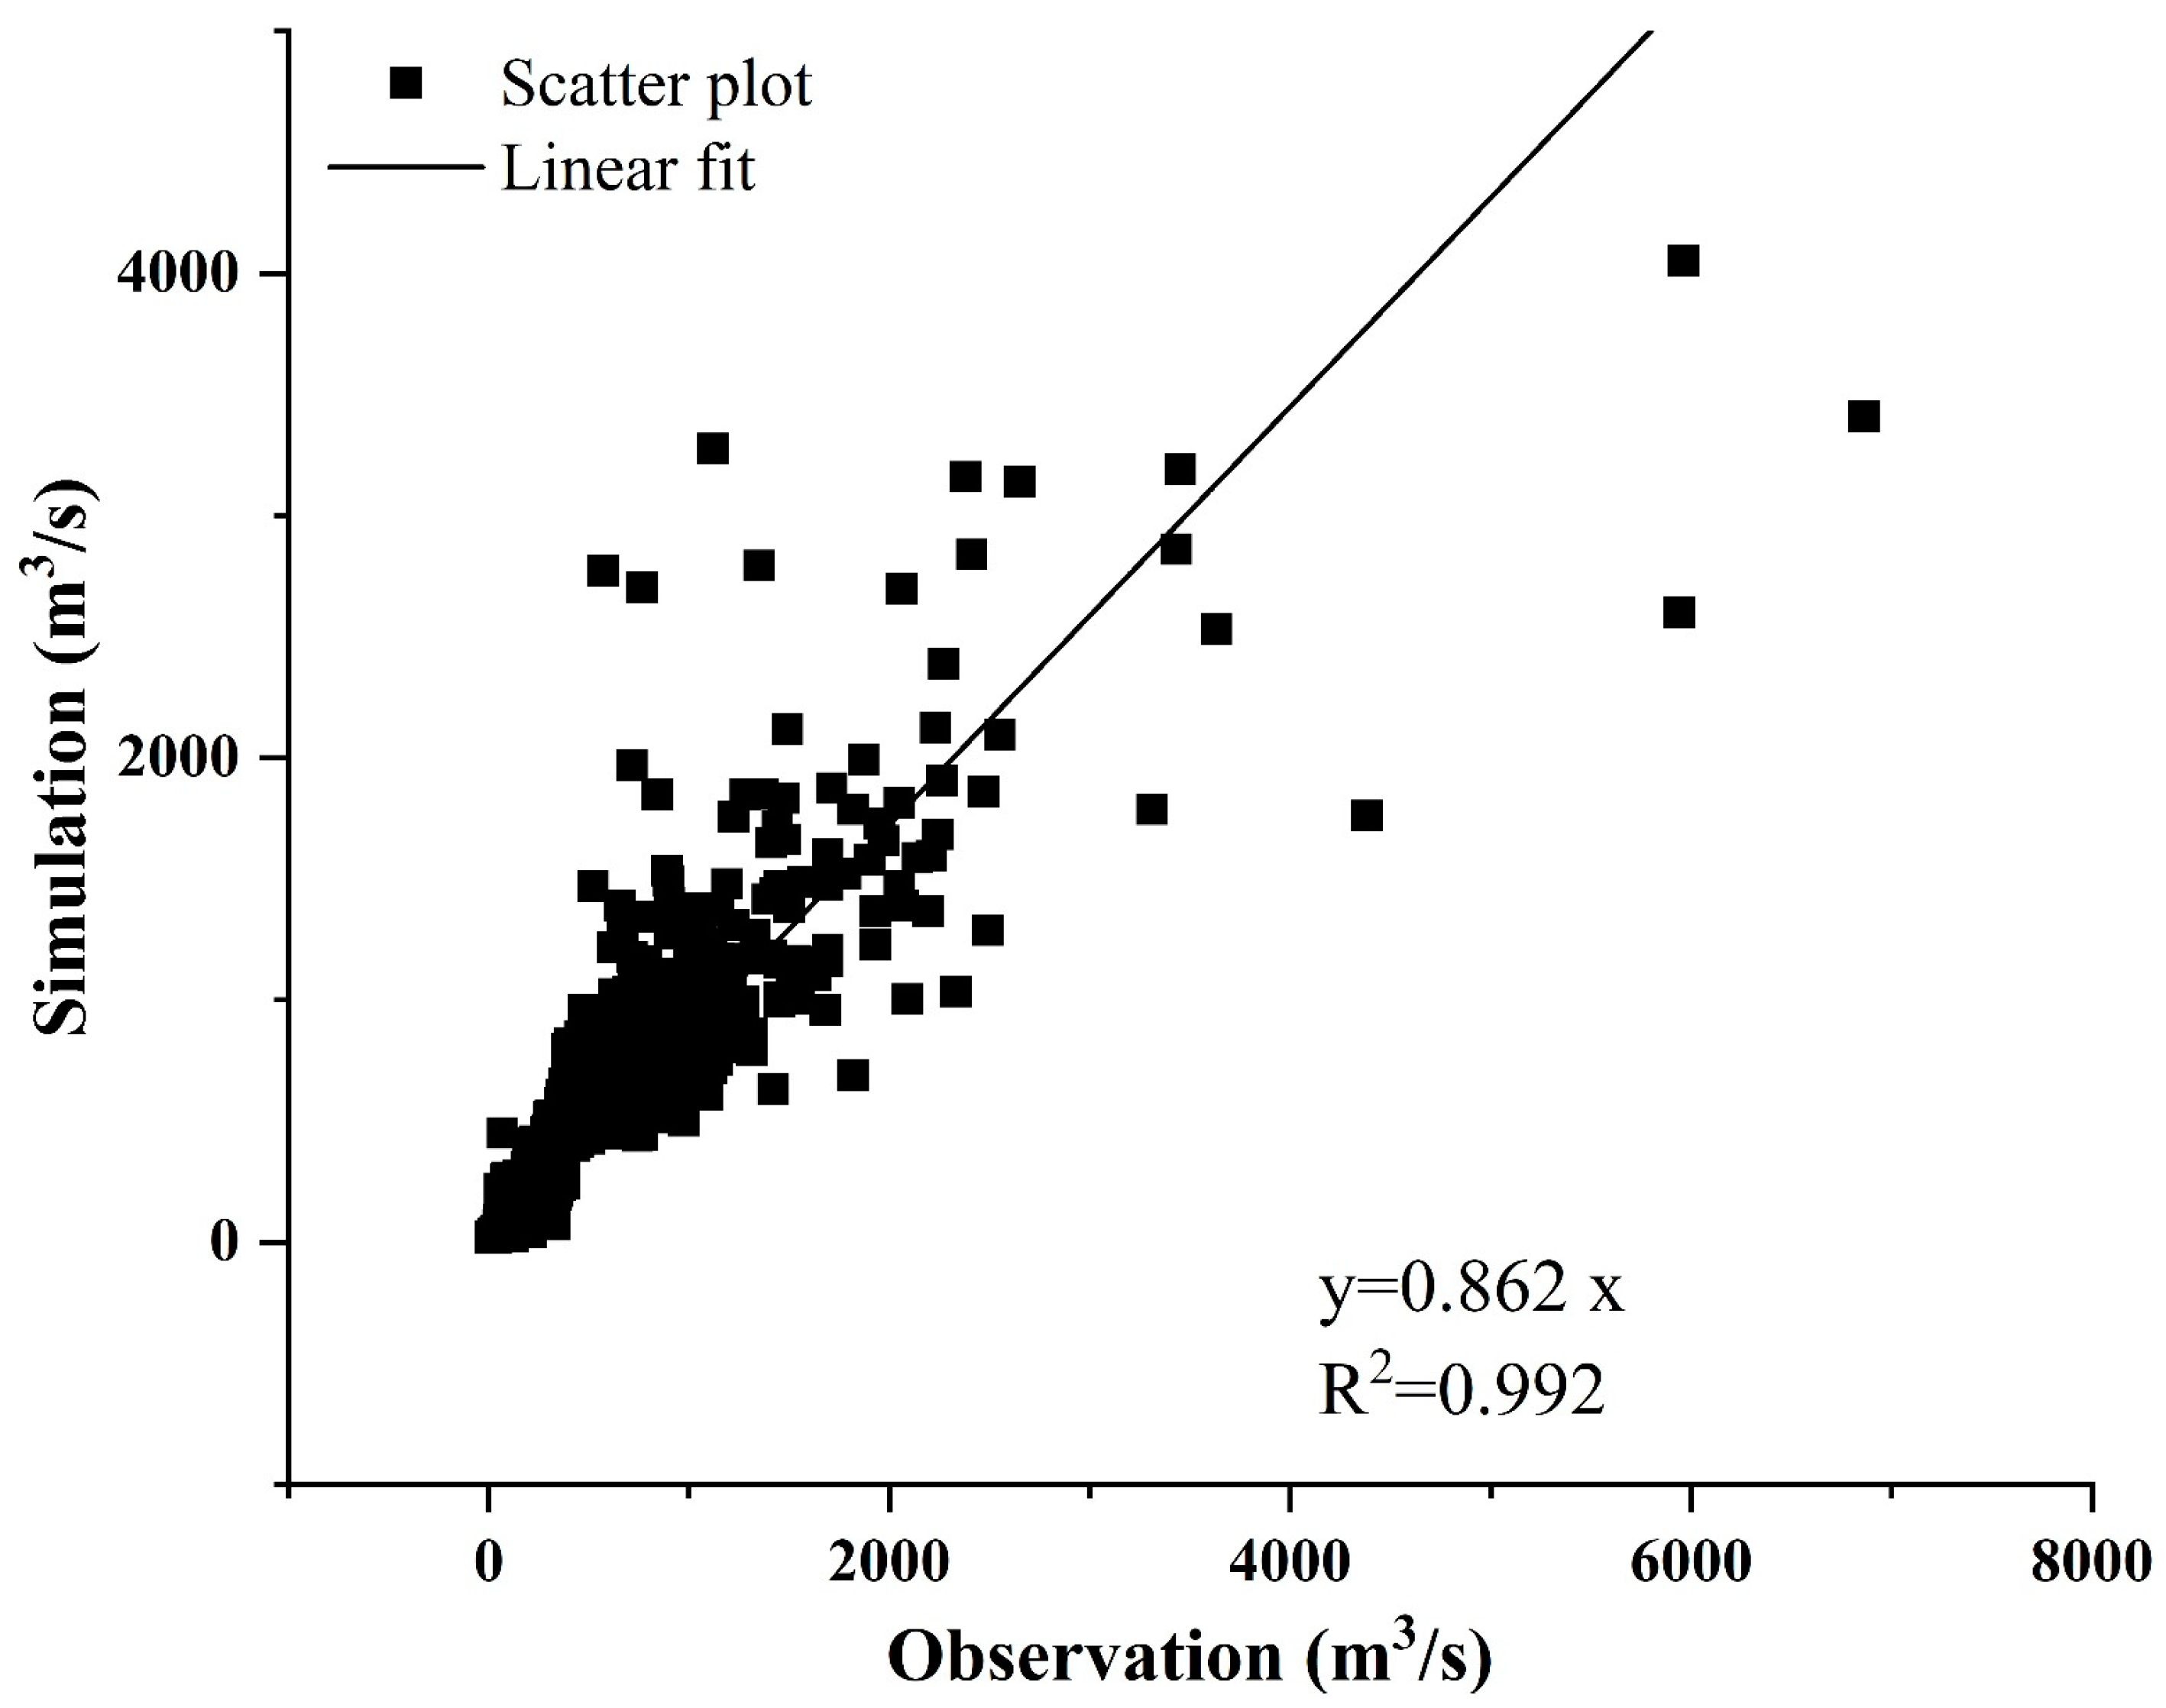
3.2.2. The Performance of the MERGED Model

Based on the above results, we used RF to simulate extreme values. Extreme flows are divided into extreme high flows and extreme low flows. In this paper, the 10th percentile and 90th percentile of the runoff in the natural period are selected as the thresholds for extreme high and low runoff, respectively. The result of the extreme flow model is then used to substitute the corresponding values simulated by LSTM-SOLE. Figure 8 depicts the results of optimal input combinations for the extreme models. The best inputs for extreme high flows are previous precipitation and runoff of 3 days (P_in = 3, Q_in = 3); and P_in = 5 and Q_in = 3 for extreme low flows. The results in Figure 8 show that the high extreme runoff is more strongly correlated with rainfall and runoff within 0–4 days, and extreme low runoff tends to be related to the rainfall from 6 to 10 days ago, which is basically consistent with the physical process of runoff generation. The combination of the optimal input factors differs greatly from the SOLE or SEA models, indicating that the data-based relationships for ordinary and extreme runoff are different.
Table 4 shows the evaluate metrics of the MERGED model, and the results are compared to LSTM-SOLE and LSTM_SEA. It can be seen from the table that the MERGED model is better than the other two LSTM-based models in almost all aspects. The STD of the MERGED model has been greatly improved (Supplemental Table S1), and thus the K G E has been significantly improved. By comparing POD, FAR, and CSI, the MERGED model has significantly improved the ability of capturing peak events compared to the sole model and seasonal model. Figure 9 shows the scatter plot of the MERGED model. The linear regression results show that the slope is much closer to 1.0 than the results in Figure 6. In summary, the MERGED model proposed in this paper can well improve LSTM’s ability in extreme value simulation.
Based on the above analysis, we believe that this is the best runoff simulation model under this research framework reflecting the relationship between rainfall and runoff in the natural period. In the next step, the MERGED model will be used to reconstruct the runoff during the natural period, compare it with the observed impacted runoff, and then analyze the contribution of human activities.

3.3. Impacts of Human Activity and Climate Change on River Runoff

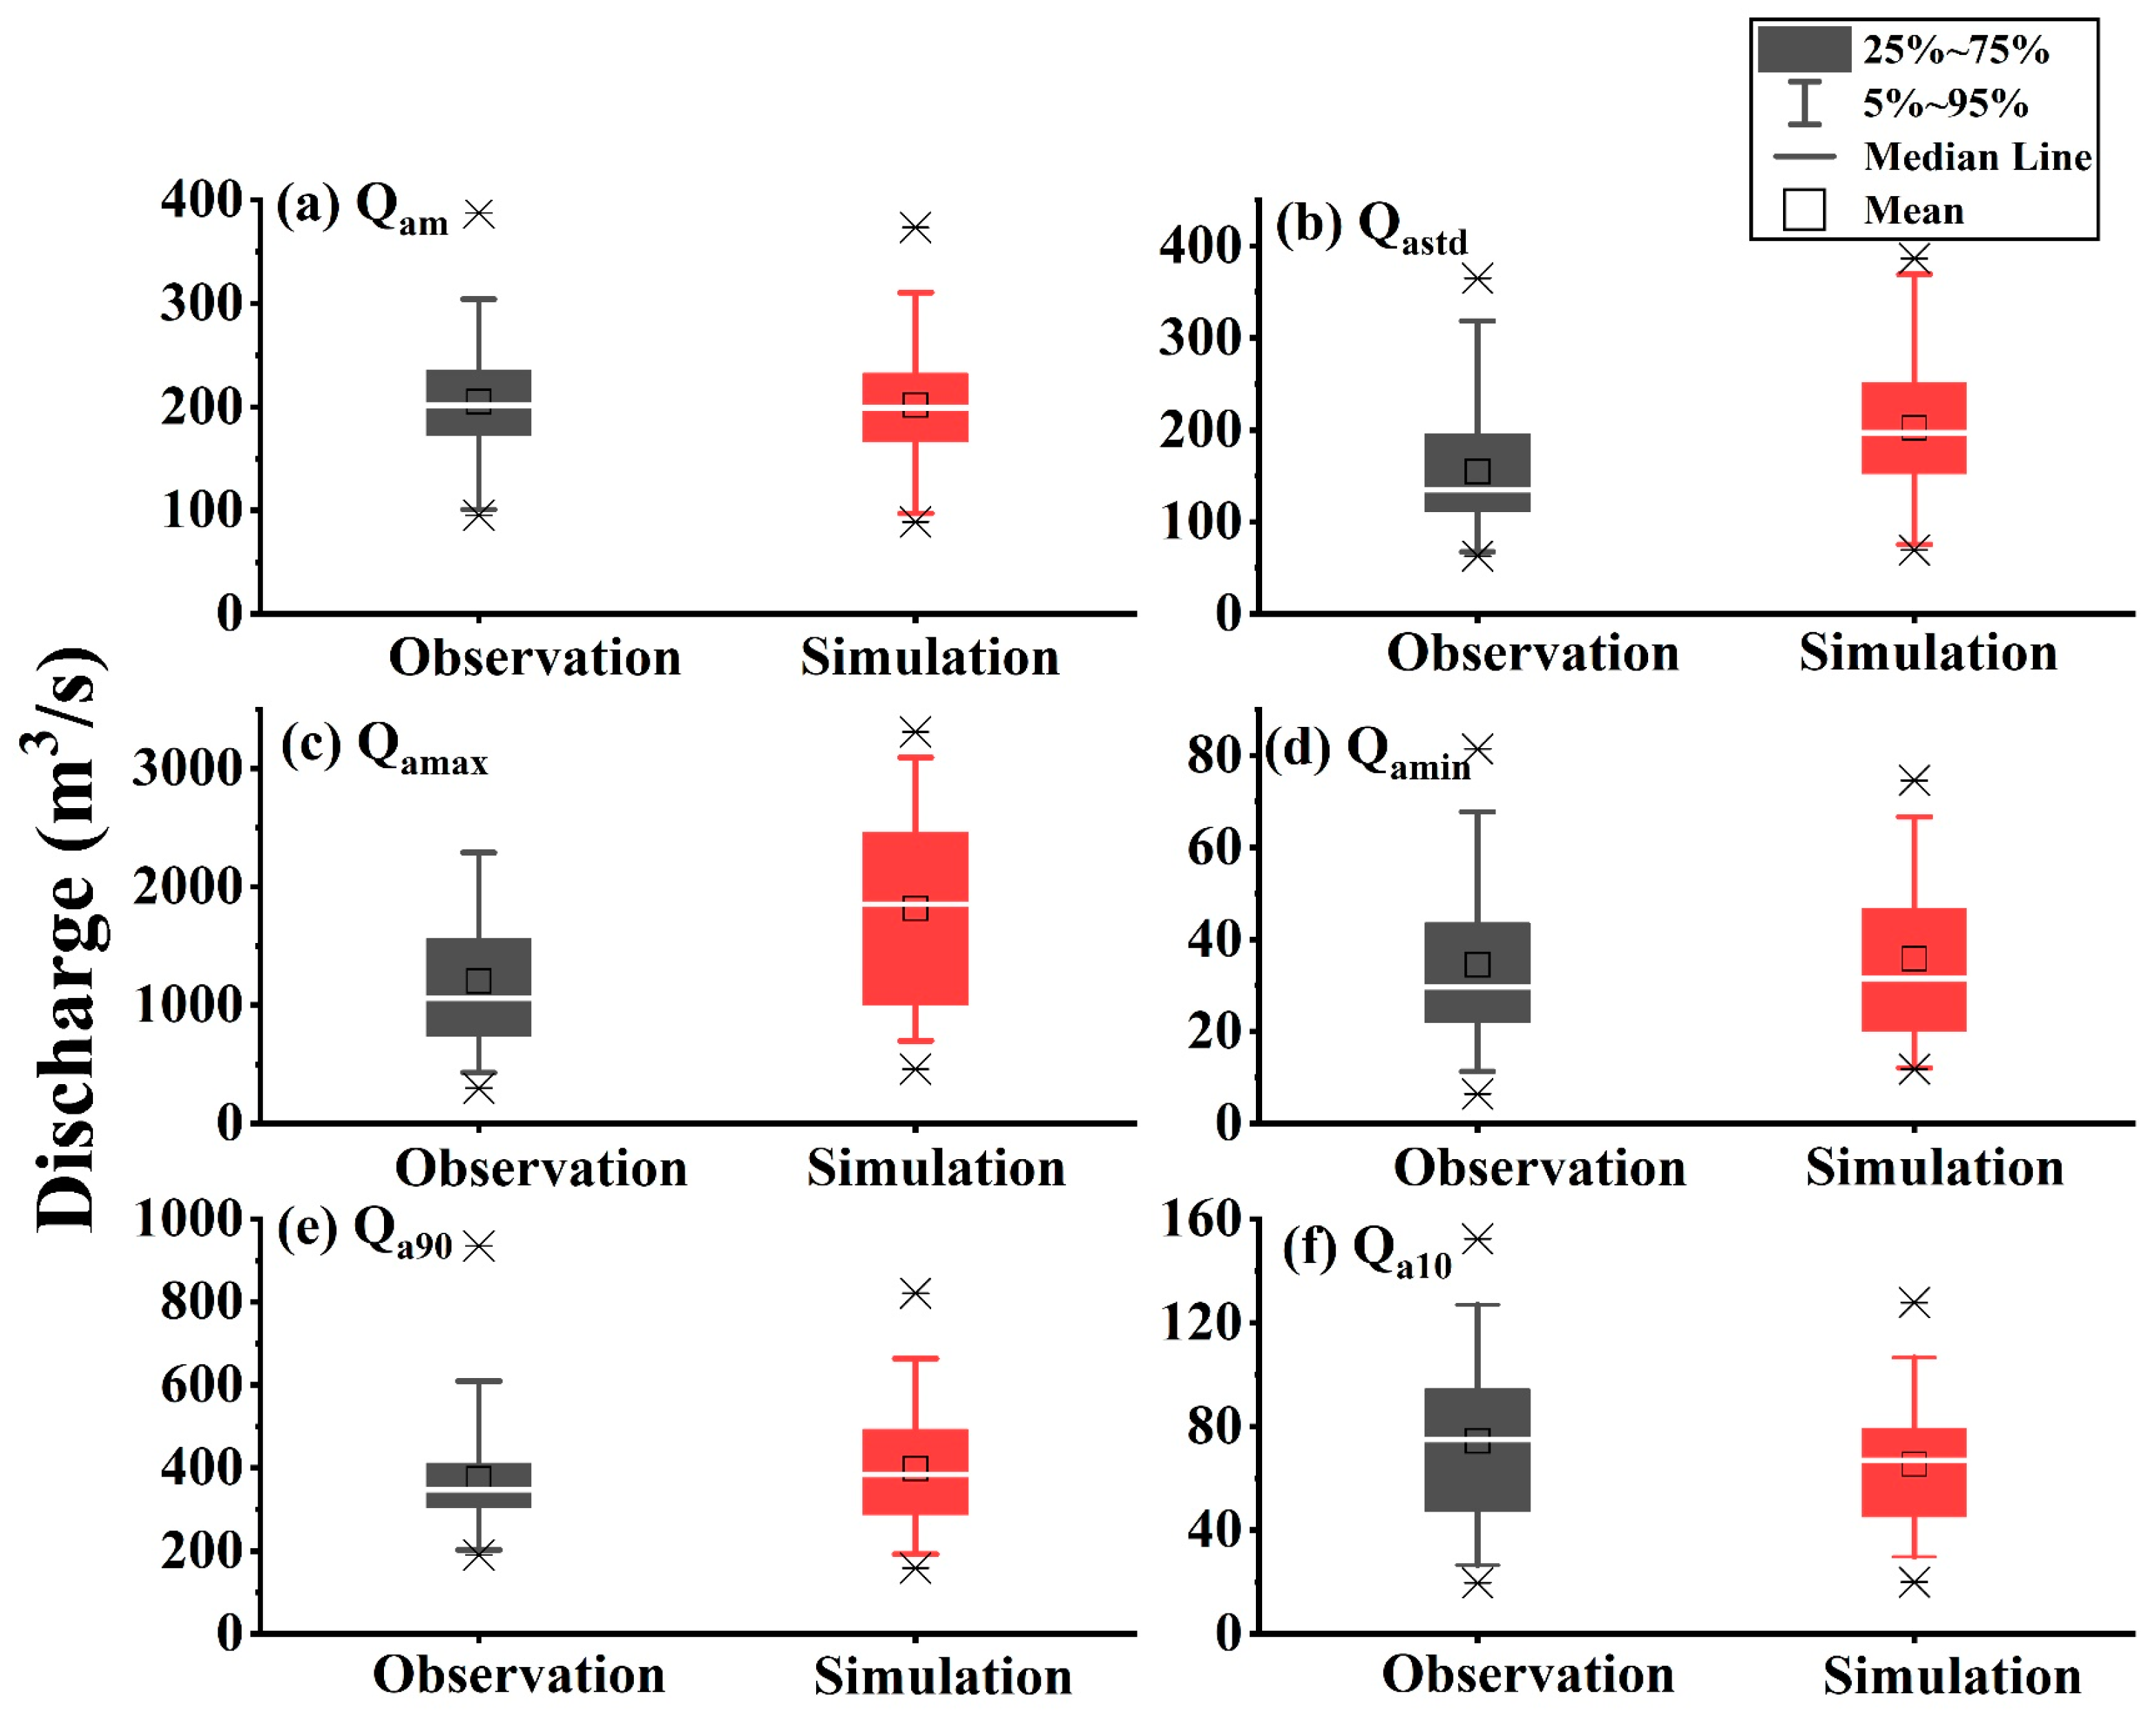
3.3.1. Impacts on Runoff Volume and Extreme Flows

Based on the natural runoff (obtained by MERGED) and LC observed runoff, Figure 9 depicts the double mass curve (DMC) of annual precipitation and runoff in the dry season and wet season, respectively. It is worth noting that MERGED is a rainfall–runoff model, so the influence of rainfall variation on runoff simulation cannot be eliminated; therefore, the results in Figure 10 can only reflect the runoff variation under the influence of human activities. The results show that runoff varied to a certain degree in both wet season and dry seasons. In the dry season, due to human activities, the runoff observed by LC is smaller than the natural runoff reconstructed by MERGED. Meanwhile, in the wet season, the LC observed runoff was only slightly lower than the natural runoff, indicating that human activities have little effect on the overall wet season.
We further compared the runoff characteristics of the natural period and impacted period of each year. The evaluation features include annual average runoff ( Q am ), annual STD ( Q astd ), annual maximum/minimum runoff ( Q amax / Q amin ), and 90th and 10th percentile of daily runoff of each year ( Q a 90 / Q a 10 ). The result of the impacted period is shown in Figure 11, and the results of the natural period are shown in Supplemental Figure S1 for comparison. Similar to Figure 10, in the impacted period, human activities have hardly changed Q am . The simulated natural Q astd is significantly higher than that observed by the LC. In contrast, the Q astd of the MERGED simulation shows similar results in the natural period, shown in Supplementary Figure S1; although the range of the boxplot is smaller compared to the observed data, the mean of Q astd is close to the observed data. This indicates that in the impacted period, due to the effect of the reservoir operation and other human activities, the variability in runoff is significantly reduced.
Q amax and Q a 90 also decreased due to human activities, and vice versa for Q amin and Q a 10 . Comparing the results from Figure 10, although the result of the DMC indicates that the runoff variability in the dry season is the most pronounced, the change in the low extreme value is smaller than the high extremes. Correspondingly, the total annual runoff during the wet season does not change much but the extreme values are significantly reduced.
This section uses the MERGED model in Section 3.2 to carry out a basic statistical analysis of the runoff variation during the impacted period. From this section, we can understand that during the impacted period, affected by various human activities such as reservoir regulation, the runoff of LC has changed, with more abundant flow in the dry season and slightly reduced flow in the wet season. With the results of these conclusions, we will carry out the following attribution analysis.

3.3.2. Attribution of Runoff Variation Based on the Budyko Framework

In order to attribute the changes in river runoff caused by climate change and human activities (non-climate-induced), the Budyko framework was applied. According to the previous section, the runoff change patterns in the wet season and dry season are quite different. Therefore, this section will analyze the dry season and wet season separately.
First, based on Equations (15)–(17) above, the elastic coefficients of each factor were calculated using the observed runoff, rainfall, and evapotranspiration data from 1956 to 2015. The absolute values of the elastic coefficients reflect the sensitivity of runoff to each impact factor, and the results are shown in Table 5 below. For the wet season, during both natural and impacted periods, the factors influencing LC runoff in order of impact are rainfall, evapotranspiration, and land surface. Runoff depth is positively correlated with rainfall changes and negatively correlated with evapotranspiration and land surface changes. In the dry season, the factors with the greatest impact on runoff depth changes are land surface changes, rainfall, and evapotranspiration, which is obviously different from the wet season. Therefore, for the annual sequence as a whole, the sensitivity coefficients from large to small are land surface changes, rainfall, and evapotranspiration. Comparing the natural period and impacted period, the sensitivity of the land surface is increasing in all seasons, especially in the dry season, and the runoff depth is positively correlated with precipitation and negatively corelated with evaporation and land surface in all seasons.
Based on Equation (14), the variation in runoff during the impacted periods were calculated. The cumulative total runoff variation ( Δ R c _ c ), cumulative climate-induced runoff variation ( Δ R c _ clim ), and cumulative non-climate-induced runoff variation ( Δ R c _ nc ) in each year are shown in Figure 12. Under various impacts, the runoff in the dry season gradually increases, while in the wet season, the cumulative runoff variation decreases. This conclusion is basically consistent with the DMC in Figure 9. It is noteworthy that irrespective of the season—be it wet or dry—both Δ R c _ clim and Δ R c _ nc exhibit a similar trend (manifested as both Δ R c _ clim and Δ R c _ nc being positive or negative simultaneously). Specifically, the influences of climate change and human activities on runoff do not counterbalance each other. Instead, the river system undergoes more pronounced alterations when these two factors are combined.
We further calculated the contribution rate (represented by C clim and C non _ c lim ) of climate factors and non-climate factors to runoff variation in the wet season and dry season, and the results are shown in Figure 12. Non-climatic factors account for 93.9% of the total runoff changes during the dry season and 64.5% during the wet season, indicating that the influence of human activities significantly outweighs that of climate change.
In order to investigate the relative contributions of land surface cover and reservoir regulation to the impact of human activities, this study further selected reservoir regulation volume and the NDVI to characterize their effects on LC runoff. It should be noted that in this study, the NDVI data were only available from 1981 onwards, and stable records of the FsbR outflow data were only available after its official operation in 1974. Therefore, the analysis in this section used data from 1980 to 2015. Wet season, dry season, reservoir regulation volume (represented by the difference between outflow and inflow), and the NDVI were considered, as shown in Figure 13. Correlation analysis indicated that in both seasons, the correlation coefficients between reservoir regulation volume and runoff changes were above 0.5, reaching a moderate positive correlation statistically; however, the NDVI showed an extremely weak correlation with runoff changes in both wet and dry seasons. Other studies have also shown that the relationship between the NDVI and runoff changes remains controversial. On the one hand, vegetation changes may affect surface runoff by influencing evapotranspiration, and thus an increase in the NDVI would reduce surface water resources. It should be noted that since the NDVI data are only available after 1981, they does not coincide with the complete impacted period established in this study. Therefore, the results here have a certain degree of uncertainty. However, since the NDVI data also have a relatively long time series, they can be considered to have a certain level of reliability.

4. Discussion

4.1. Characteristics and Uncertainty of the MERGED Model

This paper compares the capabilities of Random Forest and LSTM in hydrological modeling and proposes a hybrid model based on the characteristics of both methods. In Section 3.2, the sensitivity of each model to antecedent input factors is discussed. Comparing Figure 4, Figure 5 and Figure 8, one intuitive interpretation is that the input ranges with high accuracy for RF are very concentrated, whereas LSTM achieves high N s e values across multiple combinations (for example, in Figure 4, RF shows optimal N s e when Q_in = 13 and P_in = 4–6, while LSTM achieves high NSE across several value ranges such as combinations of Q_in = 8 and P_in = 2, Q_in = 14 and P_in = 2, and Q_in = 11 and P_in = 11, etc.). On the other hand, the accuracy of LSTM in both dry and wet seasons does not differ significantly from the LSTM-SOLE model, whereas RF exhibits clear seasonal characteristics, with the accuracy of the RF model during the dry season being the highest among the four seasonal models, while its accuracy during the wet season is the lowest, as shown in Figure 5. These results are consistent with the features of the two types of models; that is, LSTMs are generally superior for problems involving sequential data with long-term records and rich features [65], while RF is often better for problems that involve classification or regression of data with independent features [66]. Therefore, we concluded that RF can provide more intuitive information regarding influence relationships.
LSTM training relies on a substantial amount of data. In the context of this study, the possible reason for this could be the insufficient number of extreme values or the need to sacrifice these extremes to achieve overall high performance. Therefore, under such circumstances, a combined modeling approach is a competitive modeling strategy. The employment of the proposed MERGED method has the potential to enhance the performance of the original model. Nevertheless, uncertainties persist in several aspects: the selection criteria for the original models, the determination of antecedent precipitation and runoff as input variables, and the thresholds for extreme events. The inherent uncertainties of this model necessitate further empirical investigation to ascertain the most efficacious combination.

4.2. Impact of Human Activities on River Systems

In the recent runoff variation attribution studies under the Budyko framework, the effects of rainfall, evapotranspiration, and land surface changes on runoff are typically considered. Land surface characterization parameters are commonly used to represent the impact of human activities on runoff. This approach helps to quantify the influence of various human-induced factors on the hydrological processes and provides insights into the complex interactions between human activities and the natural environment [15,23,35]. In this type of analysis, the research period is first divided into multiple periods, and the land surface parameter values of each period are used to characterize the surface changes between the periods. This approach usually does not reflect the monthly or finer scale runoff change process, thereby neglecting the changes in extreme values to a great extent. However, under the context of climate change, the impacts of short-duration extreme value changes are highlighted. On the other hand, though previous studies concerning the Budyko framework use the NDVI as an indicator to help explain the parameter n in the equation [34,35,67], the physical meaning of the land surface parameter still requires further mechanistic research [35]. For example, the results of Figure 13 show that according to the correlation with Δ R non _ clim , the effect of reservoir activities on runoff changes is more specific (the correlation coefficient is moderately correlated), while the changes caused by the NDVI are only weakly correlated with Δ R non _ clim . This indicates that at least in this study area, using a single land surface change to characterize human activities is not entirely reasonable. This conclusion is similar to the research conclusions of Ning et al. [35] and Zhang et al. [34], which highlighted that land surface changes are more related to climate-induced runoff variations, and due to the complexity of vegetation–climate feedbacks, it is challenging to definitively ascertain the influence of the NDVI on runoff variability.
Regarding the runoff changes caused by reservoir regulation, a comparison of average dry season runoff with the annual minimum runoff series Q a min and the 10th percentile low flow series Q a 10 is shown in Figure 11; the mean value of the impacted period is significantly larger than the mean value of the natural period, while Q a min and Q a 10 have no significant change. We inferred that events in the dry season are more affected by human activities but the reservoir shows limited effectiveness in providing water supply during extreme low water periods. Conversely, for the annual maximum Q a max and 90th percentile series Q a 90 , the situation is the opposite, suggesting that during the wet season, the reservoir can effectively regulate the flood process, which is also facilitated by the extremely large storage capacity of the FsbR in the study area. We acknowledge that the rainfall–runoff model posited in this study is not without its limitations, and as such, the discrepancies between the simulated and observed runoff values during periods of human impact may not solely represent the effects of human activities. Indeed, the difference between simulated and observed runoff likely encompasses both the model’s intrinsic prediction errors and the external influences under consideration. To ensure a more scientific and accurate interpretation, it is essential to differentiate the model’s estimation error from the actual impact of human activities. The findings of this study suggest a notable human influence on runoff, and the model demonstrates robust performance during natural periods, which lends credence to our results that human activities significantly affect runoff, despite the potential for model bias.
Global climate change has the potential to cause great fluctuations in runoff [68]. The frequent occurrence of extreme events will increase the pressure on water resource management, and the runoff on a daily scale or a finer time scale may undergo more drastic changes [5,39]. Figure 12b shows that runoff affected by climate change has increased and then decreased in recent decades as a possible result of global warming. Current numerical models still show inconsistencies in predicting the evolution of runoff under future climate change, but the increase in the frequency of extreme events is an indisputable fact. Therefore, it is necessary to continuously improve the operation and management ability of reservoirs to cope with these challenges.

5. Conclusions

In this study, we propose a framework for carrying out attribution analysis of runoff evolution in areas affected by reservoir operations. This framework allows us to better understand the complex interplay of factors influencing runoff and provides a robust tool for assessing the impacts of human activities such as reservoir operation. Our major findings can be summarized as follows:
(1)
In this study, we addressed the challenge of reconstructing extreme values in changed runoff time series by proposing a coupled rainfall–runoff model based on LSTM and RF to evaluate the impact of reservoir operation. The results show that the MERGED model proposed in this paper can largely leverage the ability of both models and outperform the SOLE and SEA series models in most evaluation metrics. For instance, the comprehensive indicator K G E remarkably improved from 0.79 in LSTM-SOLE to 0.864 in MERGED, and the CSI, an indicator representing the recognition rate of peak events, also increased from 0.160 to 0.193. The proposed framework can be utilized in the field of hydrological forecasting in future research.
(2)
We further conducted a statistical analysis of the observed and reconstructed runoff for the dry season and the wet season. For the annual average, there was no significant change in runoff. The DMC curve shows that the total runoff in the dry season significantly increased compared to the natural period, but the extreme values did not change. Meanwhile, in wet the season, the total runoff slightly decreased, but the extreme values were significantly reduced by reservoir operation. Indeed, in the context of climate change where drought and flood extreme events are becoming more frequent, reservoir operation rules need to not only consider the demand for flood control but also strengthen the ability to handle extreme drought events. This highlights the need for more robust and flexible water management strategies that can adapt to the changing climate and extreme events.
(3)
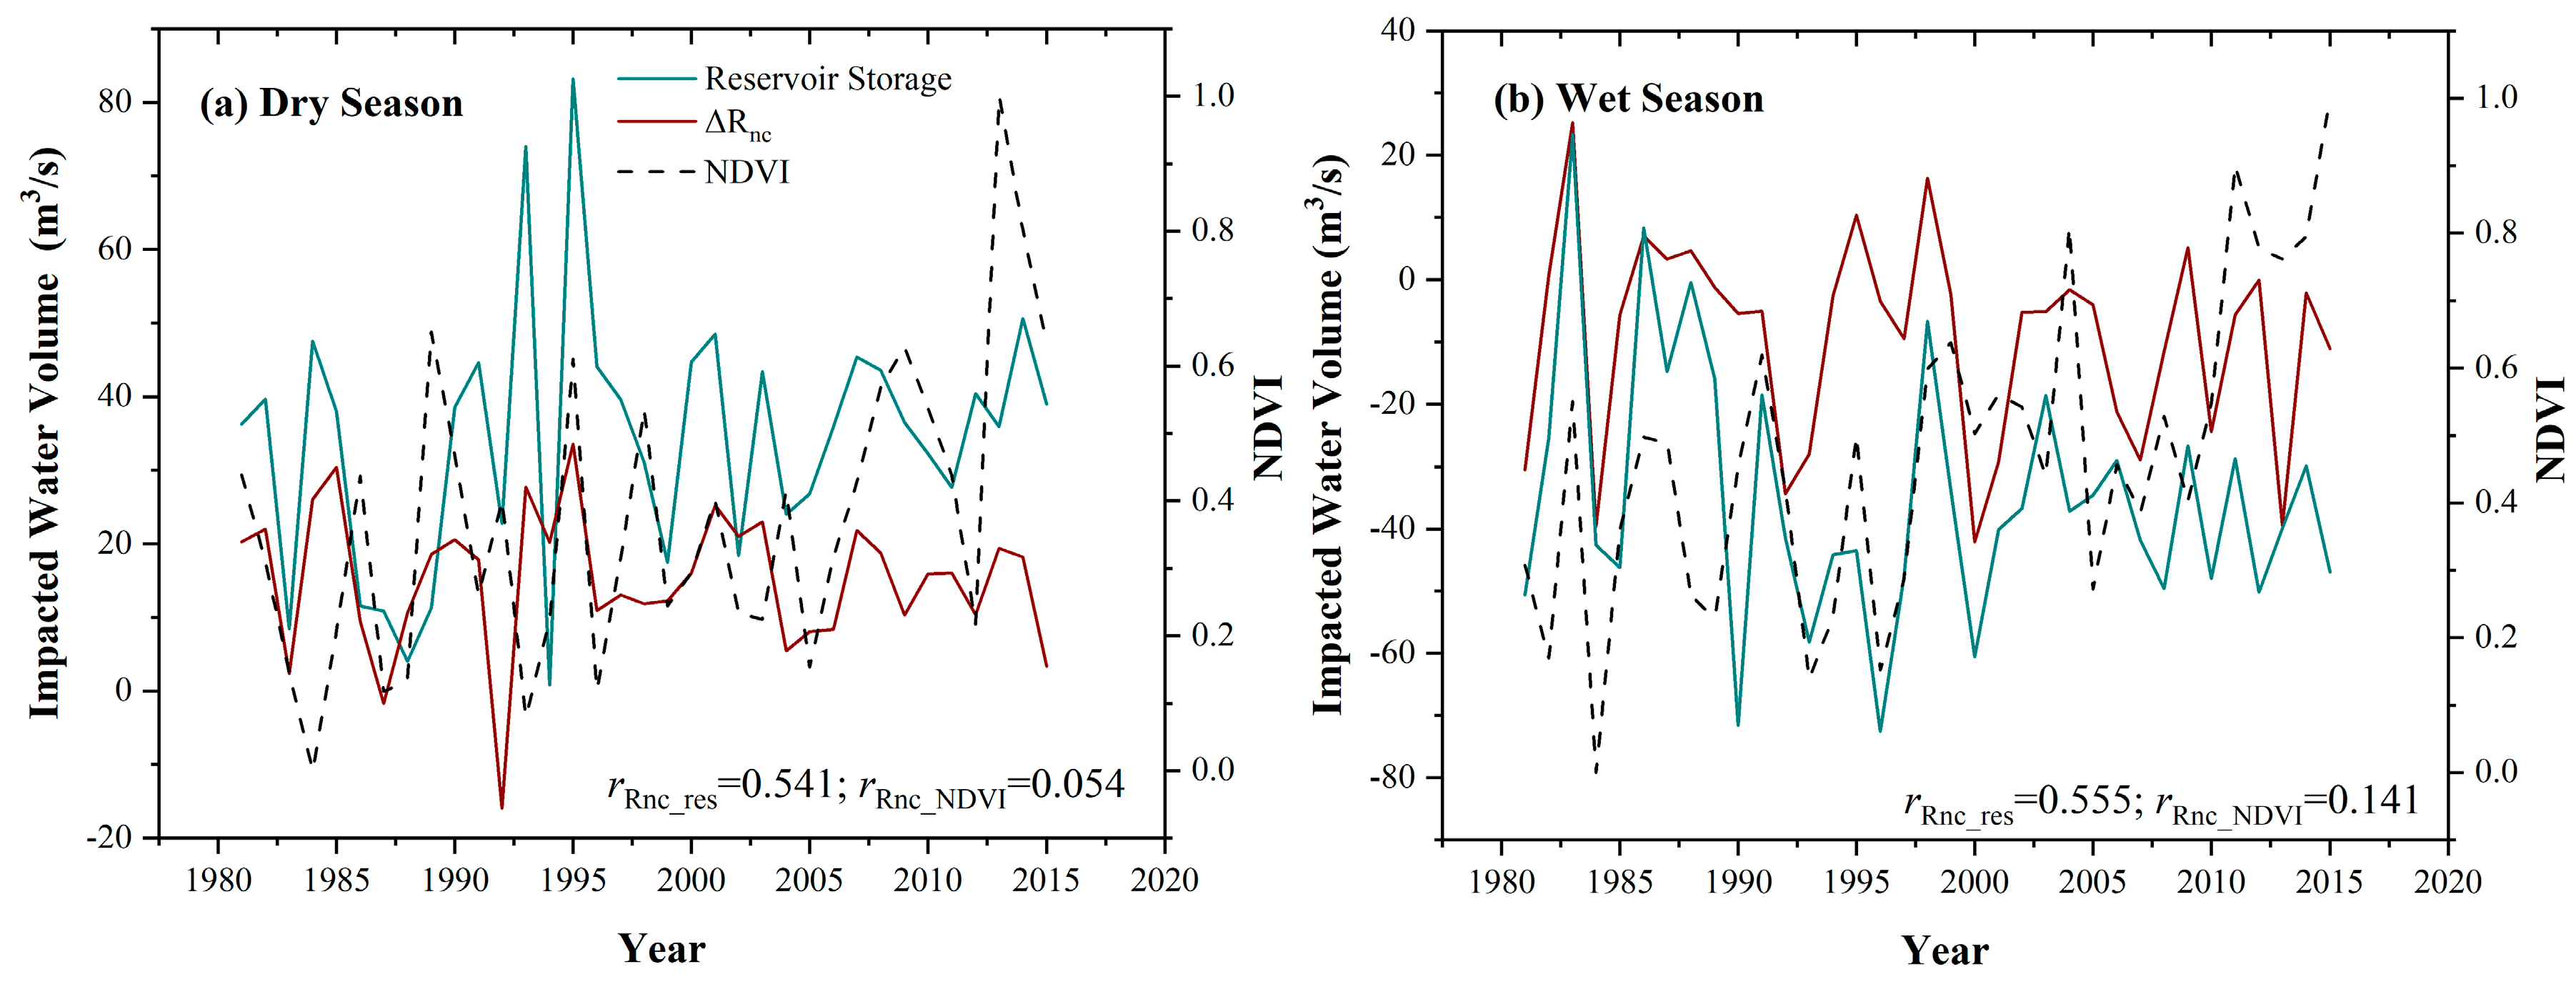
In the wet season, runoff is most sensitive to rainfall, while in the dry season, runoff is most sensitive to changes in the land surface. Irrespective of the season, the influence of the land surface on runoff changes was amplified during the impacted period. The results of the contribution rate show that in the dry and wet seasons, the contribution rates of human activities to runoff variation are 93.9% and 64.5%, respectively. However, it is not reasonable to categorize all human activities with the land surface. We further examined the degree of impact of reservoir regulation and the NDVI on the Δ R n c . The results show a moderate correlation with reservoir regulation and a weak correlation with the NDVI in both seasons.
Future research endeavors should delve deeper into understanding the physical mechanisms underpinning the feedback of the NDVI on the runoff process. Additionally, there is a need to enhance the complexity of the Budyko framework to enable a more detailed temporal characterization of runoff and a more comprehensive reflection of the impacts exerted by various human-induced factors.

Supplementary Materials

The following supporting information can be downloaded at: https://www.mdpi.com/article/10.3390/atmos15020164/s1, Table S1: Standard variance (STD) of the observation runoff and simulated runoff derived from 4 rainfall–runoff models; Figure S1: Same as Figure 10 but for natural periods.

Author Contributions

Conceptualization, X.C. and L.Z.; methodology, L.Z. and X.C.; software, L.Z.; validation, L.C. and J.L.; data curation, L.Z.; writing—original draft preparation, L.Z.; writing—review and editing, L.C. and J.L.; project administration, B.H. All authors have read and agreed to the published version of the manuscript.

Funding

This research was funded by the Key-Area Research and Development Program of Guangdong Province, grant number 2020B0101130018 and 2020B0101130001; and the Project for Creative Research from Guangdong Water Resources Department, grant number 2022-02 and 2020-15.

Informed Consent Statement

Not applicable.

Data Availability Statement

(1) The APHRODITE data can be downloaded at http://aphrodite.st.hirosaki-u.ac.jp/download/; (2) the NDVI used in this study is provided by the National Ecosystem Science Data Center, the National Science and Technology Infrastructure of China, and can be downloaded at http://www.nesdc.org.cn; (3) the meteorological data are provided by the China Meteorological Data Service Center, https://data.cma.cn/; (4) the hydrological data and reservoir regulation data are provided by the Hydrological Bureau of Guangdong Province, https://slt.gd.gov.cn/zsdw_2021/gdsswj/, all links accessed on 23 January 2024.

Acknowledgments

We thank Akiyo Yatagai and her colleges for developing and sharing the APRODITE dataset, and we thank the China Meteorological Data Service Center, the Hydrological Bureau of Guangdong Province, and the National Ecosystem Science Data Center for providing the research data. The authors greatly appreciate the anonymous reviewers for their valuable comments and contributions to this paper.

Conflicts of Interest

The authors declare no conflicts of interest. The funders had no role in the design of the study; in the collection, analyses, or interpretation of data; in the writing of the manuscript; or in the decision to publish the results.

References

  1. Lauri, H.; Moel, H.D.; Ward, P.J.; Räsänen, T.A.; Keskinen, M.; Kummu, M. Future changes in Mekong River hydrology: Impact of climate change and reservoir operation on discharge. Hydrol. Earth Syst. Sci. 2012, 16, 4603–4619. [Google Scholar] [CrossRef]
  2. Hao, X.; Chen, Y.; Xu, C.; Li, W. Impacts of climate change and human activities on the surface runoff in the Tarim River Basin over the last fifty years. Water Resour. Manag. 2008, 22, 1159–1171. [Google Scholar] [CrossRef]
  3. Lakshmi, V.; Fayne, J.; Bolten, J. A comparative study of available water in the major river basins of the world. J. Hydrol. 2018, 567, 510–532. [Google Scholar] [CrossRef] [PubMed]
  4. Dai, A.; Qian, T.; Trenberth, K.E.; Milliman, J.D. Changes in continental freshwater discharge from 1948 to 2004. J. Clim. 2009, 22, 2773–2792. [Google Scholar] [CrossRef]
  5. Zheng, Y.; He, Y.; Cai, Y.; Wang, P. An improved interior-outer-set model framework for flood hazard analysis. Stoch. Environ. Res. Risk Assess. 2020, 34, 1543–1558. [Google Scholar] [CrossRef]
  6. Kondolf, G.M.; Gao, Y.; Annandale, G.W.; Morris, G.L.; Jiang, E.; Zhang, J.; Cao, Y.; Carling, P.; Fu, K.; Guo, Q. Sustainable sediment management in reservoirs and regulated rivers: Experiences from five continents. Earth’s Future 2014, 2, 256–280. [Google Scholar] [CrossRef]
  7. Xu, D.; Lyon, S.W.; Mao, J.; Dai, H.; Jarsjö, J. Impacts of multi-purpose reservoir construction, land-use change and climate change on runoff characteristics in the Poyang Lake basin, China. J. Hydrol. Reg. Stud. 2020, 29, 100694. [Google Scholar] [CrossRef]
  8. Arias, M.E.; Farinosi, F.; Lee, E.; Livino, A.; Briscoe, J.; Moorcroft, P.R. Impacts of climate change and deforestation on hydropower planning in the Brazilian Amazon. Nat. Sustain. 2020, 3, 430–436. [Google Scholar] [CrossRef]
  9. Omer, A.; Elagib, N.A.; Zhuguo, M.; Saleem, F.; Mohammed, A. Water scarcity in the Yellow River Basin under future climate change and human activities. Sci. Total Environ. 2020, 749, 141446. [Google Scholar] [CrossRef]
  10. Ghimire, S.; Shrestha, S.; Hok, P.; Heng, S.; Nittivattanaon, V.; Sabo, J. Integrated assessment of climate change and reservoir operation on flow-regime and fisheries of the Sekong river basin in Lao PDR and Cambodia. Environ. Res. 2023, 220, 115087. [Google Scholar] [CrossRef]
  11. Berga, L. The role of hydropower in climate change mitigation and adaptation: A review. Engineering 2016, 2, 313–318. [Google Scholar] [CrossRef]
  12. Grill, G.; Lehner, B.; Thieme, M.; Geenen, B.; Tickner, D.; Antonelli, F.; Babu, S.; Borrelli, P.; Cheng, L.; Crochetiere, H. Mapping the world’s free-flowing rivers. Nature 2019, 569, 215–221. [Google Scholar] [CrossRef] [PubMed]
  13. Poff, N.L.; Olden, J.D.; Merritt, D.M.; Pepin, D.M. Homogenization of regional river dynamics by dams and global biodiversity implications. Proc. Natl. Acad. Sci. USA 2007, 104, 5732–5737. [Google Scholar] [CrossRef] [PubMed]
  14. Zheng, Y.; He, Y.; Chen, X. Spatiotemporal pattern of precipitation concentration and its possible causes in the Pearl River basin, China. J. Clean. Prod. 2017, 161, 1020–1031. [Google Scholar] [CrossRef]
  15. Liu, J.; You, Y.; Zhang, Q.; Gu, X. Attribution of streamflow changes across the globe based on the Budyko framework. Sci. Total Environ. 2021, 794, 148662. [Google Scholar] [CrossRef]
  16. Zhao, F.; Zhang, L.; Xu, Z.; Scott, D.F. Evaluation of methods for estimating the effects of vegetation change and climate variability on streamflow. Water Resour. Res. 2010, 46. [Google Scholar] [CrossRef]
  17. Brown, A.E.; Zhang, L.; McMahon, T.A.; Western, A.W.; Vertessy, R.A. A review of paired catchment studies for determining changes in water yield resulting from alterations in vegetation. J. Hydrol. 2005, 310, 28–61. [Google Scholar] [CrossRef]
  18. Aryal, Y.; Zhu, J. Effect of watershed disturbance on seasonal hydrological drought: An improved double mass curve (IDMC) technique. J. Hydrol. 2020, 585, 124746. [Google Scholar] [CrossRef]
  19. Cheng, Q.; Zuo, X.; Zhong, F.; Gao, L.; Xiao, S. Runoff variation characteristics, association with large-scale circulation and dominant causes in the Heihe River Basin, Northwest China. Sci. Total Environ. 2019, 688, 361–379. [Google Scholar] [CrossRef]
  20. Uniyal, B.; Dietrich, J.; Vu, N.Q.; Jha, M.K.; Arumí, J.L. Simulation of regional irrigation requirement with SWAT in different agro-climatic zones driven by observed climate and two reanalysis datasets. Sci. Total Environ. 2019, 649, 846–865. [Google Scholar] [CrossRef]
  21. Zhai, R.; Tao, F. Contributions of climate change and human activities to runoff change in seven typical catchments across China. Sci. Total Environ. 2017, 605, 219–229. [Google Scholar] [CrossRef] [PubMed]
  22. Budyko, M.; Ronov, A.; Ianshin, A. The History of the Atmosphere; Gidrometeoizdat: Saint Petersburg, Russia, 1985. [Google Scholar]
  23. Greve, P.; Gudmundsson, L.; Orlowsky, B.; Seneviratne, S.I. A two-parameter Budyko function to represent conditions under which evapotranspiration exceeds precipitation. Hydrol. Earth Syst. Sci. 2016, 20, 2195–2205. [Google Scholar] [CrossRef]
  24. Yang, D.; Sun, F.; Liu, Z.; Cong, Z.; Lei, Z. Interpreting the complementary relationship in non-humid environments based on the Budyko and Penman hypotheses. Geophys. Res. Lett. 2006, 33. [Google Scholar] [CrossRef]
  25. Budyko, M.I. Climate and Life; Academic Press: New York, NY, USA, 1974. [Google Scholar]
  26. Chen, S.; Ruan, X. A hybrid Budyko-type regression framework for estimating baseflow from climate and catchment attributes. J. Hydrol. 2023, 618, 129118. [Google Scholar] [CrossRef]
  27. Liu, Q.; Yang, Y.; Liang, L.; Yan, D.; Wang, X.; Sun, T.; Li, C. Water balance shifts induced by multiyear drought within the Budyko framework. J. Geophys. Res. Atmos. 2023, 128, e2022JD036758. [Google Scholar] [CrossRef]
  28. Fu, J.; Liu, B.; Wang, W.; Fei, E.X. Evaluating main drivers of runoff changes across China from 1956 to 2000 by using different budyko-based elasticity methods. J. Environ. Manag. 2023, 329, 117070. [Google Scholar] [CrossRef]
  29. Schaake, J.C. From climate to flow. In Climate Change and US Water Resources; John Wiley: New York, NY, USA, 1990; pp. 177–206. [Google Scholar]
  30. Yang, D.; Sun, F.; Liu, Z.; Cong, Z.; Ni, G.; Lei, Z. Analyzing spatial and temporal variability of annual water-energy balance in nonhumid regions of China using the Budyko hypothesis. Water Resour. Res. 2007, 43. [Google Scholar] [CrossRef]
  31. Fu, B. On the calculation of the evaporation from land surface. Sci. Atmos. Sin 1981, 5, 23–31. [Google Scholar] [CrossRef]
  32. Zhou, S.; Yu, B.; Huang, Y.; Wang, G. The complementary relationship and generation of the Budyko functions. Geophys. Res. Lett. 2015, 42, 1781–1790. [Google Scholar] [CrossRef]
  33. Choudhury, B. Evaluation of an empirical equation for annual evaporation using field observations and results from a biophysical model. J. Hydrol. 1999, 216, 99–110. [Google Scholar] [CrossRef]
  34. Zhang, B.; Tian, L.; Yang, Y.; He, X. Revegetation does not decrease water yield in the Loess Plateau of China. Geophys. Res. Lett. 2022, 49, e2022GL098025. [Google Scholar] [CrossRef]
  35. Ning, T.; Liu, W.; Li, Z.; Feng, Q. Modelling and attributing evapotranspiration changes on China’s Loess Plateau with Budyko framework considering vegetation dynamics and climate seasonality. Stoch. Environ. Res. Risk Assess. 2020, 34, 1217–1230. [Google Scholar] [CrossRef]
  36. Majhi, I.; Yang, D. Streamflow characteristics and changes in Kolyma Basin in Siberia. J. Hydrometeorol. 2008, 9, 267–279. [Google Scholar] [CrossRef]
  37. Suzuki, K.; Park, H.; Makarieva, O.; Kanamori, H.; Hori, M.; Matsuo, K.; Matsumura, S.; Nesterova, N.; Hiyama, T. Effect of permafrost thawing on discharge of the Kolyma River, northeastern Siberia. Remote Sens. 2021, 13, 4389. [Google Scholar] [CrossRef]
  38. Zhang, L.; Potter, N.; Hickel, K.; Zhang, Y.; Shao, Q. Water balance modeling over variable time scales based on the Budyko framework–Model development and testing. J. Hydrol. 2008, 360, 117–131. [Google Scholar] [CrossRef]
  39. Zhang, L.; Chen, X.; Lai, R. Urban signatures of sub-daily extreme precipitation events over a metropolitan region. Atmos. Res. 2020, 246, 105204. [Google Scholar] [CrossRef]
  40. Hochreiter, S.; Schmidhuber, J. Long short-term memory. Neural Comput. 1997, 9, 1735–1780. [Google Scholar] [CrossRef]
  41. Gauch, M.; Kratzert, F.; Klotz, D.; Nearing, G.; Lin, J.; Hochreiter, S. Rainfall–runoff prediction at multiple timescales with a single Long Short-Term Memory network. Hydrol. Earth Syst. Sci. 2021, 25, 2045–2062. [Google Scholar] [CrossRef]
  42. Lees, T.; Buechel, M.; Anderson, B.; Slater, L.; Reece, S.; Coxon, G.; Dadson, S.J. Benchmarking data-driven rainfall–runoff models in Great Britain: A comparison of long short-term memory (LSTM)-based models with four lumped conceptual models. Hydrol. Earth Syst. Sci. 2021, 25, 5517–5534. [Google Scholar] [CrossRef]
  43. Ley, A.; Bormann, H.; Casper, M. Intercomparing LSTM and RNN to a Conceptual Hydrological Model for a Low-Land River with a Focus on the Flow Duration Curve. Water 2023, 15, 505. [Google Scholar] [CrossRef]
  44. Man, Y.; Yang, Q.; Shao, J.; Wang, G.; Bai, L.; Xue, Y. Enhanced LSTM model for daily runoff prediction in the upper Huai river basin, China. Engineering 2023, 24, 229–238. [Google Scholar] [CrossRef]
  45. Quilty, J.; Jahangir, M.S.; You, J.; Hughes, H.; Hah, D.; Tzoganakis, I. Bayesian extreme learning machines for hydrological prediction uncertainty. J. Hydrol. 2023, 626, 130138. [Google Scholar] [CrossRef]
  46. Chattopadhyay, A.; Nabizadeh, E.; Hassanzadeh, P. Analog forecasting of extreme-causing weather patterns using deep learning. J. Adv. Model. Earth Syst. 2020, 12, e2019MS001958. [Google Scholar] [CrossRef]
  47. Willems, P. A time series tool to support the multi-criteria performance evaluation of rainfall-runoff models. Environ. Model. Softw. 2009, 24, 311–321. [Google Scholar] [CrossRef]
  48. Zhang, Q.; Gu, X.; Singh, V.P.; Xiao, M.; Chen, X. Evaluation of flood frequency under non-stationarity resulting from climate indices and reservoir indices in the East River basin, China. J. Hydrol. 2015, 527, 565–575. [Google Scholar] [CrossRef]
  49. Ji, P.; Yuan, X.; Jiao, Y. Future hydrological drought changes over the upper Yellow River basin: The role of climate change, land cover change and reservoir operation. J. Hydrol. 2023, 617, 129128. [Google Scholar] [CrossRef]
  50. Pettitt, A.N. A non-parametric approach to the change-point problem. J. R. Stat. Soc. Ser. C (Appl. Stat.) 1979, 28, 126–135. [Google Scholar] [CrossRef]
  51. Alexandersson, H. A homogeneity test applied to precipitation data. J. Climatol. 1986, 6, 661–675. [Google Scholar] [CrossRef]
  52. Buishand, T.A. Some methods for testing the homogeneity of rainfall records. J. Hydrol. 1982, 58, 11–27. [Google Scholar] [CrossRef]
  53. Yang, T.; Zhang, L.; Kim, T.; Hong, Y.; Zhang, D.; Peng, Q. A large-scale comparison of Artificial Intelligence and Data Mining (AI&DM) techniques in simulating reservoir releases over the Upper Colorado Region. J. Hydrol. 2021, 602, 126723. [Google Scholar] [CrossRef]
  54. Zolfaghari, M.; Golabi, M.R. Modeling and predicting the electricity production in hydropower using conjunction of wavelet transform, long short-term memory and random forest models. Renew. Energy 2021, 170, 1367–1381. [Google Scholar] [CrossRef]
  55. Breiman, L.; Friedman, J.H.; Olshen, R.A.; Stone, C.J. Classification and Regression Trees; Routledge: London, UK, 2017. [Google Scholar]
  56. Jeung, M.; Baek, S.; Beom, J.; Cho, K.H.; Her, Y.; Yoon, K. Evaluation of random forest and regression tree methods for estimation of mass first flush ratio in urban catchments. J. Hydrol. 2019, 575, 1099–1110. [Google Scholar] [CrossRef]
  57. Rodriguez-Galiano, V.; Mendes, M.P.; Garcia-Soldado, M.J.; Chica-Olmo, M.; Ribeiro, L. Predictive modeling of groundwater nitrate pollution using Random Forest and multisource variables related to intrinsic and specific vulnerability: A case study in an agricultural setting (Southern Spain). Sci. Total Environ. 2014, 476, 189–206. [Google Scholar] [CrossRef] [PubMed]
  58. Nash, J.E.; Sutcliffe, J.V. River flow forecasting through conceptual models part I—A discussion of principles. J. Hydrol. 1970, 10, 282–290. [Google Scholar] [CrossRef]
  59. Gupta, H.V.; Kling, H.; Yilmaz, K.K.; Martinez, G.F. Decomposition of the mean squared error and NSE performance criteria: Implications for improving hydrological modelling. J. Hydrol. 2009, 377, 80–91. [Google Scholar] [CrossRef]
  60. Yilmaz, K.K.; Gupta, H.V.; Wagener, T. A process-based diagnostic approach to model evaluation: Application to the NWS distributed hydrologic model. Water Resour. Res. 2008, 44. [Google Scholar] [CrossRef]
  61. Gudmundsson, L.; Greve, P.; Seneviratne, S.I. The sensitivity of water availability to changes in the aridity index and other factors—A probabilistic analysis in the Budyko space. Geophys. Res. Lett. 2016, 43, 6985–6994. [Google Scholar] [CrossRef]
  62. Yang, H.; Yang, D.; Lei, Z.; Sun, F. New analytical derivation of the mean annual water-energy balance equation. Water Resour. Res. 2008, 44. [Google Scholar] [CrossRef]
  63. Allen, R.G.; Pereira, L.S.; Raes, D.; Smith, M. Crop Evapotranspiration-Guidelines for Computing Crop Water Requirements-FAO Irrigation and Drainage Paper 56; FAO: Rome, Italy, 1998; Volume 300, p. D05109. [Google Scholar]
  64. Yatagai, A.; Kamiguchi, K.; Arakawa, O.; Hamada, A.; Yasutomi, N.; Kitoh, A. APHRODITE: Constructing a long-term daily gridded precipitation dataset for Asia based on a dense network of rain gauges. Bull. Am. Meteorol. Soc. 2012, 93, 1401–1415. [Google Scholar] [CrossRef]
  65. Lipton, Z.C.; Berkowitz, J.; Elkan, C. A critical review of recurrent neural networks for sequence learning. arXiv Prepr. 2015, arXiv:1506.00019. [Google Scholar]
  66. Chen, R.-C.; Dewi, C.; Huang, S.-W.; Caraka, R.E. Selecting critical features for data classification based on machine learning methods. J. Big Data 2020, 7, 52. [Google Scholar] [CrossRef]
  67. Li, H.; Shi, C.; Zhang, Y.; Ning, T.; Sun, P.; Liu, X.; Ma, X.; Liu, W.; Collins, A.L. Using the Budyko hypothesis for detecting and attributing changes in runoff to climate and vegetation change in the soft sandstone area of the middle Yellow River basin, China. Sci. Total Environ. 2020, 703, 135588. [Google Scholar] [CrossRef] [PubMed]
  68. Jiang, J.; Wang, Z.; Lai, C.; Wu, X.; Chen, X. Climate and landuse change enhance spatio-temporal variability of Dongjiang river flow and ammonia nitrogen. Sci. Total Environ. 2023, 867, 161483. [Google Scholar] [CrossRef]
Figure 1. Zoning map of Longchuan hydrological station control basin (LCB) and Fengshuba reservoir (FsbR).
Atmosphere 15 00164 g001
Figure 2. From row 1 to 3: annual average, minimum, and maximum discharge recorded at Longchuan station during 1956–2015 with linear regression results; from row 4 to 5, annual average and maximum precipitation recorded at Longchuan station during 1956–2015 with linear regression results; the right column represents wet season and the left column represent dry season.
Atmosphere 15 00164 g002
Figure 3. Overview of runoff reconstruction models and attribution framework for runoff variation analysis.
Atmosphere 15 00164 g003
Figure 4. The color map of N s e to evaluate input combination for (a) LSTM-SOLE and (b) RF-SOLE models, where Q_in and P_in are the number of days of the input runoff and precipitation, respectively. The values of N s e obtained from the combinations of Q_in and P_in can be referenced using the color bar on the right side of the image. Figure 5 and Figure 8 follow the same convention.
Atmosphere 15 00164 g004
Figure 5. The color map of N s e to evaluate input combination for LSTM in wet/dry season (a,b) and RF in wet/dry season (c,d), where Q_in and P_in are the number of days of the input runoff and precipitation, respectively.
Atmosphere 15 00164 g005
Figure 6. Scatter plot of the simulation results of the (a) LSTM-SOLE, (b) RF-SOLE, (c) LSTM_SEA, and (d) RF_SEA in the natural period, with linear regressions intersecting to zero. For the regression result, a slope closer to 1 indicates that the simulation model is closer to the observations. Figure 9 follows the same convention.
Atmosphere 15 00164 g006
Figure 7. The runoff simulation accuracy of each percentile interval evaluated by Pearson r.
Atmosphere 15 00164 g007
Figure 8. The color map of N s e to evaluate input combination for (a) extreme high value and (b) extreme low value simulation based on RF, where Q_in and P_in are the number of days of the input runoff and precipitation, respectively.
Atmosphere 15 00164 g008
Figure 9. Scatter plot of the simulation results of the MERGED model in the natural period, with linear regression intersecting to zero.
Atmosphere 15 00164 g009
Figure 10. Double cumulative curves of LCB in (a) dry season and (b) wet season from 1956 to 2015.
Atmosphere 15 00164 g010
Figure 11. Boxplot of observed and simulated runoff characteristics of each year in the impacted period, where (a) depicts the annual average runoff ( Q am ); (b) depicts the annual standard variation ( Q astd ); (c,d) depict the annual maximum/minimum runoff ( Q amax / Q amin ); and (e,f) depict the annual 90th and 10th percentile runoff ( Q a 90 / Q a 10 ).
Atmosphere 15 00164 g011
Figure 12. Cumulative runoff deviations in the impacted period in LCB, where Δ R c _ c is the cumulative annual runoff variation, and Δ R c _ clim and Δ R c _ nc are the cumulative runoff variation caused by climate factors and non-climate factors, respectively.
Atmosphere 15 00164 g012
Figure 13. Time series for Δ R non _ clim , NDVI, and reservoir in (a) wet season and (b) dry season; r Rnc _ res and r Rnc _ NDVI are the Pearson r of human activity-induced runoff variation ( Δ R non _ clim ) and reservoir storage, and the Pearson r of human activity-induced runoff variation ( Δ R non _ clim ) and NDVI.
Atmosphere 15 00164 g013
Table 2. The results of the change-point detection using 3 different detecting methods.
ItemRunoffPrecipitation
Detection MethodAverageMaximumMinimumAverageMaximum
Buishand1973 *1969200619732005 *
SNHT1973 *1969 *2006 *19732006 *
Pettitt1973 *19772006 *19732005 *
Numbers marked with “*” indicate that the change point has passed the significance test.
Table 3. The evaluation metrics of the sole and seasonal LSTM and RF models.
ModelRMSEMAENsePearson rKGEFHVFLVFMVPODFARCSI
LSTM-SOLE137.50439.2430.8130.9060.790−42.8596.854−3.0720.3240.7590.160
RF-SOLE151.60738.0450.7720.8790.803−47.758−9.1881.1940.3910.7490.181
LSTM_SEA137.33738.4530.8130.9070.784−45.272−12.768−1.7530.3310.7520.165
RF_SEA149.42537.8230.7790.8830.806−46.766−13.355−0.5480.3340.7930.147
The values marked in bold, italic and underline are the best values of each metric; for example, the LSTM_SEA model has the least RMSE among all 4 models. This marking principle is the same for Table 4.
Table 4. The evaluation metrics of sole and seasonal LSTM models and the MERGED model.
ModelRMSEMAENsePearson rKGEFHVFLVFMVPOFFARCSI
LSTM-SOLE137.50439.2430.8130.9060.790−42.8596.854−3.0720.3240.7590.160
LSTM_SEA137.33738.4530.8130.9070.784−45.272−12.768−1.7530.3310.7520.165
MERGED134.61036.6170.8200.9060.864−35.665−7.581−0.0440.3980.7270.193
Table 5. The elastic coefficient in the natural period and impacted period.
PeriodSeason ε P ε E T O ε n n
Natural periodWet1.30−0.52−0.112.13
Dry0.64−0.50−2.581.21
All0.98−0.46−0.651.45
Impacted periodWet1.26−0.53−0.182.01
Dry0.22−0.16−6.230.54
All0.70−0.35−1.541.06
Disclaimer/Publisher’s Note: The statements, opinions and data contained in all publications are solely those of the individual author(s) and contributor(s) and not of MDPI and/or the editor(s). MDPI and/or the editor(s) disclaim responsibility for any injury to people or property resulting from any ideas, methods, instructions or products referred to in the content.

