


Unravelling the Drought Variance Using Machine Learning Methods in Six Capital Cities of Australia


Abstract
:1. Introduction
2. Data and Methods
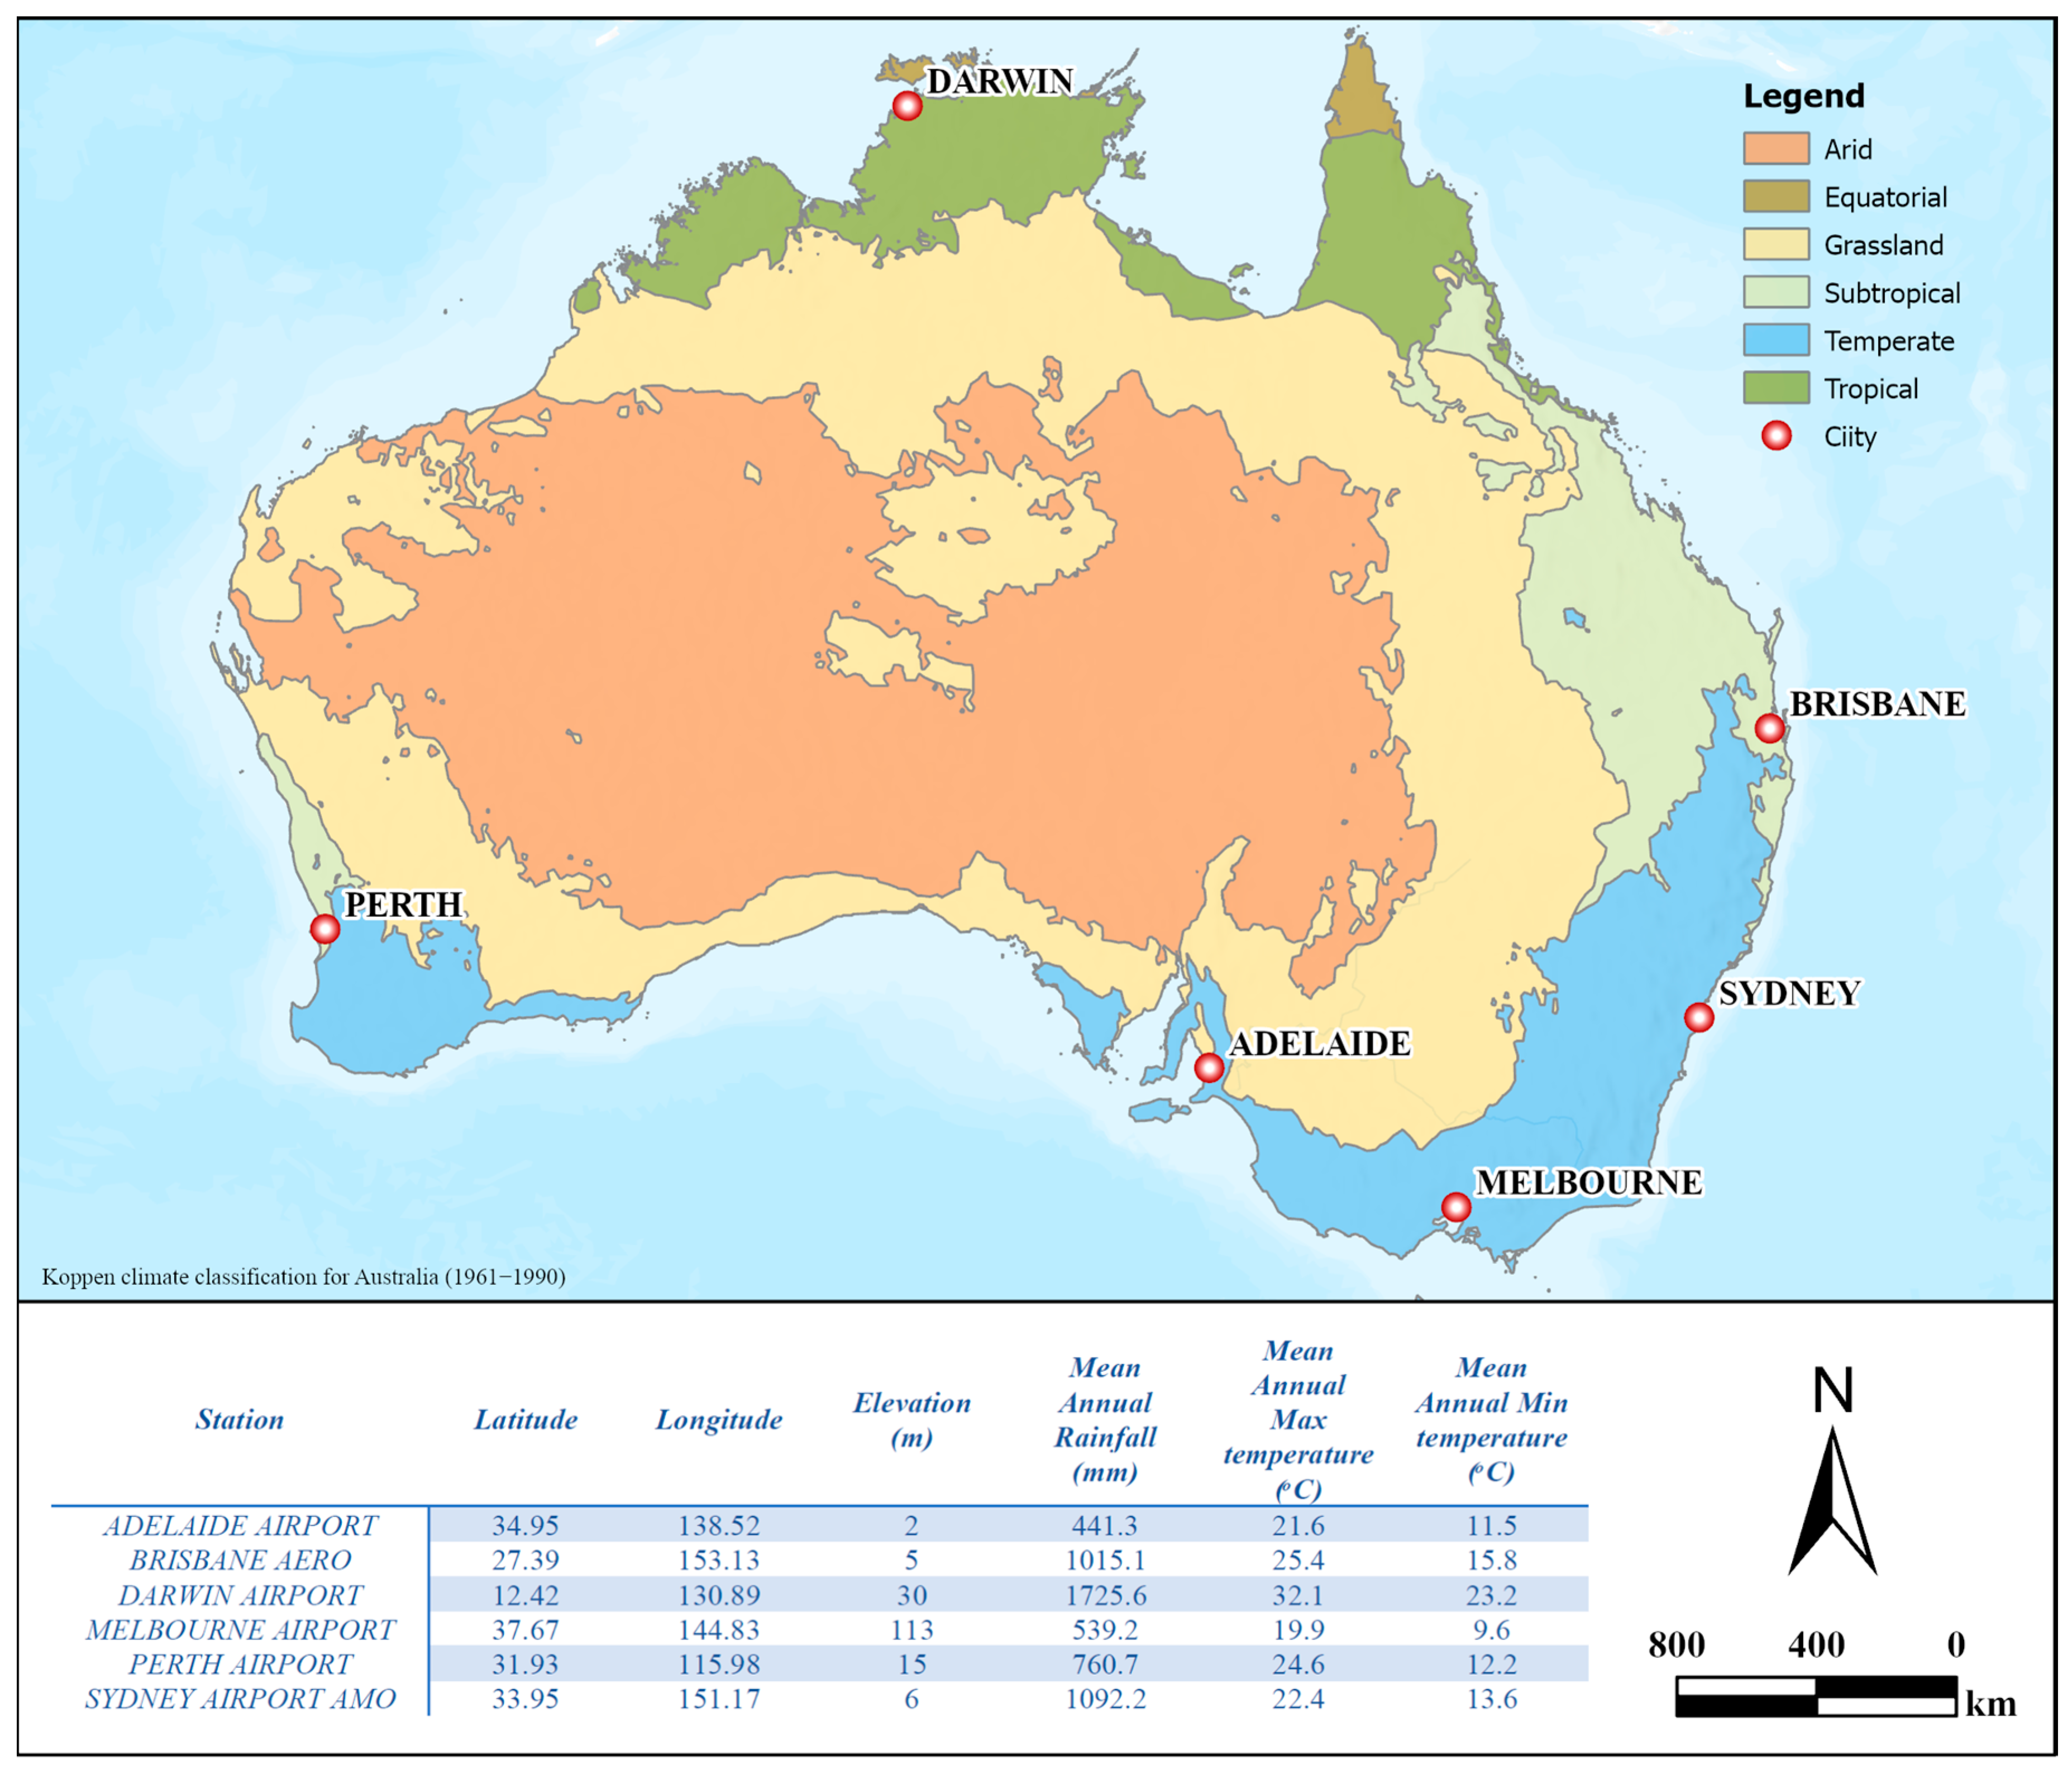
2.1. Study Area
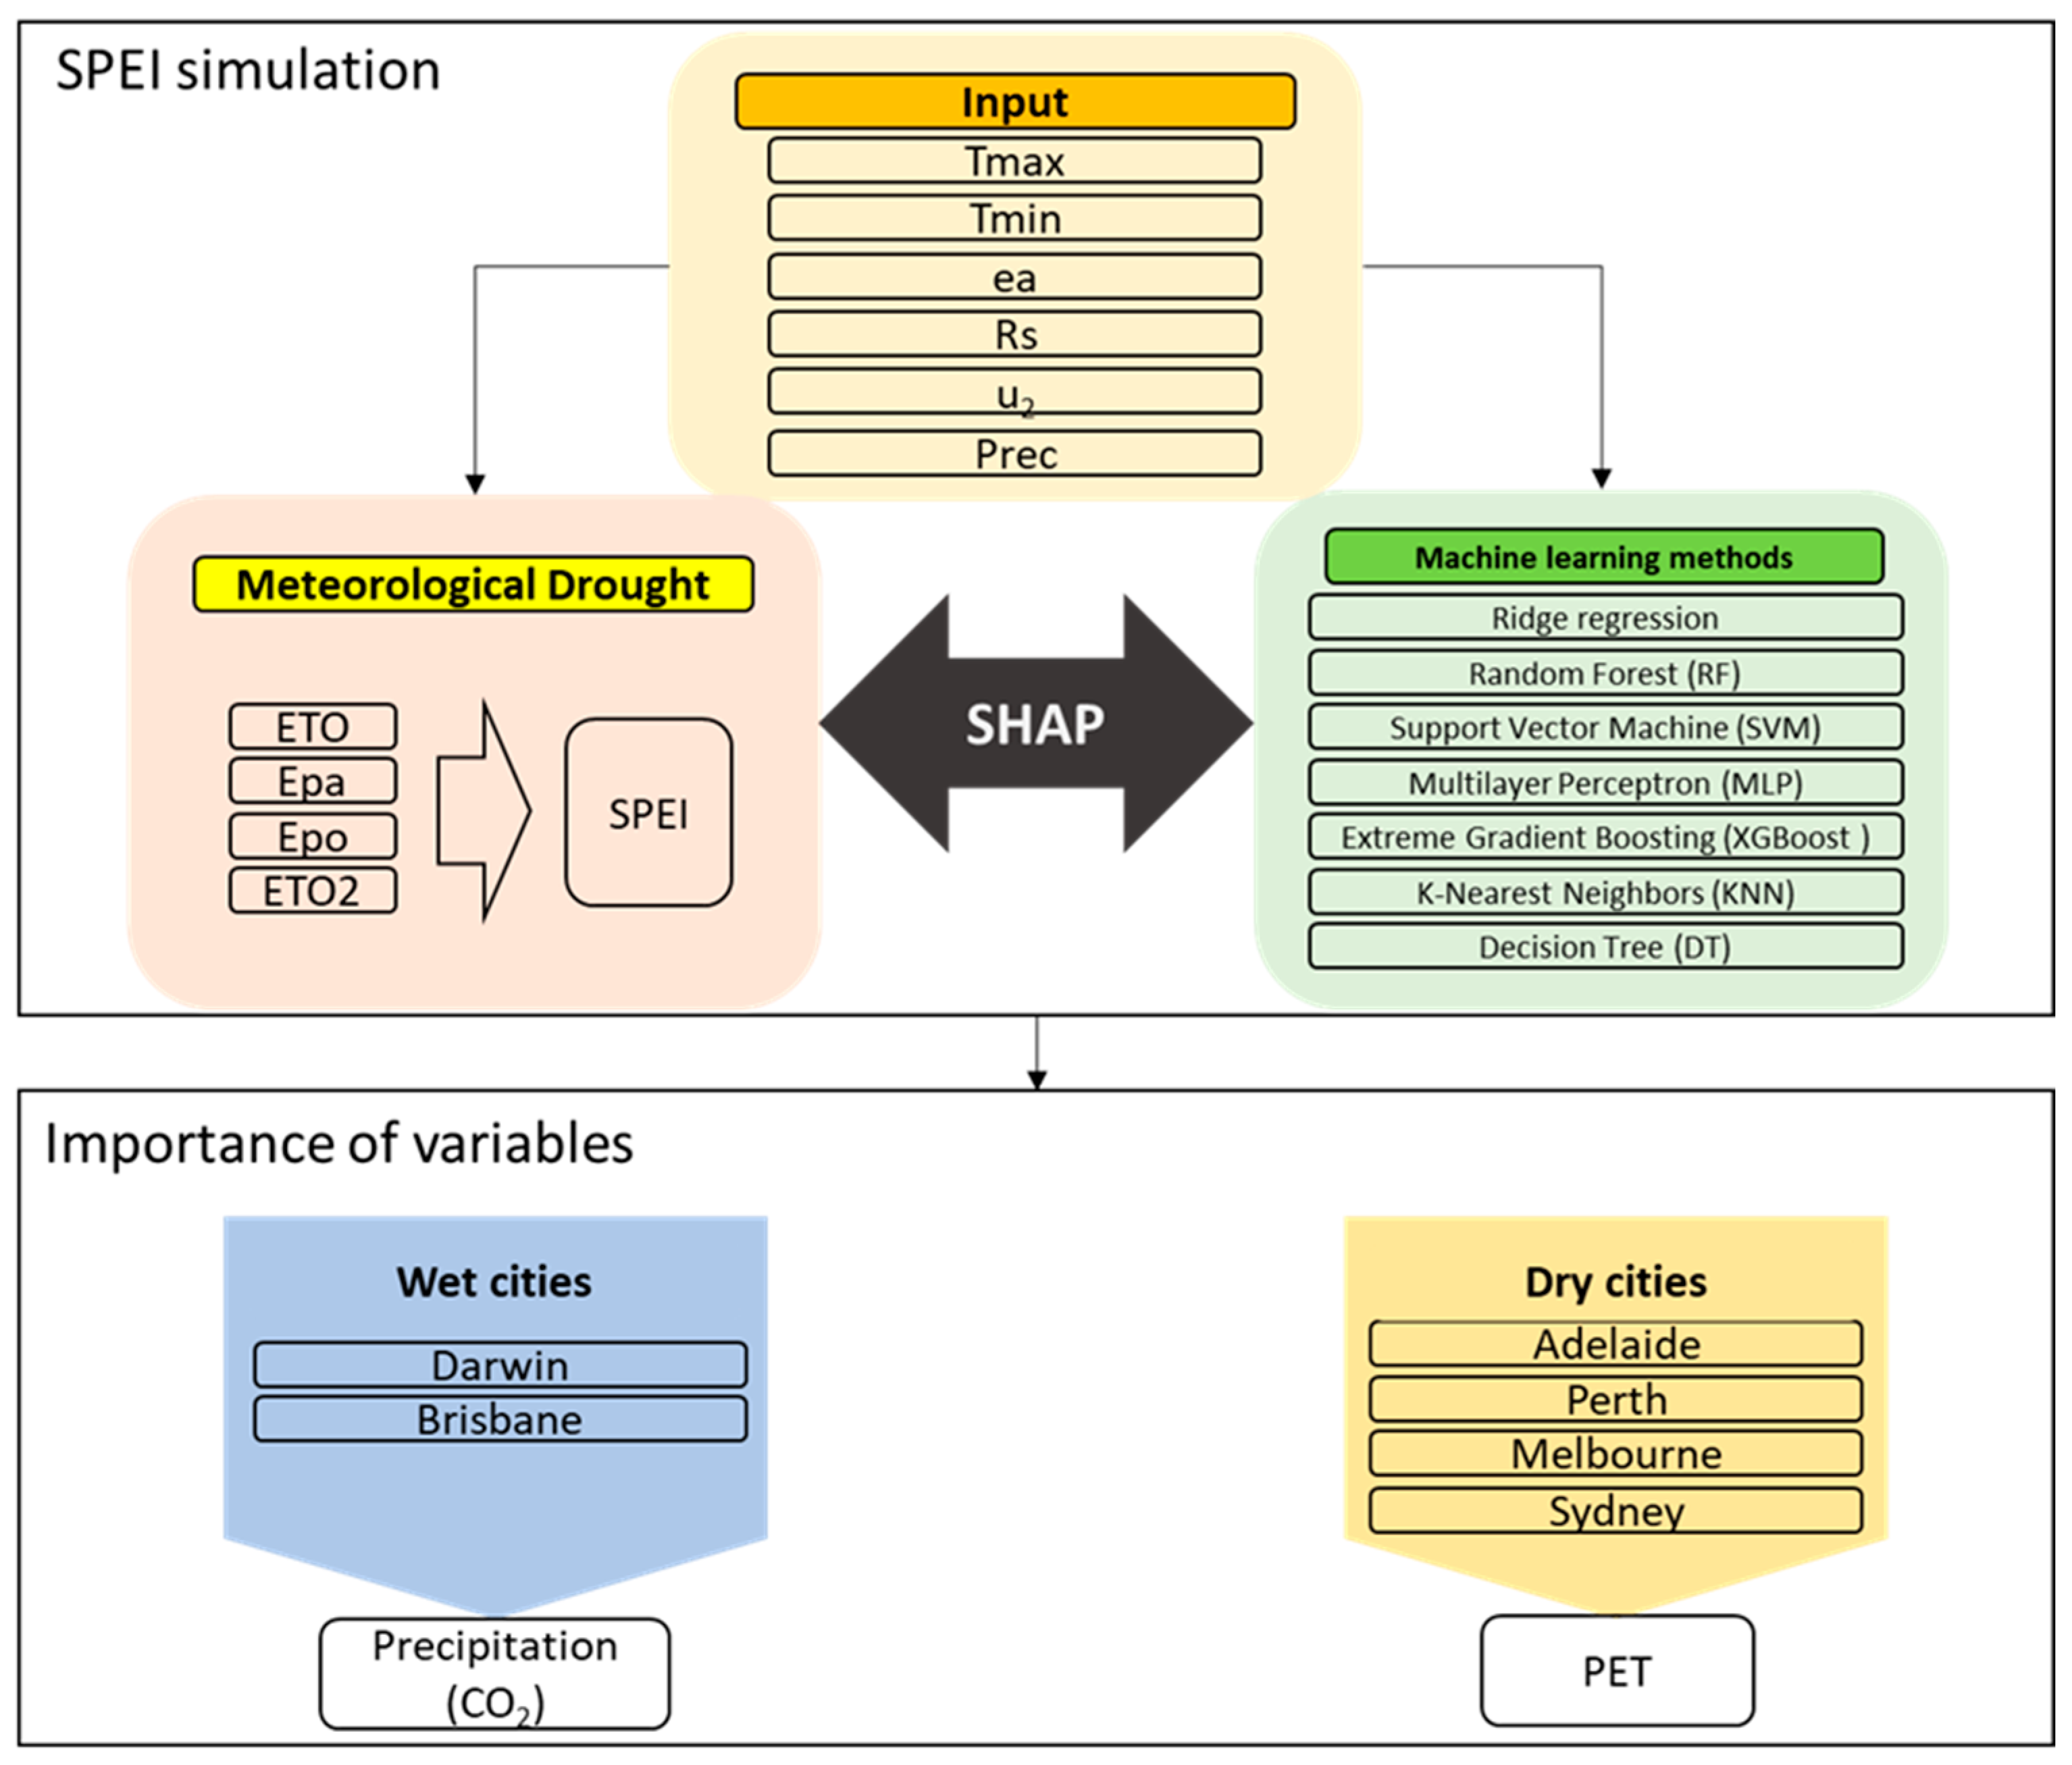
2.2. Flowchart
2.3. Data
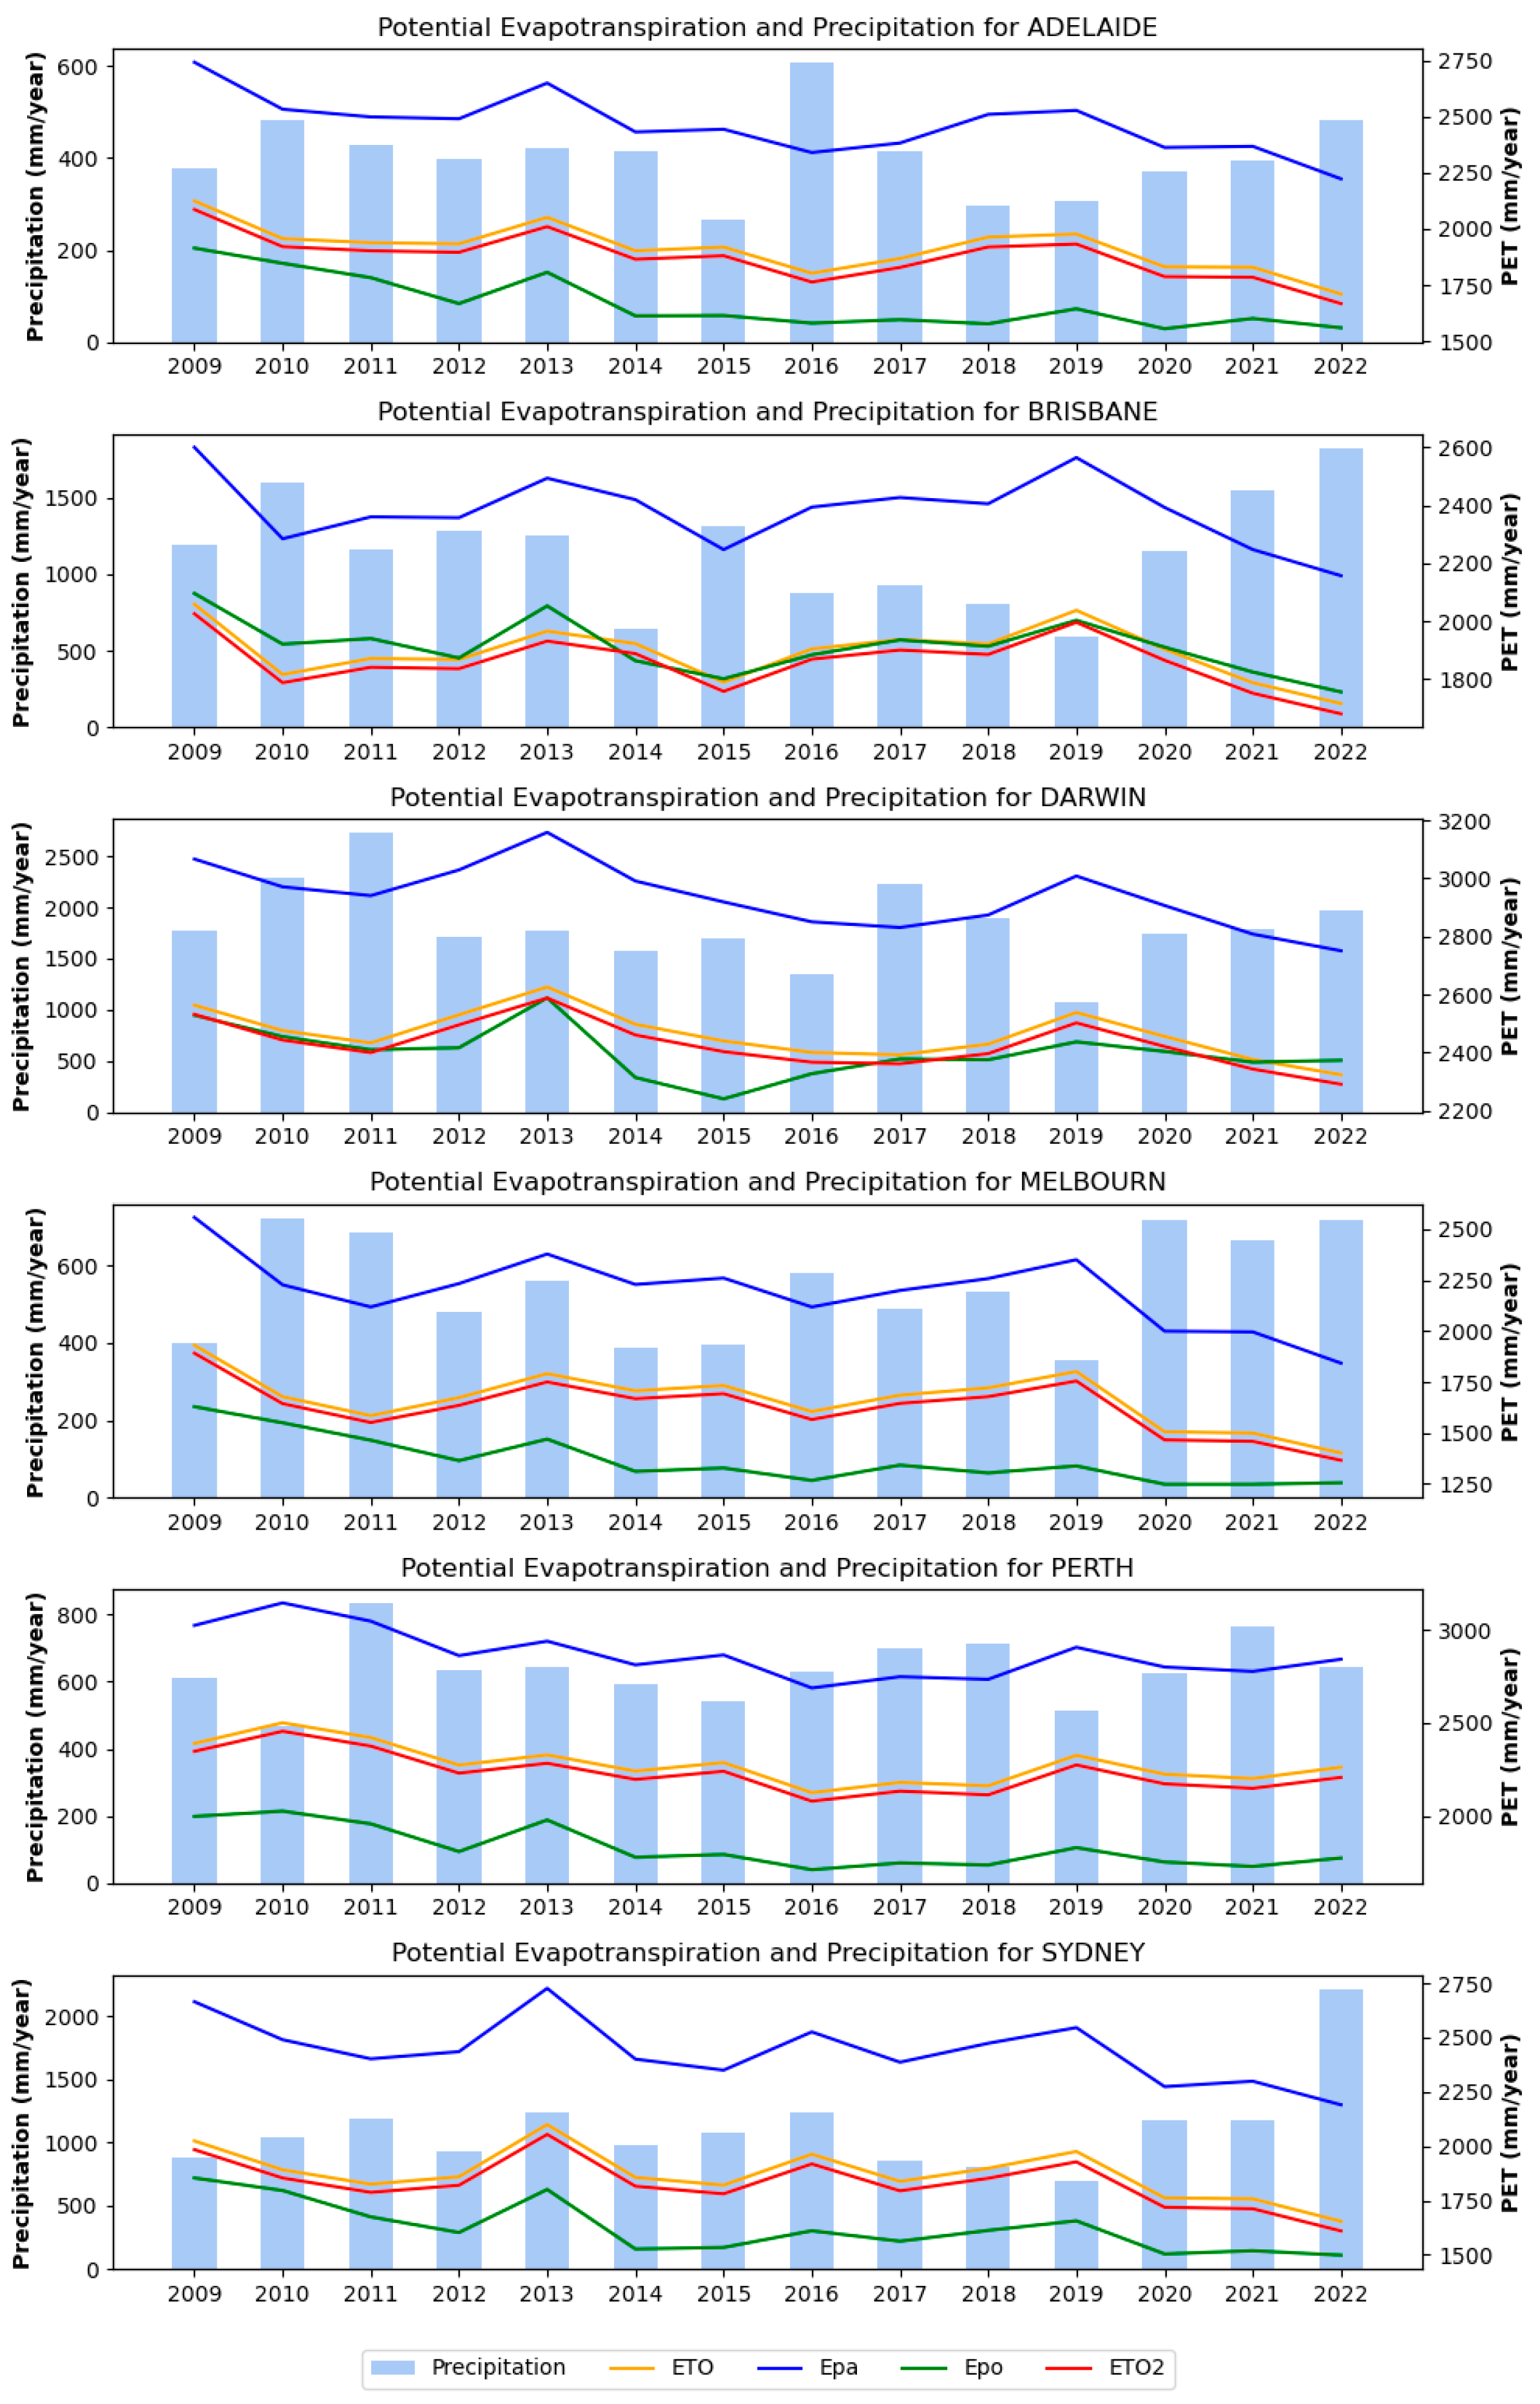
2.4. PET Calculation
2.5. SPEI Calculation
2.6. Machine Learning Methods
2.7. Machine Learning Exploratory Analysis
3. Results and Discussion
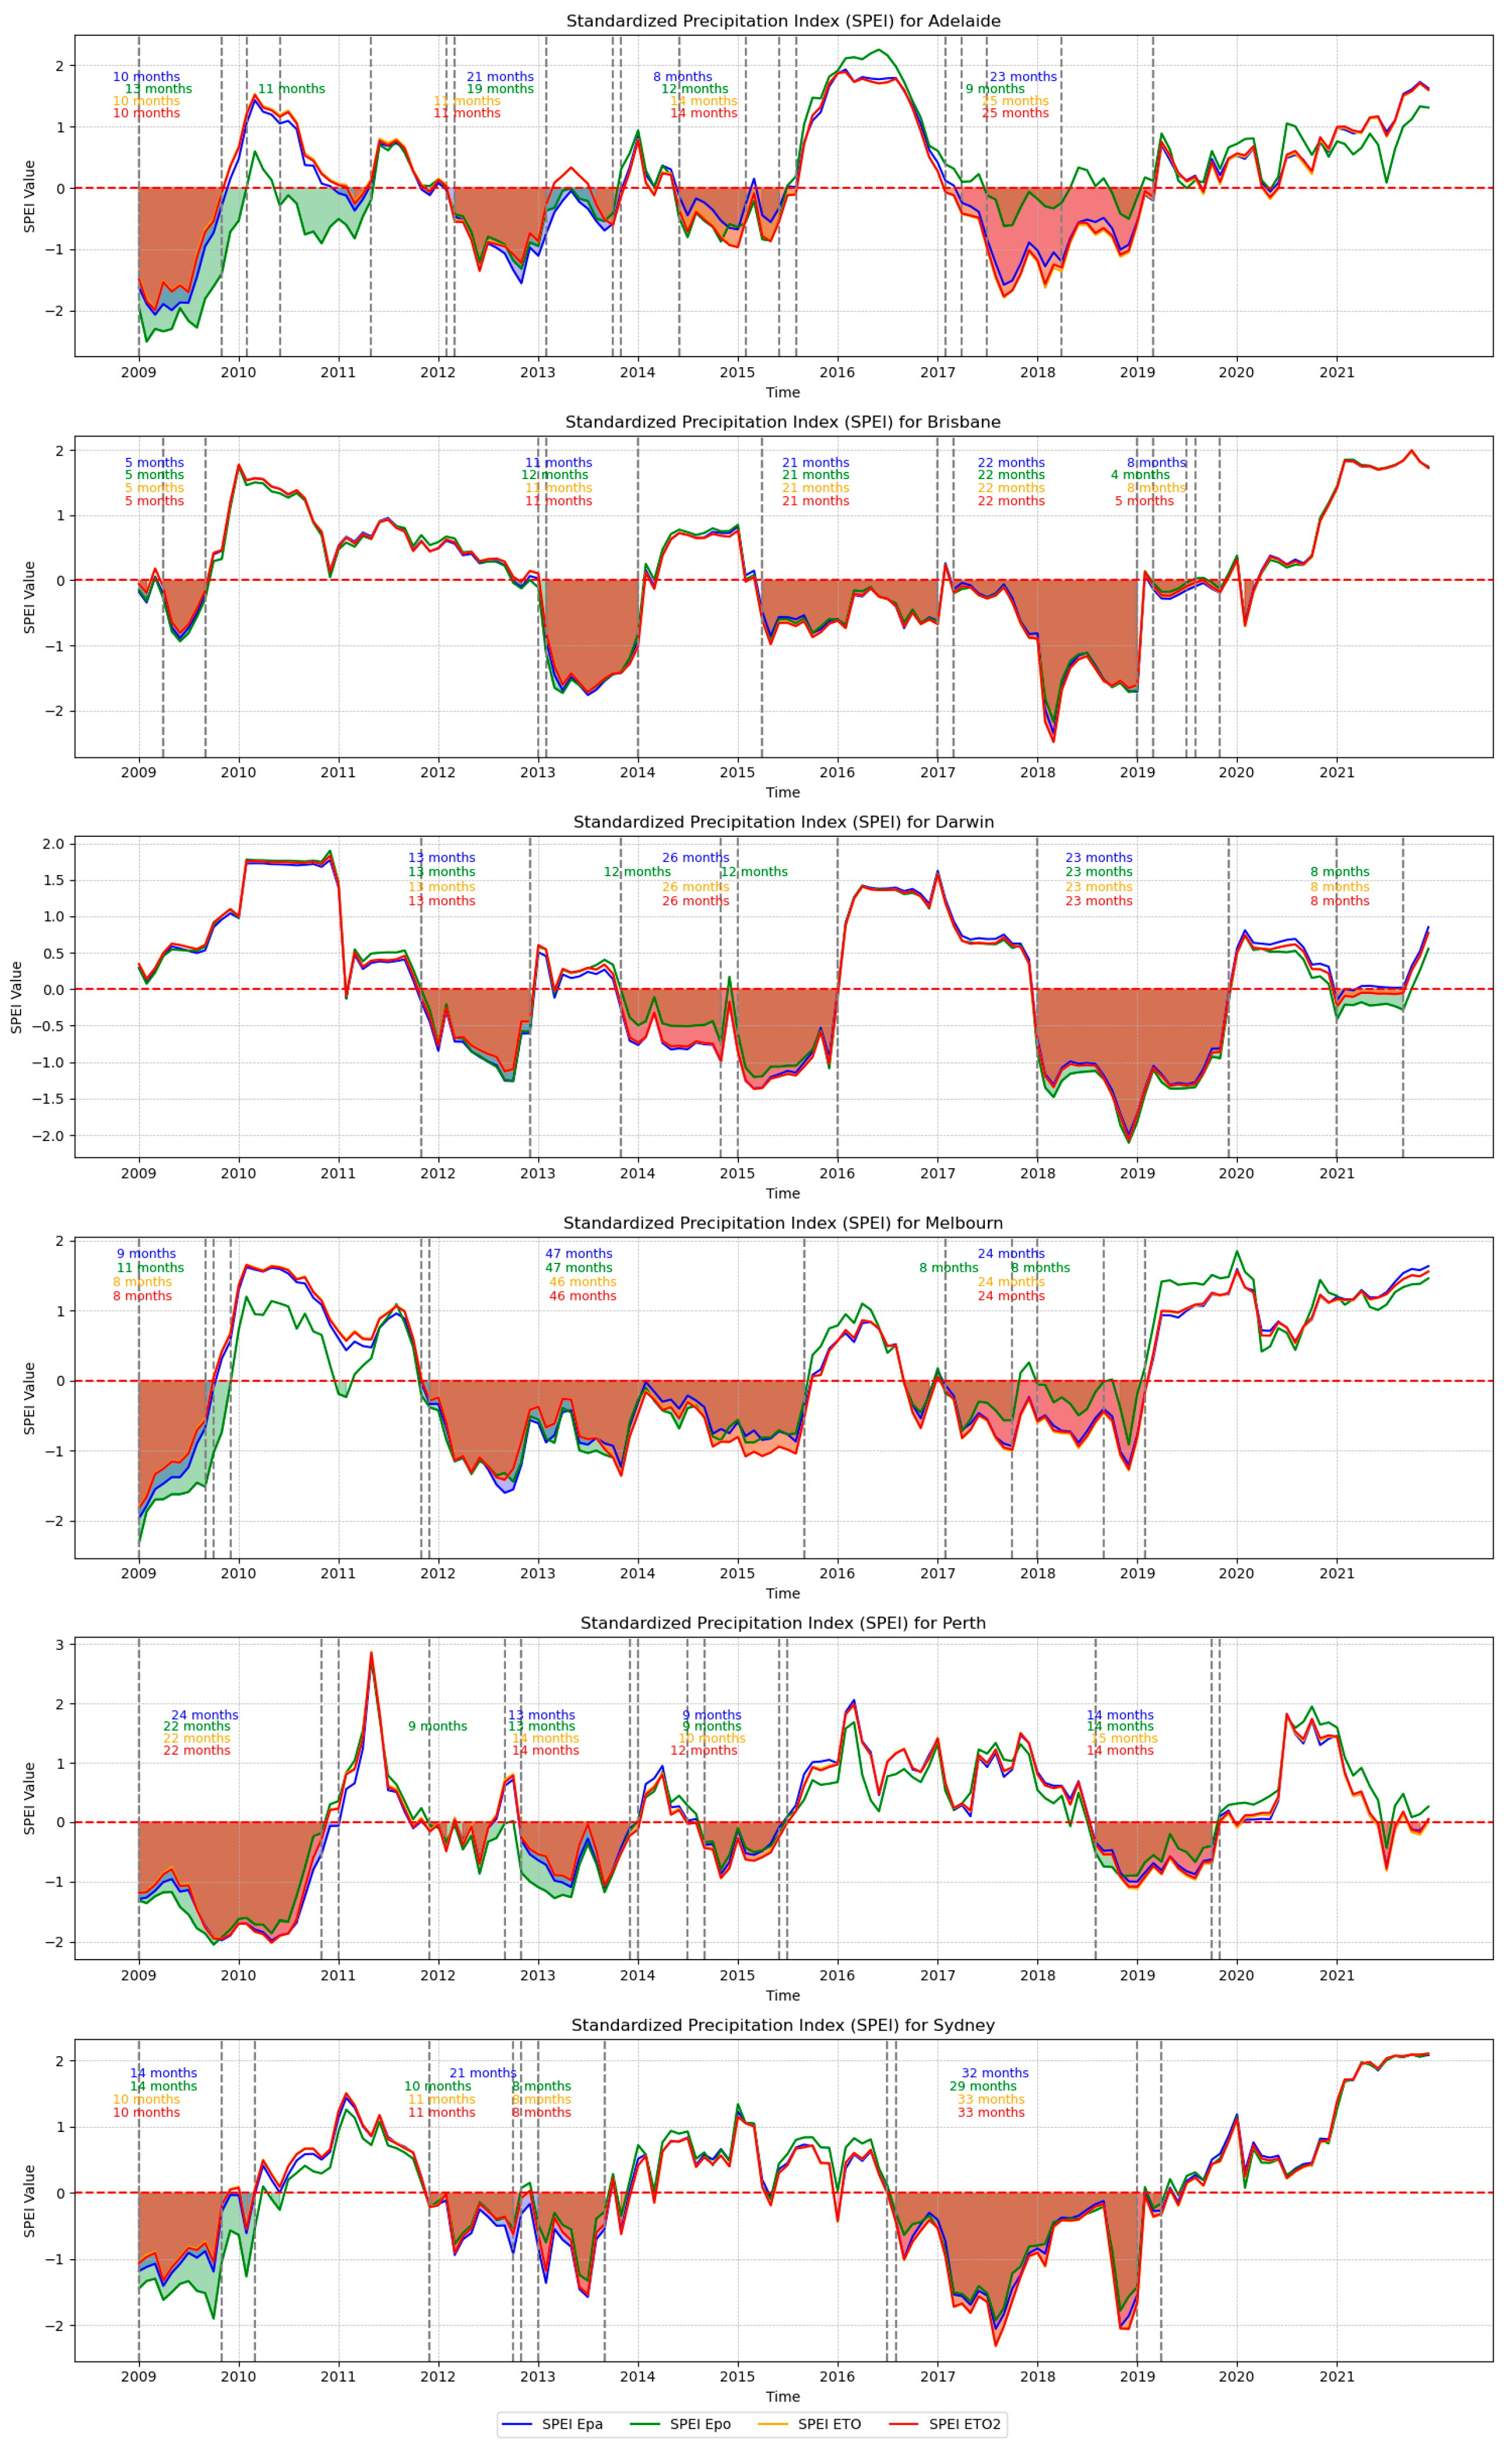
3.1. SPEI Change Based on Different PET Methods
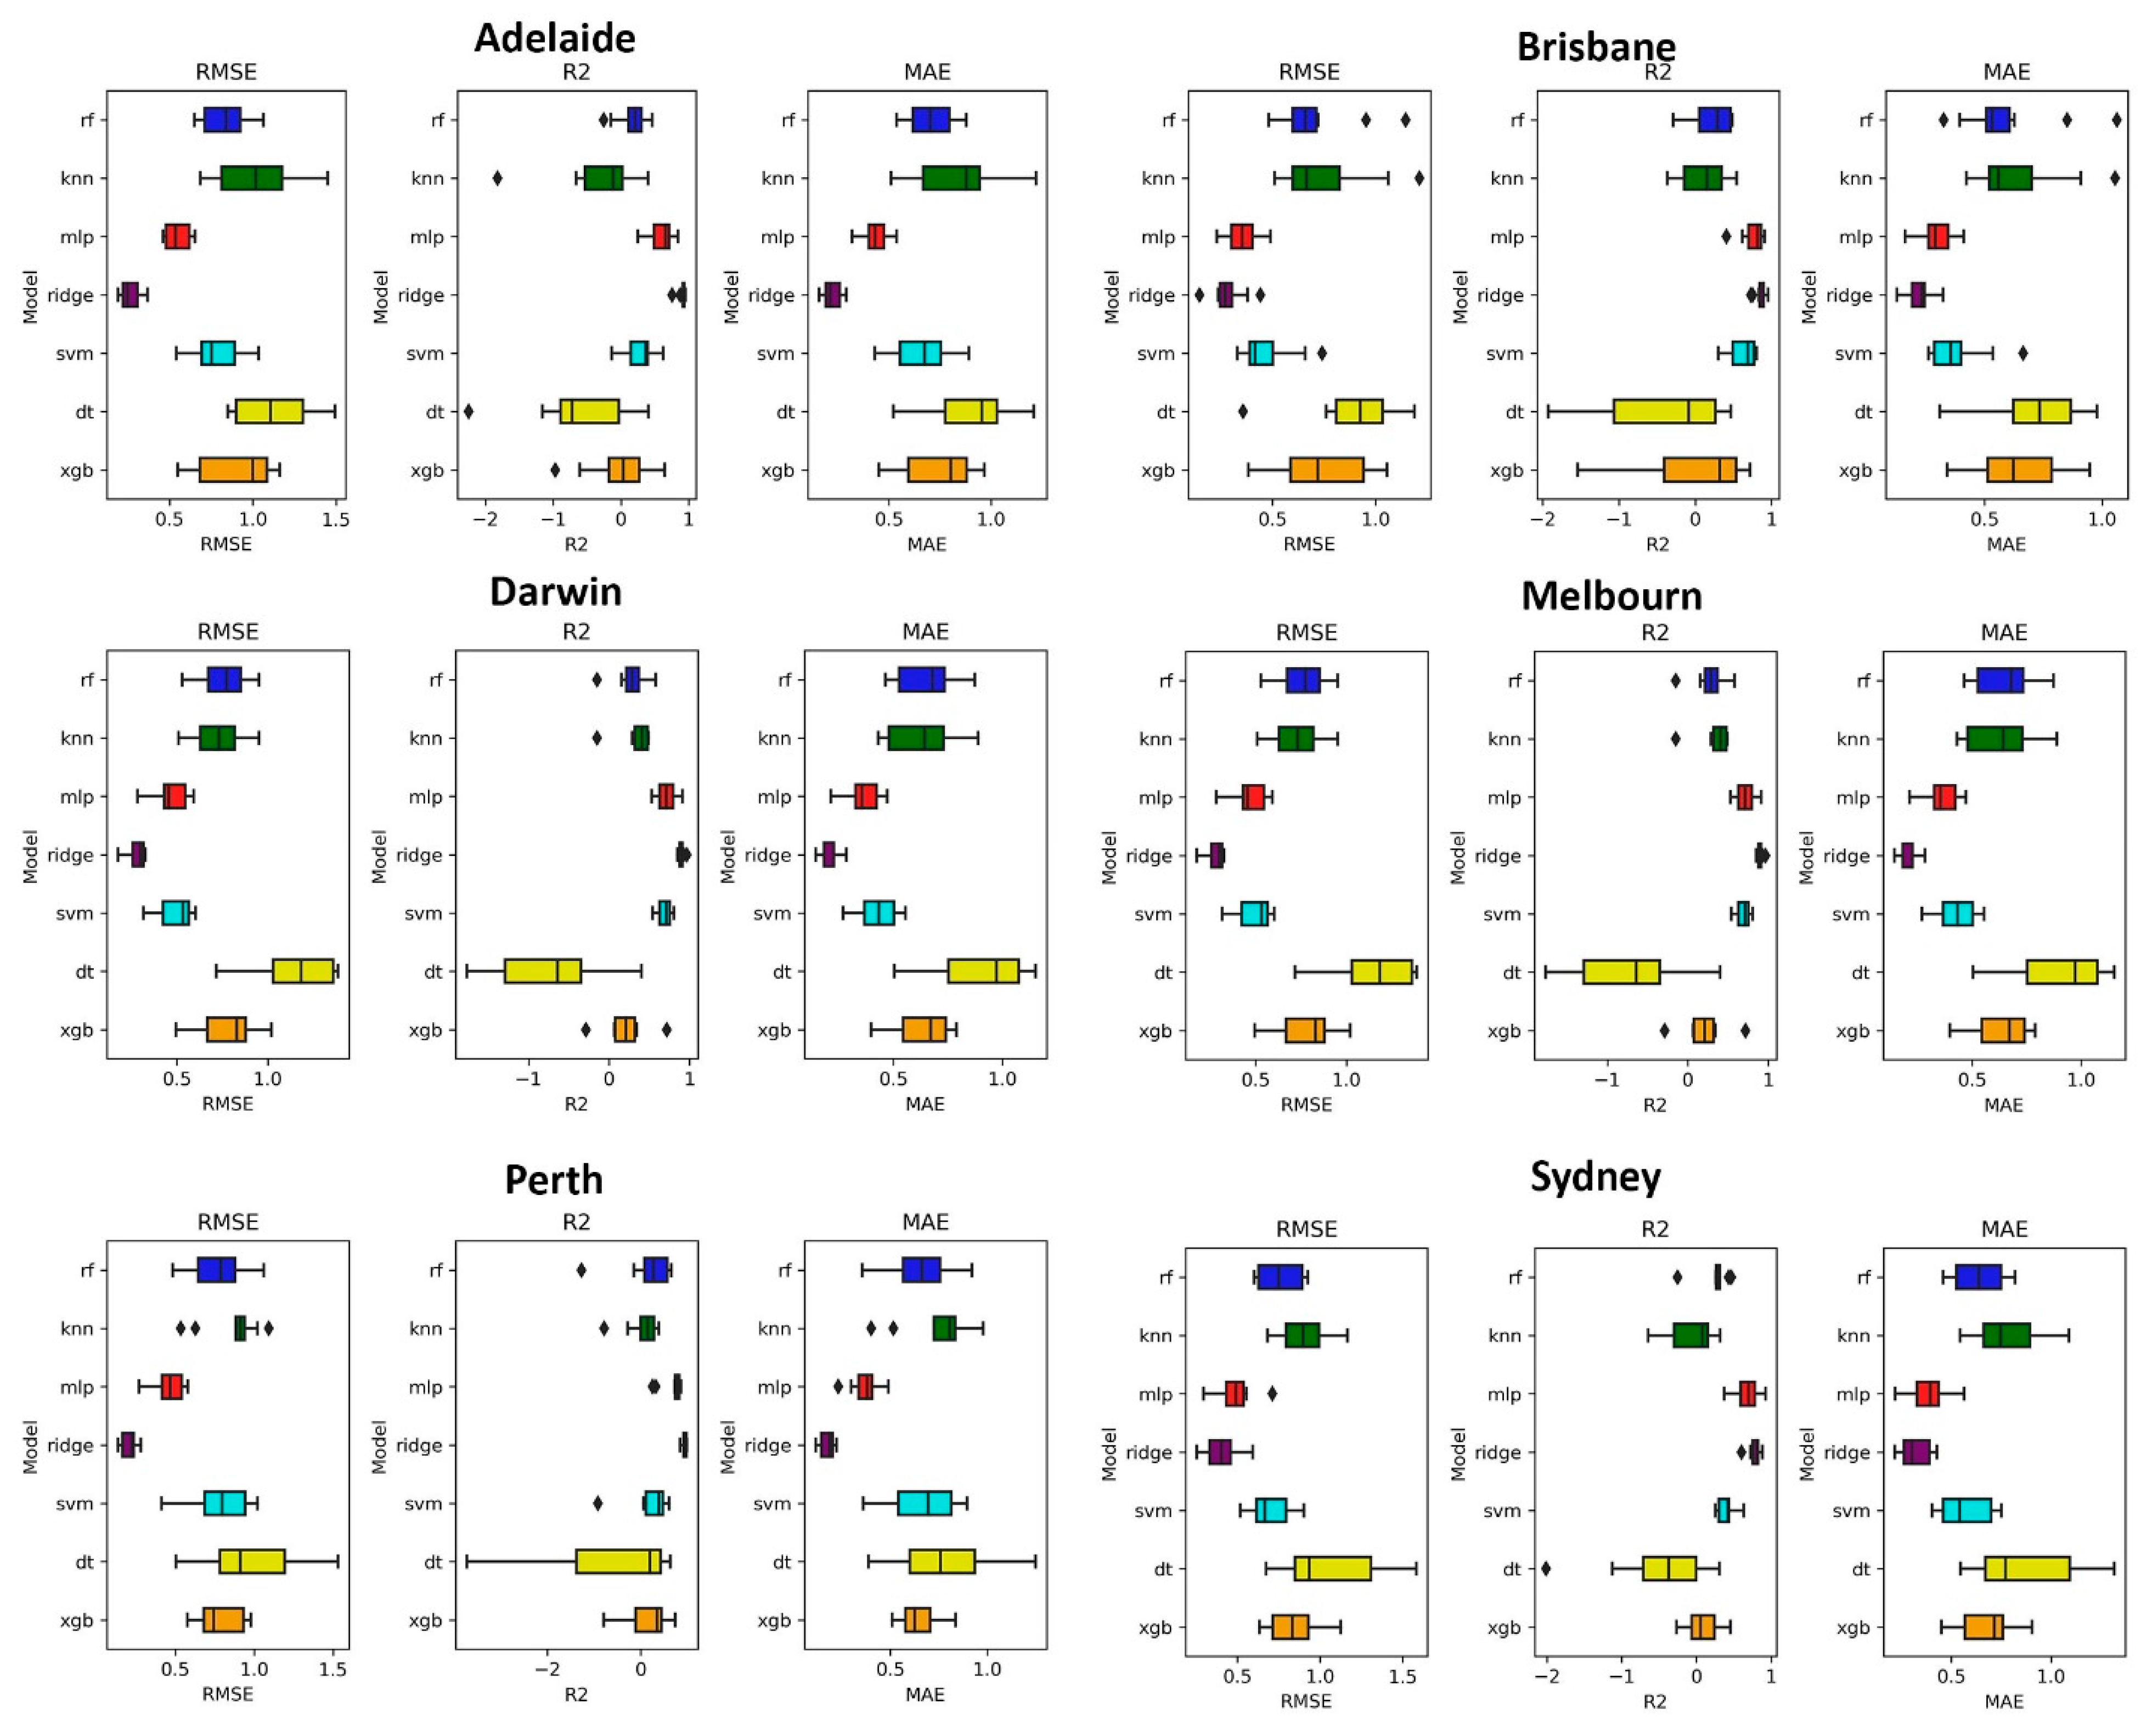
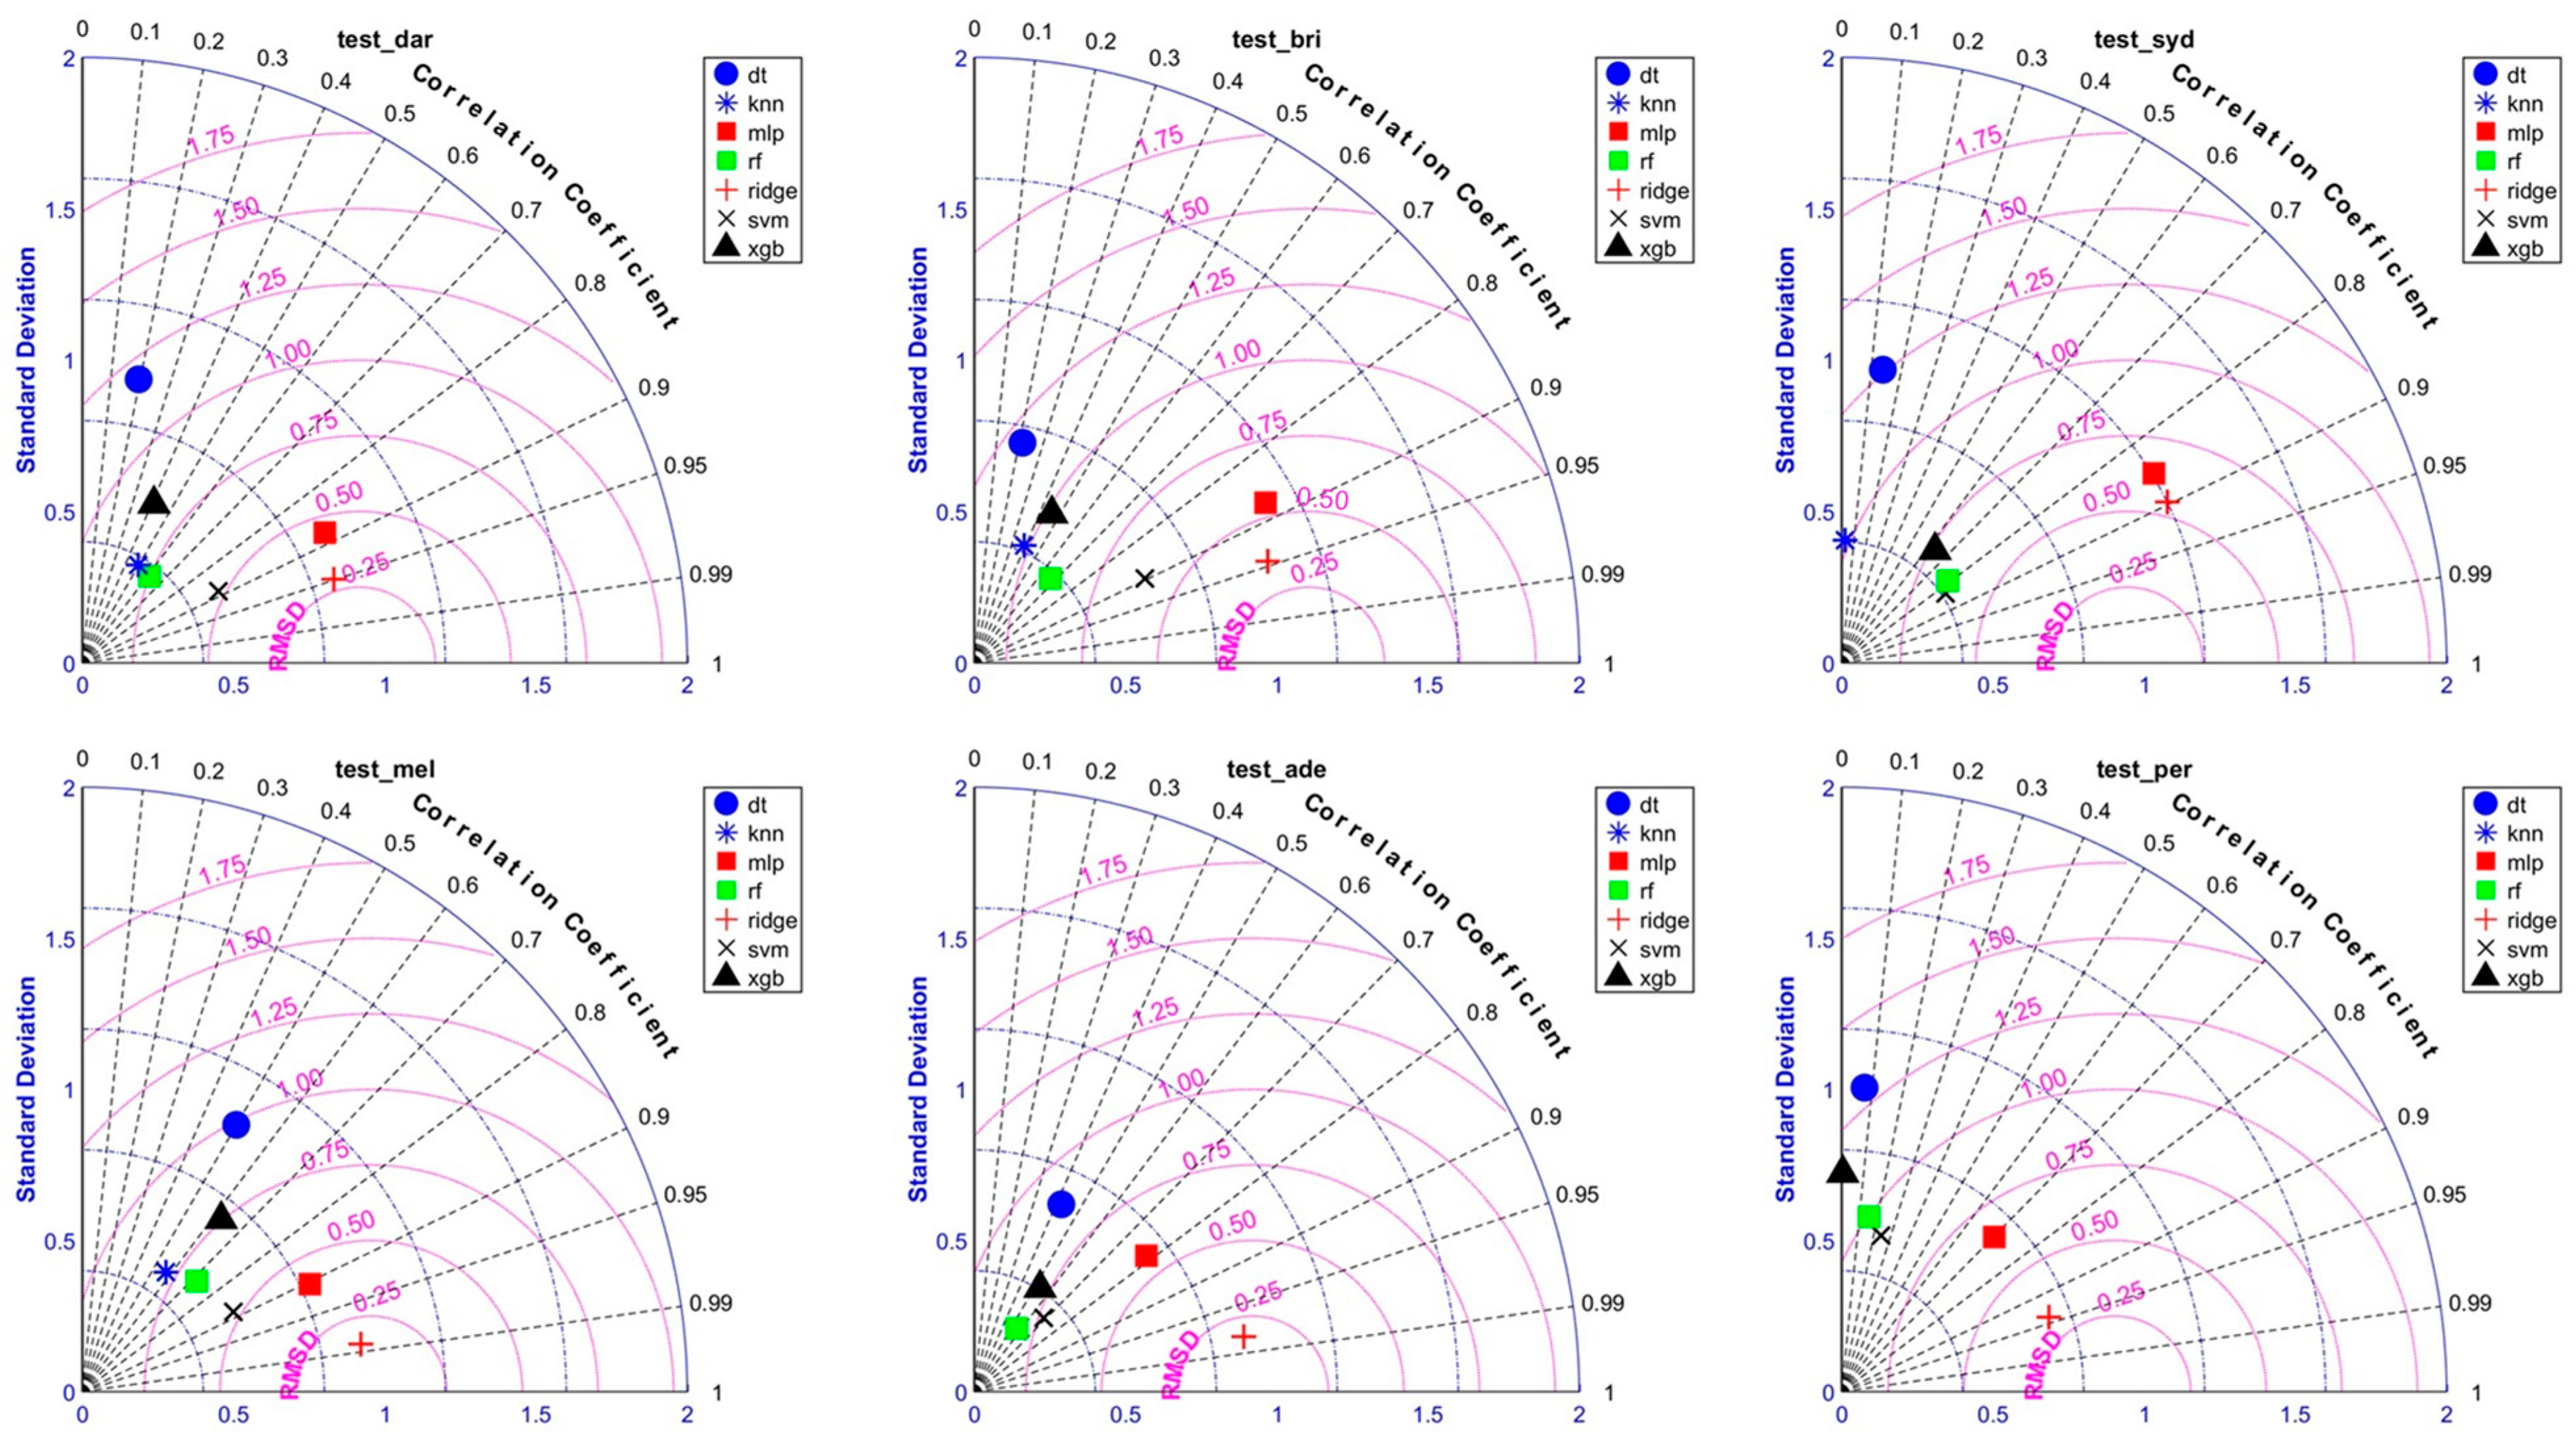
3.2. SPEI Simulation by ML Models
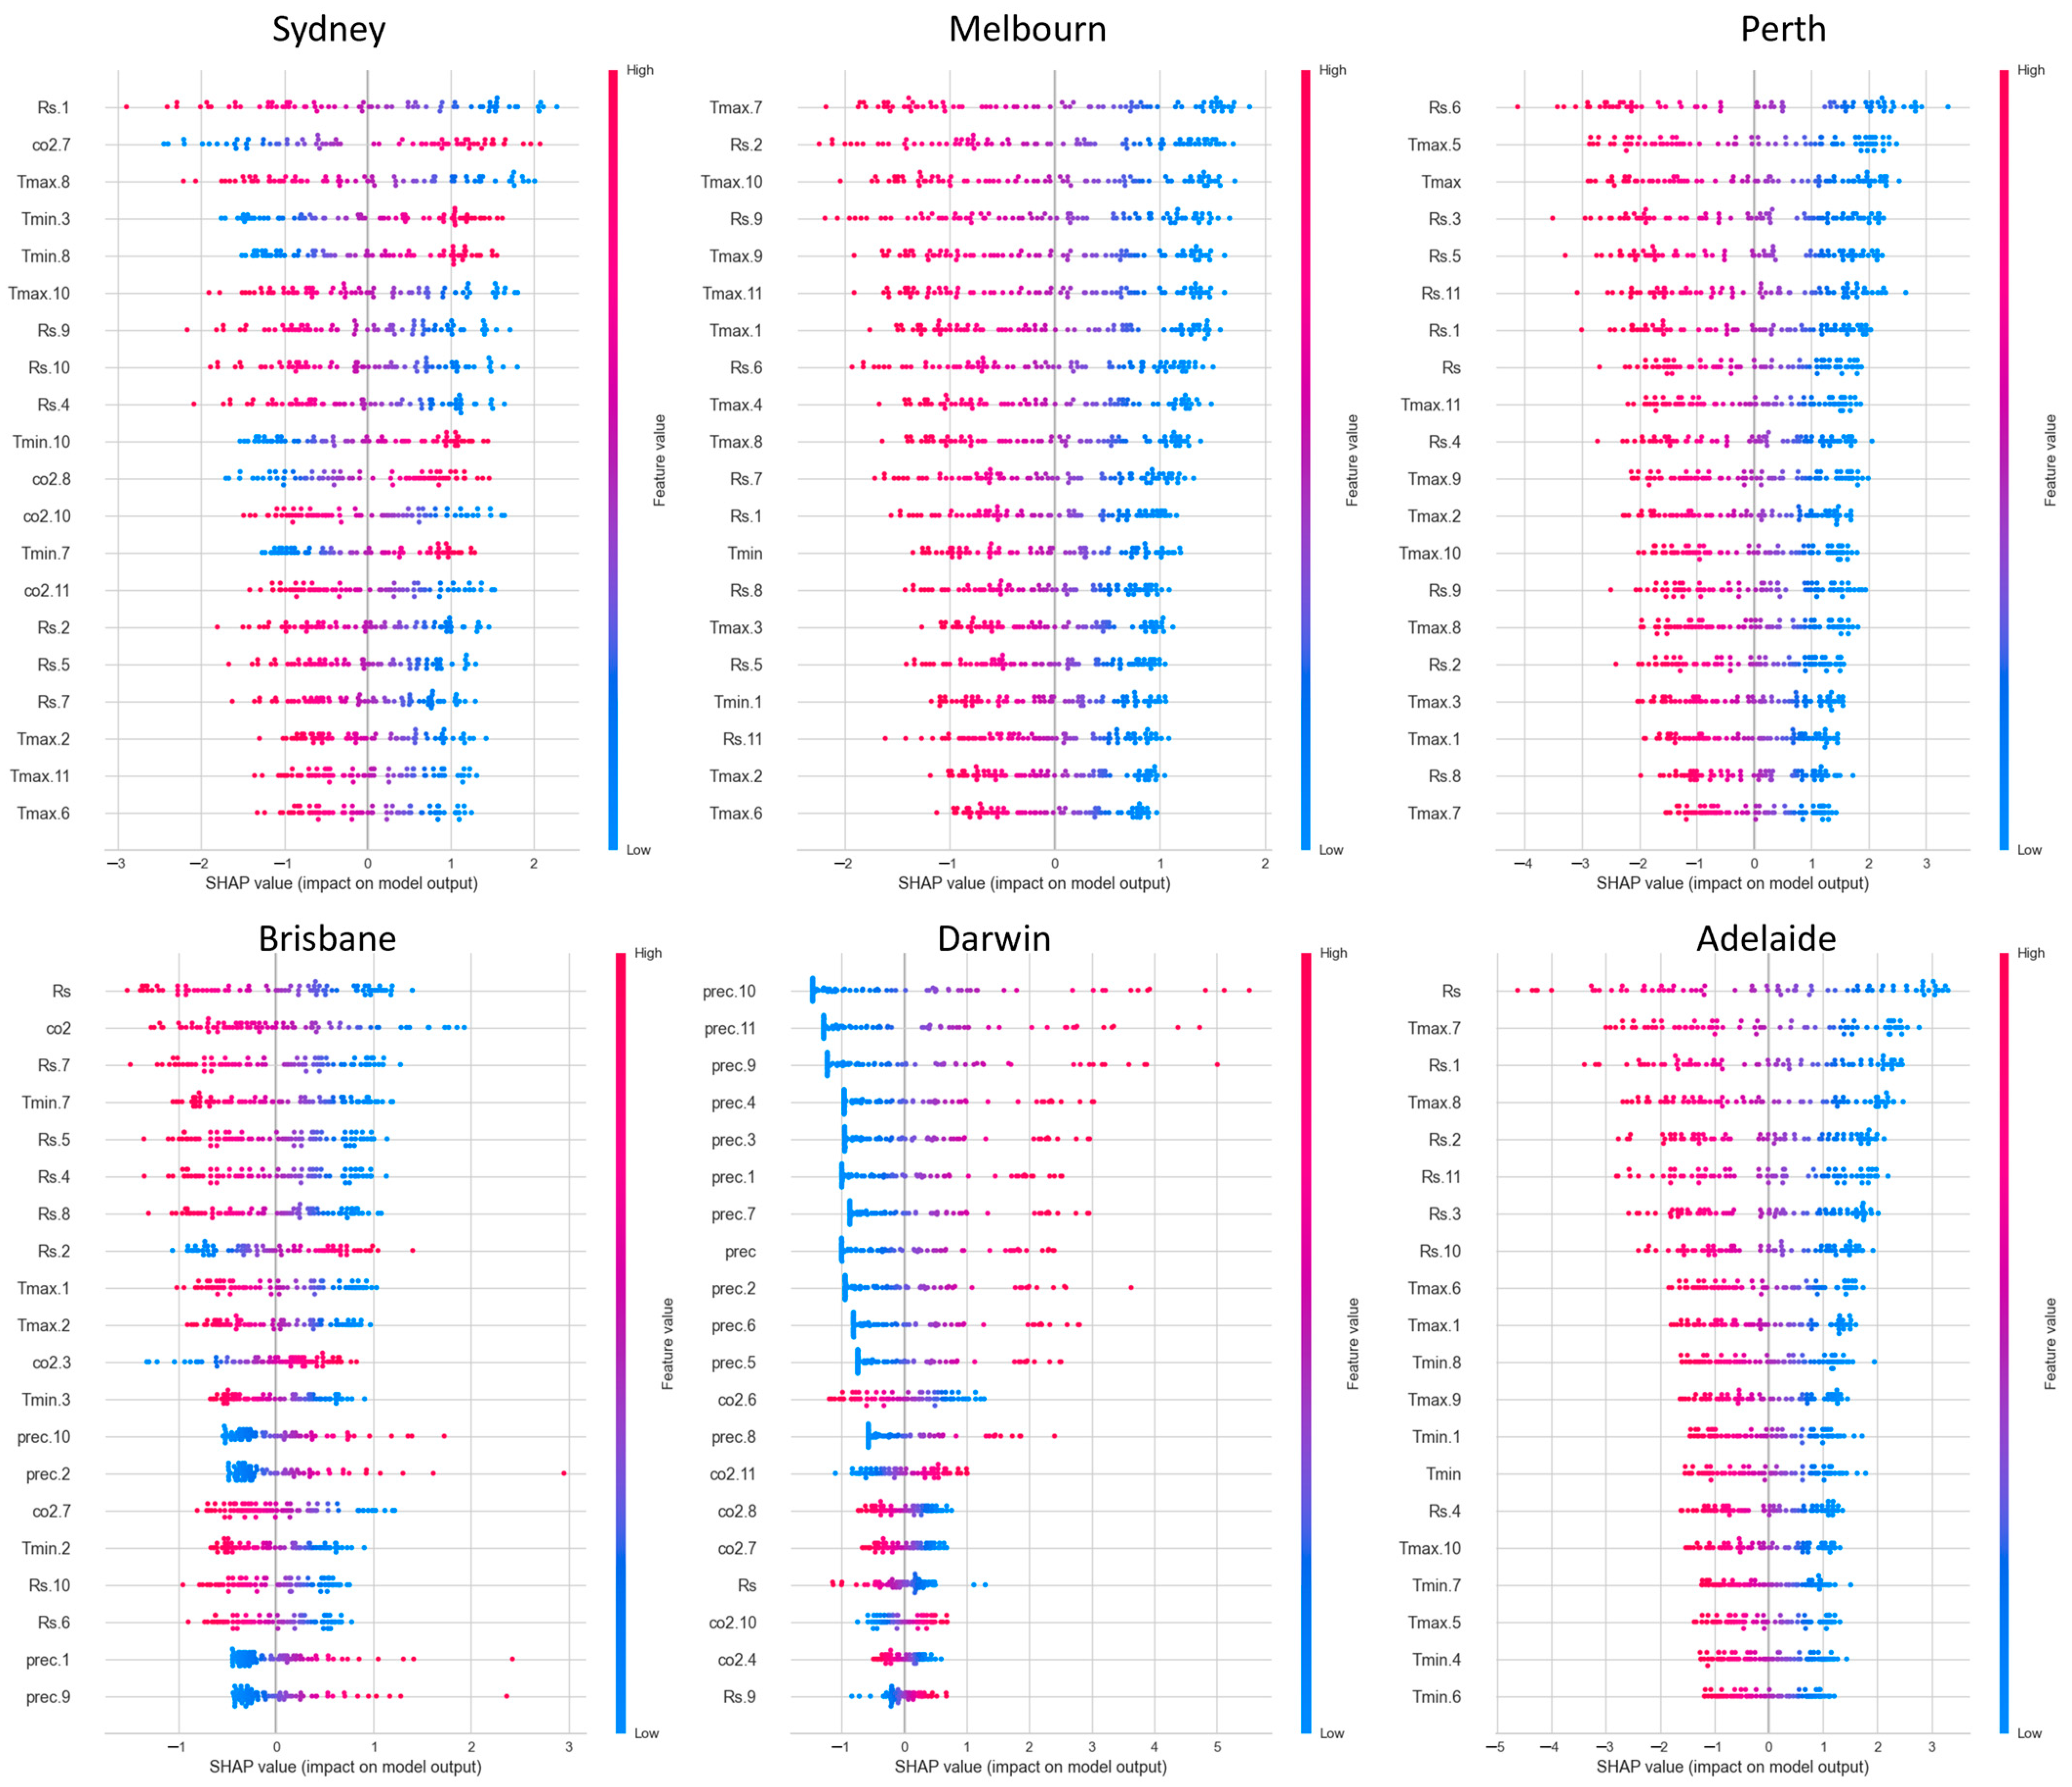
3.3. Drivers of SPEI
4. Discussion
5. Limitations
6. Conclusions
Author Contributions
Funding
Institutional Review Board Statement
Informed Consent Statement
Data Availability Statement
Acknowledgments
Conflicts of Interest
References
- Dumitraşcu, M.; Mocanu, I.; Mitrică, B.; Dragotă, C.; Grigorescu, I.; Dumitrică, C. The assessment of socioeconomic vulnerability to drought in Southern Romania (Oltenia Plain). Int. J. Disaster Risk Reduct. 2018, 27, 142–154. [Google Scholar] [CrossRef]
- Swain, S.; Mishra, S.K.; Pandey, A.; Kalura, P. Inclusion of groundwater and socioeconomic factors for assessing comprehensive drought vulnerability over Narmada River Basin, India: A geospatial approach. Appl. Water Sci. 2022, 12, 14. [Google Scholar] [CrossRef]
- Vicente-Serrano, S.M.; Quiring, S.M.; Peña-Gallardo, M.; Yuan, S.; Domínguez-Castro, F. A review of environmental droughts: Increased risk under global warming? Earth-Sci. Rev. 2020, 201, 102953. [Google Scholar] [CrossRef]
- Van Loon, A.F.; Gleeson, T.; Clark, J.; Van Dijk, A.I.; Stahl, K.; Hannaford, J.; Di Baldassarre, G.; Teuling, A.J.; Tallaksen, L.M.; Uijlenhoet, R. Drought in the Anthropocene. Nat. Geosci. 2016, 9, 89–91. [Google Scholar] [CrossRef]
- Łabędzki, L.; Bąk, B. Meteorological and agricultural drought indices used in drought monitoring in Poland: A review. Meteorol. Hydrol. Water Manag. 2014, 2, 3–14. [Google Scholar] [CrossRef]
- Yihdego, Y.; Vaheddoost, B.; Al-Weshah, R.A. Drought indices and indicators revisited. Arab. J. Geosci. 2019, 12, 69. [Google Scholar] [CrossRef]
- McKee, T.B.; Doesken, N.J.; Kleist, J. The relationship of drought frequency and duration to time scales. In Proceedings of the 8th Conference on Applied Climatology, Anaheim, CA, USA, 17–22 January 1993. [Google Scholar]
- Deo, R.C.; Kisi, O.; Singh, V.P. Drought forecasting in eastern Australia using multivariate adaptive regression spline, least square support vector machine and M5Tree model. Atmos. Res. 2017, 184, 149–175. [Google Scholar] [CrossRef]
- Anshuka, A.; van Ogtrop, F.F.; Willem Vervoort, R. Drought forecasting through statistical models using standardised precipitation index: A systematic review and meta-regression analysis. Nat. Hazards 2019, 97, 955–977. [Google Scholar] [CrossRef]
- Beguería, S.; Vicente-Serrano, S.M.; Reig, F.; Latorre, B. Standardised precipitation evapotranspiration index (SPEI) revisited: Parameter fitting, evapotranspiration models, tools, datasets and drought monitoring. Int. J. Climatol. 2014, 34, 3001–3023. [Google Scholar] [CrossRef]
- Cook, B.I.; Smerdon, J.E.; Seager, R.; Coats, S. Global warming and 21st century drying. Clim. Dyn. 2014, 43, 2607–2627. [Google Scholar] [CrossRef]
- Vicente-Serrano, S.M.; Beguería, S.; López-Moreno, J.I. A multiscalar drought index sensitive to global warming: The standardised precipitation evapotranspiration index. J. Clim. 2010, 23, 1696–1718. [Google Scholar] [CrossRef]
- Vicente-Serrano, S.M.; Beguería, S.; Lorenzo-Lacruz, J.; Camarero, J.J.; López-Moreno, J.I.; Azorin-Molina, C.; Revuelto, J.; Morán-Tejeda, E.; Sanchez-Lorenzo, A. Performance of drought indices for ecological, agricultural, and hydrological applications. Earth Interact. 2012, 16, 1–27. [Google Scholar] [CrossRef]
- Li, L.; She, D.; Zheng, H.; Lin, P.; Yang, Z.-L. Elucidating diverse drought characteristics from two meteorological drought indices (SPI and SPEI) in China. J. Hydrometeorol. 2020, 21, 1513–1530. [Google Scholar] [CrossRef]
- Nguvava, M.; Abiodun, B.J.; Otieno, F. Projecting drought characteristics over East African basins at specific global warming levels. Atmos. Res. 2019, 228, 41–54. [Google Scholar] [CrossRef]
- Alawsi, M.A.; Zubaidi, S.L.; Al-Ansari, N.; Al-Bugharbee, H.; Ridha, H.M. Tuning ANN Hyperparameters by CPSOCGSA, MPA, and SMA for Short-Term SPI Drought Forecasting. Atmosphere 2022, 13, 1436. [Google Scholar] [CrossRef]
- Padmanaban, K. A Novel Groundwater Resource Forecasting Technique for Cultivation Utilizing Wireless Sensor Network (WSN) and Machine Learning (ML) Model. Turk. J. Comput. Math. Educ. (TURCOMAT) 2021, 12, 2186–2192. [Google Scholar]
- Poornima, S.; Pushpalatha, M. Drought prediction based on SPI and SPEI with varying timescales using LSTM recurrent neural network. Soft Comput. 2019, 23, 8399–8412. [Google Scholar] [CrossRef]
- Shen, R.; Huang, A.; Li, B.; Guo, J. Construction of a drought monitoring model using deep learning based on multi-source remote sensing data. Int. J. Appl. Earth Obs. Geoinf. 2019, 79, 48–57. [Google Scholar] [CrossRef]
- Lundberg, S.M.; Lee, S.-I. A unified approach to interpreting model predictions. Adv. Neural Inf. Process. Syst. 2017, 30. [Google Scholar] [CrossRef]
- Covert, I.C.; Lundberg, S.; Lee, S.-I. Explaining by removing: A unified framework for model explanation. J. Mach. Learn. Res. 2021, 22, 9477–9566. [Google Scholar]
- Lubo-Robles, D.; Devegowda, D.; Jayaram, V.; Bedle, H.; Marfurt, K.J.; Pranter, M.J. Machine learning model interpretability using SHAP values: Application to a seismic facies classification task. In Proceedings of the SEG International Exposition and Annual Meeting, Virtual, 11–16 October 2020. [Google Scholar]
- McLennan, W. Year Book Australia 2000; Australian Bureau of Statistics: Canberra, Australia, 2000. [Google Scholar]
- O’Neill, C.; Chandler-Ho, S. Decreasing water budget of the Australian continent from Grace satellite gravity data. arXiv 2021, arXiv:2101.11167. [Google Scholar]
- King, A.D.; Pitman, A.J.; Henley, B.J.; Ukkola, A.M.; Brown, J.R. The role of climate variability in Australian drought. Nat. Clim. Chang. 2020, 10, 177–179. [Google Scholar] [CrossRef]
- Yadav, A.; Das, S.; Bakar, K.S.; Chakrabarti, A. Understanding the complex dynamics of climate change in south-west Australia using Machine Learning. Phys. A Stat. Mech. Its Appl. 2023, 627, 129139. [Google Scholar] [CrossRef]
- McDonald, T. Drought, fire, flood and COVID—Complex systems and disruption. Ecol. Manag. Restor. 2020, 21, 73. [Google Scholar] [CrossRef]
- Collins, L.; Bennett, A.F.; Leonard, S.W.; Penman, T.D. Wildfire refugia in forests: Severe fire weather and drought mute the influence of topography and fuel age. Glob. Chang. Biol. 2019, 25, 3829–3843. [Google Scholar] [CrossRef] [PubMed]
- Mariani, M.; Connor, S.; Fletcher, M.-S.; Romano, A.; Maezumi, S. Higher fuel loads and more fire follow removal of Indigenous cultural burning across southeast Australia. Past Glob. Chang. Mag. 2022, 30, 34–35. [Google Scholar] [CrossRef]
- Bowman, D.; Williamson, G.; Yebra, M.; Lizundia-Loiola, J.; Pettinari, M.L.; Shah, S.; Bradstock, R.; Chuvieco, E. Wildfires: Australia needs national monitoring agency. Nature 2020, 584, 188–191. [Google Scholar] [CrossRef]
- Nolan, R.H.; Boer, M.M.; Collins, L.; Resco de Dios, V.; Clarke, H.; Jenkins, M.; Kenny, B.; Bradstock, R.A. Causes and consequences of eastern Australia’s 2019–20 season of mega-fires. Glob. Chang. Biol. 2020, 26, 1039–1041. [Google Scholar] [CrossRef]
- Shi, L.; Feng, P.; Wang, B.; Liu, D.L.; Yu, Q. Quantifying future drought change and associated uncertainty in southeastern Australia with multiple potential evapotranspiration models. J. Hydrol. 2020, 590, 125394. [Google Scholar] [CrossRef]
- Penman, H.L. Natural evaporation from open water, hare soil and grass. Proc. R. Soc. Lond. A Math. Phys. Sci. 1948, 193, 120–145. [Google Scholar] [CrossRef]
- Abtew, W. Evapotranspiration measurements and modeling for three wetland systems in South Florida. JAWRA J. Am. Water Resour. Assoc. 1996, 32, 465–473. [Google Scholar] [CrossRef]
- Hargreaves, G.L.; Hargreaves, G.H.; Riley, J.P. Irrigation water requirements for Senegal River basin. J. Irrig. Drain. Eng. 1985, 111, 265–275. [Google Scholar] [CrossRef]
- Jensen, M.E.; Haise, H.R. Estimating evapotranspiration from solar radiation. J. Irrig. Drain. Div. 1963, 89, 15–41. [Google Scholar] [CrossRef]
- Allen, R.G.; Pereira, L.S.; Raes, D.; Smith, M. Crop evapotranspiration-Guidelines for computing crop water requirements-FAO Irrigation and drainage paper 56. Fao Rome 1998, 300, D05109. [Google Scholar]
- Thornthwaite, C.W. An approach toward a rational classification of climate. Geogr. Rev. 1948, 38, 55–94. [Google Scholar] [CrossRef]
- Priestley CH, B.; Taylor, R.J. On the Assessment of Surface Heat Flux and Evaporation Using Large-Scale Parameters. Mon. Weather Rev. 1972, 100, 81–92. [Google Scholar] [CrossRef]
- Yang, Y.; Roderick, M.L.; Zhang, S.; McVicar, T.R.; Donohue, R.J. Hydrologic implications of vegetation response to elevated CO2 in climate projections. Nat. Clim. Chang. 2019, 9, 44–48. [Google Scholar] [CrossRef]
- Achite, M.; Elshaboury, N.; Jehanzaib, M.; Vishwakarma, D.K.; Pham, Q.B.; Anh, D.T.; Abdelkader, E.M.; Elbeltagi, A. Performance of machine learning techniques for meteorological drought forecasting in the wadi mina basin, Algeria. Water 2023, 15, 765. [Google Scholar] [CrossRef]
- Lotfirad, M.; Esmaeili-Gisavandani, H.; Adib, A. Drought monitoring and prediction using SPI, SPEI, and random forest model in various climates of Iran. J. Water Clim. Chang. 2021, 13, 383–406. [Google Scholar] [CrossRef]
- Lucas, C.; Hennessy, K.; Mills, G.; Bathols, J. Bushfire Weather in Southeast Australia: Recent Trends and Projected Climate Change Impacts; Bushfire CRC: Melbourne, Australia, 2007. [Google Scholar]
- Grant, S.B.; Fletcher, T.D.; Feldman, D.; Saphores, J.-D.; Cook, P.L.; Stewardson, M.; Low, K.; Burry, K.; Hamilton, A.J. Adapting urban water systems to a changing climate: Lessons from the millennium drought in southeast Australia. Environ. Sci. Technol. 2013, 47, 10727–10734. [Google Scholar] [CrossRef]
- Köppen, W.; Geiger, R. Handbuch der Klimatologie; Gebrüder Borntraeger Berlin: Berlin, Germany, 1930; Volume 1. [Google Scholar]
- Gannon, K.E.; Conway, D.; Pardoe, J.; Ndiyoi, M.; Batisani, N.; Odada, E.; Olago, D.; Opere, A.; Kgosietsile, S.; Nyambe, M. Business experience of floods and drought-related water and electricity supply disruption in three cities in sub-Saharan Africa during the 2015/2016 El Niño. Glob. Sustain. 2018, 1, e14. [Google Scholar] [CrossRef]
- Milly PC, D.; Dunne, K.A. Potential evapotranspiration and continental drying. Nat. Clim. Chang. 2016, 6, 946–949. [Google Scholar] [CrossRef]
- Brutsaert, W. Evaporation Into the Atmosphere: Theory, History, and Applications; Cornell University: New York, NY, USA; Springer: Berlin/Heidelberg, Germany, 1982. [Google Scholar] [CrossRef]
- Brutsaert, W. Hydrology: An Introduction; Cornell University: New York, NY, USA, 2005. [Google Scholar] [CrossRef]
- Pei, Z.; Fang, S.; Wang, L.; Yang, W. Comparative Analysis of Drought Indicated by the SPI and SPEI at Various Timescales in Inner Mongolia, China. Water 2020, 12, 1925. [Google Scholar] [CrossRef]
- PyCaret. PyCaret Version 1.0.0; Python; 2020. Available online: https://pycaret.org (accessed on 20 December 2023).
- Jiao, T.; Williams, C.A.; Rogan, J.; De Kauwe, M.G.; Medlyn, B.E. Drought impacts on Australian vegetation during the millennium drought measured with multisource spaceborne remote sensing. J. Geophys. Res. Biogeosci. 2020, 125, e2019JG005145. [Google Scholar] [CrossRef]
- Vicente-Serrano, S.M.; Van der Schrier, G.; Beguería, S.; Azorin-Molina, C.; Lopez-Moreno, J.-I. Contribution of precipitation and reference evapotranspiration to drought indices under different climates. J. Hydrol. 2015, 526, 42–54. [Google Scholar] [CrossRef]
- Deo, R.C.; Şahin, M. Application of the Artificial Neural Network model for prediction of monthly Standardised Precipitation and Evapotranspiration Index using hydrometeorological parameters and climate indices in eastern Australia. Atmos. Res. 2015, 161–162, 65–81. [Google Scholar] [CrossRef]
- Dikshit, A.; Pradhan, B.; Huete, A. An improved SPEI drought forecasting approach using the long short-term memory neural network. J. Environ. Manag. 2021, 283, 111979. [Google Scholar] [CrossRef]
- Aminzade, J. Projections of Future Drought. In Our Warming Planet; World Scientific: Singapore, 2018; pp. 231–249. [Google Scholar] [CrossRef]
- Rosenzweig, C.; Rind, D.; Lacis, A.; Manley, D. Our Warming Planet; World Scientific: Singapore, 2018. [Google Scholar] [CrossRef]
- Zhang, X.; Zhang, Y.; Ma, N.; Kong, D.; Tian, J.; Shao, X.; Tang, Q. Greening-induced increase in evapotranspiration over Eurasia offset by CO2-induced vegetational stomatal closure. Environ. Res. Lett. 2021, 16, 124008. [Google Scholar] [CrossRef]
- Wang, Q.; Liu, X.; Wang, Z.; Zhao, L.; Zhang, Q.-P. Time scale selection and periodicity analysis of grassland drought monitoring index in Inner Mongolia. Glob. Ecol. Conserv. 2022, 36, e02138. [Google Scholar] [CrossRef]
- Lara, A.; Jones, J.; Little, C.; Vergara, N. Streamflow response to native forest restoration in former Eucalyptus plantations in south central Chile. Hydrol. Process. 2021, 35, e14270. [Google Scholar] [CrossRef]
- Li, Z.; Zhou, P.; Shi, X.; Li, Y. Forest effects on runoff under climate change in the Upper Dongjiang River Basin: Insights from annual to intra-annual scales. Environ. Res. Lett. 2020, 16, 014032. [Google Scholar] [CrossRef]

| PET Method | Abbr | Input | Reference |
|---|---|---|---|
| Penman Open-Water Model | Epa | Tmax, Tmin, ea, Rs, u2 | (Penman, 1948) [33] |
| Priestley–Taylor Evaporation | Epo | Tmax, Tmin, ea, Rs | (Priestley & Taylor, 1972) [39] |
| FAO56 Penman–Monteith Reference Crop Model | ETO | Tmax, Tmin, ea, Rs, u2 | (R. Allen et al., 1998) [37] |
| FAO56-CO2 Model | ETO2 | Tmax, Tmin, ea, Rs, u2, CO2 | (Yang et al., 2019) [40] |
Disclaimer/Publisher’s Note: The statements, opinions and data contained in all publications are solely those of the individual author(s) and contributor(s) and not of MDPI and/or the editor(s). MDPI and/or the editor(s) disclaim responsibility for any injury to people or property resulting from any ideas, methods, instructions or products referred to in the content. |
© 2023 by the authors. Licensee MDPI, Basel, Switzerland. This article is an open access article distributed under the terms and conditions of the Creative Commons Attribution (CC BY) license (https://creativecommons.org/licenses/by/4.0/).
Share and Cite
Yang, W.; Doulabian, S.; Shadmehri Toosi, A.; Alaghmand, S. Unravelling the Drought Variance Using Machine Learning Methods in Six Capital Cities of Australia. Atmosphere 2024, 15, 43. https://doi.org/10.3390/atmos15010043
Yang W, Doulabian S, Shadmehri Toosi A, Alaghmand S. Unravelling the Drought Variance Using Machine Learning Methods in Six Capital Cities of Australia. Atmosphere. 2024; 15(1):43. https://doi.org/10.3390/atmos15010043
Chicago/Turabian StyleYang, Wenjing, Shahab Doulabian, Amirhossein Shadmehri Toosi, and Sina Alaghmand. 2024. "Unravelling the Drought Variance Using Machine Learning Methods in Six Capital Cities of Australia" Atmosphere 15, no. 1: 43. https://doi.org/10.3390/atmos15010043
APA StyleYang, W., Doulabian, S., Shadmehri Toosi, A., & Alaghmand, S. (2024). Unravelling the Drought Variance Using Machine Learning Methods in Six Capital Cities of Australia. Atmosphere, 15(1), 43. https://doi.org/10.3390/atmos15010043