
Exploring the Potential of Sentinel-1 Ocean Wind Field Product for Near-Surface Offshore Wind Assessment in the Norwegian Arctic
 , , , , and
Abstract
:1. Introduction
2. Theoretical Background
2.1. Reanalysis Products
2.2. Sentinel-1 Level-2 OWI Product
3. Methods
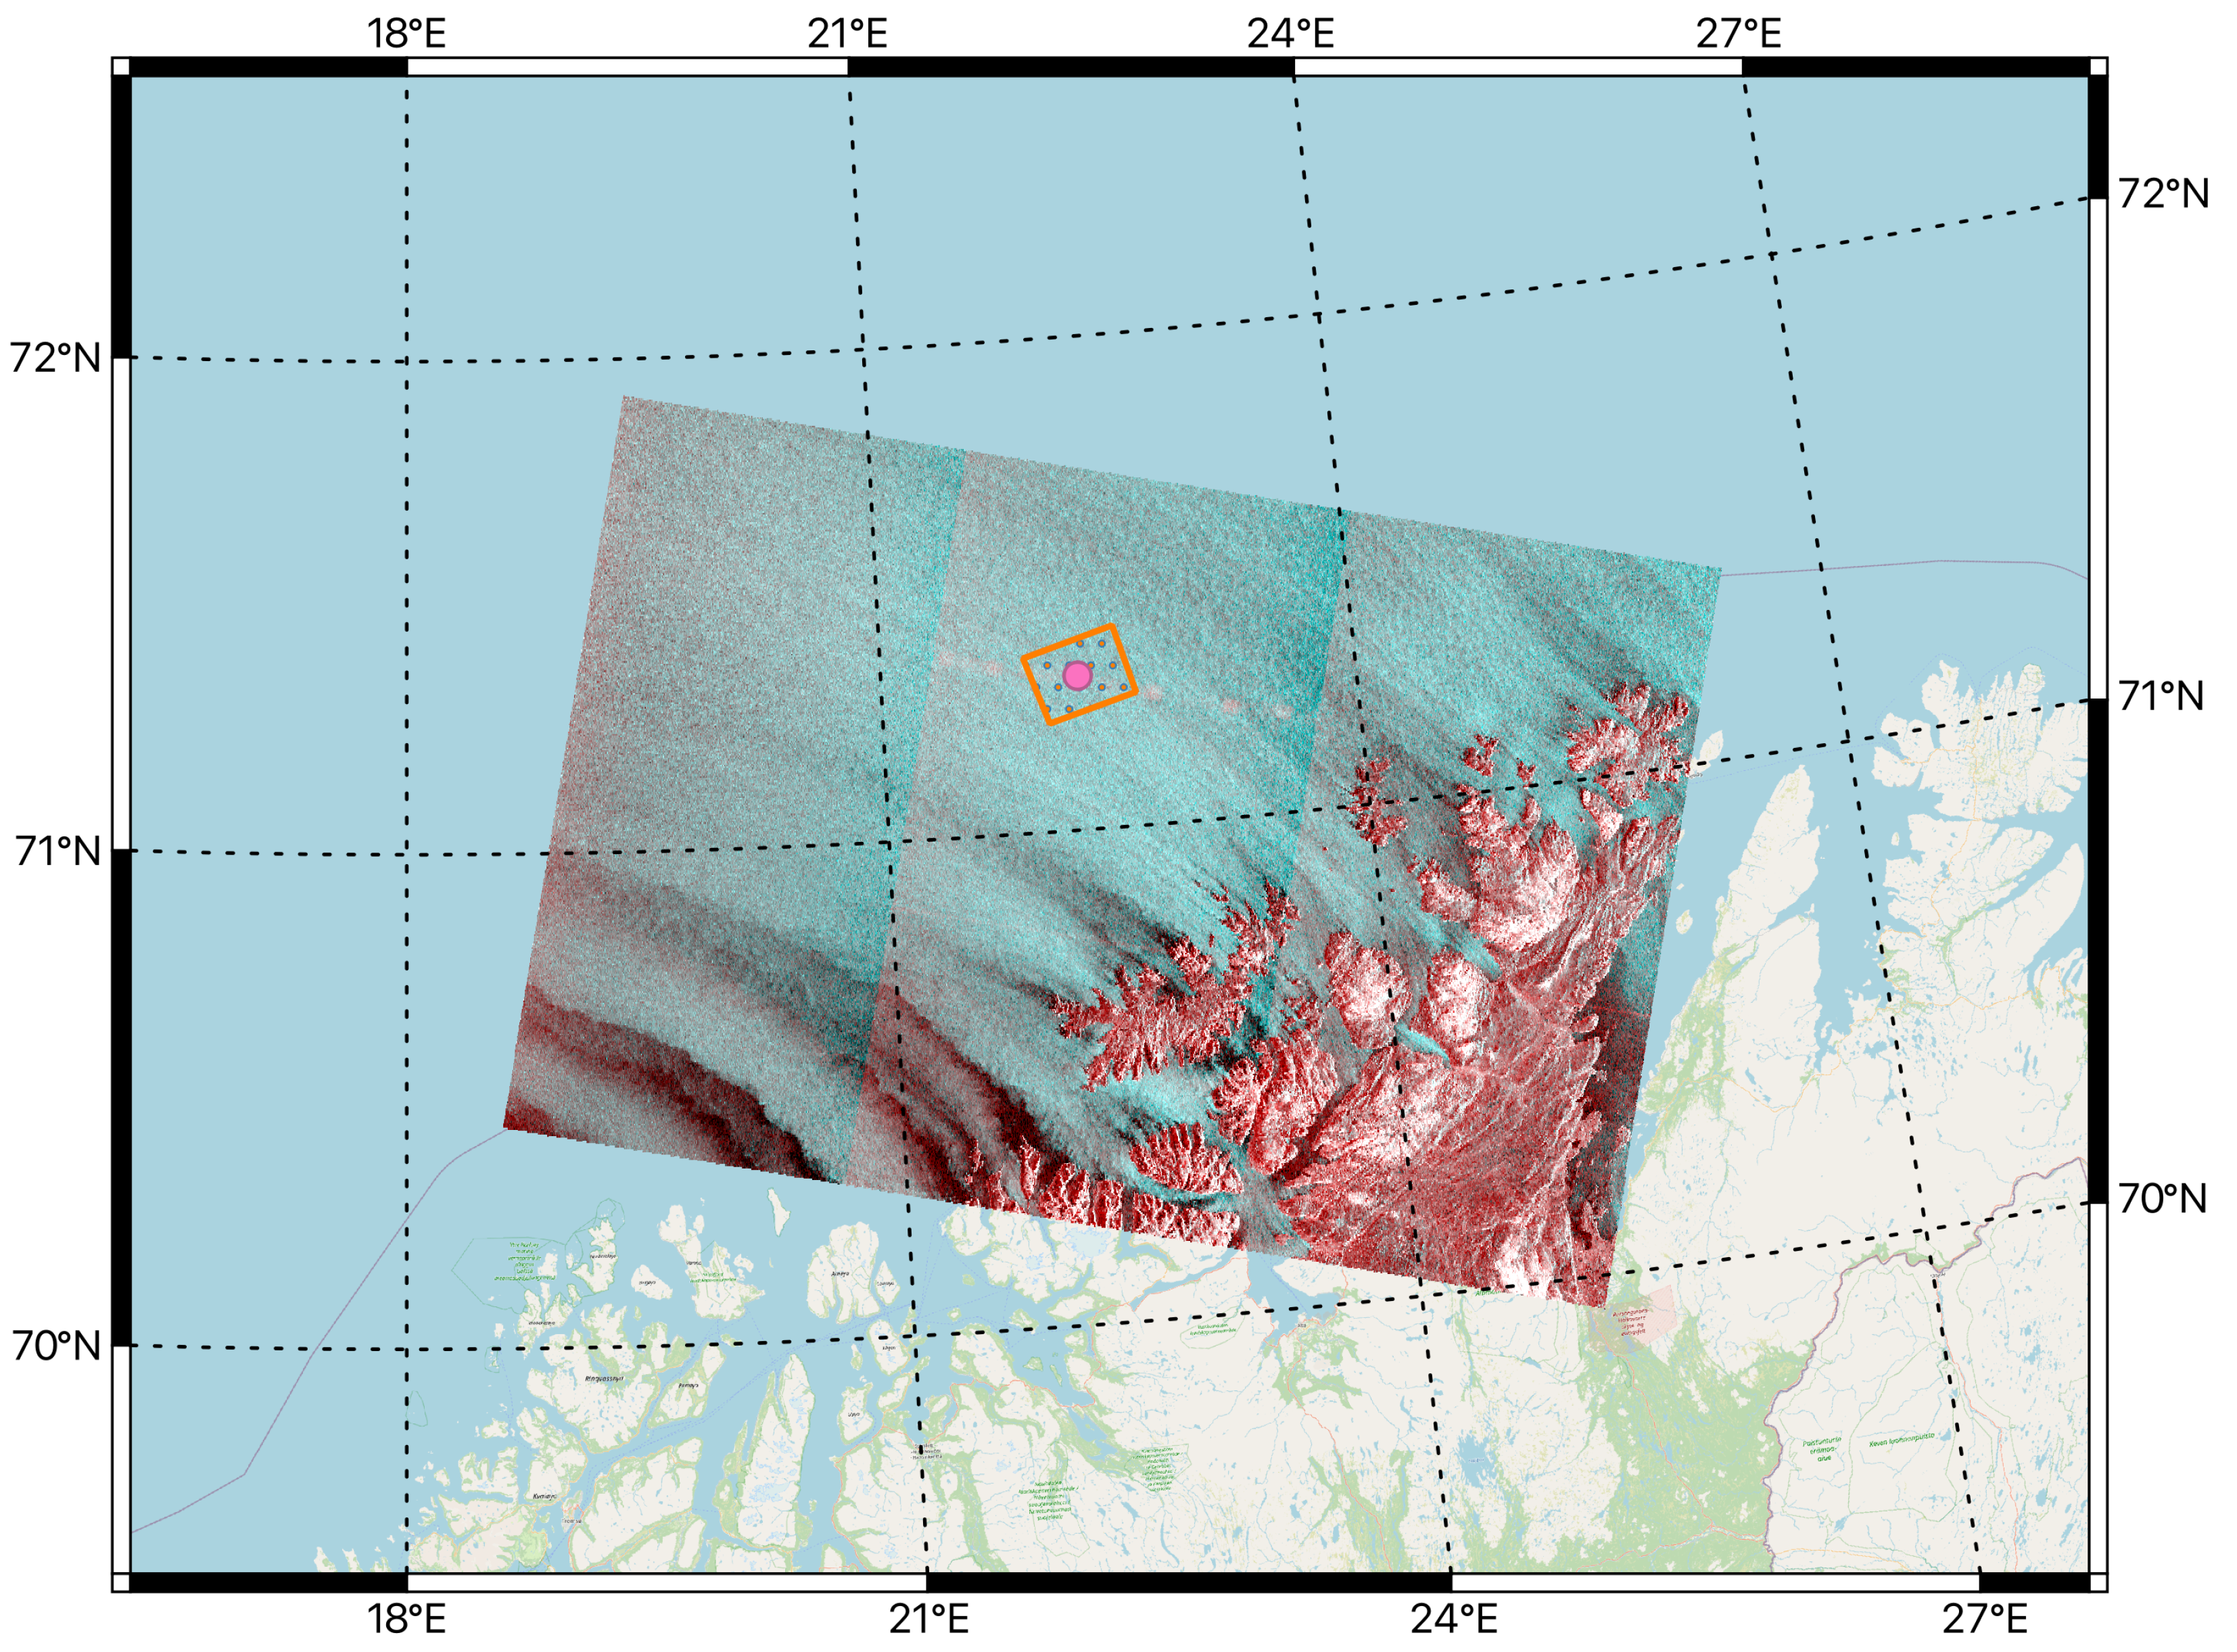
3.1. Datasets
3.1.1. In Situ Observations
3.1.2. Reanalyses
ERA5
NORA3
CARRA
3.1.3. Remote Sensing
3.2. Temporal and Spatial Preprocessing
3.3. Statistical Analysis
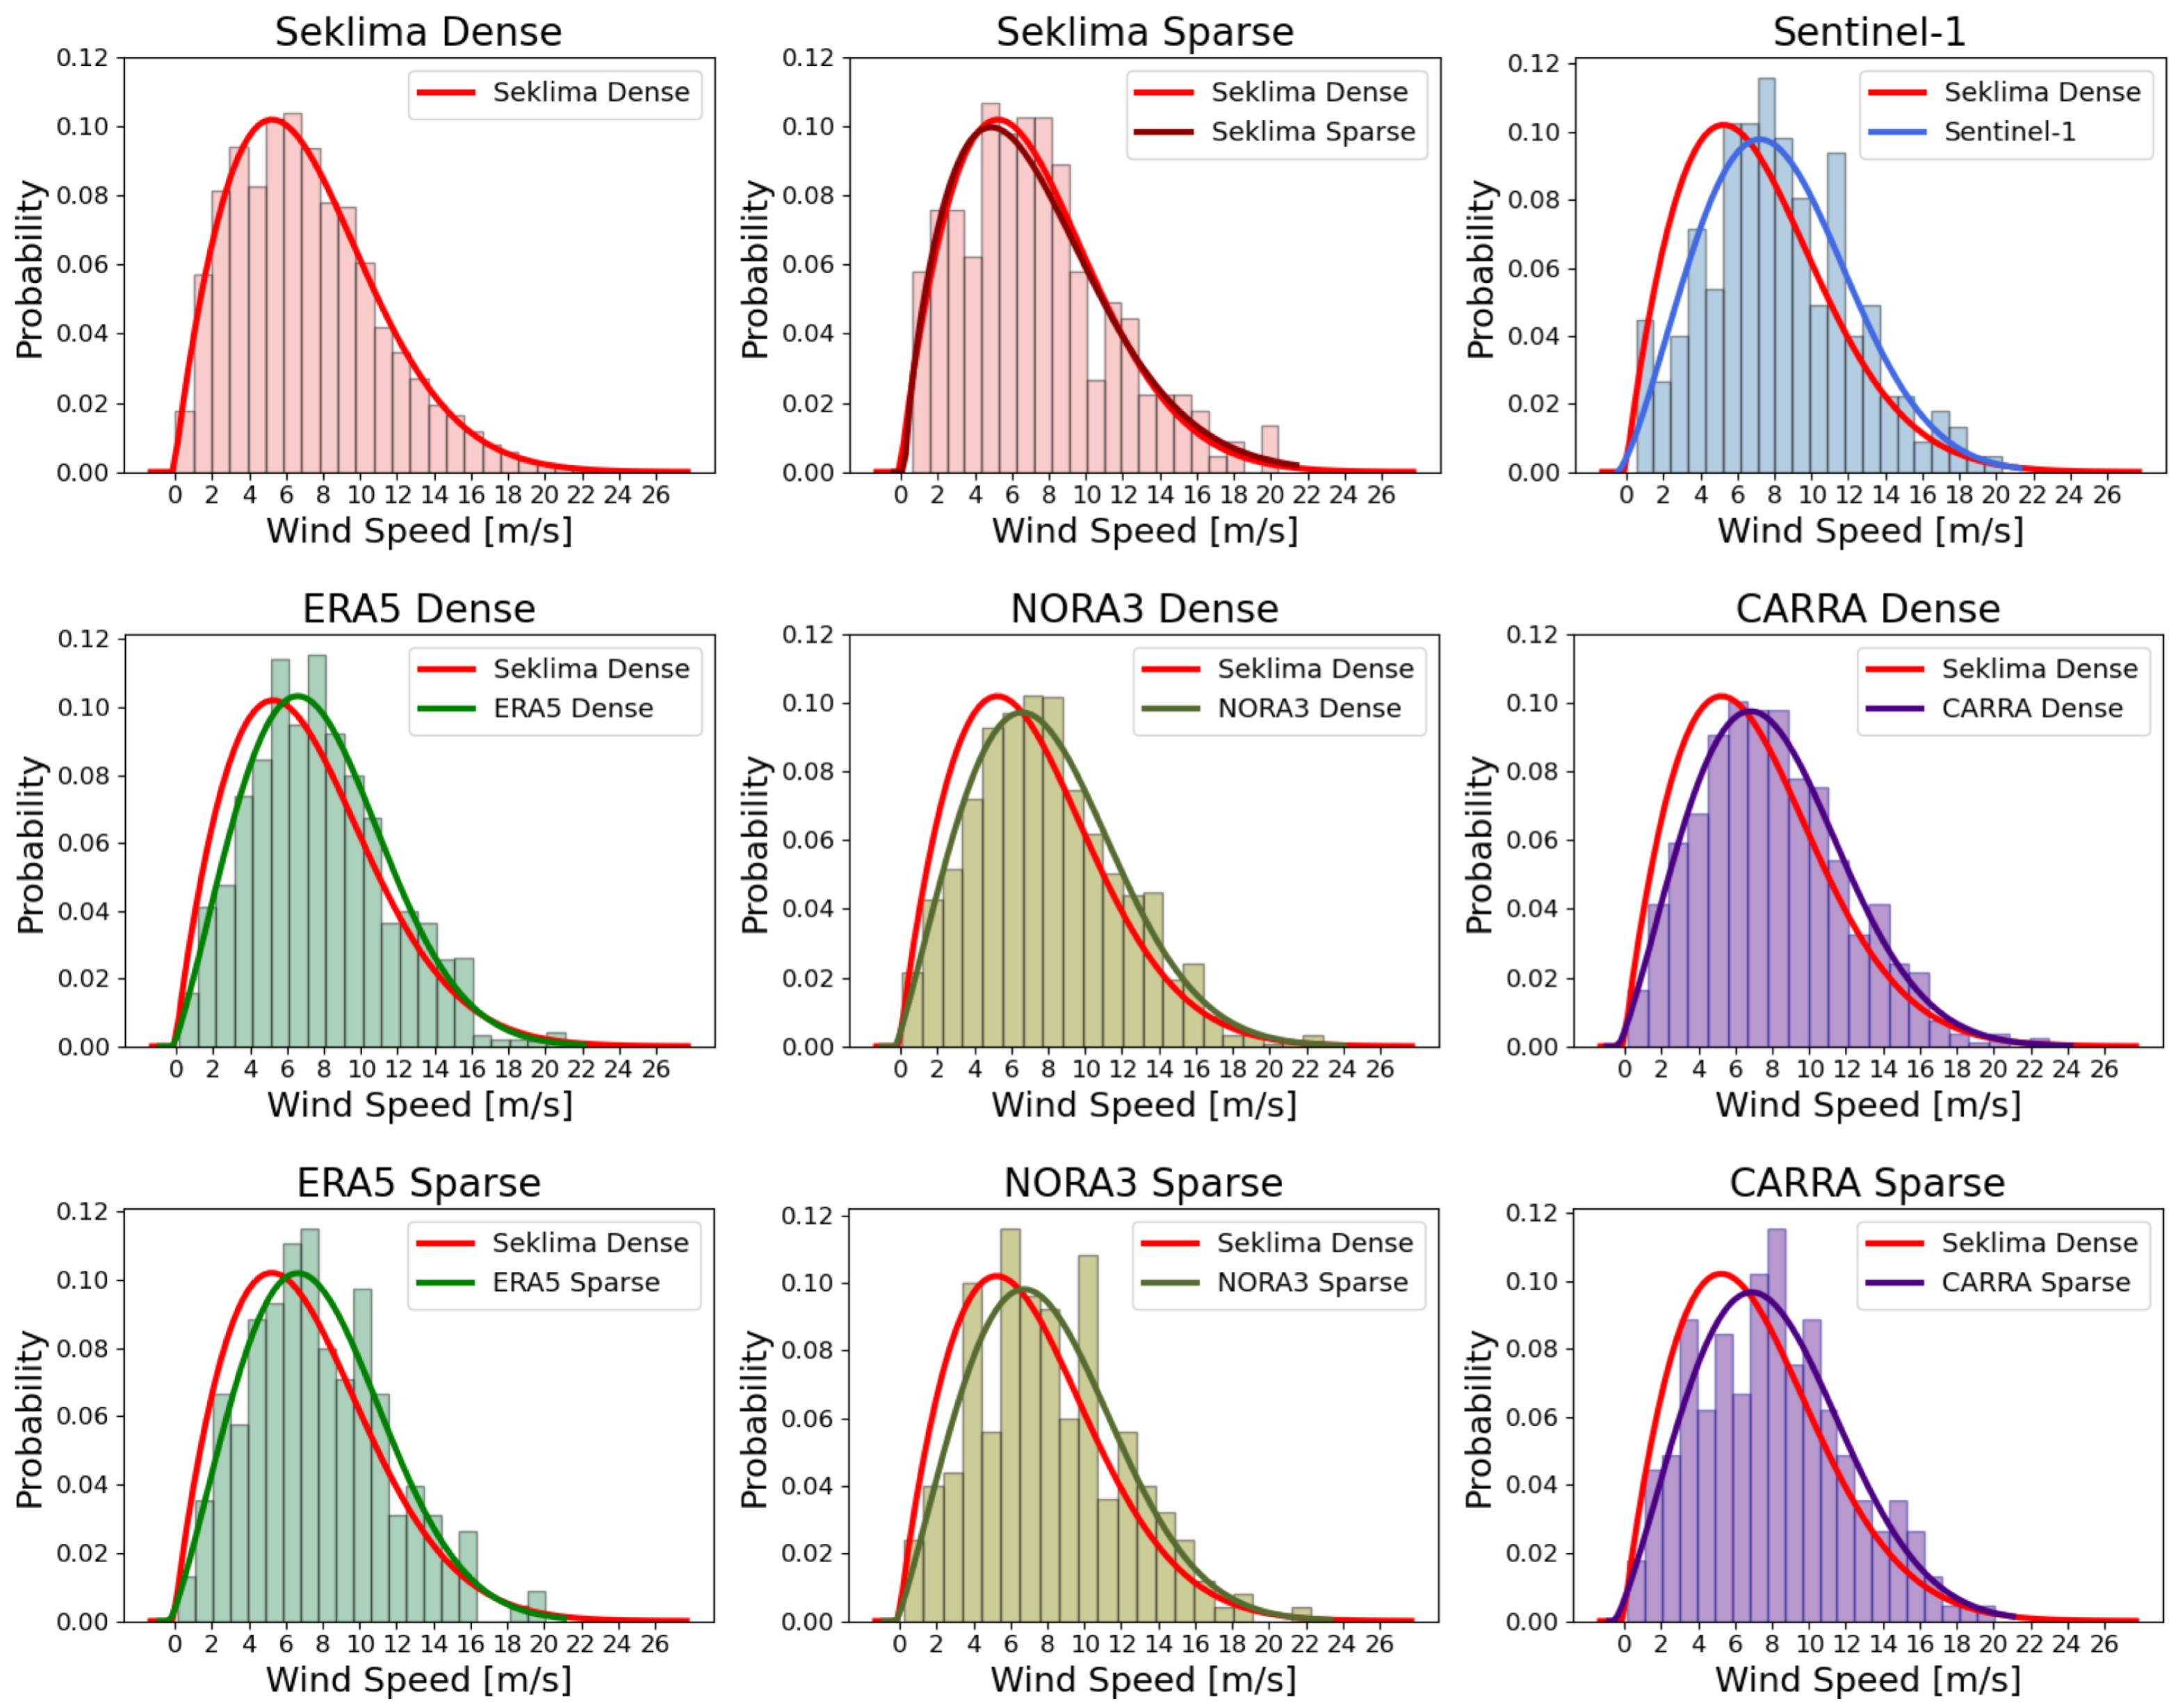
3.4. Wind Speed Distribution
4. Results and Discussion
4.1. Wind Speed
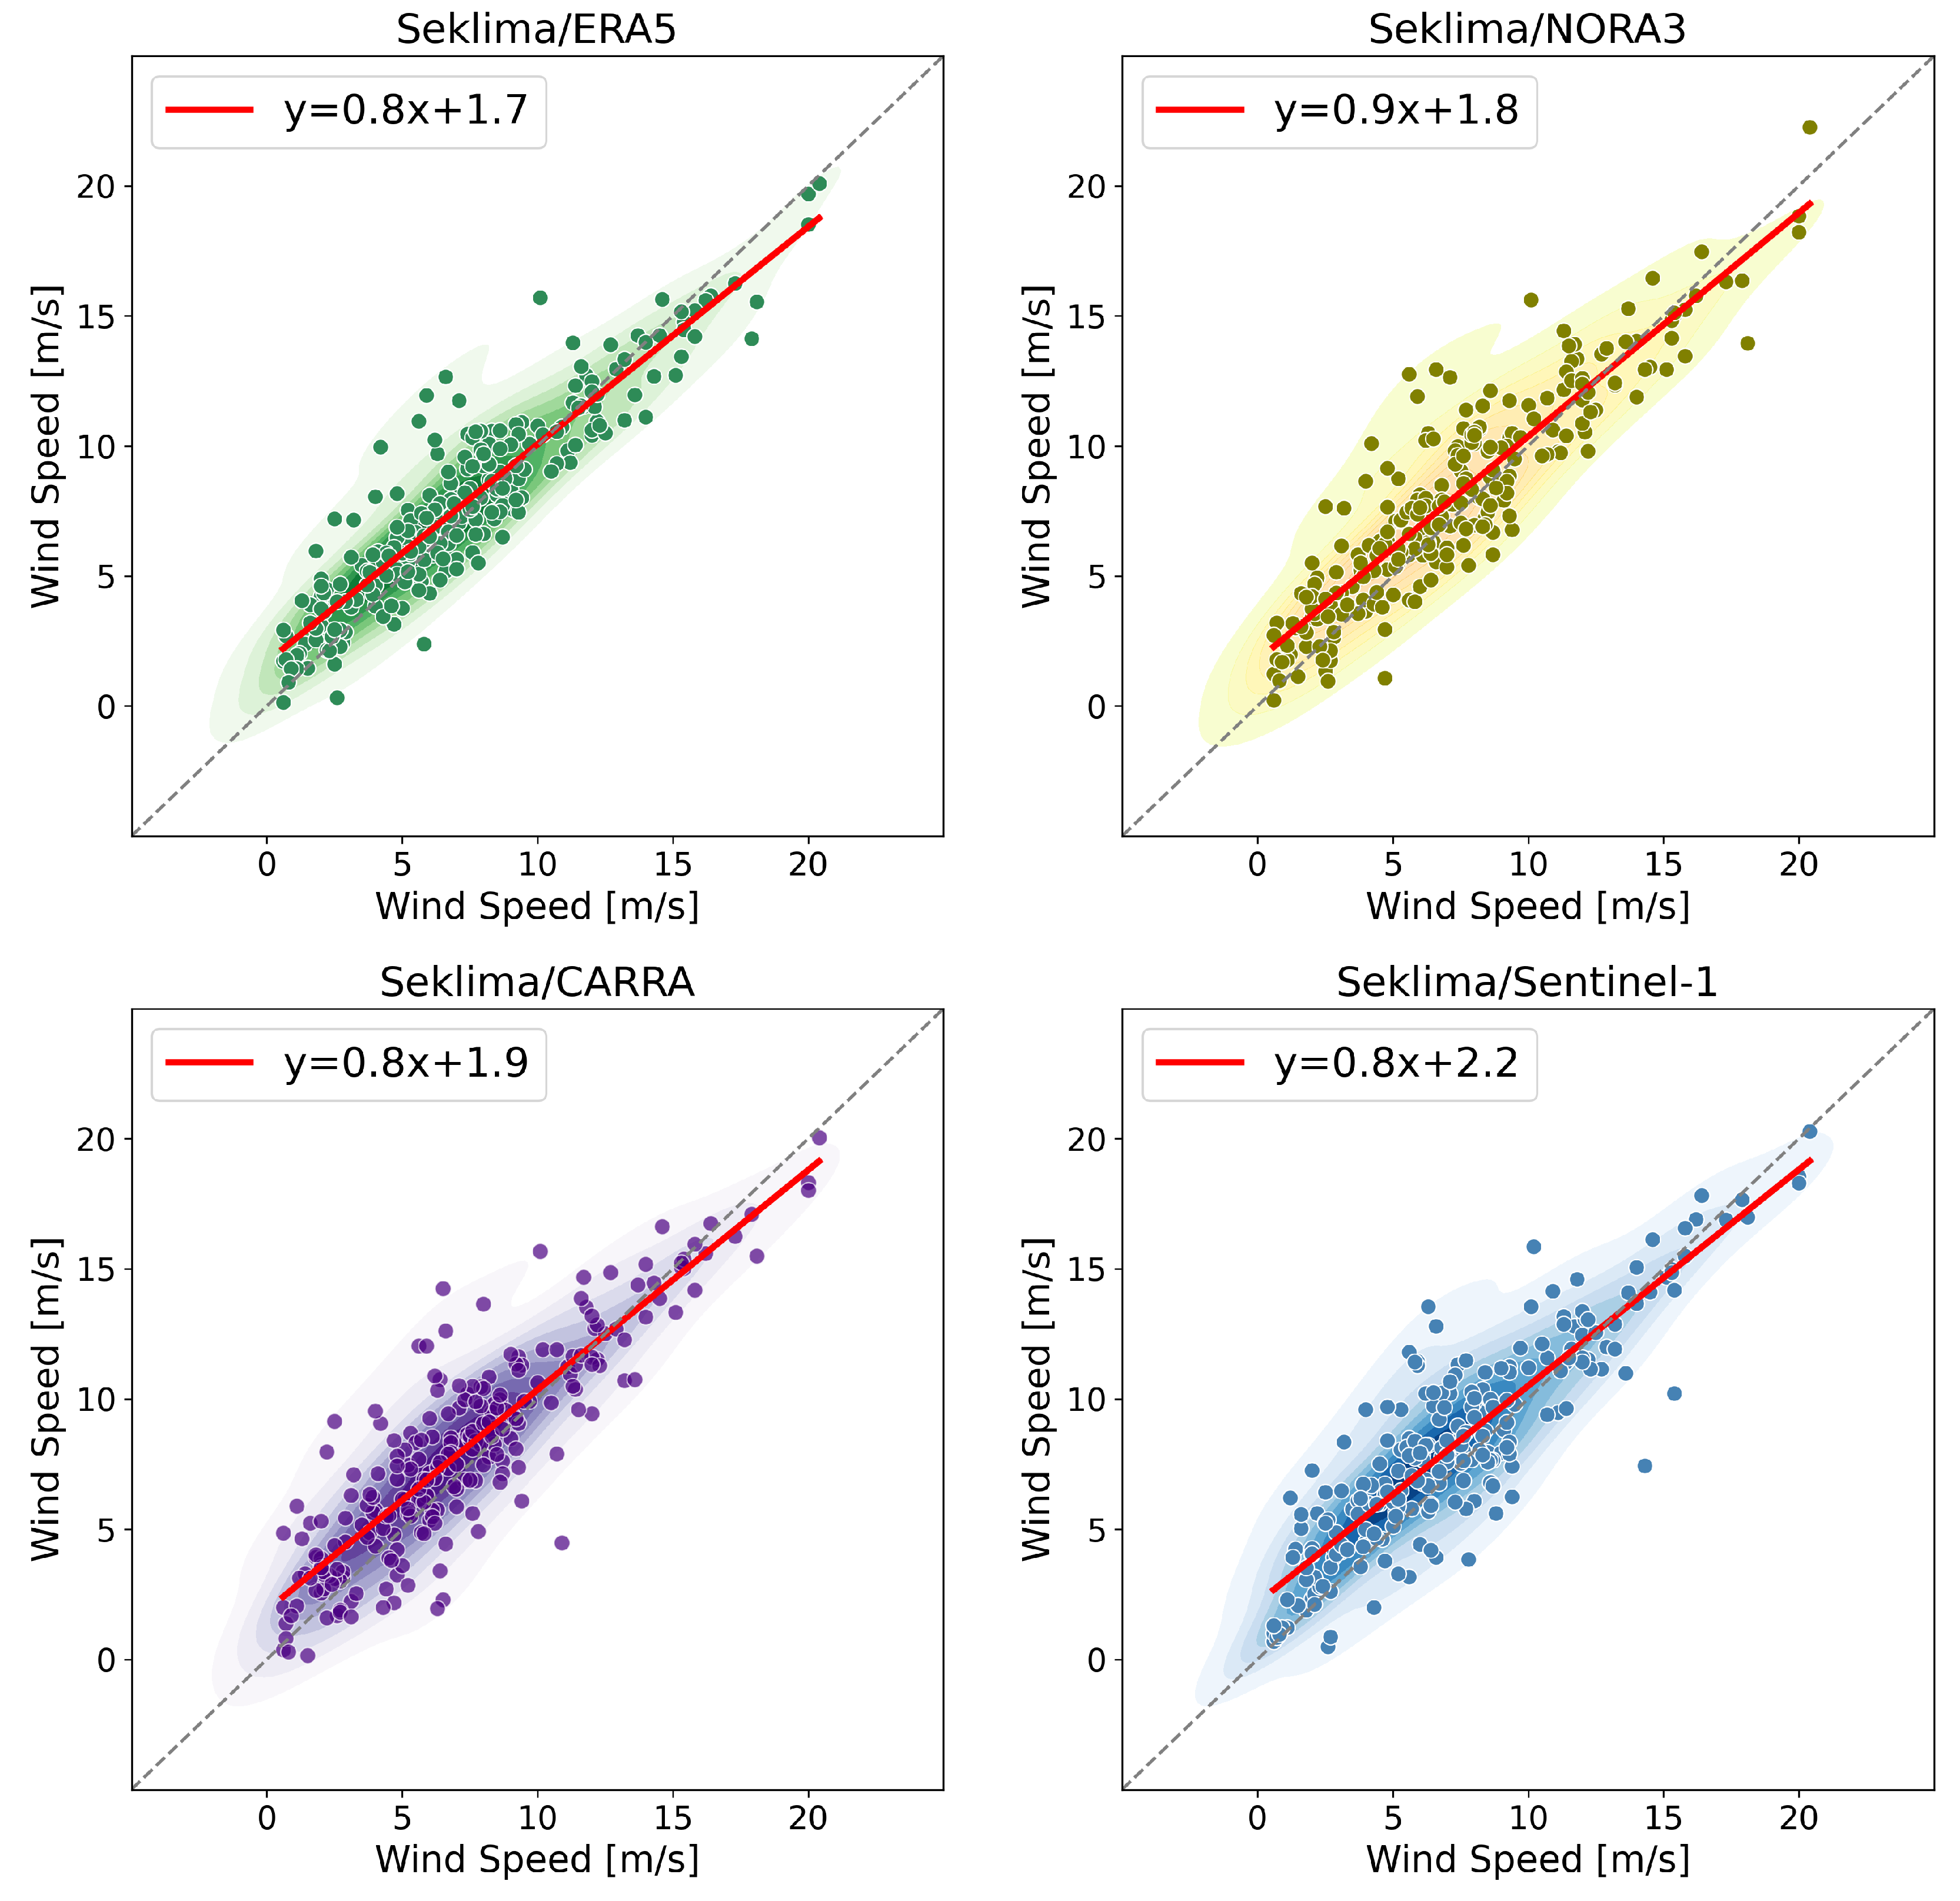
4.1.1. Scatterplots
4.1.2. Statistical Metrics
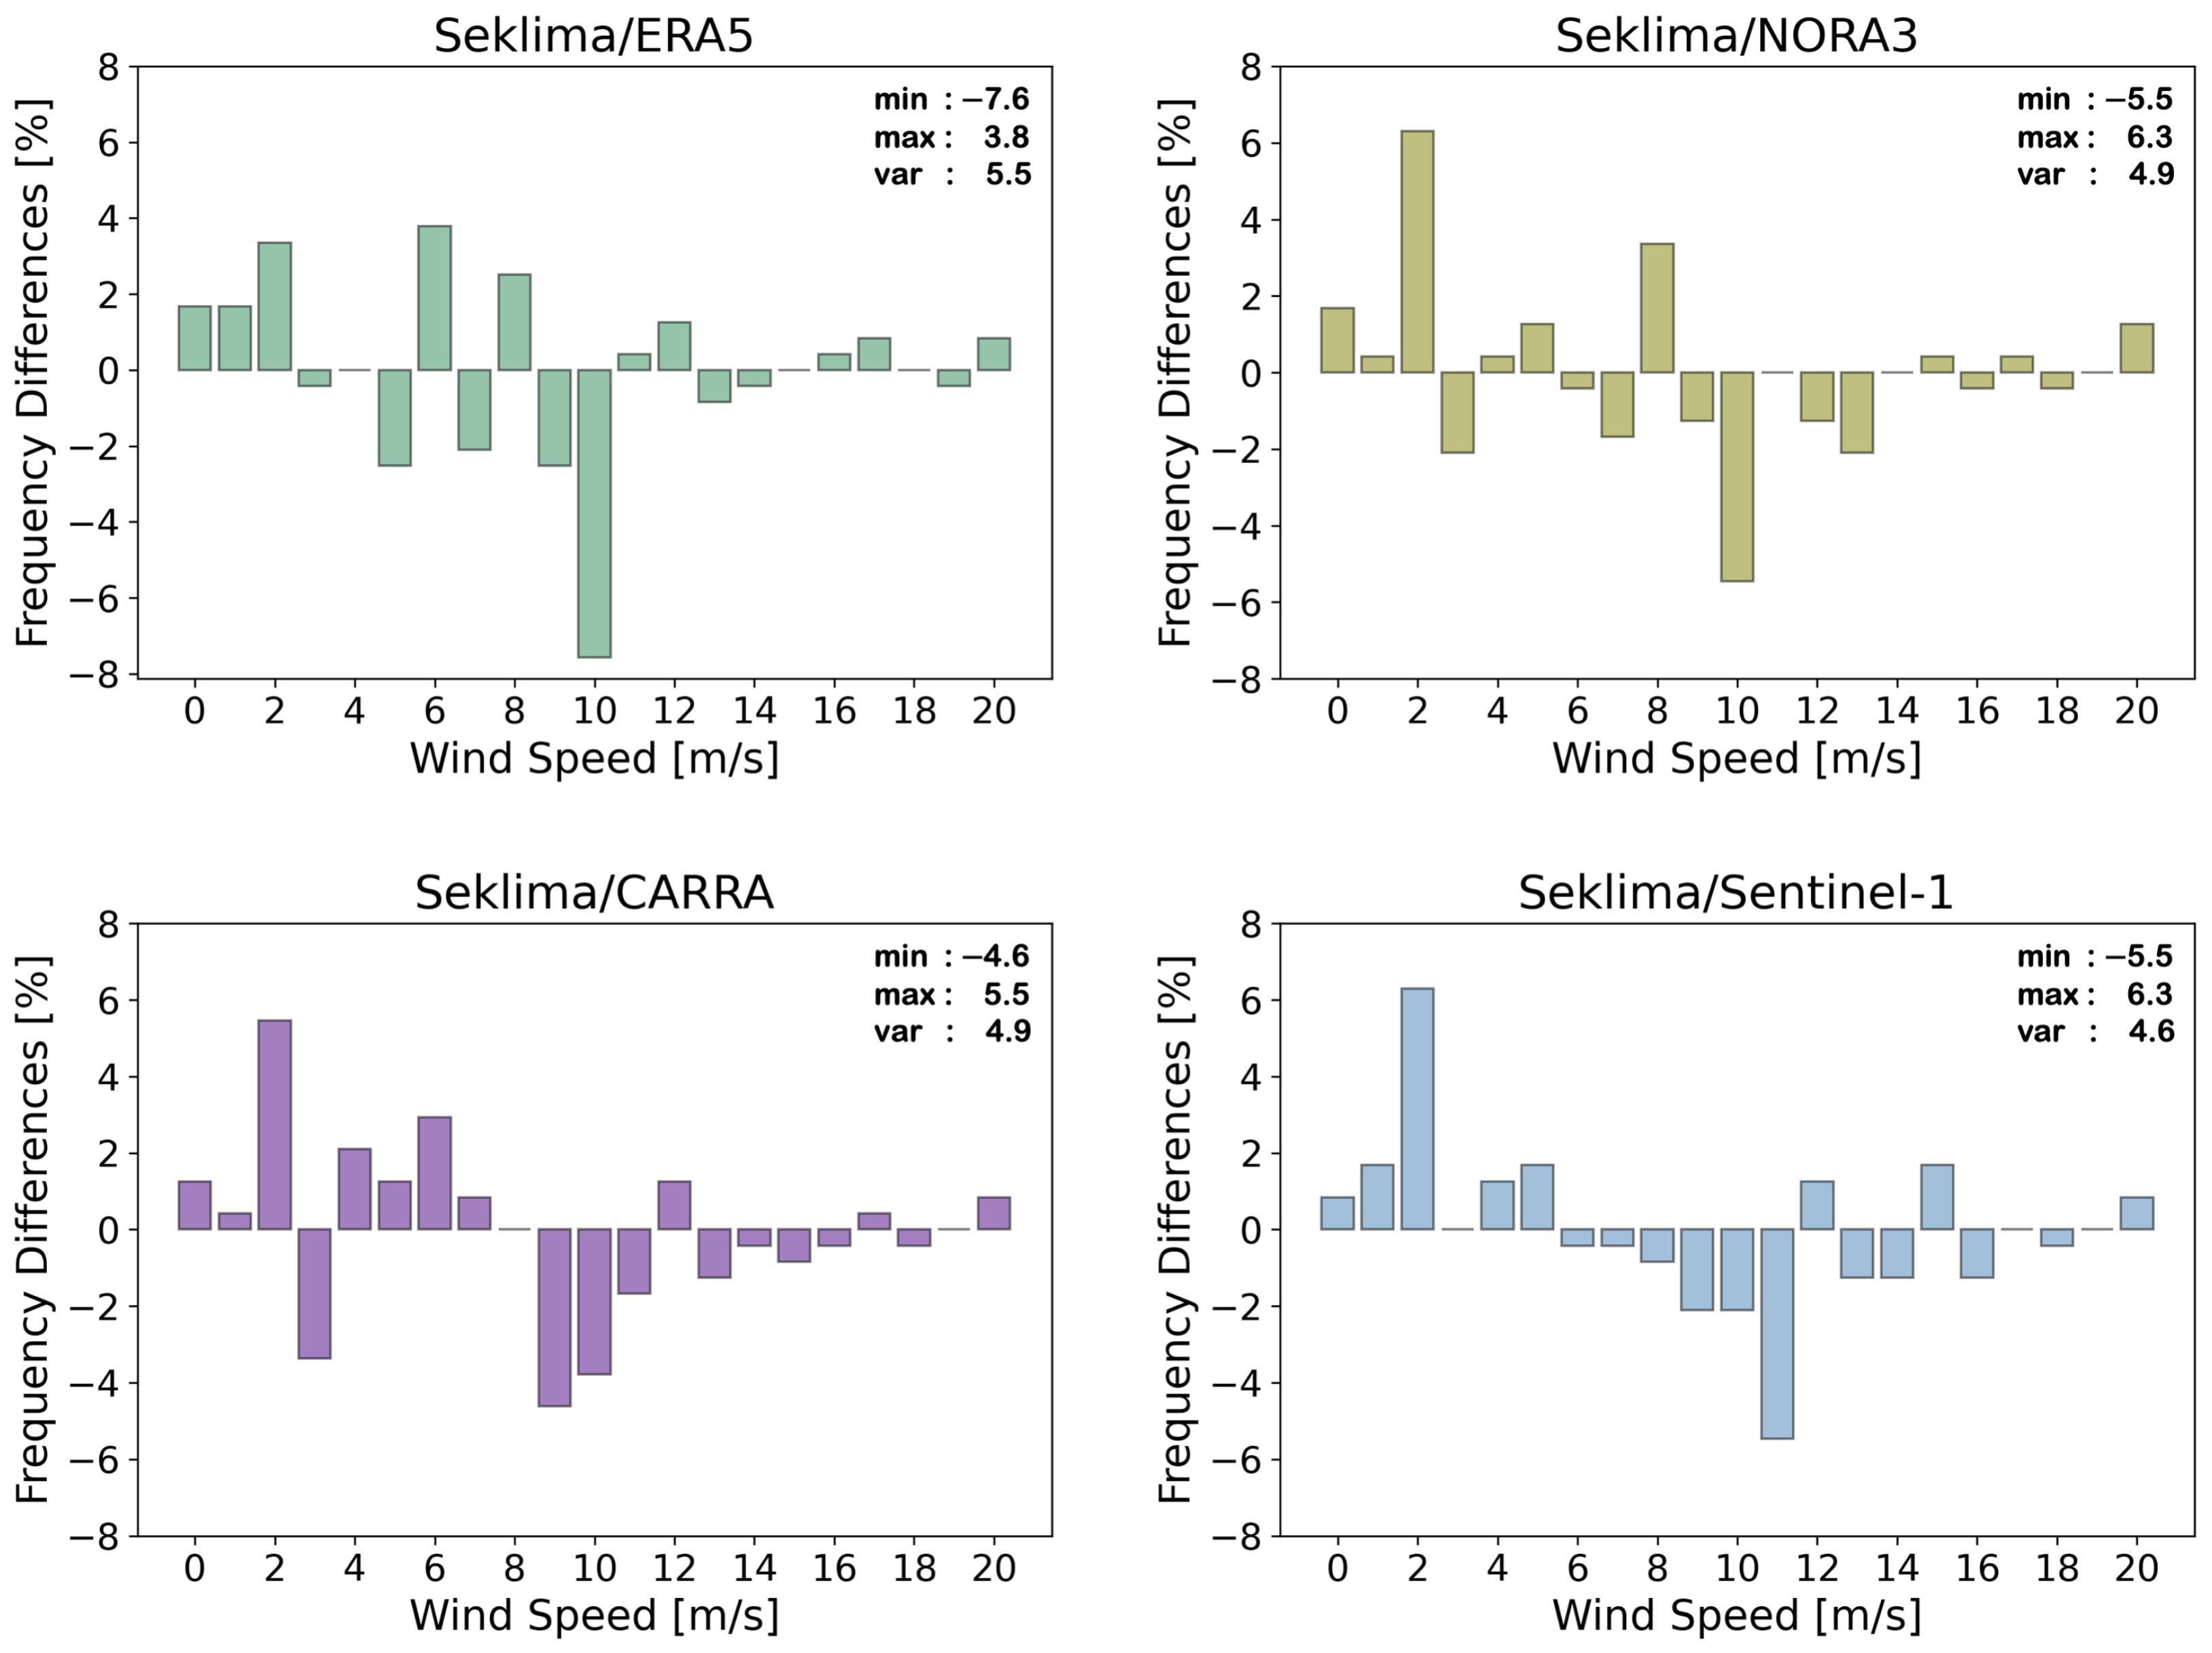
4.1.3. Wind Speed Occurrences
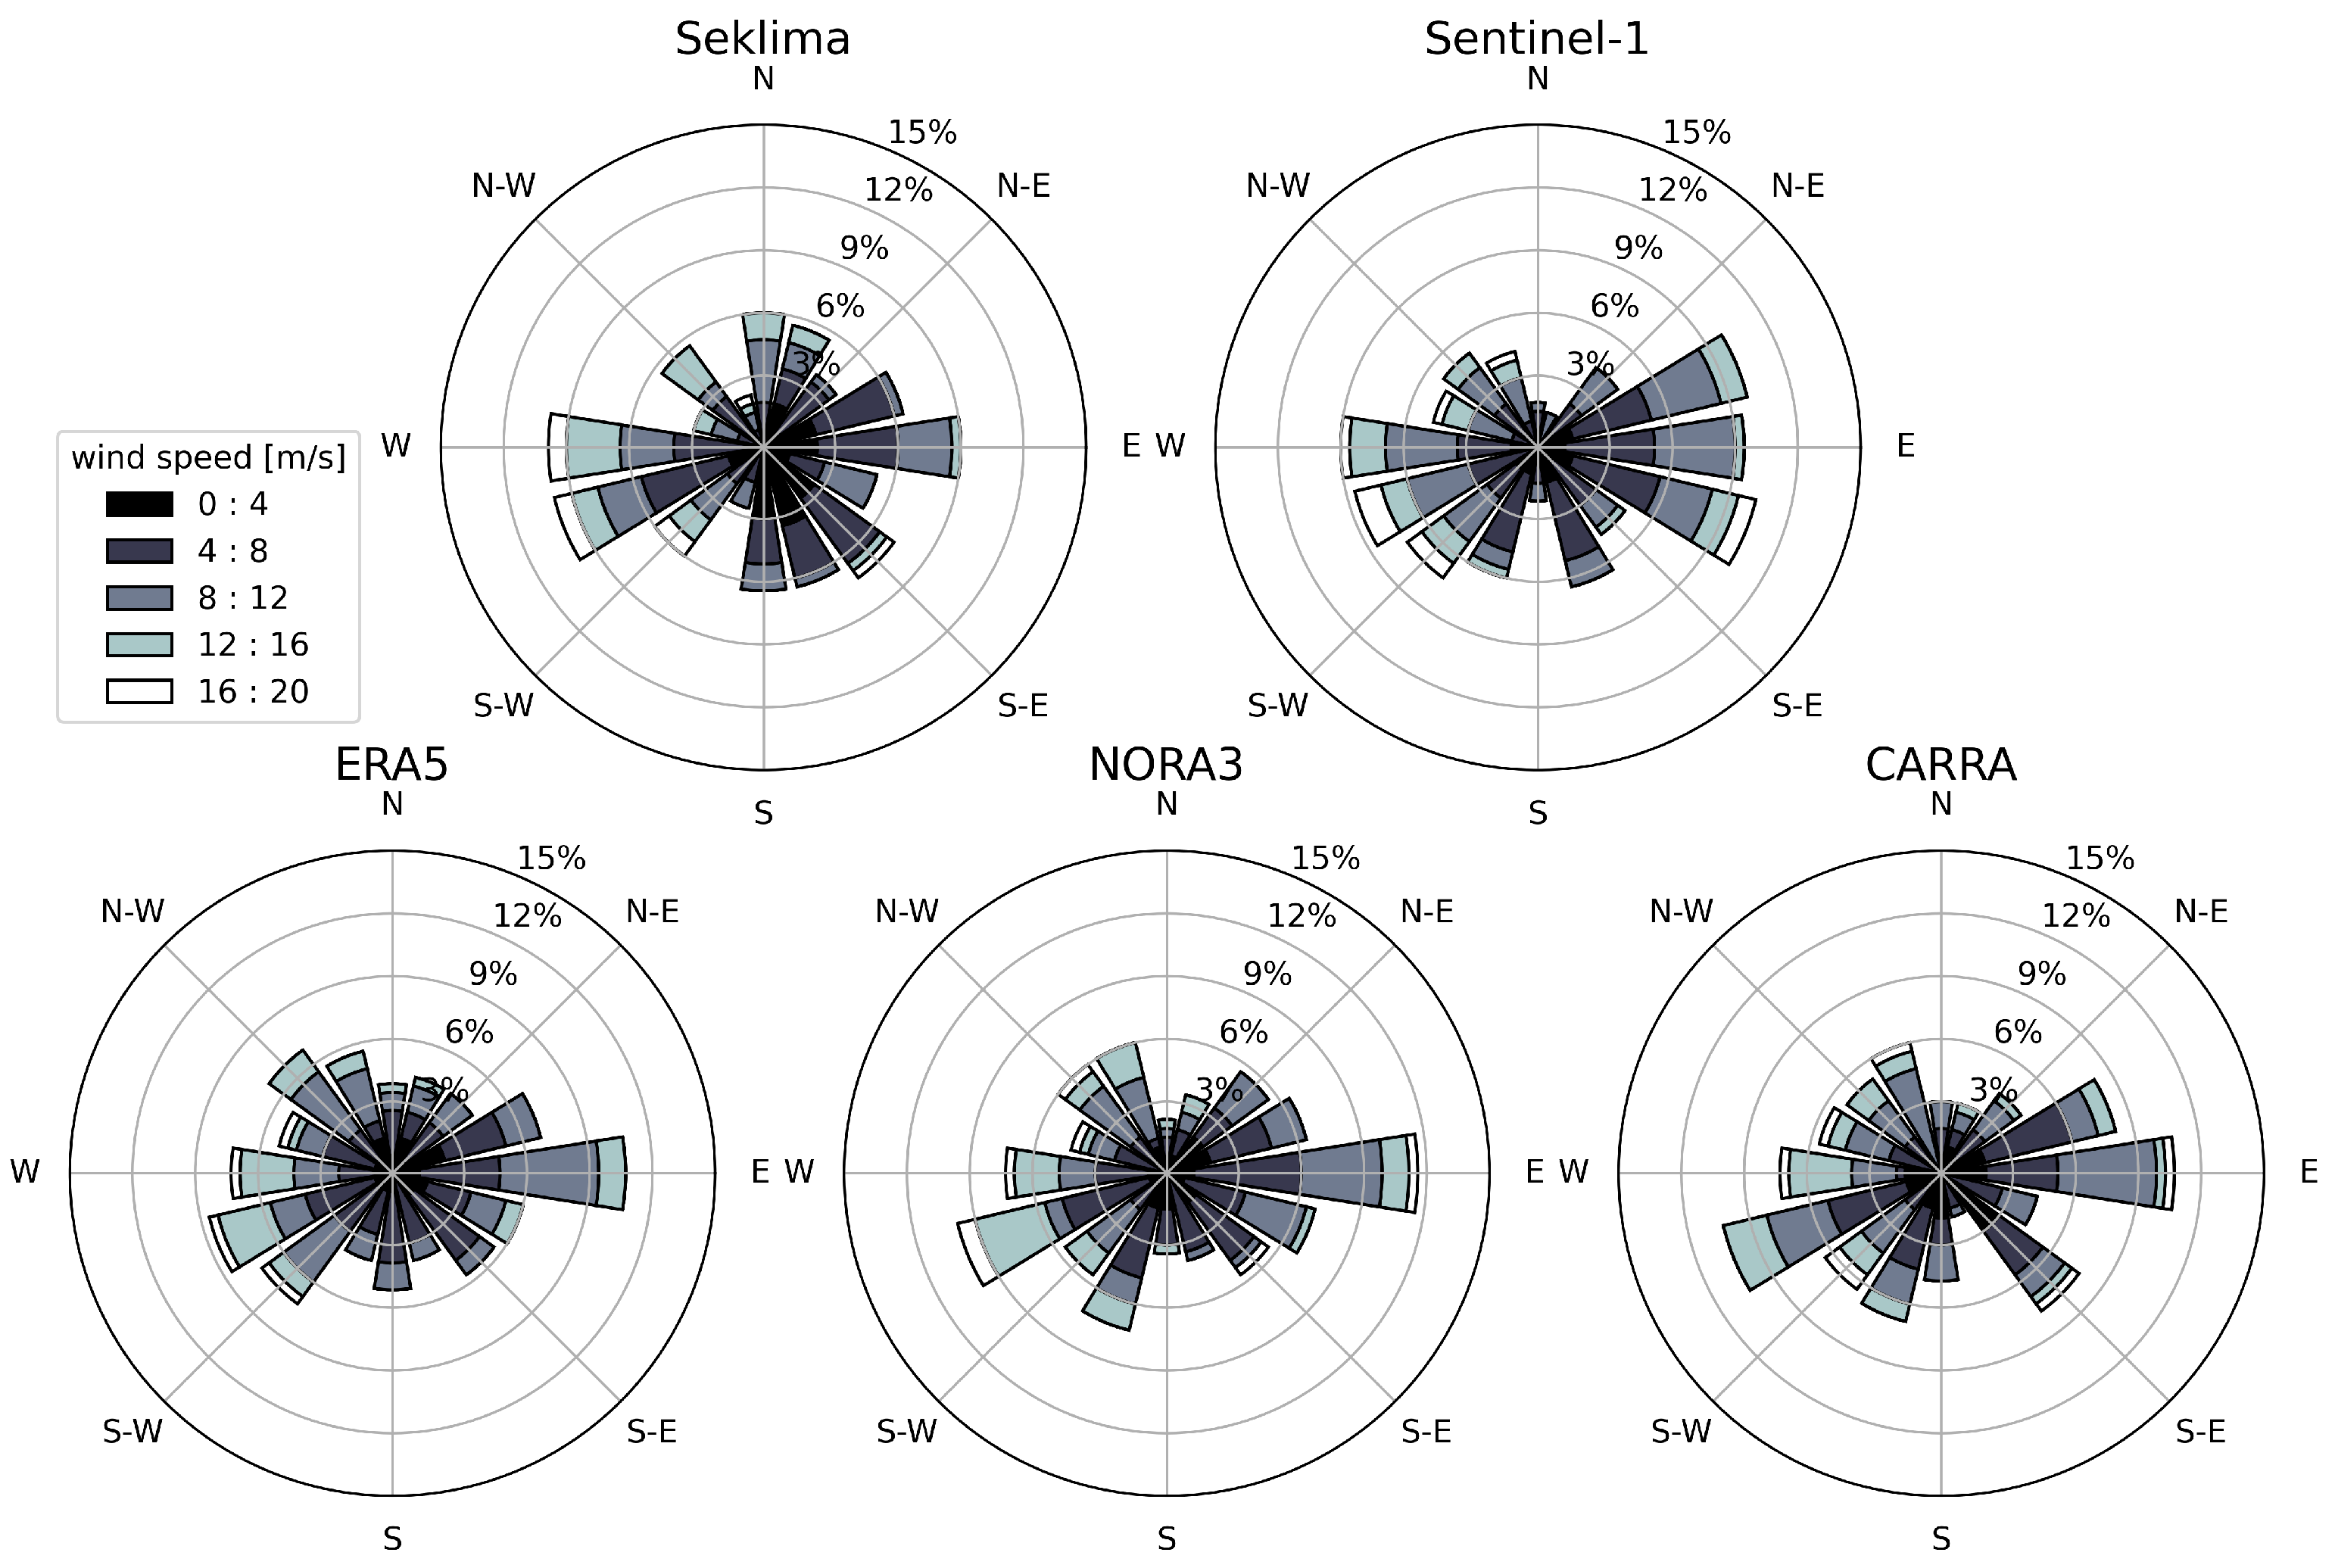
4.2. Wind Direction
4.3. Wind Speed Weibull Distribution Comparison
5. Conclusions
Author Contributions
Funding
Institutional Review Board Statement
Informed Consent Statement
Data Availability Statement
Conflicts of Interest
Abbreviations
| SAR | Synthetic Aperture Radar |
| OWI | Ocean Wind Field |
| NWP | Numerical Weather Prediction |
| ECMWF | European Centre for Medium-Range Weather Forecasts |
| SM | Stripmap Mode |
| EW | Extra-Wide Mode |
| WV | Wave Mode |
| IW | Interferometric-Wide Mode |
| NRCS | Normalized Radar Cross Section |
| RMSE | Root Mean Squared Error |
References
- International Energy Agency. World Energy Outlook 2019; International Energy Agency: Paris, France, 2019. [Google Scholar] [CrossRef]
- Gualtieri, G. Reliability of ERA5 Reanalysis Data for Wind Resource Assessment: A Comparison against Tall Towers. Energies 2021, 14, 4169. [Google Scholar] [CrossRef]
- Dörenkämper, M.; Olsen, B.T.; Witha, B.; Hahmann, A.N.; Davis, N.N.; Barcons, J.; Ezber, Y.; García-Bustamante, E.; González-Rouco, J.F.; Navarro, J.; et al. The Making of the New European Wind Atlas—Part 2: Production and evaluation. Geosci. Model Dev. 2020, 13, 5079–5102. [Google Scholar] [CrossRef]
- Source Galileo. GoliatVIND. 2023. Available online: https://goliatvind.no (accessed on 17 October 2023).
- Haakenstad, H.; Breivik, Ø.; Furevik, B.R. NORA3: A Nonhydrostatic High-Resolution Hindcast of the North Sea, the Norwegian Sea, and the Barents Sea. Wind Energy Sci. 2021, 60, 1443–1464. [Google Scholar] [CrossRef]
- Moreno-Ibáñez, M.; Laprise, R.; Gachon, P. Recent advances in polar low research: Current knowledge, challenges and future perspectives. Tellus A Dyn. Meteorol. Oceanogr. 2021, 73, 1890412. [Google Scholar] [CrossRef]
- Køltzow, M.; Schyberg, H.; Støylen, E.; Yang, X. Value of the Copernicus Arctic Regional Reanalysis (CARRA) in representing near-surface temperature and wind speed in the north-east European Arctic. Polar Res. 2022, 41, 8002. [Google Scholar] [CrossRef]
- de Montera, L.; Remmers, T.; O’Connell, R.; Desmond, C. Validation of Sentinel-1 offshore winds and average wind power estimation around Ireland. Wind Energy Sci. 2020, 5, 1023–1036. [Google Scholar] [CrossRef]
- Sandven, S.; Johannessen, O.M.; Kloster, K. Sea Ice Monitoring by Remote Sensing. Encycl. Anal. Chem. 2006, 1993, 1–43. [Google Scholar] [CrossRef]
- Tollinger, M.; Graversen, R.; Johnsen, H. High-Resolution Polar Low Winds Obtained from Unsupervised SAR Wind Retrieval. Remote Sens. 2021, 13, 4655. [Google Scholar] [CrossRef]
- ESA. Level 2 OCN Ocean Wind Field Component. Available online: https://sentinels.copernicus.eu/web/sentinel/ocean-wind-field-component (accessed on 31 August 2023).
- Barthelmie, R.J.; Pryor, S.C. Can Satellite Sampling of Offshore Wind Speeds Realistically Represent Wind Speed Distributions? J. Appl. Meteorol. 2003, 42, 83–94. [Google Scholar] [CrossRef]
- Hadjipetrou, S.; Liodakis, S.; Sykioti, A.; Katikas, L.; Park, N.W.; Kalogirou, S.; Akylas, E.; Kyriakidis, P. Evaluating the suitability of Sentinel-1 SAR data for offshore wind resource assessment around Cyprus. Renew. Energy 2022, 182, 1228–1239. [Google Scholar] [CrossRef]
- Caligiuri, C.; Stendardi, L.; Renzi, M. The use of Sentinel-1 OCN products for preliminary deep offshore wind energy potential estimation: A case study on Ionian sea. Eng. Sci. Technol. Int. J. 2022, 35, 101117. [Google Scholar] [CrossRef]
- Seklima. Norsk Klima Service Senter. Available online: https://seklima.met.no/ (accessed on 6 September 2023).
- Olsen, A.M.; Øiestad, M.; Berge, E.; Køltzow, M.Ø.; Valkonen, T. Evaluation of Marine Wind Profiles in the North Sea and Norwegian Sea Based on Measurements and Satellite-Derived Wind Products. Tellus A Dyn. Meteorol. Oceanogr. 2022, 74, 1–16. [Google Scholar] [CrossRef]
- Hersbach, H.; Bell, B.; Berrisford, P.; Hirahara, S.; Horányi, A.; Muñoz-Sabater, J.; Nicolas, J.; Peubey, C.; Radu, R.; Schepers, D.; et al. The ERA5 global reanalysis. Q. J. R. Meteorol. Soc. 2020, 146, 1999–2049. [Google Scholar] [CrossRef]
- ECMWF. ERA5 Hourly Data on Single Levels from 1940 to Present. Available online: https://cds.climate.copernicus.eu/cdsapp#!/dataset/reanalysis-era5-single-levels?tab=form (accessed on 6 September 2023).
- Solbrekke, I.M.; Sorteberg, A.; Haakenstad, H. The 3 km Norwegian reanalysis (NORA3)—A validation of offshore wind resources in the North Sea and the Norwegian Sea. Wind Energy Sci. 2021, 6, 1501–1519. [Google Scholar] [CrossRef]
- MET.NO. NORA3. Available online: https://marine.met.no/node/19 (accessed on 18 September 2023).
- ECMWF. Copernicus Arctic Regional Reanalysis. Available online: https://climate.copernicus.eu/copernicus-arctic-regional-reanalysis-service (accessed on 6 September 2023).
- Theodoridis, S.; Koutroumbas, K. Pattern Recognition, 4th ed.; Academic Press, Inc.: Orlando, FL, USA, 2008. [Google Scholar]
- Pavia, E.; O’Brien, J. Weibull Statistics of Wind Speed over the Ocean. J. Appl. Meteorol. 1986, 25, 1324–1332. [Google Scholar] [CrossRef]
- Pryor, S.C.; Nielsen, M.; Barthelmie, R.J.; Mann, J. Can Satellite Sampling of Offshore Wind Speeds Realistically Represent Wind Speed Distributions? Part II: Quantifying Uncertainties Associated with Distribution Fitting Methods. J. Appl. Meteorol. 2004, 43, 739–750. [Google Scholar] [CrossRef]
- Cook, N.J. The Deaves and Harris ABL model applied to heterogeneous terrain. J. Wind Eng. Ind. Aerodyn. 1997, 66, 197–214. [Google Scholar] [CrossRef]


| Dataset | Type | Resolution | |
|---|---|---|---|
| Temporal | Spatial | ||
| Seklima | in situ observation | every 20 min | singular point |
| ERA5 | Global reanalysis | hourly | 31 km |
| NORA3 | Regional reanalysis | hourly | 3 km |
| CARRA | Regional reanalysis | every 3 h | 2.5 km |
| Sentinel-1 | SAR-based | once in 1–2 days | 1 km |
| Dataset | RMSE [m/s] | Correlation Coeff. | Std. Deviation [m/s] |
|---|---|---|---|
| Seklima | - | - | 4.19 |
| ERA5 | 1.65 | 0.92 | 3.82 |
| NORA3 | 1.80 | 0.90 | 3.98 |
| CARRA | 2.05 | 0.88 | 4.03 |
| Sentinel-1 | 2.00 | 0.88 | 3.95 |
| Variables | Seklima | ERA5 | NORA3 | CARRA | Sentinel-1 |
|---|---|---|---|---|---|
| Seklima | 1 | 0.92 | 0.90 | 0.88 | 0.88 |
| ERA5 | 1 | 0.98 | 0.93 | 0.91 | |
| NORA3 | 1 | 0.94 | 0.91 | ||
| CARRA | 1 | 0.88 | |||
| Sentinel-1 | 1 |
| Dataset | Weibull Parameters | ||
|---|---|---|---|
| Seklima | dense | 1.85 | 8.01 |
| sparse | 1.70 | 7.83 | |
| ERA5 | dense | 2.21 | 8.90 |
| sparse | 2.23 | 9.08 | |
| NORA3 | dense | 2.14 | 9.22 |
| sparse | 2.17 | 9.23 | |
| CARRA | dense | 2.22 | 9.43 |
| sparse | 2.26 | 9.67 | |
| Sentinel-1 | (sparse) | 2.33 | 9.79 |
Disclaimer/Publisher’s Note: The statements, opinions and data contained in all publications are solely those of the individual author(s) and contributor(s) and not of MDPI and/or the editor(s). MDPI and/or the editor(s) disclaim responsibility for any injury to people or property resulting from any ideas, methods, instructions or products referred to in the content. |
© 2024 by the authors. Licensee MDPI, Basel, Switzerland. This article is an open access article distributed under the terms and conditions of the Creative Commons Attribution (CC BY) license (https://creativecommons.org/licenses/by/4.0/).
Share and Cite
Khachatrian, E.; Asemann, P.; Zhou, L.; Birkelund, Y.; Esau, I.; Ricaud, B. Exploring the Potential of Sentinel-1 Ocean Wind Field Product for Near-Surface Offshore Wind Assessment in the Norwegian Arctic. Atmosphere 2024, 15, 146. https://doi.org/10.3390/atmos15020146
Khachatrian E, Asemann P, Zhou L, Birkelund Y, Esau I, Ricaud B. Exploring the Potential of Sentinel-1 Ocean Wind Field Product for Near-Surface Offshore Wind Assessment in the Norwegian Arctic. Atmosphere. 2024; 15(2):146. https://doi.org/10.3390/atmos15020146
Chicago/Turabian StyleKhachatrian, Eduard, Patricia Asemann, Lihong Zhou, Yngve Birkelund, Igor Esau, and Benjamin Ricaud. 2024. "Exploring the Potential of Sentinel-1 Ocean Wind Field Product for Near-Surface Offshore Wind Assessment in the Norwegian Arctic" Atmosphere 15, no. 2: 146. https://doi.org/10.3390/atmos15020146