
Air Quality Mapping in Bandung City
by
 , , , and
Resa Septiani Pontoh
*,
Leivina Saliaputri
,
Audrey Nayla Nashwa
,
Nadhira Khairina
,
Bertho Tantular
,
Toni Toharudin
and
Farhat Gumelar

Department of Statistics, Faculty of Mathematics and Natural Sciences, Universitas Padjadjaran, Sumedang 45363, Indonesia
*
Author to whom correspondence should be addressed.
Atmosphere 2023, 14(9), 1444; https://doi.org/10.3390/atmos14091444
Submission received: 7 August 2023
/
Revised: 8 September 2023
/
Accepted: 14 September 2023
/
Published: 16 September 2023
(This article belongs to the Section Air Quality)
Abstract
:One of the most commonly encountered issues in large cities is air pollution. As a major city, Bandung also experiences the same problem. This issue arises due to the increasing levels of human activity. This contributes to elevated levels of pollutants in the atmosphere, which can impact human life and ecosystems. This research is intended to map the regions in Bandung based on their air quality. This study used ambient air quality measurement results from Bandung, which included PM10, PM2.5, dust, SO2, CO, and NO2. This ambient air quality measurement was conducted by the Department of Environment and Hygiene in Bandung. The research methodology utilized in this study was multidimensional scaling analysis. The outcomes of the examination carried out utilizing the multidimensional scaling technique reveal a clustering of regions in Bandung, West Java, based on their air quality. According to the research findings, the locations were grouped into four quadrants, each with different air quality characteristics. Some locations showed high similarity, while others did not exhibit similarity with other groups. These findings can be used for policy-making and improving air quality in Bandung. Conclusions were drawn from the formed groups, where each group had high similarity among its members, but differed from the members of other groups. Among all observed locations in Bandung City, there were areas that were most similar when viewed based on the distance between objects, namely Punclut St. and KPAD Sarijadi; Soekarno Hatta St. (in front of Astra Bizz) and Elang St.; and Buah Batu St. (in front of STSI/ISBI) and Bunderan Cibiru.
1. Introduction
Air quality needs to be considered because it greatly influences public health and environmental comfort. Over time, air quality has deteriorated due to population growth, the development of industrial centers, and increases in the number of transportation activities in several regions of Indonesia [1]. As a result, there are difficulties in attaining clean air, despite its crucial importance for sustainable development and urban air quality management strategies [2,3,4]. The asynchronous urban air quality management policies have contributed to the lack of regional cooperation in addressing urban air quality issues. The issue arises due to the increasing demands and scope of human activities [5]. It has become a contributing factor to higher levels of pollutants in the atmosphere, which could potentially affect both human life and ecosystems [6]. According to the Air Quality Life Index (AQLI), the average person in Indonesia may lose 1.2 years of life expectancy due to the current pollution levels, as the air quality fails to meet the World Health Organization (WHO) guidelines for fine Particulate Matter (PM2.5) concentrations [7].
Air pollution poses a significant challenge in major urban areas in Indonesia, such as the city of Bandung [8,9]. The dispersion of pollutants in Bandung City is greatly affected by local factors and monsoon phenomena. During dry months, pollutants tend to disperse toward the north and west, while during wet months, they tend to disperse toward the south and east. Additionally, the high wind speed during the dry months and the flat topography in the south lead to the dispersion of PM10 beyond the boundaries of Bandung City. On the other hand, during the wet months, the weakening of wind speed due to complex topography in the northern part of Bandung City causes PM10 to be less well-dispersed [10].
This research was conducted in the city of Bandung. According to the Air Quality Index (AQI) website, Bandung is ranked fourth among cities in Indonesia with the worst air quality, with an AQI value of 169 (unhealthy). Air pollution has caused approximately USD 240,000,000 in losses in Bandung City [11]. This research holds significant importance, as it contributes to a better understanding of air pollution in Bandung City and can serve as a foundation for taking necessary actions to mitigate its adverse impacts on public health and the environment. This research’s geographical position is specified in Figure 1.
Research conducted in 2020 explained that the concentration levels and movement of pollutants in Bandung City were influenced by various factors, such as meteorological conditions, topographic characteristics, and emission sources. Meteorological factors are among the main factors in the dynamics of pollutants in the atmosphere [12]. Several meteorological parameters, such as ambient temperature, air velocity and wind orientation, atmospheric steadiness, and blending altitude, which vary over time, are important factors in the process of pollutant distribution [13]. On the other hand, meteorological conditions in a particular area are influenced by several factors, one of which is topographical characteristics [14]. The city of Bandung is one of the urban areas in Indonesia that has unique topographical characteristics. This is because Bandung is surrounded by higher land and mountains, forming a basin. Such topographical conditions affect atmospheric circulation and the distribution of pollutants in Bandung [15].
The results of air quality monitoring are conveyed in the form of the Air Pollution Standard Index (ISPU). The ISPU is a unitless index that describes the ambient air quality conditions at specific locations based on their impacts on human health, aesthetic value, and other living organisms [16]. In 2020, the Ministry of Environment and Forestry (KLHK) issued Ministerial Regulation No. 14 of 2020 regarding the Air Pollution Standard Index (ISPU), which concerns the Calculation, Reporting, and Information of the Air Pollution Standard Index [17]. Under this regulation, the parameters included to calculate the ISPU values are Hydrocarbons (HC), Carbon Monoxide (CO), Sulfur Dioxide (SO2), Nitrogen Dioxide (NO2), Ozone (O3), and Particulate Matter (PM10 and PM2.5). Table 1 provides the conversion table for the ISPU parameter concentration levels.
According to the primary pollutant parameters, the ISPU values provide the foundation for categorizing air quality. In Table 2, the classification of air quality is provided.
The visible dust particles, which often contaminate surfaces, have sizes larger than 10 μm [18]. The size of these dust particles is too large to enter the human respiratory system. Meanwhile, Particulate Matter (PM) with a size of 10 μm or less, commonly known as PM10, is significantly smaller than a human hair strand. PM10 is usually found in construction areas, waste disposal sites, dust, and bacterial fragments. There is also PM2.5, which is even smaller and commonly found in emissions from gasoline, oil, fuel, and wood combustion [18]. Particles as small as PM2.5 and PM10 are the ones that pose a risk to the human respiratory system [19].
In 2020, the year when the COVID-19 pandemic began, the air pollution conditions in Bandung City improved, mainly due to the mobility restrictions imposed to prevent the spread of the virus. Despite the decrease, the concentration of PM2.5 in the air of Bandung City remained above the safe threshold, which is 88.16 micrograms per nanometer () [20]. Despite a reduction in air pollution levels during 2020 due to mobility restrictions imposed during the COVID-19 pandemic, air pollution remains a significant issue in Bandung City. The concentration levels of PM2.5, which still exceed the safe threshold at 88.16 micrograms per nanometer (), indicate that the improvements achieved have not yet met the expected safety standards. Therefore, this research aims to gain a deeper understanding of the patterns and factors influencing air quality in Bandung City during that period by using the multidimensional scaling (MDS) method to provide a more detailed overview of the distribution of air pollutants in the city.
This research begins with conducting a literature study [10] related to the condition of the city of Bandung, which includes geographical conditions, meteorology, and public activities. Environmental experts from ITB, Puji Lestari, conducted a survey in 2020 that revealed that there were five types of pollutants contaminating the air in Bandung City. These pollutants included Particulate Matter or dust (PM10), Carbon Monoxide (CO), Sulfur Dioxide (SO2), Nitrogen Dioxide (NO2), and Ozone (O3), with the majority of them originating from motor vehicle emissions. It was also explained that the high air pollution in Bandung City was exacerbated by industrial activities in the surrounding area. As a result, the levels of Particulate Matter (PM2.5 and PM10) in the city are very high.
Research examining atmospheric circulation in the city of Bandung was conducted in 2015. The results of the two studies prove that the complex topography of the Bandung basin has an impact on the circulation of valley and mountain breezes during the dry and wet seasons. One of these studies was conducted using SODAR (Sound Detection Ranging), while the other used AWS (Automatic Weather Station) observation data from several locations in the city of Bandung [21].
Research conducted in the Journal of Environmental Health addressing air pollution issues in 2014 also provided a Self-Organizing Map (SOM) method, which involved a combination of multidimensional scaling and k-means clustering approaches to create ambient air quality classifications that grouped days with similar multipollutant profiles. The research concluded that a self-organizing map was an attractive framework for developing ambient air quality classification, because the approach eased the interpretation of results by allowing users to visualize classifications on an organized map [22]. Consequently, the researchers were motivated to conduct a study using a similar method, specifically multidimensional scaling analysis, as employed in the prior research on ambient air quality measurement. This aimed to obtain results that facilitated the visualization of classifications for air quality mapping in the city of Bandung. By employing the MDS approach, we aim to elaborate on and map air pollution patterns in greater detail, elucidating the complexity of the local factors influencing pollutant dispersion in Bandung City. The findings of this research are expected to offer improved insights into addressing the serious issue of air pollution in Bandung City and guiding more efficient and sustainable mitigation efforts.
To address the serious issue of air pollution in Bandung City, this research employs Multidimensional Scaling (MDS) analysis to map air pollution levels across various city regions. The primary aim of this study is to identify air quality patterns in Bandung City, classify regions with similar pollutant profiles, and provide guidance for local authorities to take appropriate actions. The results of the MDS analysis are expected to aid in identifying air quality patterns in Bandung City and facilitate the implementation of similar measures in regions with similar pollutant patterns. This research is anticipated to offer better insights into addressing the severe air pollution problem in Bandung City and promote more efficient and sustainable mitigation efforts.
2. Materials and Methods
2.1. Data
This research was conducted in Bandung City. The study used secondary data that included particulate matter from each station in Bandung, which were obtained from the publication of the Government Agency Performance Report 2020 dataset from the DLHK Bandung website [23]. The measurements of the NO2 and SO2 levels were obtained from ambient air quality monitoring. Ambient air quality monitoring in Bandung City was conducted via two methods.
- Instantaneous ambient air quality measurement with a manual active sampler at the roadside location and some public places;
- Measurement of ambient air quality continuously with the Air Quality Tool Monitoring System (AQMS) in Gedebage, Ujungberung, Pajajaran, Dago, and Supratman St.
A manual active sampler is a device used to actively collect air samples by drawing air into the device. The collected air sample can then be taken and analyzed to determine the concentration of pollutants or other chemical substances present in the air. This sampling method is commonly used to monitor air quality in various locations, including roadsides, industrial areas, and urban areas. Manual active samplers allow for better control over the sampling process compared with passive methods, resulting in more accurate and reliable analysis results. The term “passive sampler” refers to a technique for evaluating ambient air quality utilizing a gas absorption system without a suction pump by diffusion through the media exposed for a specified period of time. In this case, the physical characteristics of gases that diffuse from high concentrations to low concentrations are used through the passive sampler approach. Due to its mobility, the manual active sampling method is suitable and beneficial for conducting surveys or monitoring in unique situations [24].
An Air Quality Monitoring Station (AQMS) is a system that measures metrological parameters, such as wind speed, wind direction, rainfall, radiation, temperature, and barometric pressure. An AQMS also integrates a series of ambient analyzers to continuously monitor the concentration of air pollutants (such as SO2, NO2, CO, O3, THC, PM, etc.) [25].
The available data for this study are confined to the 2020 air quality monitoring results for Bandung City, sourced from the Government Agency Performance Report, with details shown in Table 3. The parameters measured include PM10, PM2.5, dust, CO, and NO2 in micrograms per nanometer (μg/Nm) from 27 monitoring locations throughout Bandung City. The monitoring procedures entailed the utilization of instantaneous ambient air quality measurement, employing the manual active sampler method at roadside locations and various public spaces. The values in the data (Table 3) show the results of ambient air quality measurements using the manual active sampler method.
The Ministry of Environment and Forestry (KLHK) is committed to providing accurate and reliable information on air quality to the public in order to implement measures to control air pollution. This commitment is evident in the increasing number of continuous automatic monitoring stations owned by the KLHK, with a target of reaching 38 stations in 2020 [17].
Descriptive statistical analysis will be used to provide a general overview of the distribution of and variation in air quality data across different regions. Statistics, such as the mean, median, standard deviation, minimum, and maximum, will be calculated for each observed parameter.
Table 4 below shows the summary statistics of the temporary ambient air quality at the roadside location in Bandung, which was the object of this research. In Table 4, summary statistics are provided for each population parameter, including PM10, PM2.5, dust, SO2, CO, and NO2. Among other population parameters, CO had the highest average concentration, namely 5174.96 μg/Nm. In addition, CO was also the pollutant with the highest maximum value when compared with other pollutants, which was equal to 9542.00 μg/Nm. Furthermore, the standard deviations demonstrate that CO had the highest variability (2312.35 μg/Nm), suggesting greater fluctuations in its concentration levels, while SO2 had the lowest variability (7.27 μg/Nm), indicating more consistent readings over time. On the other hand, NO2 was the pollutant with the lowest minimum concentration (5.82 μg/Nm) when compared with other pollutants. Overall, the table provides a comprehensive overview of the air pollution levels in Bandung City, highlighting the variations and central tendencies for each parameter, which could be crucial for environmental monitoring and policymaking.
2.2. Multidimensional Scaling
Multidimensional Scaling (MDS) analysis was performed using R software to create a map of air quality. Multidimensional Scaling (MDS) describes a group of techniques for analyzing proximity data on a group of stimuli to uncover the hidden structure of the data. MDS serves multiple purposes, including data analysis, where objects are represented as points in a low-dimensional space to reduce complexity while retaining essential information. It is also utilized to understand the mental representation of stimuli and how similarity judgments are formed [26].
Multidimensional scaling is used to examine the interdependence or mutual dependence of relationships between variables or data. These relationships are not known through variable reduction or variable grouping, but rather by comparing the variables present in each respective object using a perceptual map. MDS has been applied in various studies. Perhaps the most typical form of MDS analysis that is most familiar to researchers is akin to factor analysis, in which the purpose is to identify the attributes or factors (dimensions) along which variables are perceived to vary and that account for the data. Dimensions that emerge from MDS can be incorporated into regression analysis to assess their relationship with other variables. Besides that, MDS can also be applied to profile analysis in cross-sectional studies. In such studies, behaviors are measured at a single time point, like scores on a vocational interest scale. The purpose of using distance measures in this analysis was to pinpoint dimensions that revealed within-person patterns essential to understanding the relationships among the variables [26].
On the other hand, in longitudinal studies, which extend cross-sectional studies and are relatively recent, the objective is to uncover growth, decay, or change patterns that account for associations over time or occasions based on distance measures. In these cases, the data involves a single variable measured at multiple time points. Interestingly, both of these MDS applications are more beneficial for research purposes compared with the traditional use of MDS, similar to factor analysis.
Compared with cluster analysis, MDS has several advantages, including providing outputs on air quality based on regions in Bandung City in the form of a perceptual map for easier interpretation of variable relationships, a deeper understanding of data characteristics, an unlimited number of clusters, and no requirement for assumption tests. Based on the data scale, MDS was categorized into two types: metric multidimensional scaling and non-metric multidimensional scaling. In this case, metric multidimensional scaling was used because the data obtained from the measurement of an object included data on an interval or ratio scale.
2.2.1. Metric Multidimensional Scaling
Due to the air quality data being quantitative, the analysis was conducted using metric multidimensional scaling. Metric multidimensional scaling, also known as classical multidimensional scaling, is a subtype of Multidimensional Scaling that embeds high-dimensional data into a lower-dimensional space by combining high-dimensional data into a lower-dimensional space by finding a few coordinates to preserve pairwise distances [27]. In multidimensional scaling, it does not matter whether the input data represent actual distances or not; the procedure only aims to arrange the geometric form of object points as closely as possible to the given input distances [27].
2.2.2. Calculate Euclidean Distance
In multidimensional scaling, we start with the distances between each pair of items. We aim to represent n items in a low-dimensional coordinate system, where the distances between items closely match the original distances , that is,
The final distances are usually Euclidean. The original distances may be actual measured distances between observations. The Minkowski distance metric provides a general way to specify distance in a multidimensional space [28]:
where n is the number of dimensions and is the value of dimension k for stimulus i. The Euclidean distance is often used due to its mathematical convenience in MDS procedures.
2.2.3. Multidimensional Scaling Analysis
After finding the Euclidean distance, we need to calculate the eigenvectors and eigenvalues in order to obtain the coordinate points. The eigenvalues are helpful for determining the number of dimensions that are necessary to accurately represent the dissimilarity matrix. Similar to factor analysis, the goal is to select enough dimensions to approximate the data while keeping the interpretation simple. The eigenvalue report allows you to quickly assess the impact of each new dimension [29].
2.2.4. Multidimensional Scaling Plot
The outputs of multidimensional scaling consist of a spatial representation of data that displays the underlying relationships on a two-dimensional or three-dimensional map. The MDS map helps to visualize relationships more clearly by using the ratio of distances on the map to corresponding data values, such as a map of a country with cities. The magnitude of the number indicates how similar or dissimilar two objects are [30]. MDS plots potentially intricate datasets to the essential dimensions where the items exhibit differences. Additionally, they enable a visual understanding of the existing relationships. Furthermore, by evaluating the distance between items on the map, one can quantitatively measure their perceived similarity compared with other items in the given space [31].
3. Results
3.1. Calculate Euclidean Distance
The data on ambient air quality at roadside locations in Bandung City in 2020 consist of six variables with metric numeric values in the same unit (μg/Nm). Euclidean distances were calculated using the dist() function. The resulting output was a 27 × 27 Euclidean distance matrix.
Based on the 27 × 27 Euclidean distance matrix output, it could be concluded that the distance value between object 1 (BKR St.) and object 2 (Tegalega St.) was 1151.630858, the distance between object 1 (BKR St.) and object 3 (Bunderan Cibiru) was 4580.303918, and so on, indicating the distances between the locations. The output also showed empty columns and rows, which indicated the distance of a location from itself. A multidimensional scaling technique will be used to represent the distances between observed objects in a two-dimensional map for easier interpretation.
3.2. Classical Multidimensional Scaling
Multidimensional scaling analysis, also known as classical multidimensional scaling, was conducted on metric data. The obtained Euclidean distances were then used to perform multidimensional scaling, which essentially transforms the distances into multiple dimensions. In this case, two-dimensional coordinates were formed. The results can be seen in Table 5.
The table above presents the coordinates of each object needed to plot 27 locations in the city of Bandung in a two-dimensional plot. Each row represents one data point with coordinates (x, y). For example, the point “BKR St.” has the coordinates (−1739.1475, −65.3891059) in the first and second dimensions. Additionally, the output also provides eigenvalues. A higher eigenvalue indicates that the corresponding dimension contributes more to capturing the differences between data points. In the classical metric multidimensional scaling computation using the cmdscale() function in R, we obtained the goodness of fit value (0.9999132), which was close to 1 and indicated a high level of agreement. In interpreting the results, the application of Multidimensional Scaling (MDS) involves the processing of data gathered from diverse locations through a sophisticated algorithm. We can observe the relative positions of the data points in two-dimensional space. Data points that are closer to each other indicate similarity in characteristics or proximity in distance. Moreover, multidimensional scaling analysis can help to visualize patterns or relationships between the variables used, namely PM10, PM2.5, dust, SO2, CO, and NO2 in the context of the ambient air quality in the city of Bandung.
3.3. Plot of Metric Multidimensional Scaling
The two-dimensional metric multidimensional scaling plot is displayed in Figure 2.
The graph in Figure 2 shows the positions of 27 locations in Bandung based on the ambient air quality in the year 2020. The graph is presented in two dimensions (X and Y axes). The information obtained from the graph was obtained by taking the point (0,0) as the central coordinate point and drawing straight lines, dividing the graph into four quadrants. The vertical distance between points on the Y axis reflects the difference in air quality between these locations in the dimension represented by the Y axis. The horizontal distance between points on the X axis reflects the difference in air quality between these locations. The larger the horizontal distance between two points, the greater the difference in air quality between these locations in the dimension represented by the X axis.
Subsequently, MDS enables a better explanation and understanding of complex and diverse air quality data, identifies influencing factors, reduces dimensions, simplifies data by projecting it into a two-dimensional space, and allows for the visual mapping of air quality in a more easily comprehensible form.
In this mapping process, we observed that locations with similar levels of air pollution tended to cluster together in the visual representation, as seen in the group highlighted within the blue circle in Figure 2, while those with significant differences in ambient air quality were positioned farther apart, as illustrated in the red circle in Figure 2. The similarity was assessed based on the distances across seven aspects of ambient air quality observed in various locations in Bandung. Consequently, the government and relevant institutions can utilize the MDS Air Quality Mapping to devise and formulate more targeted environmental policies specifically tailored to areas sharing comparable air quality issues with serious pollution concerns. Based on the quadrants in the graph, the following categorizations of the locations were obtained:
- -
- Quadrant I (top right): consisted of four locations, namely Bandung City Hall, Diponegoro St., Pajajaran St., and Margahayu Raya St., which were considered to have similar characteristics in ambient air quality as they were located in the same quadrant. The location with the worst air quality in Quadrant I was located at Bandung City Hall;
- -
- Quadrant II (top left): consisted of eight locations, namely Suci St., Siliwangi St., Tegalega St., Ciganitri St., Arcamanik St., Punclut St., KPAD Sarijadi, and Buah Batu St. (non-CFD). These eight locations had similar characteristics in terms of ambient air quality as they were located in the same quadrant. The highest average attribute in ambient air quality among the locations in Quadrant II was the most influential pollutant, which was CO;
- -
- Quadrant III (bottom left): consisted of six locations, namely Soekarno Hatta St. (in front of Arla Graha), Ahmad Yani St., Pasir Impun Housing Complex, Rumah Sakit St., BKR St., and Bandung City Square. All six locations shared similar characteristics in ambient air quality as they were located in the same quadrant. Quadrant III, which represented low ambient air quality, indicated relatively cleaner locations with lower levels of air pollution;
- -
- Quadrant IV (bottom right): consisted of nine locations, namely Soekarno Hatta St. (in front of Astra Bizz), Elang St., Dago St., Leuwi Panjang Bus Station, St., Buah Batu St. (in front of STSI/ISBI), Bunderan Cibiru, Ledeng Bus Station, Cicaheum Bus Station, and Pasteur St. These nine locations shared similar characteristics in ambient air quality, as they were located in the same quadrant. The highest average attribute in ambient air quality in Quadrant IV was CO, while the lowest was SO2. Quadrant IV had the highest overall average ambient air quality compared with other quadrants, indicating that locations in Quadrant IV represented areas with poor air quality.
After conducting the analysis, conclusions were drawn from the formed groups, where each group exhibited high similarity among its members but differed from members in other groups. It was possible that locations in different groups had a high degree of similarity due to the proximity of object points. Among all the observed locations in Bandung, there were certain areas that were most similar when considering the distances between objects. These areas were:
- -
- Punclut St. and KPAD Sarijadi were similar based on the ambient air quality in 2020; hence, they belonged to the same group;
- -
- Soekarno Hatta St. (in front of Astra Bizz) and Elang St. were similar based on the Ambient Air Quality in 2020; hence, they belonged to the same group;
- -
- Buah Batu St. (in front of STSI/ISBI) and Bunderan Cibiru were similar based on the Ambient Air Quality in 2020; hence, they belonged to the same group.
Meanwhile, the Pasir Impun Housing Complex and Bandung City Hall did not exhibit similarities with other locations in terms of ambient air quality. As a result, the Pasir Impun Housing Complex and Bandung City Hall should not be grouped together with other locations in Bandung based on the ambient air quality in 2020.
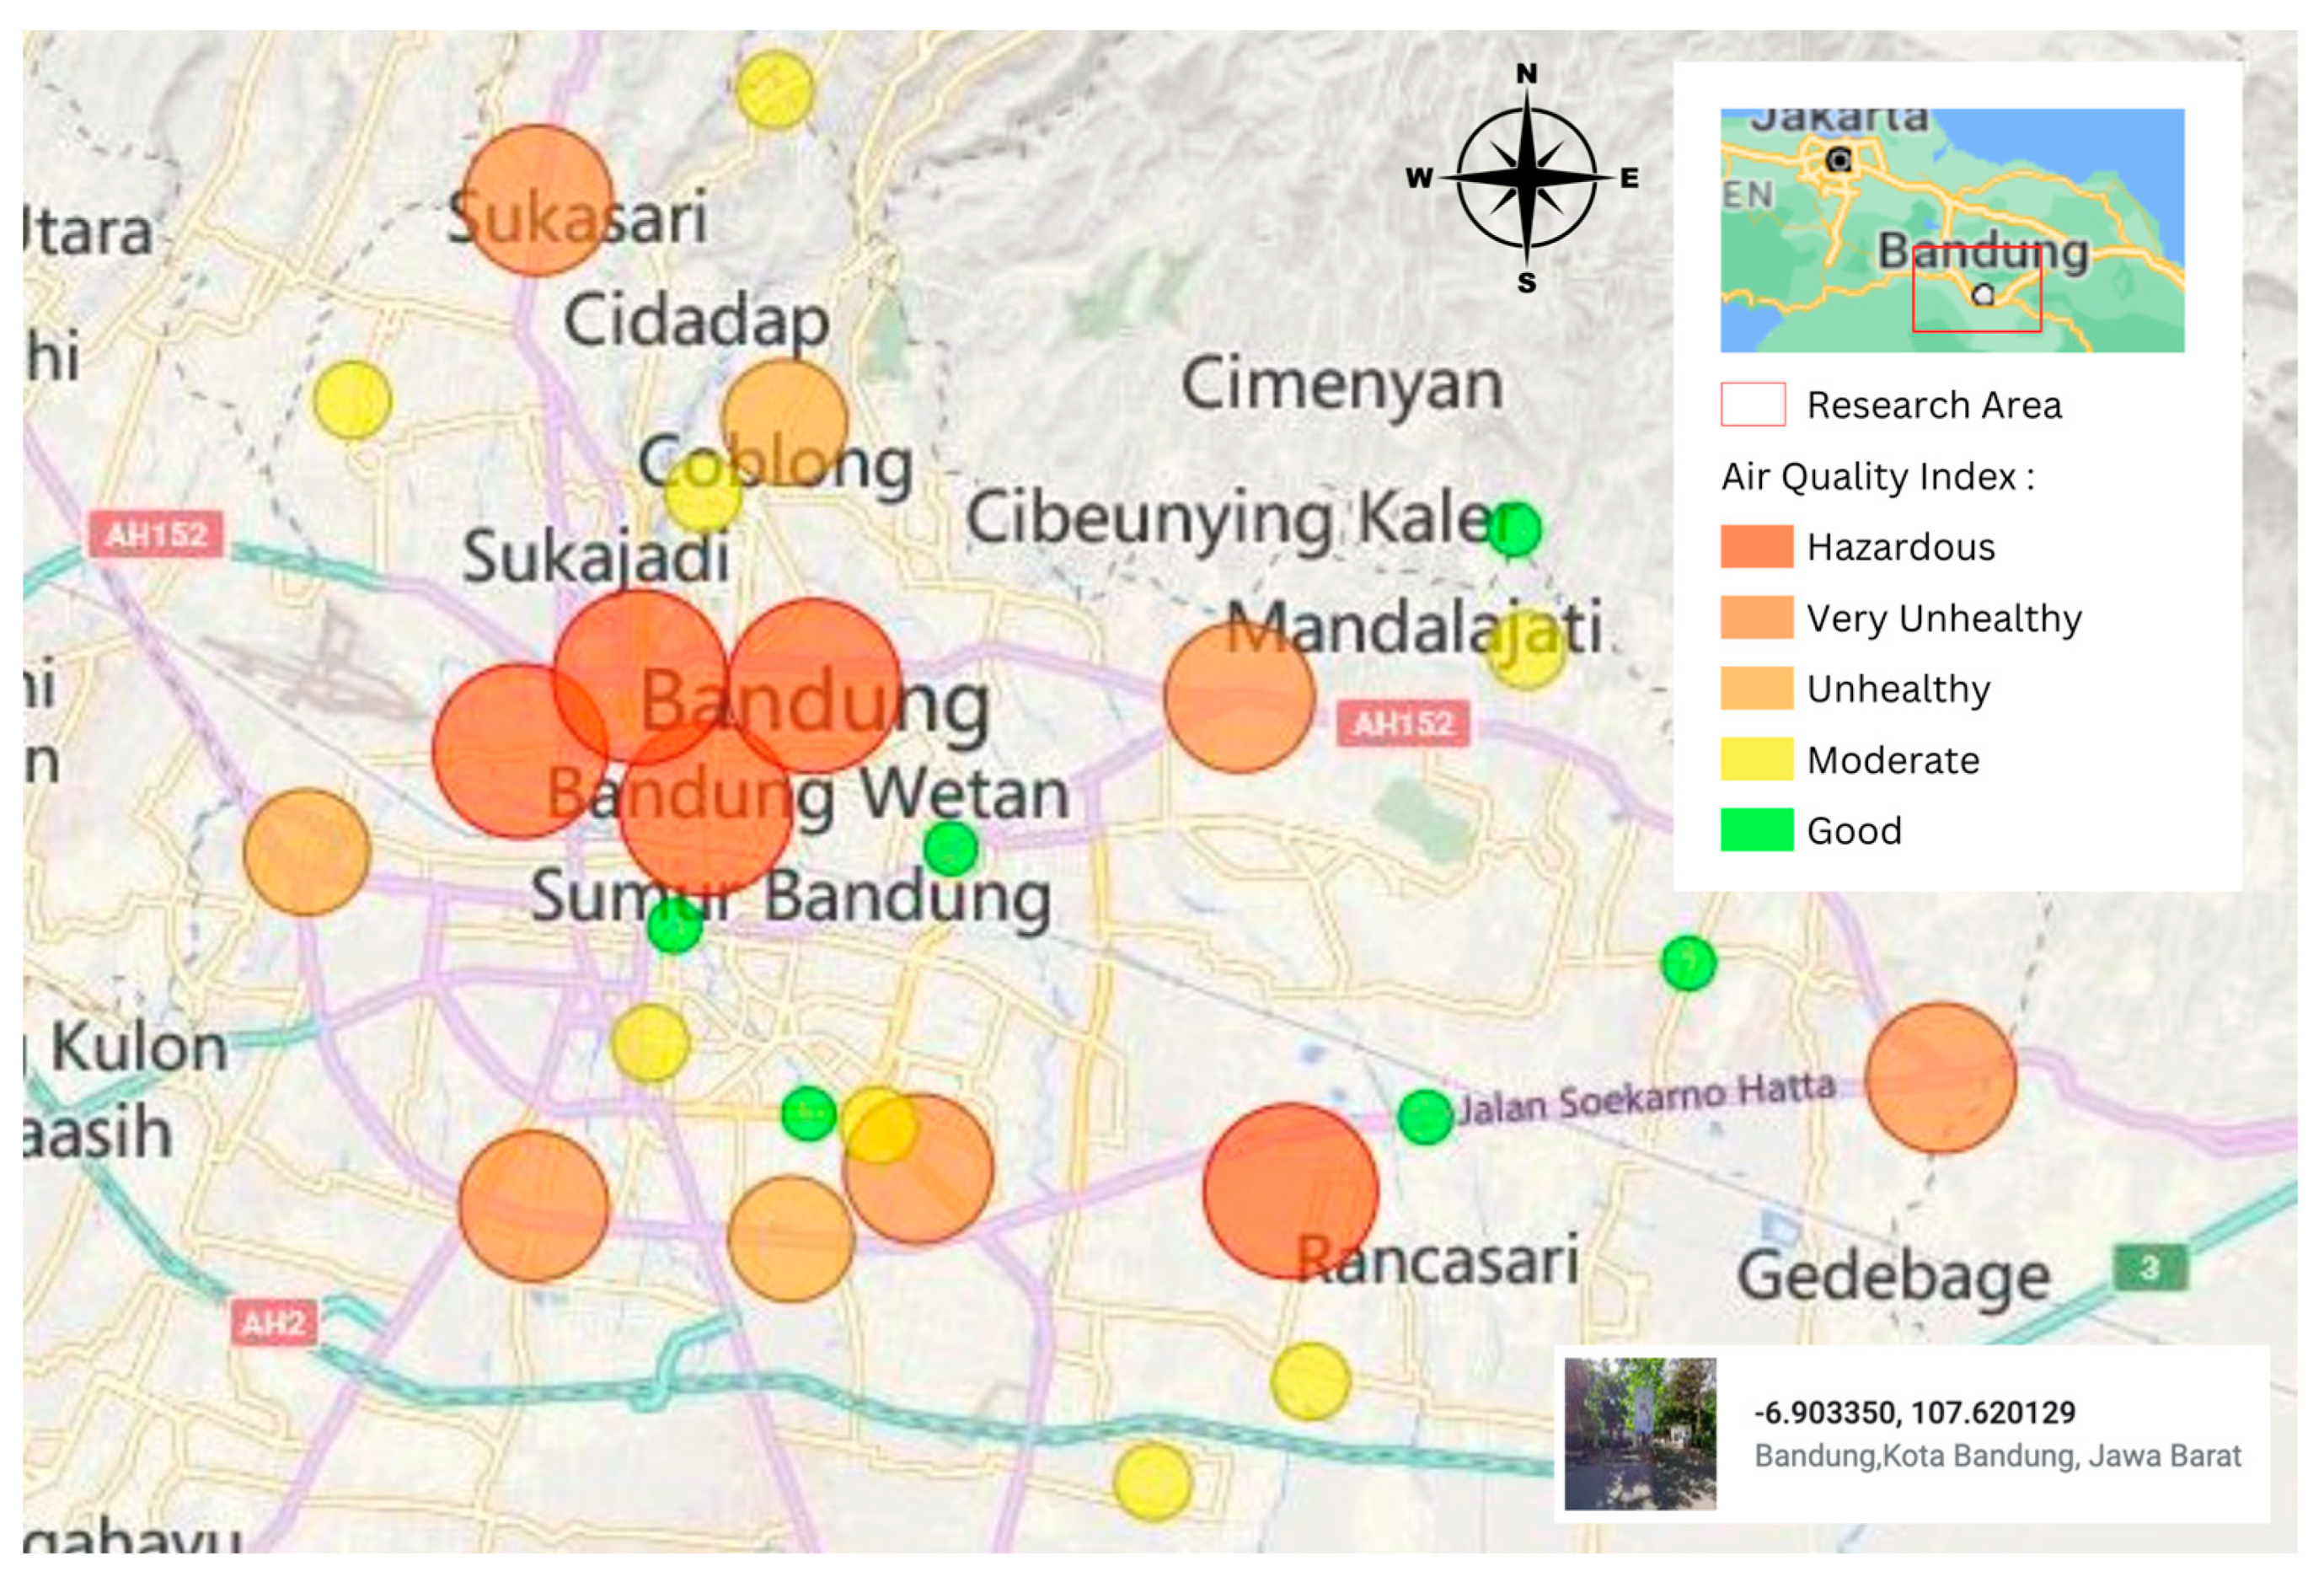
Based on the output of the two-dimensional metric multidimensional scaling plot, conclusions can be drawn from each quadrant generated to determine the mapping of regions in Bandung City based on their air quality levels. The mapping results for regions in Bandung City can be seen in Figure 3.
The results of region mapping in Bandung City based on air quality can be seen in Figure 3. Regions with green indicators indicate good air quality; yellow indicators indicate moderate air quality; orange indicators indicate unhealthy air quality; red indicators indicate very unhealthy air quality; and regions with brick-red indicators indicate hazardous air quality. Based on the mapping results, it can be observed that a large portion of the regions in Bandung City had indicators ranging from orange to brick-red, indicating that the air quality in most areas of Bandung City is unhealthy. Therefore, further actions are needed to address this issue.
4. Discussion
Bandung City is one of the urban areas in Indonesia with unique topographic characteristics. This is caused by the basin-shaped highlands and mountains that surround Bandung City. Such topographic conditions affect atmospheric circulation and the distribution of pollutants in Bandung. Certain areas within the basin may experience trapped pollution due to a lack of proper air circulation. To encourage the local government of Bandung City to take preventive measures in areas with poor air quality, it is necessary to conduct an analysis that maps the different regions in Bandung based on their air quality levels. The prediction results can serve as a reference for relevant authorities to take further actions in order to reduce pollution in the city of Bandung.
The testing process was conducted using ambient air quality monitoring data measured from temporary monitoring stations located along the roads of Bandung City in 2020. The air quality monitoring results were presented in the form of the Air Pollution Standard Index (ISPU), with parameters including PM10, PM2.5, particulate matter, SO2, CO, and NO2 measured from 27 monitoring locations throughout Bandung City. The data on momentary ambient air quality measured from temporary monitoring stations located along the roads of Bandung were used to calculate the Air Pollution Standard Index (ISPU). These parameters provided information about the level of air pollution experienced by residents or those engaging in activities near the roads and roadside locations in Bandung. The Air Pollution Standard Index (ISPU) was created to provide the public with the convenience of knowing the ambient air quality conditions through simple and easily understandable information, without the need to use units that may be difficult for the general population to comprehend. The outcomes of the ISPU analysis can also aid in designing more effective and targeted environmental policies to address air pollution issues in Bandung.
Based on the conversion table of ISPU parameter concentrations, the higher the PM10, PM2.5, SO2, CO, and NO2 concentrations, the worse the air quality in that area will generally be. Each of these parameters is an air pollutant that can cause air pollution and have negative impacts on human health and the environment. This is related to calculations on a multidimensional scale, where higher values indicate worse air quality. In the context of air quality measurement, a multidimensional scale is often used to represent several parameters or air pollutants together. The air quality index used is a combination of parameters, such as PM10, PM1.5, SO2, CO, and NO2, on one scale. The higher the value on this scale, the worse the air quality in that area. An increase in values on the multidimensional scale signifies the accumulation of various air pollutants, which can have negative impacts on human health and the environment.
According to the analysis using Multidimensional Scaling (MDS), the Euclidean distance matrix was obtained to describe the distances between locations in Bandung City based on their air quality and to plot 27 locations in Bandung City into a two-dimensional plot. From the Euclidean distances obtained, multidimensional scaling was performed to transform the distances into multiple dimensions. In this case, the resulting dimensions for the coordinates were two dimensions. The output produced in Table 5 was the eigenvalues. A higher eigenvalue indicated that the dimension had a greater contribution to make in representing the differences between data points. Points that were closer to each other indicated similarity in characteristics or similarity in distance among them.
MDS analysis helped in visualizing and understanding patterns and differences in ambient air quality data at roadside locations in Bandung, as well as providing information on how different these locations were in terms of air quality in the dimensions represented by the X and Y axes in Figure 2. Among all observed locations in Bandung City, there were areas that were most similar when viewed based on the distance between objects, namely Punclut St. and KPAD Sarijadi; Soekarno Hatta St. (in front of Astra Bizz) and Elang St.; and Buah Batu St. (in front of STSI/ISBI) and Bunderan Cibiru. Although the locations may have had similar characteristics, they may have been exposed to different sources of pollution. For instance, a location situated in the city center or along a busy highway may experience higher pollution levels compared with another location far from such pollution sources.
In accordance with the quadrant generated, conclusions could also be drawn to map the regions in Bandung City based on their air quality. It was found that a total of six regions in Bandung City had good air quality, including Soekarno Hatta St. (in front of Arla Graha), Ahmad Yani St., Pasir Impun Housing Complex, Hospital St., BKR St., and Bandung City Square. All six locations shared similar characteristics in ambient air quality, as they were located in the same quadrant. All of those locations were situated in Quadrant III, which represented low ambient air quality and indicated relatively cleaner locations with lower levels of air pollution. Meanwhile, a total of eight regions in Bandung City that were located in Quadrant II had moderate air quality, including Suci St., Siliwangi St., Tegalega St., Ciganitri St., Arcamanik St., Punclut St., KPAD Sarijadi, and Buah Batu St. (non-CFD). These eight locations had similar characteristics in terms of ambient air quality as they were located in the same quadrant. The highest average attribute in ambient air quality among the locations in Quadrant II was the most influential pollutant, which was CO.
The four regions with poor air quality were located in Quadrant I, including Bandung City Hall, Diponegoro St., Pajajaran St., and Margahayu Raya St. The location with the worst air quality in Quadrant I was Bandung City Hall. It seems that the regions in Quadrant 1 also had similarly poor air quality to the regions in Quadrant 4, which consisted of nine locations: Soekarno Hatta St. (in front of Astra Bizz), Elang St., Dago St., Leuwi Panjang Bus Station, St., Buah Batu St. (in front of STSI/ISBI), Bunderan Cibiru, Ledeng Bus Station, Cicaheum Bus Station, and Pasteur St. The highest average attribute in ambient air quality in Quadrant IV was CO, while the lowest was SO2. Quadrant IV had the highest overall average ambient air quality compared with the other quadrants, indicating that locations in Quadrant IV represented areas with poor air quality.
According to research conducted by Somantri in the Indonesian Geographical Journal in 2022, Dago Road also serves as a primary access route to several tourist destinations in the North Bandung region. This road provides a fast route to the city center, making it frequently traversed by commuters, tourists, and ride-sharing services, both towards and away from the city of Bandung [32].
Regions with poor air quality require additional measures and special attention, including areas such as Soekarno-Hatta St. (in front of Astra Bizz). This is consistent with an article published in the Journal of Environmental Engineering [10], which concluded that the largest emissions came from Soekarno-Hatta St. in the southern part of Bandung City. This was due to both the surge in the number of vehicles during weekends and the traffic congestion caused by the increasing number of vehicles on a limited road width and length.
The same problem is evident at Bunderan Cibiru, where the volume of vehicles and traffic on the Raya CibiruCinunuk road section is considerably high. This road serves as one of the main arterial routes, consisting of two lanes in each direction without a median separator, resulting in congestion. Its location in an area with offices, shops, workshops, schools, colleges, and residential areas adds to the traffic intensity [33]. To ensure the road’s optimal functionality, effective traffic flow and volume management measures need to be implemented.
The areas located in the city center, such as Jl. Pajajaran, Jl. Diponegoro, Bandung City Hall, and Jl. Pasteur, also experience poor air quality, especially during weekends due to a surge in the number of vehicles. Increased activities like shopping, tourism, and gatherings at recreational places can lead to higher emissions of air pollutants, primarily from motor vehicles and surrounding industries. The findings of this research are corroborated by previous studies in the reputable International Journal of Energy Economics and Policy in 2020, which stated that approximately 70% of air pollution in Indonesia is attributed to motor vehicle emissions [34]. Air pollution from motor vehicles, including Carbon Monoxide (CO), Nitrogen Dioxide (NO2), and fine particles, significantly contributes to the poor air quality in this area. This aligns with the research conducted in the Serambi Engineering Journal in 2023, where emissions from various types of moving sources in Bandung City, including passenger cars, motorcycles, trucks, public minibuses (angkot), and taxis, were found to emit the highest levels of Carbon Monoxide (CO). On the other hand, buses were identified as the primary source of Nitrogen Oxide (NOx) emissions [35]. The most recent scientific evidence indicates a causal relationship between air pollution exposure and acute lower respiratory tract infections, chronic obstructive pulmonary disease, asthma, and lung cancer (Maio et al., 2023) [36].
The lack of vegetation cover and the increasing population of Bandung City, along with its activities, contribute to the environmental challenges in the urban area. The primary source of particulate matter in the air is the burning of vehicle fuels. Therefore, an increase in the quantity of particles indicates a rising pollution level in the transportation sector. Various measures have been taken by different parties to control pollution from this sector. Developing mass transportation systems and promoting cycling culture are some of the steps that have been taken to reduce fuel consumption. Other efforts include controlling exhaust gas emissions through testing exhaust chimneys and vehicle engine emission quality, as well as conducting emissions testing on vehicles. In conclusion, the lack of urban green space and the high activity of motorized vehicles in certain areas of Bandung lead to significant differences in air quality, even though they are geographically close together.
5. Conclusions
This research was conducted using the multidimensional scaling analysis method in a case study of ambient air quality data in Bandung City in 2020. Based on the research findings, conclusions were drawn from the formed groups, where each group had a high degree of similarity among its members but differed from the members of other groups. It is possible that locations in different groups had high similarity because the object points were located close to each other. Conclusions can be drawn from each quadrant generated to determine the mapping of regions in Bandung City based on their air quality levels. It was found that a total of six regions in Bandung City had good air quality. Meanwhile, a total of 8 regions in Bandung City had moderate air quality, and a total of 13 regions had poor air quality. Based on the mapping results, it can be observed that a large portion of the regions in Bandung City had indicators ranging from orange to brick-red, indicating that the air quality in most areas of Bandung City was unhealthy.
Therefore, interpreting region mapping based on air quality can provide information about the similarities or differences in air quality among regions in an area. This can be used to identify regions with similar air quality issues or to determine areas that require special attention in air quality improvement efforts. It becomes possible to identify areas with similar air quality, allowing the government to implement uniform treatment for regions sharing comparable air quality characteristics. As a result, the government can carry out targeted measures and interventions to address air quality issues effectively in those specific areas. In particular, areas with poor air quality require additional measures and special attention.
The aim of this study was to urge the local government of Bandung City to take preventive measures in areas with poor air quality. By employing the MDS approach in air quality mapping, the government and relevant institutions can gain a more comprehensive understanding of air pollutant distribution and take concrete steps to enhance air quality and preserve a healthier environment for the community. The government’s efforts to control emissions from stationary sources involve socialization, supervision, and guidance for businesses; technical support for controlling chimney emissions; the implementation of environmentally friendly fuels; appropriate technology; and energy efficiency. Additionally, control measures for emissions from mobile sources include campaigns, awareness-raising about reducing motor vehicle emissions through emission testing, the implementation of clean emission zones, public transportation operations, and traffic engineering. Furthermore, greening and expanding green open spaces play a crucial role in air quality control, as the vegetation planted has the capacity to absorb airborne pollutants and reduce existing air pollution levels. This approach allows for targeted interventions and more effective environmental policies, ensuring that appropriate actions are taken to address air pollution in specific regions while optimizing resources and efforts.
Author Contributions
Conceptualization, R.S.P., B.T., T.T., L.S., A.N.N. and N.K.; methodology, R.S.P., B.T., T.T., L.S., A.N.N. and N.K.; software R.S.P., B.T., L.S., A.N.N. and N.K.; validation R.S.P., B.T., T.T., L.S., A.N.N., F.G. and N.K.; formal analysis, R.S.P., B.T., T.T., L.S., A.N.N., F.G. and N.K.; investigation, R.S.P., B.T., T.T., L.S., A.N.N. and N.K.; resources, R.S.P., B.T., T.T., L.S., A.N.N. and N.K.; data curation, R.S.P., B.T., L.S., A.N.N. and N.K.; writing—original draft preparation, R.S.P., B.T., L.S., A.N.N. and N.K.; writing—review and editing, R.S.P., B.T., T.T., L.S., A.N.N., F.G. and N.K.; visualization, R.S.P., B.T., L.S., A.N.N. and N.K.; supervision, R.S.P., B.T. and T.T.; project administration, R.S.P., B.T. and T.T.; funding acquisition, R.S.P., B.T. and T.T. All authors have read and agreed to the published version of the manuscript.
Funding
This research is supported by the Department of Statistics, Padjadjaran University, and the Rector of Padjadjaran University.
Institutional Review Board Statement
Not applicable.
Informed Consent Statement
Not applicable.
Data Availability Statement
The Government Agency Performance Report (LKIP) of the Bandung Environment and Sanitation Service can be accessed via ppid.bandung.go.id (accessed on 3 July 2023).
Conflicts of Interest
The authors declare no conflict of interest.
References
- WHO. Ambient (Outdoor) Air Pollution. 19 December 2022. Available online: https://www.who.int/news-room/fact-sheets/detail/ambient-(outdoor)-air-quality-and-health (accessed on 18 June 2023).
- Rafaj, P.; Kiesewetter, G.; Gül, T.; Schöpp, W.; Cofala, J.; Klimont, Z.; Purohit, P.; Heyes, C.; Amann, M.; Borken-Kleefeld, J.; et al. Outlook for Clean Air in The Context of Sustainable Development Goals. Glob. Environ. Chang. 2018, 53, 1–11. [Google Scholar] [CrossRef]
- EEA. How Air Pollution Affects Our Health; European Environment Agency: Copenhagen, Denmark, 2023. [Google Scholar]
- Manisalidis, I.; Stavropoulou, E.; Stavropoulos, A.; Bezirtzoglou, E. Environmental and Health Impacts of Air Pollution: A Review. Front. Public Health. 2020, 8, 14. [Google Scholar] [CrossRef] [PubMed]
- Haryanto, B. (Ed.) Climate Change and Urban Air Pollution Health Impacts in Indonesia. In Climate Change and Air Pollution; Springer: Berlin/Heidelberg, Germany, 2018; p. 14. [Google Scholar]
- Ken Lee, M.G. Indonesia’s Worsening Air Quality and Its Impact on Life Expectancy. In the Energy Policy Institute at the University of Chicago (EPIC). Chicago. Available online: https://aqli.epic.uchicago.edu/wp-content/uploads/2021/09/AQLI_Indonesia_Report.English.pdf (accessed on 26 July 2023).
- Greenstone, M.; Fan, Q.C. Kualitas Udara Indonesia Yang Memburuk Dan Dampaknya Terhadap Harapan Hidup; Energy Policy Institute at the University of Chicago: Chicago, IL, USA, 2019; Available online: https://aqli.epic.uchicago.edu/wp-content/uploads/2019/03/Indonesia.Indonesian.pdf (accessed on 26 July 2023).
- Sinaga, D.; Setyawati, W.; Cheng, F.Y.; Lung, S.C.C. Investigation on Daily Exposure to PM2.5 in Bandung City, Indonesia Using Low-Cost Sensor. J. Expo. Sci. Environ. Epidemiol. 2020, 30, 1001–1012. [Google Scholar] [CrossRef] [PubMed]
- Hopke, P.K.; Cohen, D.D.; Begum, B.A.; Biswas, S.K.; Ni, B.; Pandit, G.G.; Santoso, M.; Chung, Y.S.; Davy, P.; Markwitz, A.; et al. Urban air quality in the Asian region. Sci. Total Environ. 2008, 404, 103–112. [Google Scholar] [CrossRef] [PubMed]
- Pratama, A.; Sofyan, A. Analisis dispersi pencemar udara PM10 di Kota Bandung menggunakan WRFChem data asimilasi. J. Tek. Lingkung. 2020, 26, 19–36. [Google Scholar]
- IQAir. Bandung Air Quality. 29 May 2023. Available online: https://www.iqair.com/id/indonesia/west-java/bandung (accessed on 29 May 2023).
- Wardhani, N.; Gani, H.; Zuhriyah, S.; Gani, H.; Vidyarini, E. A Correlation Method for Meteorological Factors and Air Pollution in Association to COVID-19 Pandemic in the Most Affected City in Indonesia. ILKOM J. Ilm. 2021, 13, 195–205. [Google Scholar] [CrossRef]
- Dai, Z.; Liu, D.; Yu, K.; Cao, L.; Jiang, Y. Meteorological Variables and Synoptic Patterns Associated with Air Pollutions in Eastern China during 2013–2018. Int. J. Environ. Res. Public Health 2020, 17, 2528. [Google Scholar] [CrossRef] [PubMed]
- Laña, I.; Del Ser, J.; Padró, A.; Vélez, M.; Casanova-Mateo, C. The role of local urban traffic and meteorological conditions in air pollution: A data-based case study in Madrid, Spain. Atmos. Environ. 2016, 145, 424–438. [Google Scholar] [CrossRef]
- Mustofa, A.H.; Chandra, I.; Salam, R.A.; Rachmawati, L.M. Vertical Structure of PM2.5 and CO2 Concentrations in the Greater Bandung Air Basin. J. Phys. Conf. Ser. 2022, 2377, 012052. [Google Scholar] [CrossRef]
- Gunawan, M.; Asyahira, R.; Sidjabat, F.M. Evaluation of Ambient Air Quality Monitoring System in Jakarta: A Literature Review. Serambi Eng. 2020, 5, 842–851. [Google Scholar] [CrossRef]
- KLHK. Indeks Standar Pencemaran Udara (ISPU) Sebagai Informasi Mutu Udara Ambien di Indonesia. Retrieved from Kementerian Lingkungan Hidup Dan Kehutanan. 24 September 2020. Available online: https://ditppu.menlhk.go.id/portal/read/indeks-standar-pencemar-udara-ispu-sebagai-informasi-mutu-udara-ambien-di-indonesia (accessed on 25 July 2023).
- Peng, R.D.; Chang, H.H.; Bell, M.L.; McDermott, A.; Zeger, S.L.; Samet, J.M.; Dominici, F. Coarse Particulate Matter Air Pollution and Hospital Admissions for Cardiovascular and Respiratory Diseases Among Medicare Patients. JAMA 2008, 299, 2172–2179. [Google Scholar] [CrossRef] [PubMed]
- Australian Government Department of Climate Change, Energy, the Environment and Water. Particulate Matter (PM10 and PM2.5). 30 June 2022. Available online: https://www.dcceew.gov.au/environment/protection/npi/substances/fact-sheets/particulate-matter-pm10-and-pm25 (accessed on 25 July 2023).
- Chandra, I.; Nisa, K.; Rosdiana, E. Preliminary study: Health risk analysis of PM2.5 and PM10 mass concentrations in Bandung Metropolitan. IOP Conf. Ser. Earth Environ. Sci. 2021, 824, 012049. [Google Scholar] [CrossRef]
- Kombara, Y.P.; Junnaedhi, I.D.; Riawan, E. Majalaya Flood Early Warning System: A Community Based Approach; Program Studi Meteorologi: Bandung, Indonesia, 2016. [Google Scholar]
- Pearce, J.L.; Waller, L.A.; Chang, H.H.; Klein, M.; Mulholland, J.A.; Sarnat, J.A.; Sarnat, S.E.; Strickland, M.J.; Tolbert, P.E. Using self-organizing maps to develop ambient air quality classifications: A time series example. Environ. Health 2014, 13, 1–14. [Google Scholar] [CrossRef] [PubMed]
- LKIP. Laporan Kinerja Instansi Pemerintah Kota Bandung Tahun 2020. Retrieved from Dinas Lingkungan Hidup dan Kebersihan Kota Bandung. 2020. Available online: https://ppid.bandung.go.id/kb/ppid-pembantu/dinas/dinas-lingkungan-hidup-dan-kebersihan/ (accessed on 26 July 2023).
- United Nations Environment Programme. Atmospheric Survey and Analysis (Manual Active Sampling Method). 2022. Available online: https://wedocs.unep.org/20.500.11822/41435 (accessed on 18 July 2023).
- HORIBA. AQMS Ambient Air Quality Monitoring System. Retrieved from HORIBA Group. Available online: https://www.horiba.com/int/process-and-environmental/products/detail/action/show/Product/aqms-1560/#:~:text=An%20Air%20Quality%20Monitoring%20Station,barometric%20pressure%20and%20ambient%20parameters (accessed on 26 July 2023).
- Stevyers, M. Multidimensional Scaling. In Encyclopedia of Cognitive Science; John Wiley & Sons: Hoboken, NJ, USA, 2002; pp. 1–5. [Google Scholar]
- Little, A.; Xie, Y.; Sun, Q. An analysis of classical multidimensional scaling with applications to clustering. Inf. Inference A J. IMA 2023, 12, 72–112. [Google Scholar] [CrossRef] [PubMed]
- Johnson, R.A.; Wichern, D.W. Applied Multivariate Statistical Analysis, 6th ed.; Pearson Education, Inc.: Hoboken, NJ, USA, 2007. [Google Scholar]
- NCSS Statistical Software. Multidimensional Scaling. 1981. Retrieved from NCSS.com; NCSS, LLC: Kaysville, Utah, United States. Available online: https://www.ncss.com/ (accessed on 18 June 2023).
- Eom, S. Author Cocitation Analysis: Quantitative Methods for Mapping the Intellectual Structure of an Academic Discipline; IGI Global: Hershey, PA, USA, 2008. [Google Scholar]
- Hout, M.C.; Papesh, M.H.; Goldinger, S.D. Multidimensional scaling. Wiley Interdiscip. Rev. Cogn. Sci. 2013, 4, 93–103. [Google Scholar] [CrossRef] [PubMed]
- Somantri, L. Pemetaan mobilitas penduduk di kawasan pinggiran Kota Bandung. Maj. Geogr. Indones. 2022, 36, 95–102. [Google Scholar] [CrossRef]
- Harahap, E.; Darmawan, D.; Badruzzaman, F.H. LINTAS-LC 1.0: Modeling and Simulation of Traffic in Lingkar Cileunyi Bandung Indonesia. J. Phys. Conf. Ser. 2019, 1366. [Google Scholar] [CrossRef]
- Purwadi, A.; Suhandi, S.; Enggarsasi, U. Urban air pollution control caused by exhaust gas emissions in developing country cities in public policy law perspective. Int. J. Energy Econ. Policy 2020, 10, 31–36. [Google Scholar] [CrossRef]
- Restiana, D.I.; Permadi, D.A. Estimasi Penurunan Emisi Pencemar Udara Pengaruh dari Pengoperasian Bus Rapid Transit di Kota Bandung. Serambi Eng. 2023, VIII, 5124–5134. [Google Scholar] [CrossRef]
- Maio, S.; Sarno, G.; Tagliaferro, S.; Pirona, F.; Stanisci, I.; Baldacci, S.; Viegi, G. Outdoor air pollution and respiratory health. Int. J. Tuberc. Lung Dis. 2023, 27, 7–12. [Google Scholar] [CrossRef] [PubMed]
Figure 1.
Research Object: Regions in Bandung City.
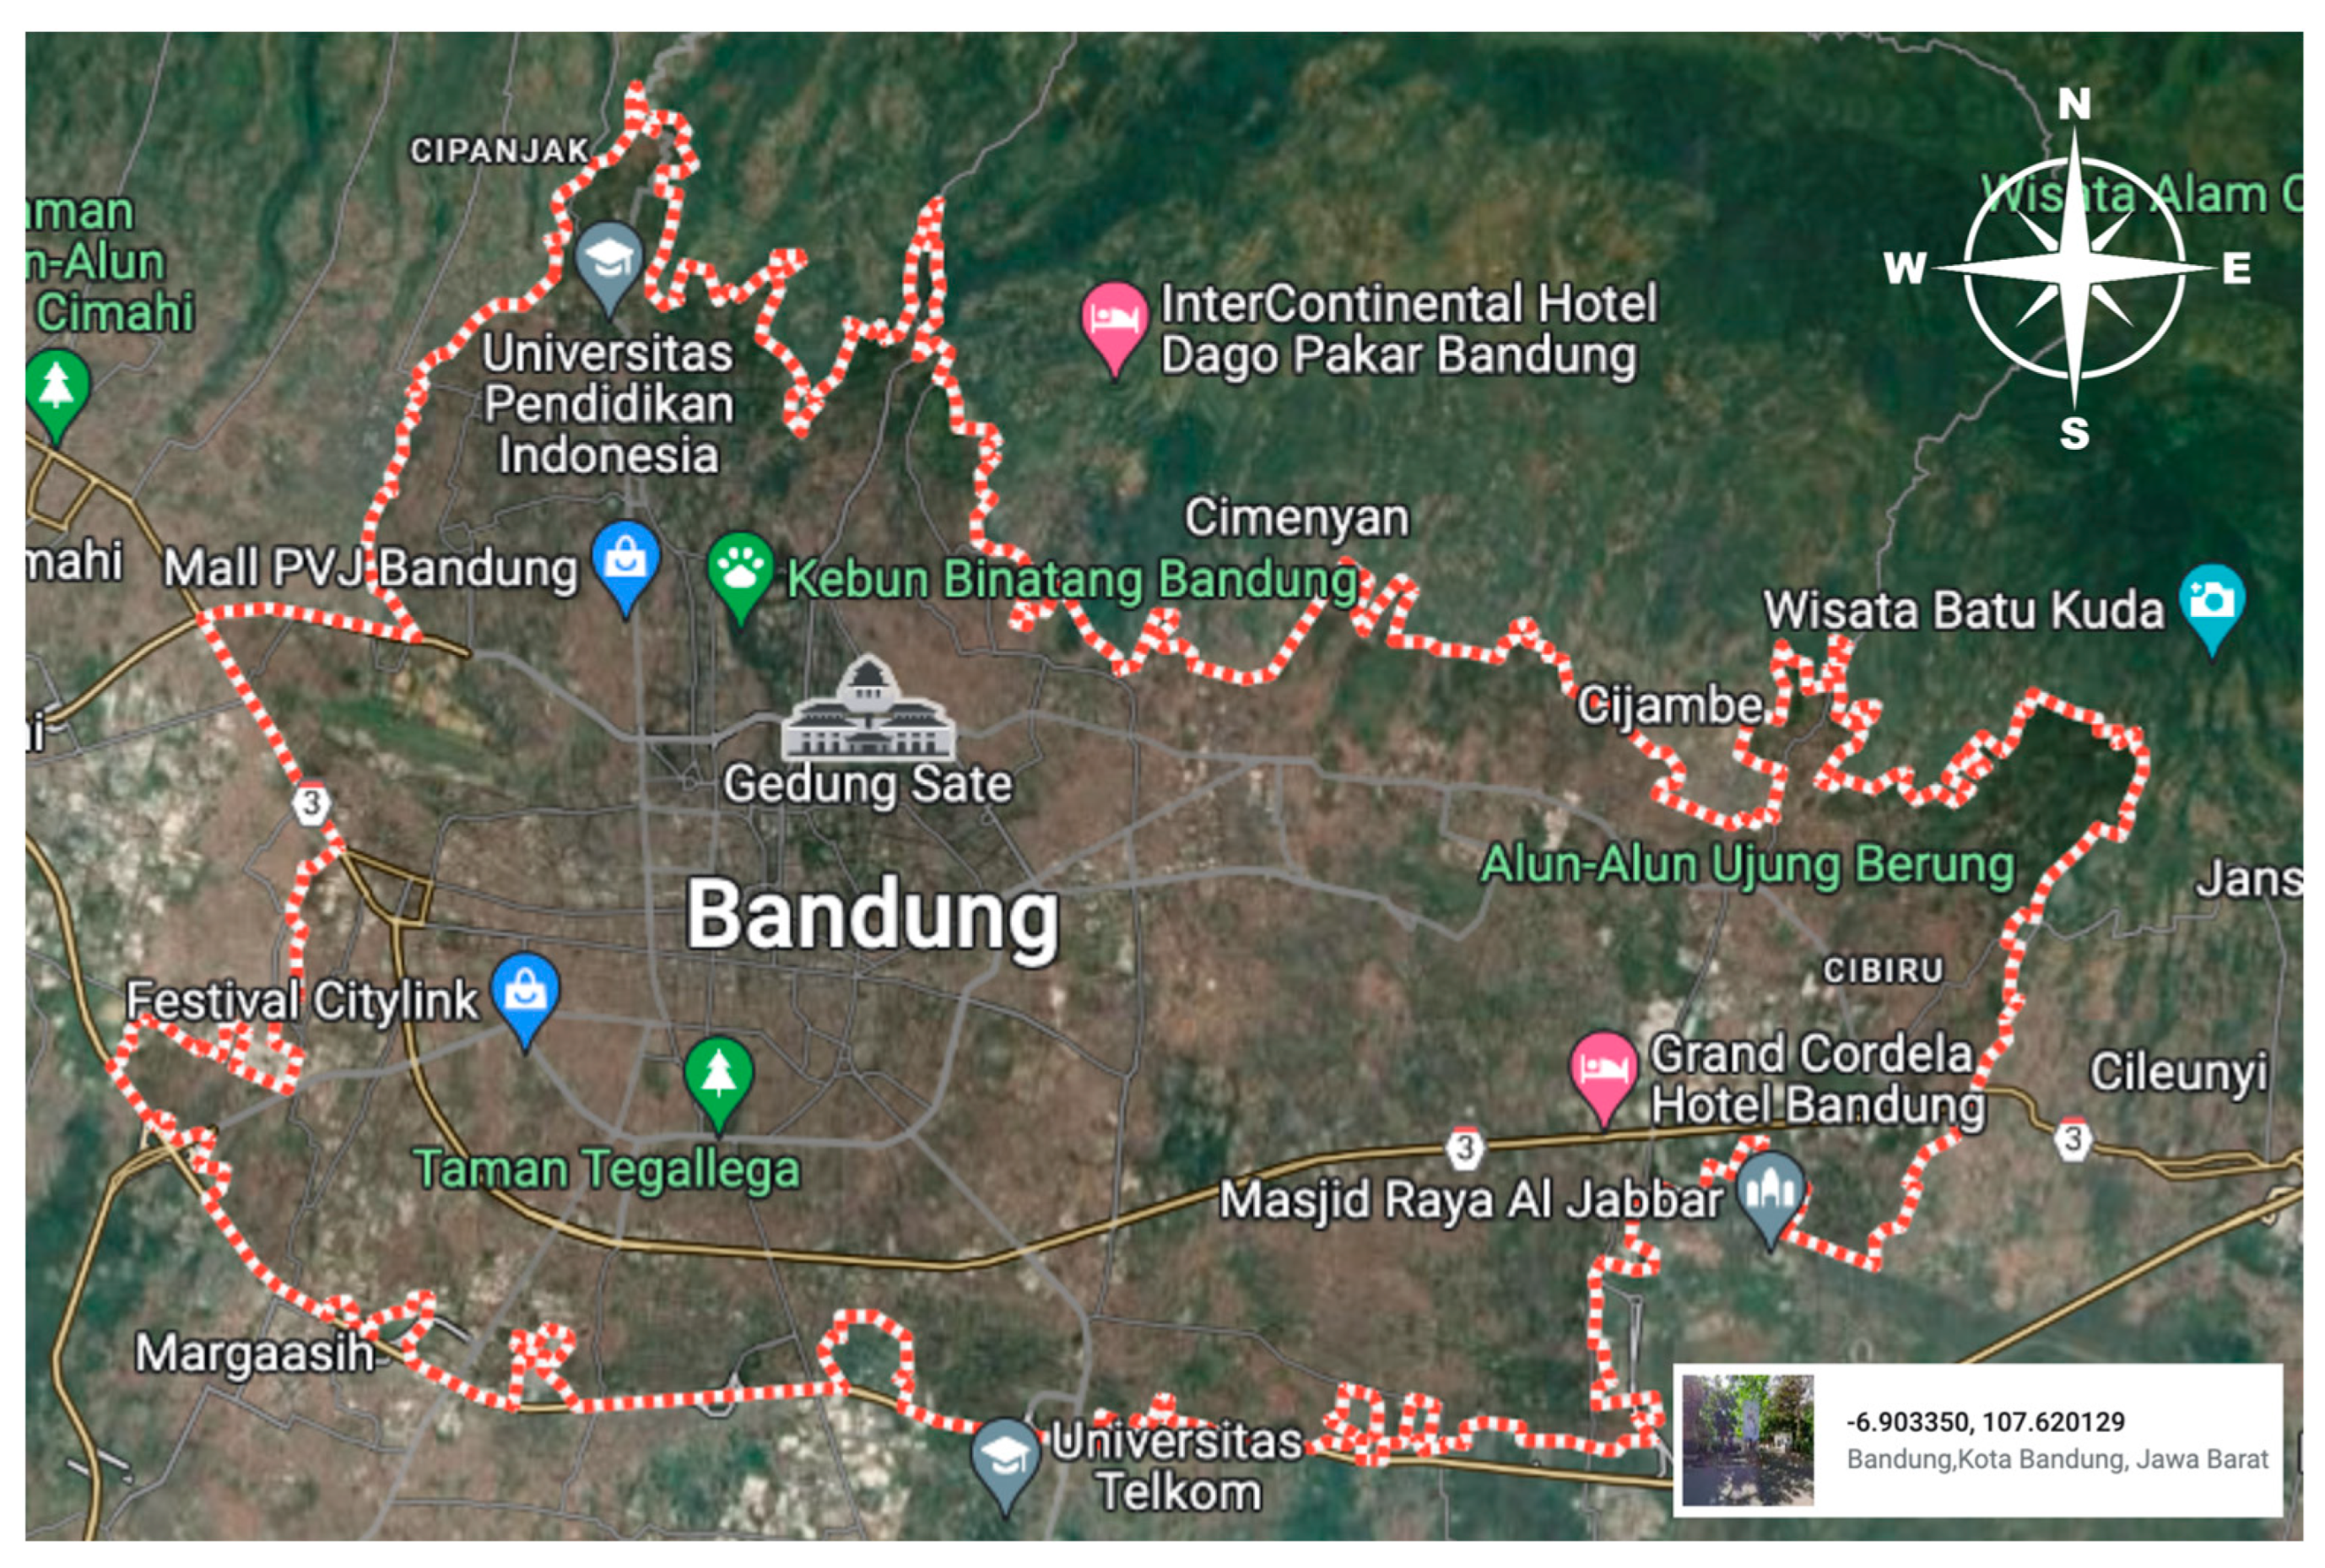
Figure 2.
Metric Multidimensional Scaling Plot.
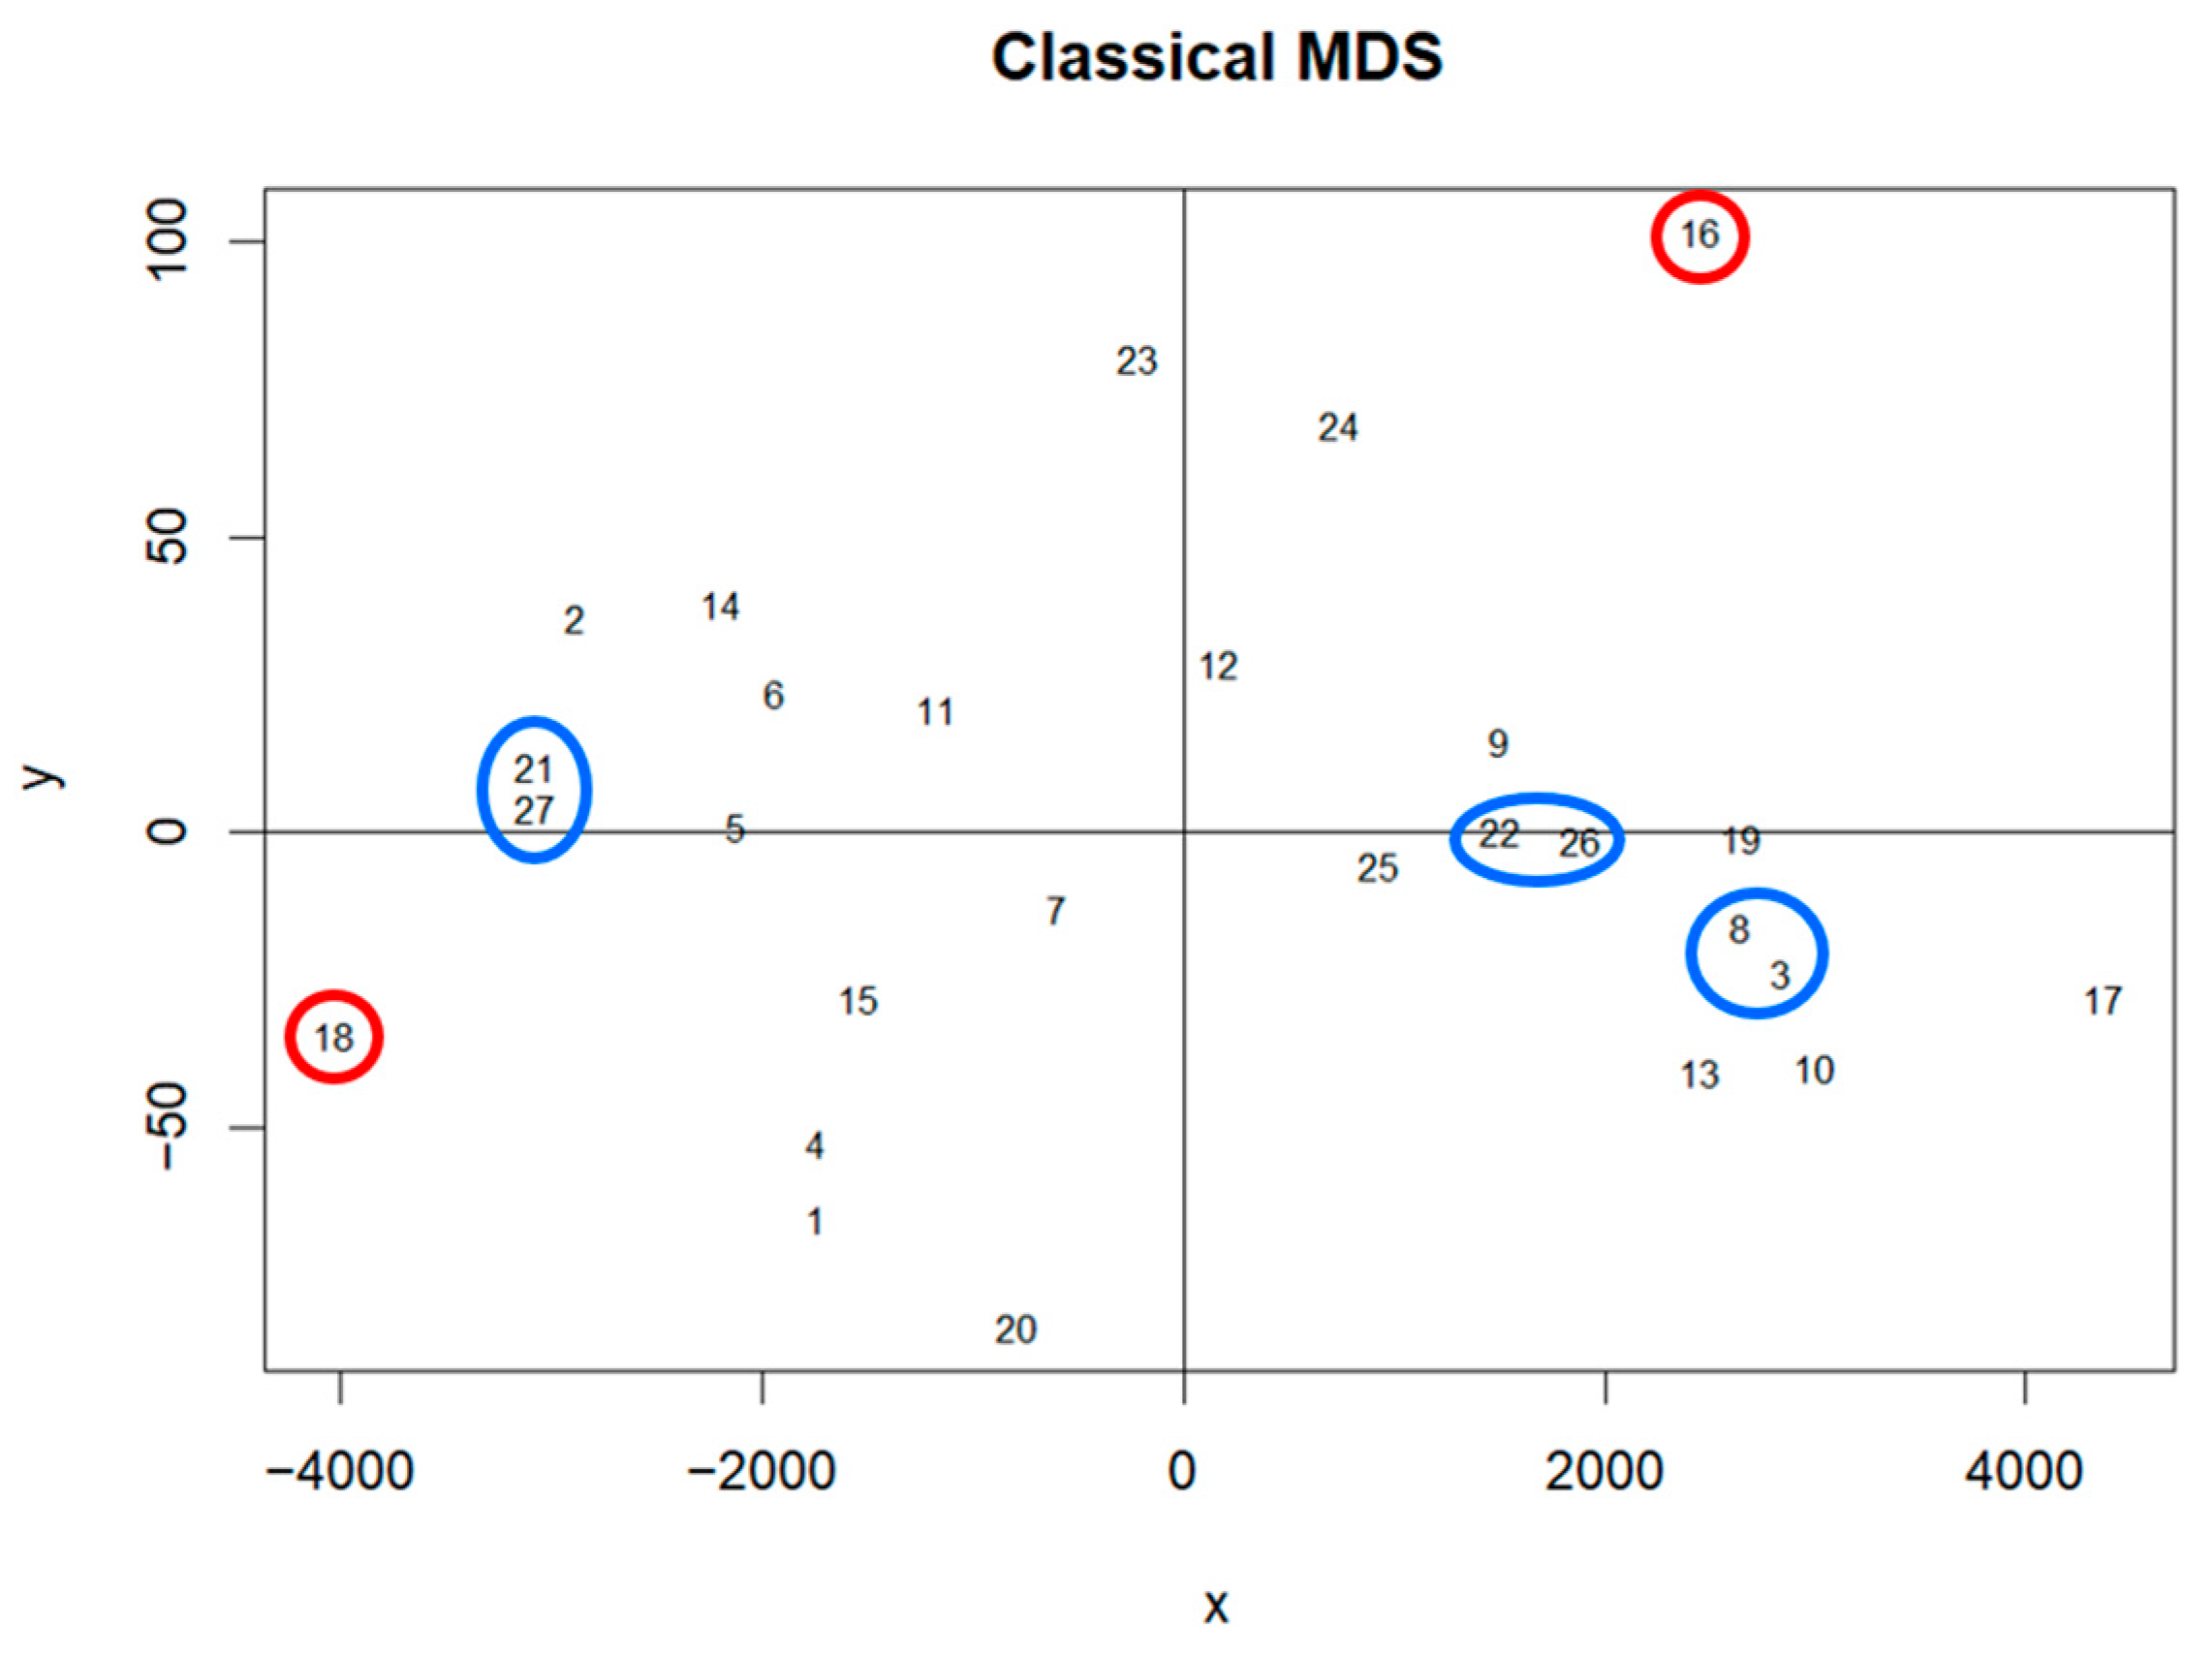
Figure 3.
Air Quality Mapping in Bandung City.

Table 1.
Conversion of Concentration Values.
| ISPU | |||||
|---|---|---|---|---|---|
| 0–50 | 50 | 15.5 | 52 | 4000 | 80 |
| 51–100 | 150 | 55.4 | 180 | 8000 | 200 |
| 101–200 | 350 | 150.4 | 400 | 15,000 | 1130 |
| 201–300 | 420 | 250.4 | 800 | 30,000 | 2260 |
| >300 | 500 | 500 | 1200 | 45,000 | 3000 |
Table 2.
Air Quality Categories Based on ISPU Values.
| Number | ISPU Values | Category |
|---|---|---|
| 1 | 0–50 | Good |
| 2 | 51–100 | Moderate |
| 3 | 101–200 | Unhealthy |
| 4 | 201–300 | Very Unhealthy |
| 5 | >300 | Hazardous |
Table 3.
Temporary Ambient Air Quality at Roadside Locations in Bandung City.
| Number | Location | ||||||
|---|---|---|---|---|---|---|---|
| 1 | BKR St. | 98.25 | 26.26 | 168.92 | 29.24 | 3435 | 23.17 |
| 2 | Tegallega St. | 44.21 | 26.18 | 58.26 | 29.24 | 2290 | 15.24 |
| 3 | Bunderan Cibiru | 123.50 | 59.20 | 196 | 37.34 | 8015 | 39.37 |
| 4 | Rumah Sakit St. | 102.40 | 32.28 | 150.80 | 36.59 | 3435 | 24.06 |
| 5 | Buah Batu St. (non-CFD) | 76.58 | 58.66 | 92.61 | 29.24 | 3057 | 29.15 |
| 6 | Ciganitri St. | 64.27 | 27.88 | 81.65 | 29.24 | 3240 | 15.22 |
| . | . | . | . | . | . | . | . |
| . | . | . | . | . | . | . | . |
| 24 | Diponegoro St. | 65.18 | 20.66 | 82.52 | 35.72 | 5920 | 37.80 |
| 25 | Dago (non-CFD) | 78.86 | 60.26 | 158.28 | 51.21 | 6103 | 57.42 |
| 26 | Elang St. | 61.22 | 48.26 | 186.28 | 36.21 | 7065 | 44.42 |
| 27 | KPAD Sarijadi | 60.60 | 36.50 | 81.60 | 29.24 | 2095 | 12.07 |
Table 4.
Summary Statistics of Temporary Ambient Air Quality at Roadside Locations in Bandung City.
| Average | 88.13 | 43.89 | 132.28 | 33.97 | 5174.96 | 30.35 |
| Maximum | 143.83 | 64.24 | 218.26 | 52.22 | 9542.00 | 67.52 |
| Minimum | 40.28 | 20.66 | 58.26 | 29.24 | 1145.00 | 5.82 |
| Median | 82.10 | 46.88 | 132.81 | 29.24 | 4958.00 | 26.62 |
| Standard Deviation | 30.92 | 14.64 | 51.65 | 7.27 | 2312.35 | 15.86 |
Table 5.
Coordinate X, Coordinate Y, and Eigenvalue.
| Number | Location | Coordinates X | Coordinates Y | Eigenvalue |
|---|---|---|---|---|
| 1 | BKR St. | −1739.1475 | −65.3891059 | 1.3907 × 10⁸ |
| 2 | Tegallega St. | −2886.1054 | 36.6768799 | 4.7649 × 10⁴ |
| 3 | Bunderan Cibiru | 2840.9173 | −23.7121772 | 6.5650 × 10³ |
| 4 | Rumah Sakit St. | −1739.3451 | −52.6990818 | 3.4629 × 10³ |
| 5 | Buah Batu St. (non-CFD) | −2118.2461 | 1.0286942 | 1.8428 × 10³ |
| 6 | Ciganitri St. | −1935.747 | 23.5272711 | 2.1120 × 10² |
| 7 | Soekarno-Hatta St. (in front of Arla Graha) | −594.8199 | −12.9516833 | 8.2818 × 10⁻⁹ |
| 8 | Buah Batu St. (in front of STSI/ISBI) | 2645.7613 | −16.1282146 | 2.1631 × 10⁻⁹ |
| 9 | Margahayu Raya St. | 1499.9545 | 15.3682918 | 1.5371 × 10⁻⁹ |
| 10 | Cicaheum Bus Station | 2990.3472 | −39.6611521 | 1.3642 × 10⁻⁹ |
| 11 | Arcamanik St. | −1167.574 | 20.9259527 | 1.2525 × 10⁻⁹ |
| 12 | Pajajaran St. | 167.619 | 28.6549817 | 9.7818 × 10⁻¹⁰ |
| 13 | Ledeng Bus Station | 2452.1991 | −40.3805187 | 5.6538 × 10⁻¹⁰ |
| 14 | Siliwangi St. | −2199.0115 | 38.766072 | 4.2559 × 10⁻¹⁰ |
| 15 | Ahmad Yani St. | −1544.7904 | −28.1079631 | 3.4280 × 10⁻¹⁰ |
| 16 | Bandung City Hall | 2449.5891 | 101.7776271 | 2.8271 × 10⁻¹⁰ |
| 17 | Pasteur St. | 4368.3427 | −28.092805 | 5.4123 × 10⁻¹¹ |
| 18 | Pasir Impun Housing Complex | −4030.0544 | −34.0735397 | −5.1944 × 10⁻¹⁰ |
| 19 | Leuwipanjang Bus Station | 2645.4427 | −0.6137989 | −8.5443 × 10⁻¹⁰ |
| 20 | Bandung City Square | −788.6149 | −83.6263156 | −9.5828 × 10⁻¹⁰ |
| 21 | Punclut St. | −3080.7012 | 11.3996463 | −1.2341 × 10⁻⁹ |
| 22 | Soekarno Hatta St. (in front of Astra Bizz) | 1500.1627 | 0.4605324 | −1.7569 × 10⁻⁹ |
| 23 | Suci St. | −218.3972 | 80.4391704 | −1.8112 × 10⁻⁹ |
| 24 | Diponegoro St. | 743.9138 | 68.9902335 | −2.0082 × 10⁻⁹ |
| 25 | Dago (non-CFD) | 928.4474 | −5.5998788 | −6.8765 × 10⁻⁹ |
| 26 | Elang St. | 1890.4171 | −1.3096505 | −7.8225 × 10⁻⁹ |
| 27 | KPAD Sarijadi | −3080.5596 | 4.3305322 | −8.9574 × 10⁻⁹ |
Disclaimer/Publisher’s Note: The statements, opinions and data contained in all publications are solely those of the individual author(s) and contributor(s) and not of MDPI and/or the editor(s). MDPI and/or the editor(s) disclaim responsibility for any injury to people or property resulting from any ideas, methods, instructions or products referred to in the content. |
© 2023 by the authors. Licensee MDPI, Basel, Switzerland. This article is an open access article distributed under the terms and conditions of the Creative Commons Attribution (CC BY) license (https://creativecommons.org/licenses/by/4.0/).
Share and Cite
MDPI and ACS Style
Pontoh, R.S.; Saliaputri, L.; Nashwa, A.N.; Khairina, N.; Tantular, B.; Toharudin, T.; Gumelar, F. Air Quality Mapping in Bandung City. Atmosphere 2023, 14, 1444. https://doi.org/10.3390/atmos14091444
AMA Style
Pontoh RS, Saliaputri L, Nashwa AN, Khairina N, Tantular B, Toharudin T, Gumelar F. Air Quality Mapping in Bandung City. Atmosphere. 2023; 14(9):1444. https://doi.org/10.3390/atmos14091444
Chicago/Turabian StylePontoh, Resa Septiani, Leivina Saliaputri, Audrey Nayla Nashwa, Nadhira Khairina, Bertho Tantular, Toni Toharudin, and Farhat Gumelar. 2023. "Air Quality Mapping in Bandung City" Atmosphere 14, no. 9: 1444. https://doi.org/10.3390/atmos14091444
Note that from the first issue of 2016, this journal uses article numbers instead of page numbers. See further details here.