
Application of the Self-Organizing Map Method in February Temperature and Precipitation Pattern over China: Comparison between 2021 and 2022
Abstract
:1. Introduction
2. Data and Methods
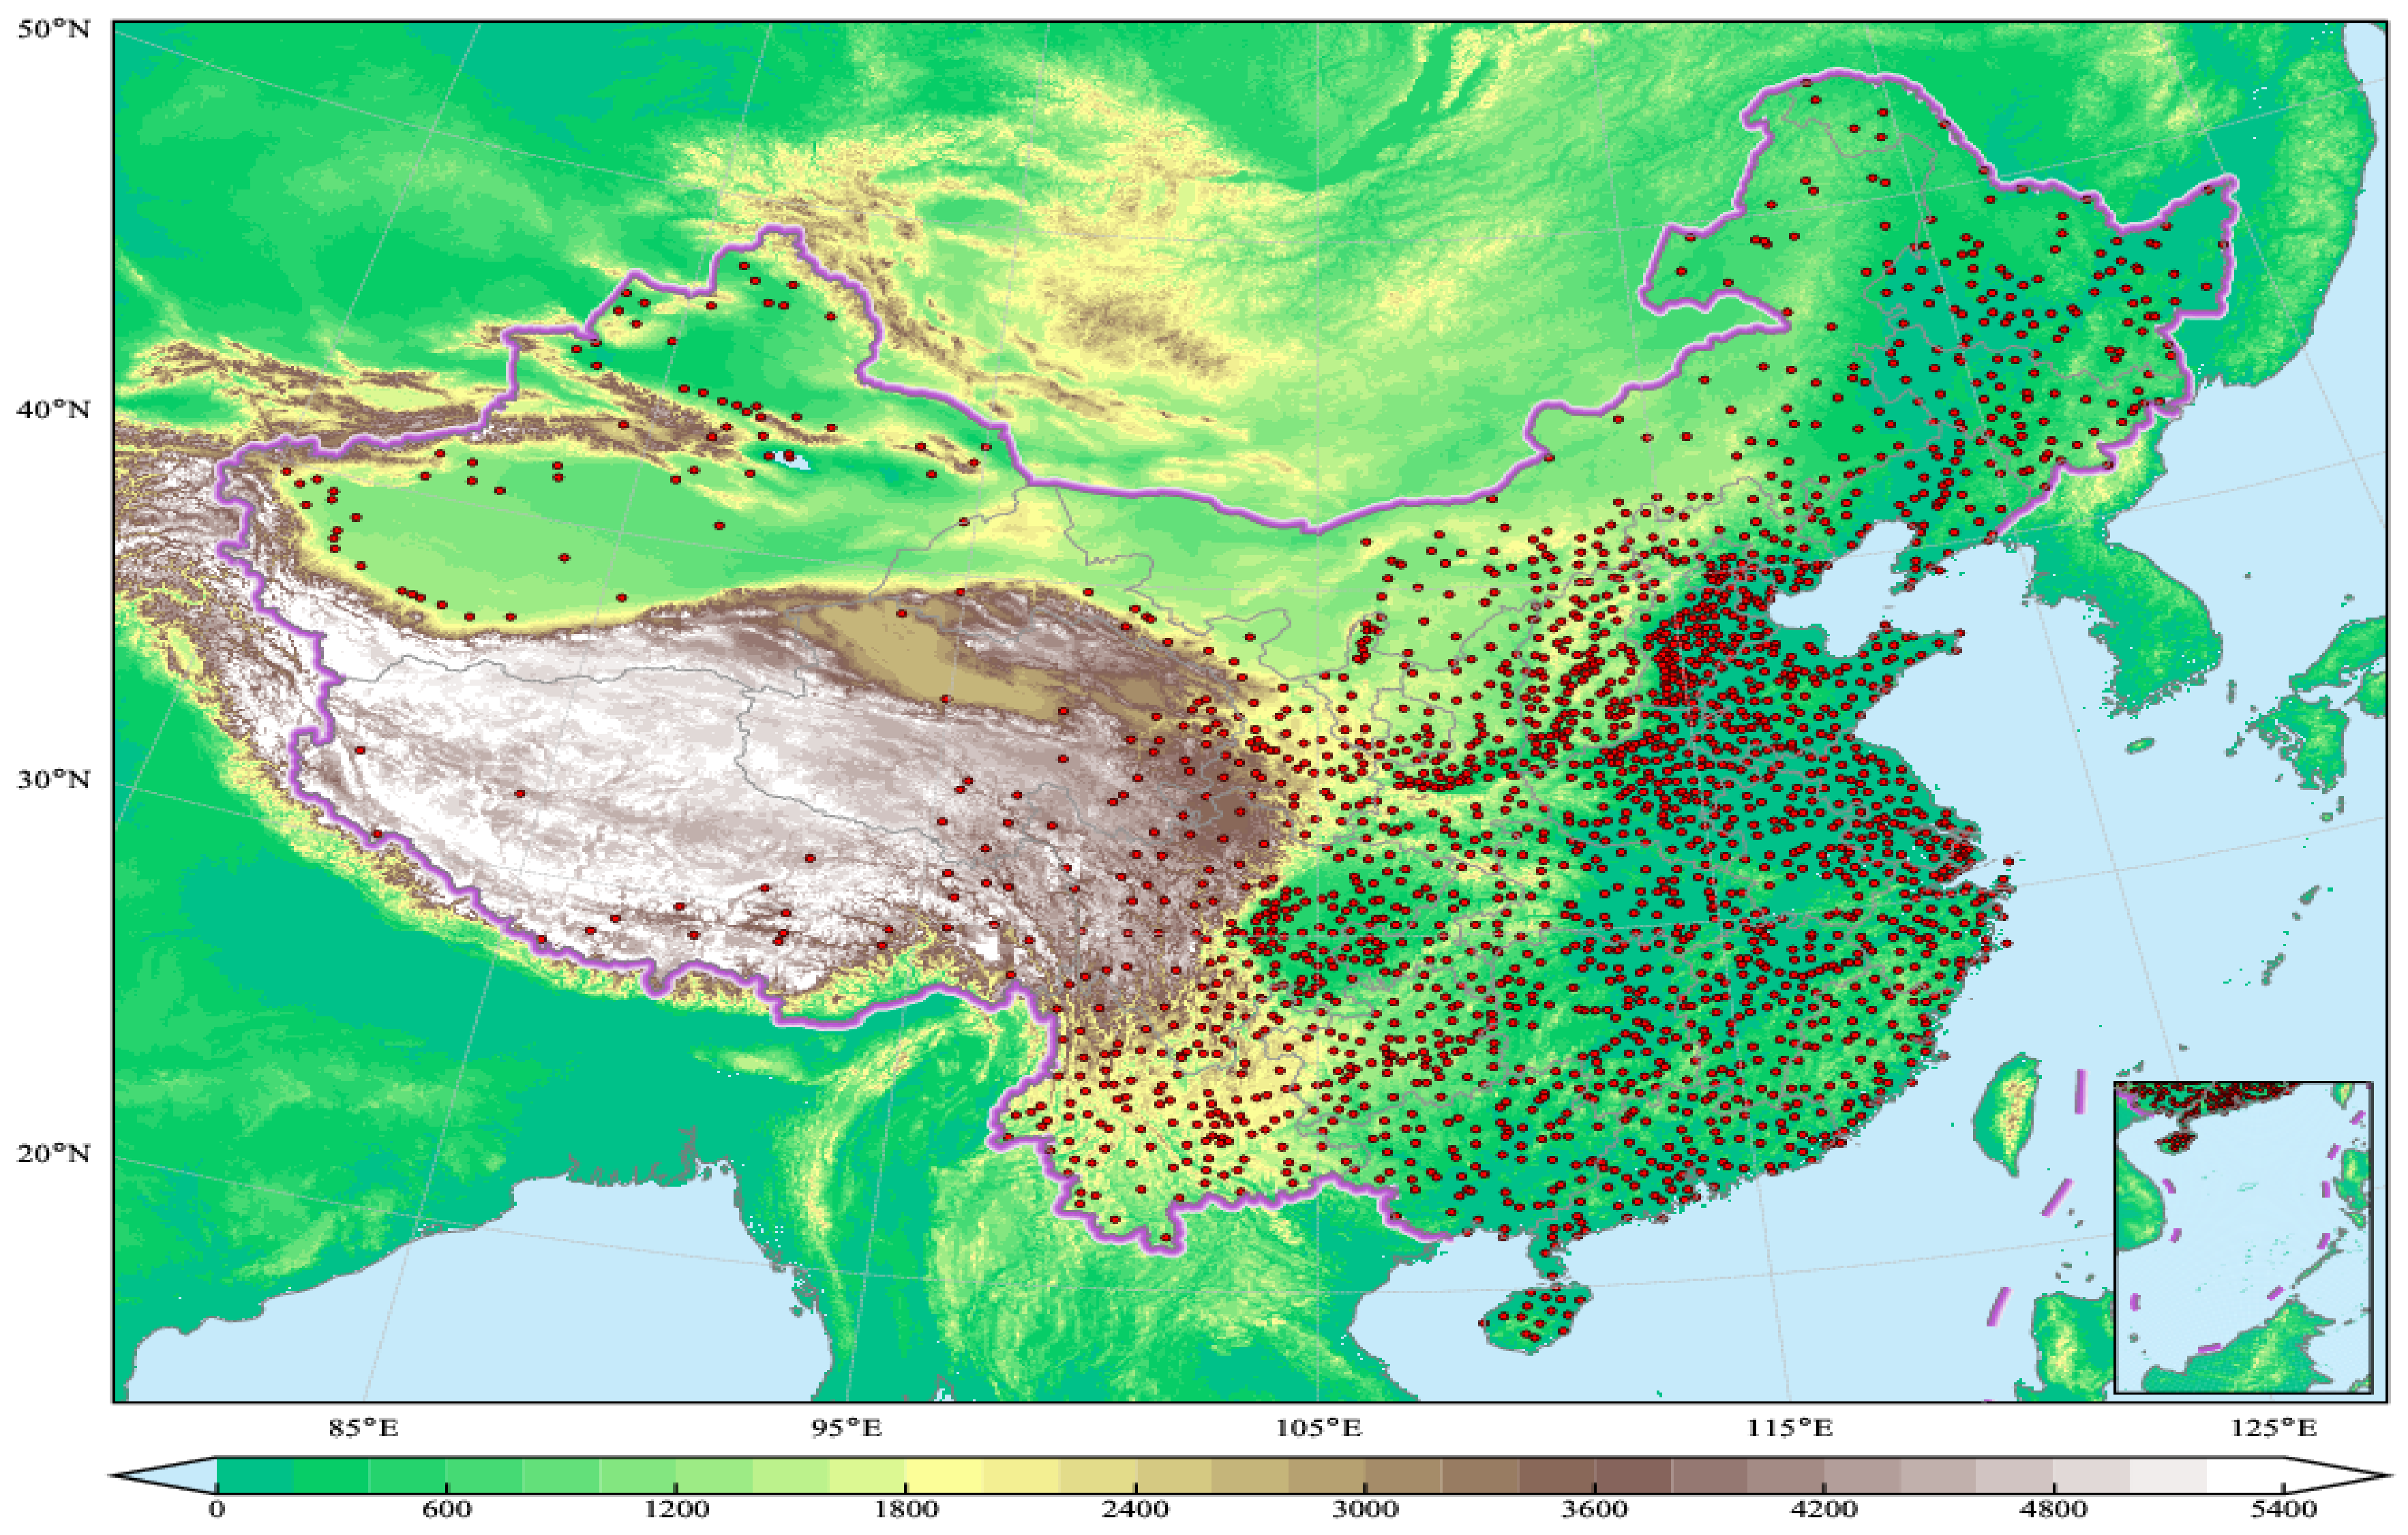
2.1. Datasets
2.2. Methods
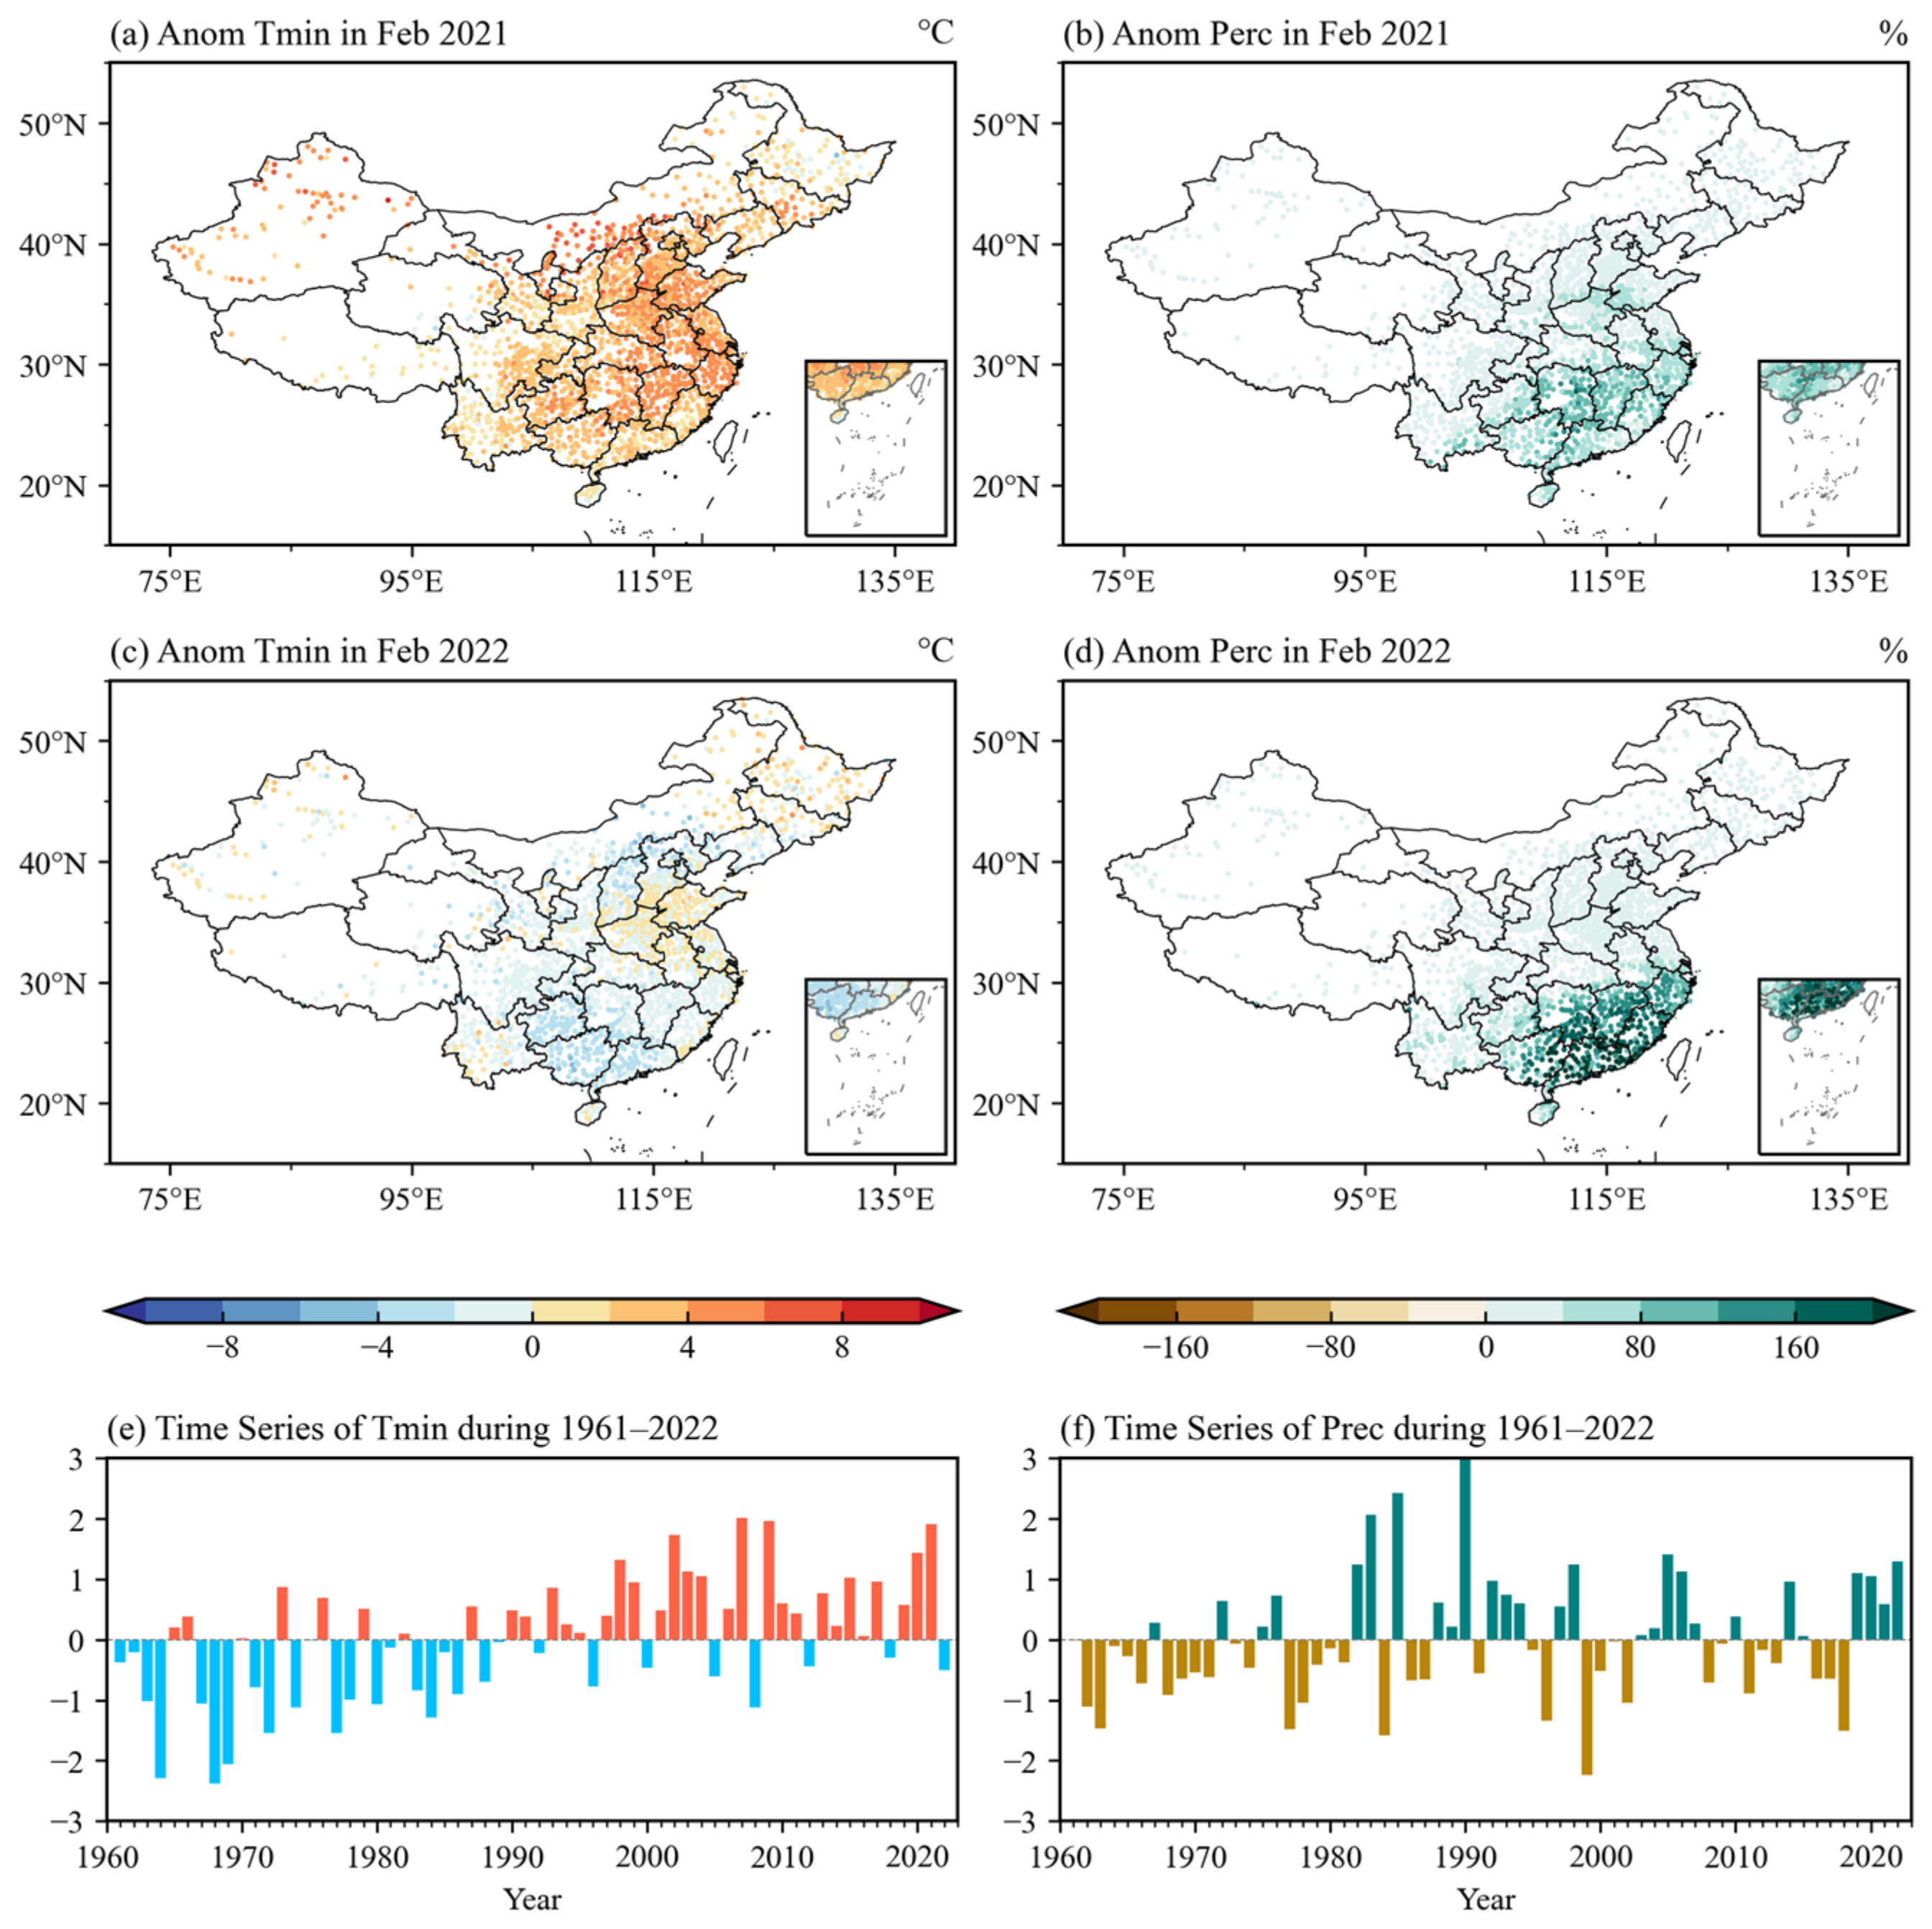
3. Variations in February Temperature and Precipitation in 2021 and 2022
4. Atmospheric Conditions in February 2021 and 2022
4.1. Circulation Patterns in February 2021 and 2022
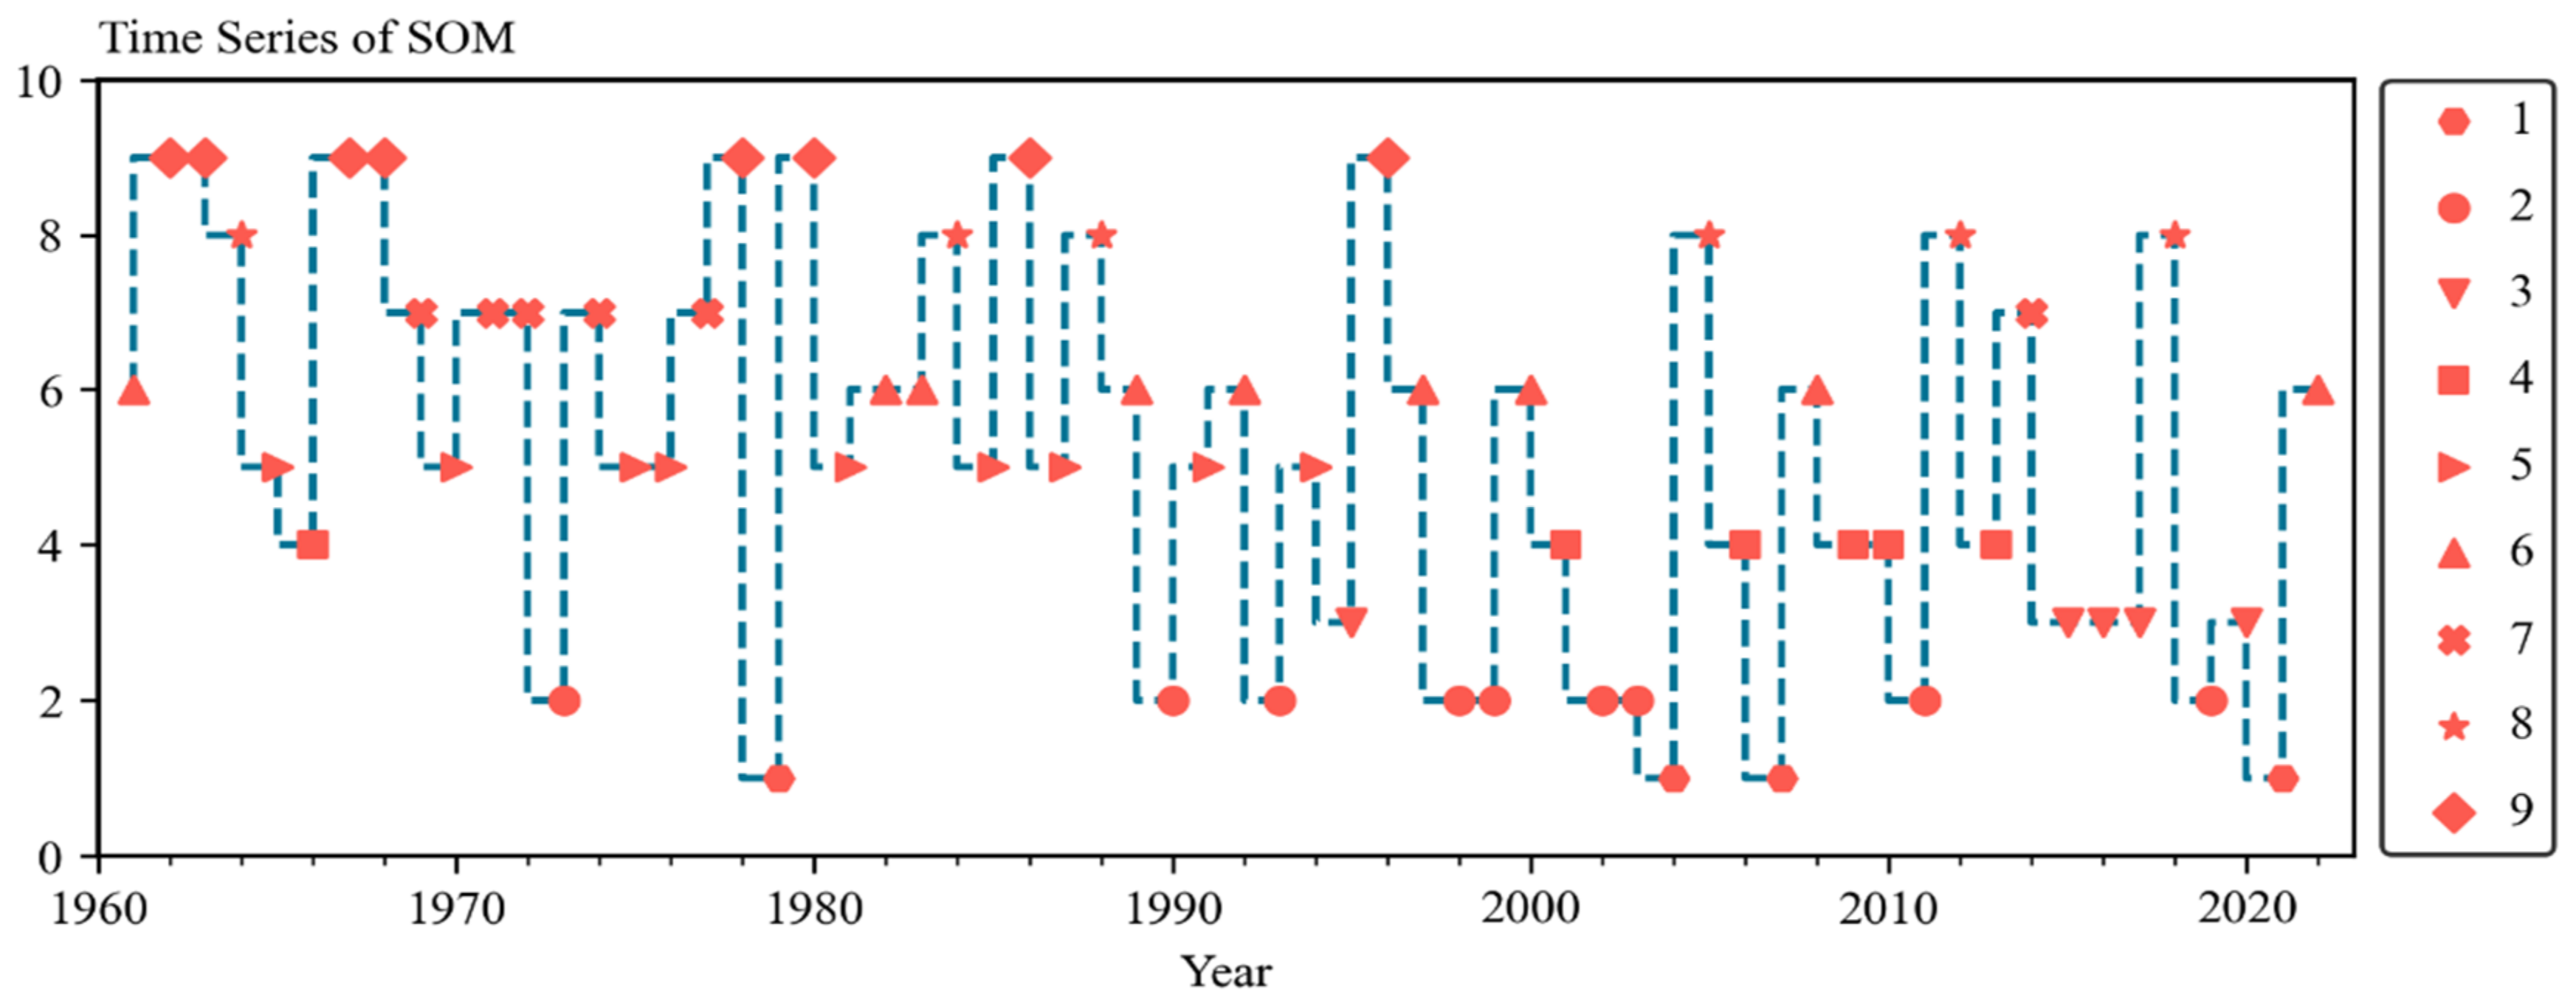
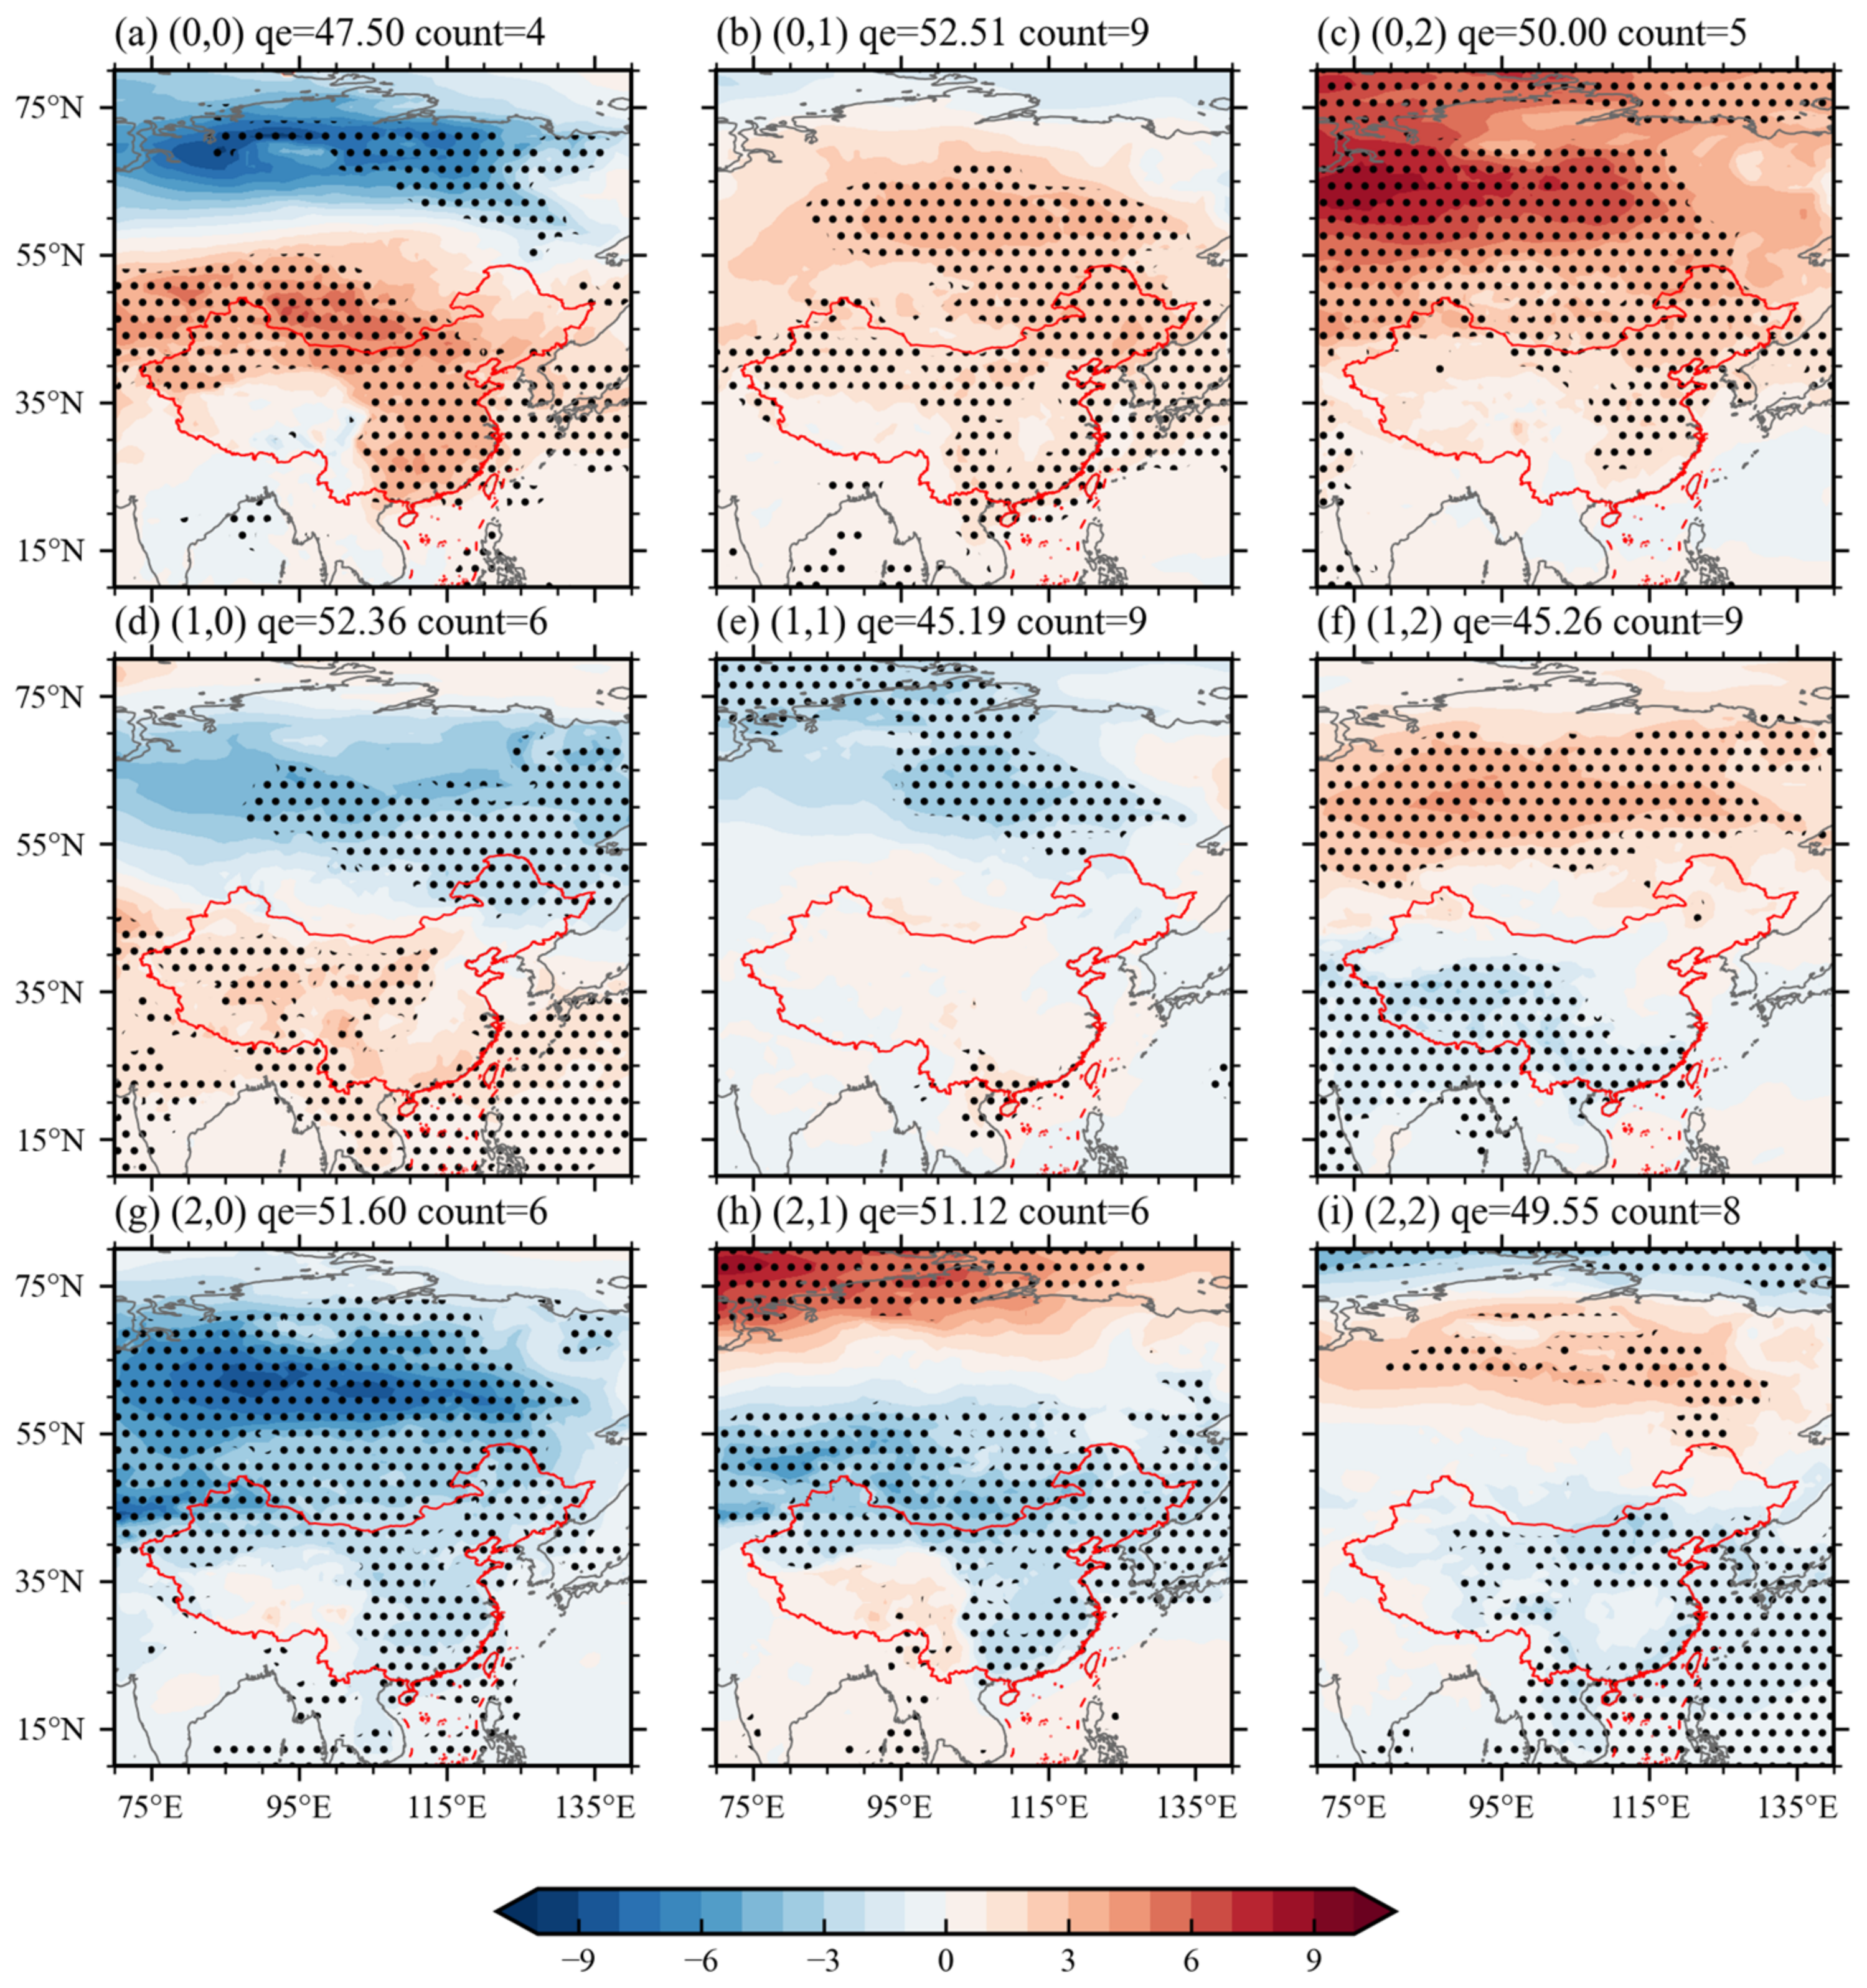
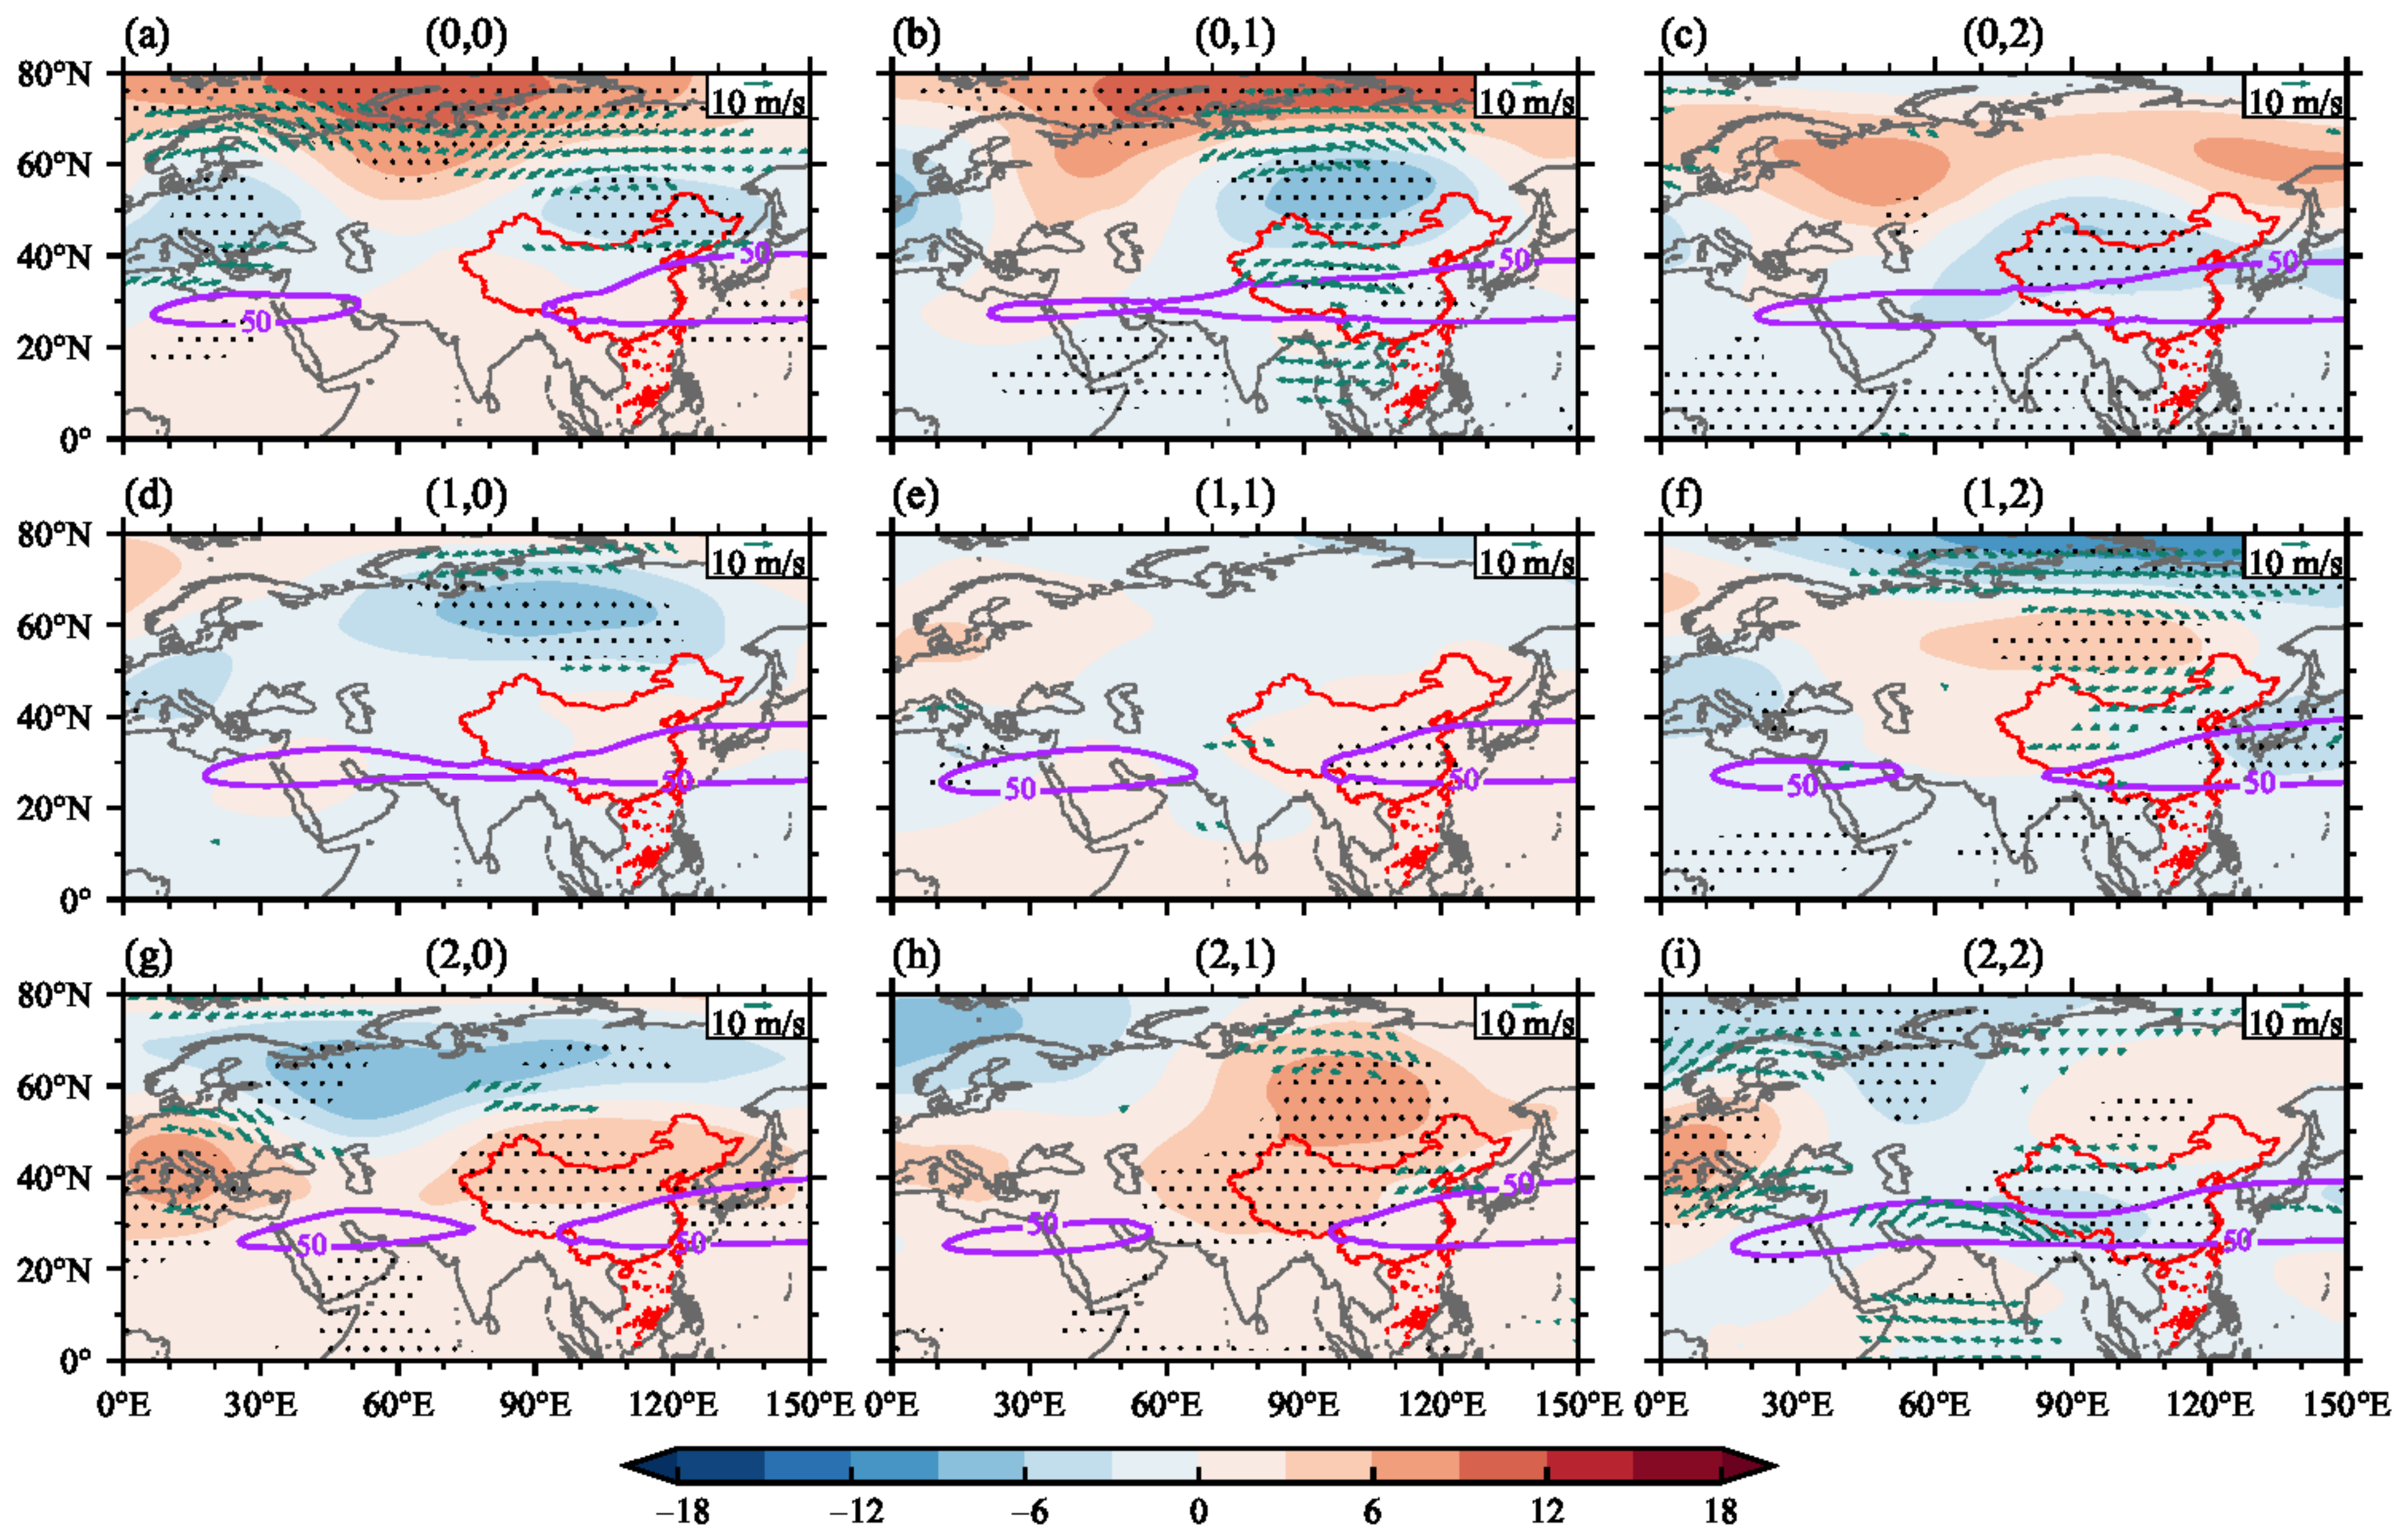
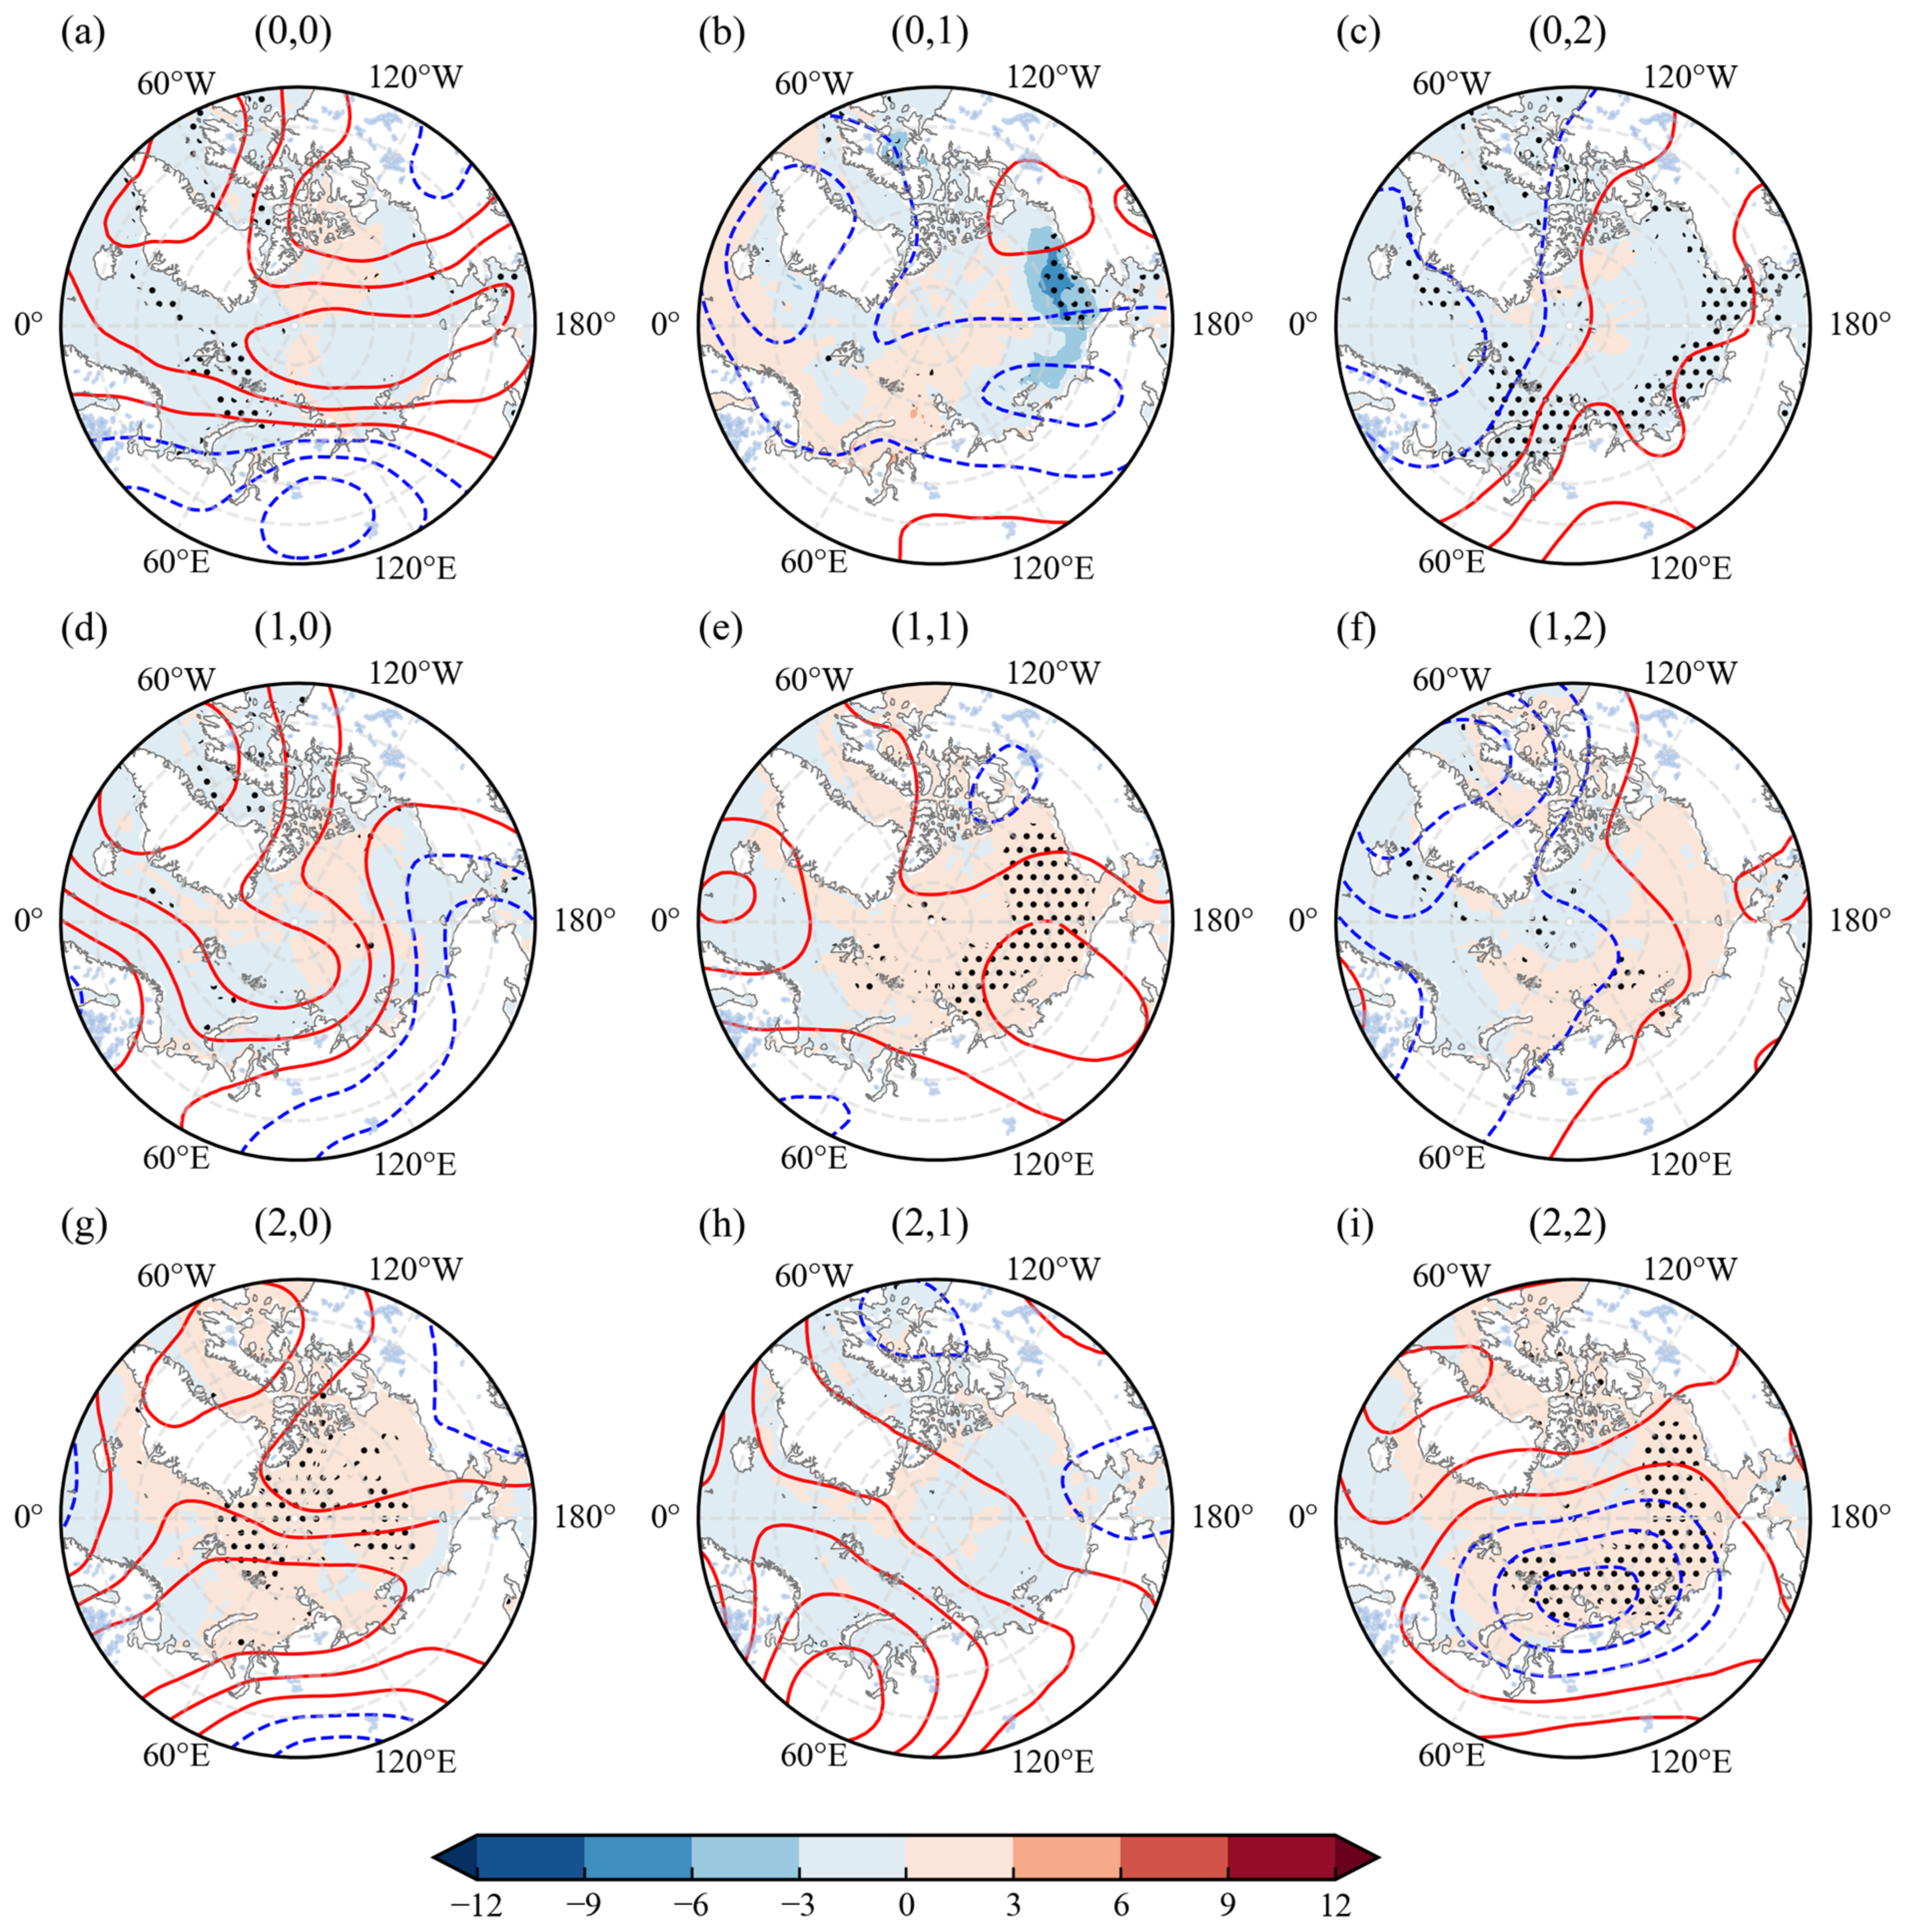
4.2. The SOM Modes
4.3. Association between SOM Modes and Large-Scale Circulation
5. Conclusions and Discussion
Author Contributions
Funding
Institutional Review Board Statement
Informed Consent Statement
Data Availability Statement
Acknowledgments
Conflicts of Interest
References
- Zheng, F.; Liu, J.P.; Fang, X.H.; Song, M.R.; Yang, C.Y.; Yuan, Y.; Li, K.X.; Wang, J.; Zhu, J. The predictability of ocean environments that contributed to the 2020/21 extreme cold events in China: 2020/21 La Niña and 2020 Arctic sea ice loss. Adv. Atmos. Sci. 2022, 39, 658–672. [Google Scholar] [CrossRef]
- Zheng, F.; Yuan, Y.; Ding, Y.; Li, K.; Fang, X.; Zhao, Y.; Sun, Y.; Zhu, J.; Ke, Z.; Wang, J.; et al. The 2020/21 extremely cold winter in China influenced by the synergistic effect of La Niña and warm Arctic. Adv. Atmos. Sci. 2022, 39, 546–552. [Google Scholar] [CrossRef]
- Bueh, C.; Peng, J.; Lin, D.; Chen, B. On the two successive supercold waves straddling the end of 2020 and the beginning of 2021. Adv. Atmos. Sci. 2022, 39, 591–608. [Google Scholar] [CrossRef]
- Yao, Y.; Zhang, W.; Luo, D.; Zhong, L.; Pei, L. Seasonal cumulative effect of Ural blocking episodes on the frequent cold events in China during the early winter of 2020/21. Adv. Atmos. Sci. 2022, 39, 609–624. [Google Scholar] [CrossRef]
- Yuan, C.; Li, W. Variations in the frequency of winter extreme cold days in northern China and possible causalities. J. Clim. 2019, 32, 8127–8141. [Google Scholar] [CrossRef]
- Li, X.; Sun, J.; Zhang, M.; Zhang, Y.; Ma, J. Possible connection between declining Barents Sea ice and interdecadal increasing northeast China precipitation in May. Int. J. Climatol. 2021, 41, 6270–6282. [Google Scholar] [CrossRef]
- Ding, F.; Li, C. Subtropical westerly jet waveguide and winter persistent heavy rainfall in south China. J. Geophys. Res. Atmos. 2017, 122, 7385–7400. [Google Scholar] [CrossRef]
- Li, X.; Wen, Z.; Huang, W.R. Modulation of South Asian Jet wave train on the extreme winter precipitation over Southeast China: Comparison between 2015/16 and 2018/19. J. Clim. 2020, 33, 4065–4081. [Google Scholar] [CrossRef] [Green Version]
- Hu, K.; Huang, G.; Wu, R.; Wang, L. Structure and dynamics of a wave train along the wintertime Asian jet and its impact on East Asian climate. Clim. Dyn. 2018, 51, 4123–4137. [Google Scholar] [CrossRef]
- Ding, Y. A statistical study of winter monsoons in East Asia. J. Trop. Meteorol. 1990, 6, 119–128. [Google Scholar]
- Zhai, P.; Yu, R.; Guo, Y.; Li, Q.; Ren, X.; Wang, Y.; Xu, W.; Liu, Y.; Ding, Y. The strong El Niño of 2015/16 and its dominant impacts on global and China’s climate. J. Meteorol. Res. 2016, 30, 283–297. [Google Scholar] [CrossRef]
- Zhou, L.; Wu, R. Respective impacts of the East Asian winter monsoon and ENSO on winter rainfall in China. J. Geophys. Res. Atmos. 2010, 115, D2. [Google Scholar] [CrossRef]
- Zhou, L.T. Impact of East Asian winter monsoon on rainfall over southeastern China and its dynamical process. Int. J. Climatol. 2011, 31, 677–686. [Google Scholar] [CrossRef]
- Kim, J.-W.; Yeh, S.-W.; Chang, E.-C. Combined effect of El Niño-Southern Oscillation and Pacific decadal oscillation on the East Asian winter monsoon. Clim. Dyn. 2014, 42, 957–971. [Google Scholar] [CrossRef]
- Ma, T.; Chen, W.; Feng, J.; Wu, R. Modulation effects of the East Asian winter monsoon on El Niño-related rainfall anomalies in southeastern China. Sci. Rep. 2018, 8, 1–9. [Google Scholar] [CrossRef] [Green Version]
- Gao, T.; Zhang, Q.; Luo, M. Intensifying effects of El Niño events on winter precipitation extremes in southeastern China. Clim. Dyn. 2020, 54, 631–648. [Google Scholar] [CrossRef]
- Zhang, R.; Sumi, A.; Kimoto, M. A diagnostic study of the impact of El Niño on the precipitation in China. Adv. Atmos. Sci. 1999, 16, 229–241. [Google Scholar] [CrossRef]
- Gao, H.; Yang, S. A severe drought event in northern China in winter 2008–2009 and the possible influences of La Niña and Tibetan Plateau. J. Geophys. Res. Atmos. 2009, 114, D24. [Google Scholar] [CrossRef]
- Yuan, Y.U.A.N.; Li, C.; Yang, S. Decadal anomalies of winter precipitation over southern China in association with El Niño and La Niña. J. Meteorol. Res. 2014, 28, 91–110. [Google Scholar] [CrossRef]
- Wen, M.; Yang, S.; Kumar, A.; Zhang, P. An analysis of the large-scale climate anomalies associated with the snowstorms affecting China in January 2008. Mon. Weather Rev. 2009, 137, 1111–1131. [Google Scholar] [CrossRef]
- Cheung, H.N.; Zhou, W.; Mok, H.Y.; Wu, M.C. Relationship between Ural–Siberian blocking and the East Asian winter monsoon in relation to the Arctic Oscillation and the El Niño–Southern Oscillation. J. Clim. 2012, 25, 4242–4257. [Google Scholar] [CrossRef]
- Wang, S.; Liu, J.; Cheng, X.; Kerzenmacher, T.; Li, H.; Lu, R.; Hu, Y.; Chen, Z.; Braesicke, P. Has substantial sea ice loss along the Siberian coast contributed to the 2020/2021 winter cold wave in China? Int. J. Climatol. 2022, 42, 1–14. [Google Scholar] [CrossRef]
- Wang, C.; Yao, Y.; Wang, H.; Sun, X.; Zheng, J. The 2020 summer floods and 2020/21 winter extreme cold surges in China and the 2020 typhoon season in the Western North Pacific. Adv. Atmos. Sci. 2021, 38, 896–904. [Google Scholar] [CrossRef] [PubMed]
- Tang, Q.; Zhang, X.; Francis, J. Extreme summer weather in northern mid-latitudes linked to a vanishing cryosphere. Nat. Clim. Change 2014, 4, 45–50. [Google Scholar] [CrossRef]
- Hoffmann, L.; Günther, G.; Li, D.; Stein, O.; Wu, X.; Griessbach, S.; Heng, Y.; Konopka, P.; Müller, R.; Vogel, B.; et al. From ERA-Interim to ERA5: The considerable impact of ECMWF’s next-generation reanalysis on Lagrangian transport simulations. Atmos. Chem. Phys. 2019, 19, 3097–3124. [Google Scholar] [CrossRef] [Green Version]
- Hersbach, H.; Bell, B.; Berrisford, P.; Hirahara, S.; Horányi, A.; Muñoz-Sabater, J.; Nicolas, J.; Peubey, C.; Radu, R.; Schepers, D.; et al. The ERA5 global reanalysis. Q. J. R. Meteorol. Soc. 2020, 146, 1999–2049. [Google Scholar] [CrossRef]
- Feng, J.; Zhang, Y.; Ke, C. Relationship between Winter Precipitation in Barents–Kara Seas and September–October Eastern Siberian Sea Ice Anomalies. Appl. Sci. 2019, 9, 1091. [Google Scholar] [CrossRef] [Green Version]
- Lim, E.P.; Hudson, D.; Wheeler, M.C.; Marshall, A.G.; King, A.; Zhu, H.; Hendon, H.H.; de Burgh-Day, C.; Trewin, B.; Griffiths, M.; et al. Why Australia was not wet during spring 2020 despite La Niña. Sci. Rep. 2021, 11, 1–15. [Google Scholar] [CrossRef]
- Kohonen, T. Self-organized formation of topologically correct feature maps. Biol. Cybern. 1982, 43, 59–69. [Google Scholar] [CrossRef]
- Johnson, N.C.; Feldstein, S.B.; Tremblay, B. The continuum of Northern Hemisphere teleconnection patterns and a description of the NAO shift with the use of self-organizing maps. J. Clim. 2008, 21, 6354–6371. [Google Scholar] [CrossRef] [Green Version]
- Yuan, J.; Tan, B.; Feldstein, S.B.; Lee, S. Wintertime North Pacific teleconnection patterns: Seasonal and interannual variability. J. Clim. 2015, 28, 8247–8263. [Google Scholar] [CrossRef] [Green Version]
- Lee, M.H.; Lee, S.; Song, H.J.; Ho, C.H. The recent increase in the occurrence of a boreal summer teleconnection and its relationship with temperature extremes. J. Clim. 2017, 30, 7493–7504. [Google Scholar] [CrossRef]
- Yu, L.; Zhong, S.; Sun, B. Trends in the occurrence of pan-Arctic warm extremes in the past four decades. Int. J. Climatol. 2021, 41, 4460–4477. [Google Scholar] [CrossRef]
- Johnson, N.C.; Feldstein, S.B. The continuum of North Pacific sea level pressure patterns: Intraseasonal, interannual, and interdecadal variability. J. Clim. 2010, 23, 851–867. [Google Scholar] [CrossRef] [Green Version]
- Trenberth, K.E. Climate diagnostics from global analyses: Conservation of mass in ECMWF analyses. J. Clim. 1991, 4, 707–722. [Google Scholar] [CrossRef]
- Li, C.; Sun, J. Role of the Subtropical Westerly Jet Waveguide in a Southern China Heavy Rainstorm in December 2013. Adv. Atmos. Sci. 2015, 32, 601–612. [Google Scholar] [CrossRef]
- Lind, S.; Ingvaldsen, R.B.; Furevik, T. Arctic warming hotspot in the northern Barents Sea linked to declining sea-ice import. Nat. Clim. Change 2018, 8, 634–639. [Google Scholar] [CrossRef]
- Budikova, D.; Ford, T.W.; Ballinger, T.J. United States heat wave frequency and Arctic Ocean marginal sea ice variability. J. Geophys. Res. Atmos. 2019, 124, 6247–6264. [Google Scholar] [CrossRef]
- Zhang, R.; Sun, C.; LI, W. Relationship between the interannual variations of Arctic sea ice and summer Eurasian teleconnection and associated influence on summer precipitation over China. Chin. J. Geophys. 2018, 61, 91–105. [Google Scholar] [CrossRef]
- Berghuijs, W.R.; Hrachowitz Woods, M. A precipitation shift from snow towards rain leads to a decrease in streamflow. Nat. Clim. Change 2014, 4, 583–586. [Google Scholar] [CrossRef] [Green Version]
- Sun, H.; Liu, X. Impacts of dynamic and thermal forcing by the Tibetan Plateau on the precipitation distribution in the Asian arid and monsoon regions. Clim. Dyn. 2021, 56, 2339–2358. [Google Scholar] [CrossRef]
- Su, B.; Xiao, C.; Zhao, H.; Huang, Y.; Dou, T.; Wang, X.; Chen, D. Estimated changes in different forms of precipitation (snow, sleet, and rain) across China:1961–2016. Atmos. Res. 2022, 270, 106078. [Google Scholar] [CrossRef]
- Hanzhe, L.M. The Role of Warm North Atlantic SST in the Formation of Positive Height Anomalies over the Ural Mountains during January 2008. Adv. Atmos. Sci. 2011, 28, 246–256. [Google Scholar]
- Geng, X.; Zhang, W.; Xiang, Y.; Jiang, F. Dominant spatiotemporal variability of wintertime precipitation days in China and the linkage with large-scale climate drivers. Int. J. Climatol. 2021, 41, 3561–3577. [Google Scholar] [CrossRef]


Disclaimer/Publisher’s Note: The statements, opinions and data contained in all publications are solely those of the individual author(s) and contributor(s) and not of MDPI and/or the editor(s). MDPI and/or the editor(s) disclaim responsibility for any injury to people or property resulting from any ideas, methods, instructions or products referred to in the content. |
© 2023 by the authors. Licensee MDPI, Basel, Switzerland. This article is an open access article distributed under the terms and conditions of the Creative Commons Attribution (CC BY) license (https://creativecommons.org/licenses/by/4.0/).
Share and Cite
Zhang, Z.; Gu, Y.; Wang, Z.; Luo, S.; Sun, S.; Wang, S.; Feng, G. Application of the Self-Organizing Map Method in February Temperature and Precipitation Pattern over China: Comparison between 2021 and 2022. Atmosphere 2023, 14, 1182. https://doi.org/10.3390/atmos14071182
Zhang Z, Gu Y, Wang Z, Luo S, Sun S, Wang S, Feng G. Application of the Self-Organizing Map Method in February Temperature and Precipitation Pattern over China: Comparison between 2021 and 2022. Atmosphere. 2023; 14(7):1182. https://doi.org/10.3390/atmos14071182
Chicago/Turabian StyleZhang, Zengping, Yu Gu, Zhikuan Wang, Siyuan Luo, Siyuan Sun, Shuting Wang, and Guolin Feng. 2023. "Application of the Self-Organizing Map Method in February Temperature and Precipitation Pattern over China: Comparison between 2021 and 2022" Atmosphere 14, no. 7: 1182. https://doi.org/10.3390/atmos14071182