Article

Development and Application of a Novel Snow Peak Sighting Forecast System over Chengdu

1
College of Architecture and Environment, Sichuan University, Chengdu 610065, China
2
Institute of Environmental Forecast, Chengdu Academy of Environmental Sciences, Chengdu 610072, China
3
College of Resources and Environment, Chengdu University of Information Technology, Chengdu 610225, China
4
Chengdu Meteorological Service Center, Chengdu Meteorological Bureau, Chengdu 610072, China
*
Author to whom correspondence should be addressed.
Atmosphere 2023, 14(7), 1181; https://doi.org/10.3390/atmos14071181
Submission received: 3 June 2023 / Revised: 9 July 2023 / Accepted: 17 July 2023 / Published: 21 July 2023
(This article belongs to the Section Atmospheric Techniques, Instruments, and Modeling)

Abstract

:
As air quality has improved rapidly in recent years, the public has become more interested in whether a famous snow peak, Yaomei Feng on the Tibetan Plateau, can be seen from Chengdu, a megacity located on the western plain of the Sichuan Basin, east of the plateau. Therefore, a threshold-method-based forecasting system for snow peak sighting was developed in this study. Variables from numerical models, including cloud–water mixing ratio, cloud cover over snow peak, water mixing ratio, PM2.5 concentration, and ground solar radiation, were used in the snow peak sighting forecast system. Terrain occlusion rate of each model grid was calculated. Monte Carlo simulations were applied for threshold determination. A WRF-CMAQ hindcast was conducted for 2020, owing to insufficient observation data, hindcast results on the snow peak sighting were compared with posts collected from social media. Estimations showed that the snow peak sighting forecast system performed well in reflecting the monthly trend of snow peak sightings, and the hindcast results matched the daily observations, especially from May to August. Accuracy of the snow peak sighting forecast model was 78.9%, recall value was 57.1%, and precision was 24.4%.

1. Introduction

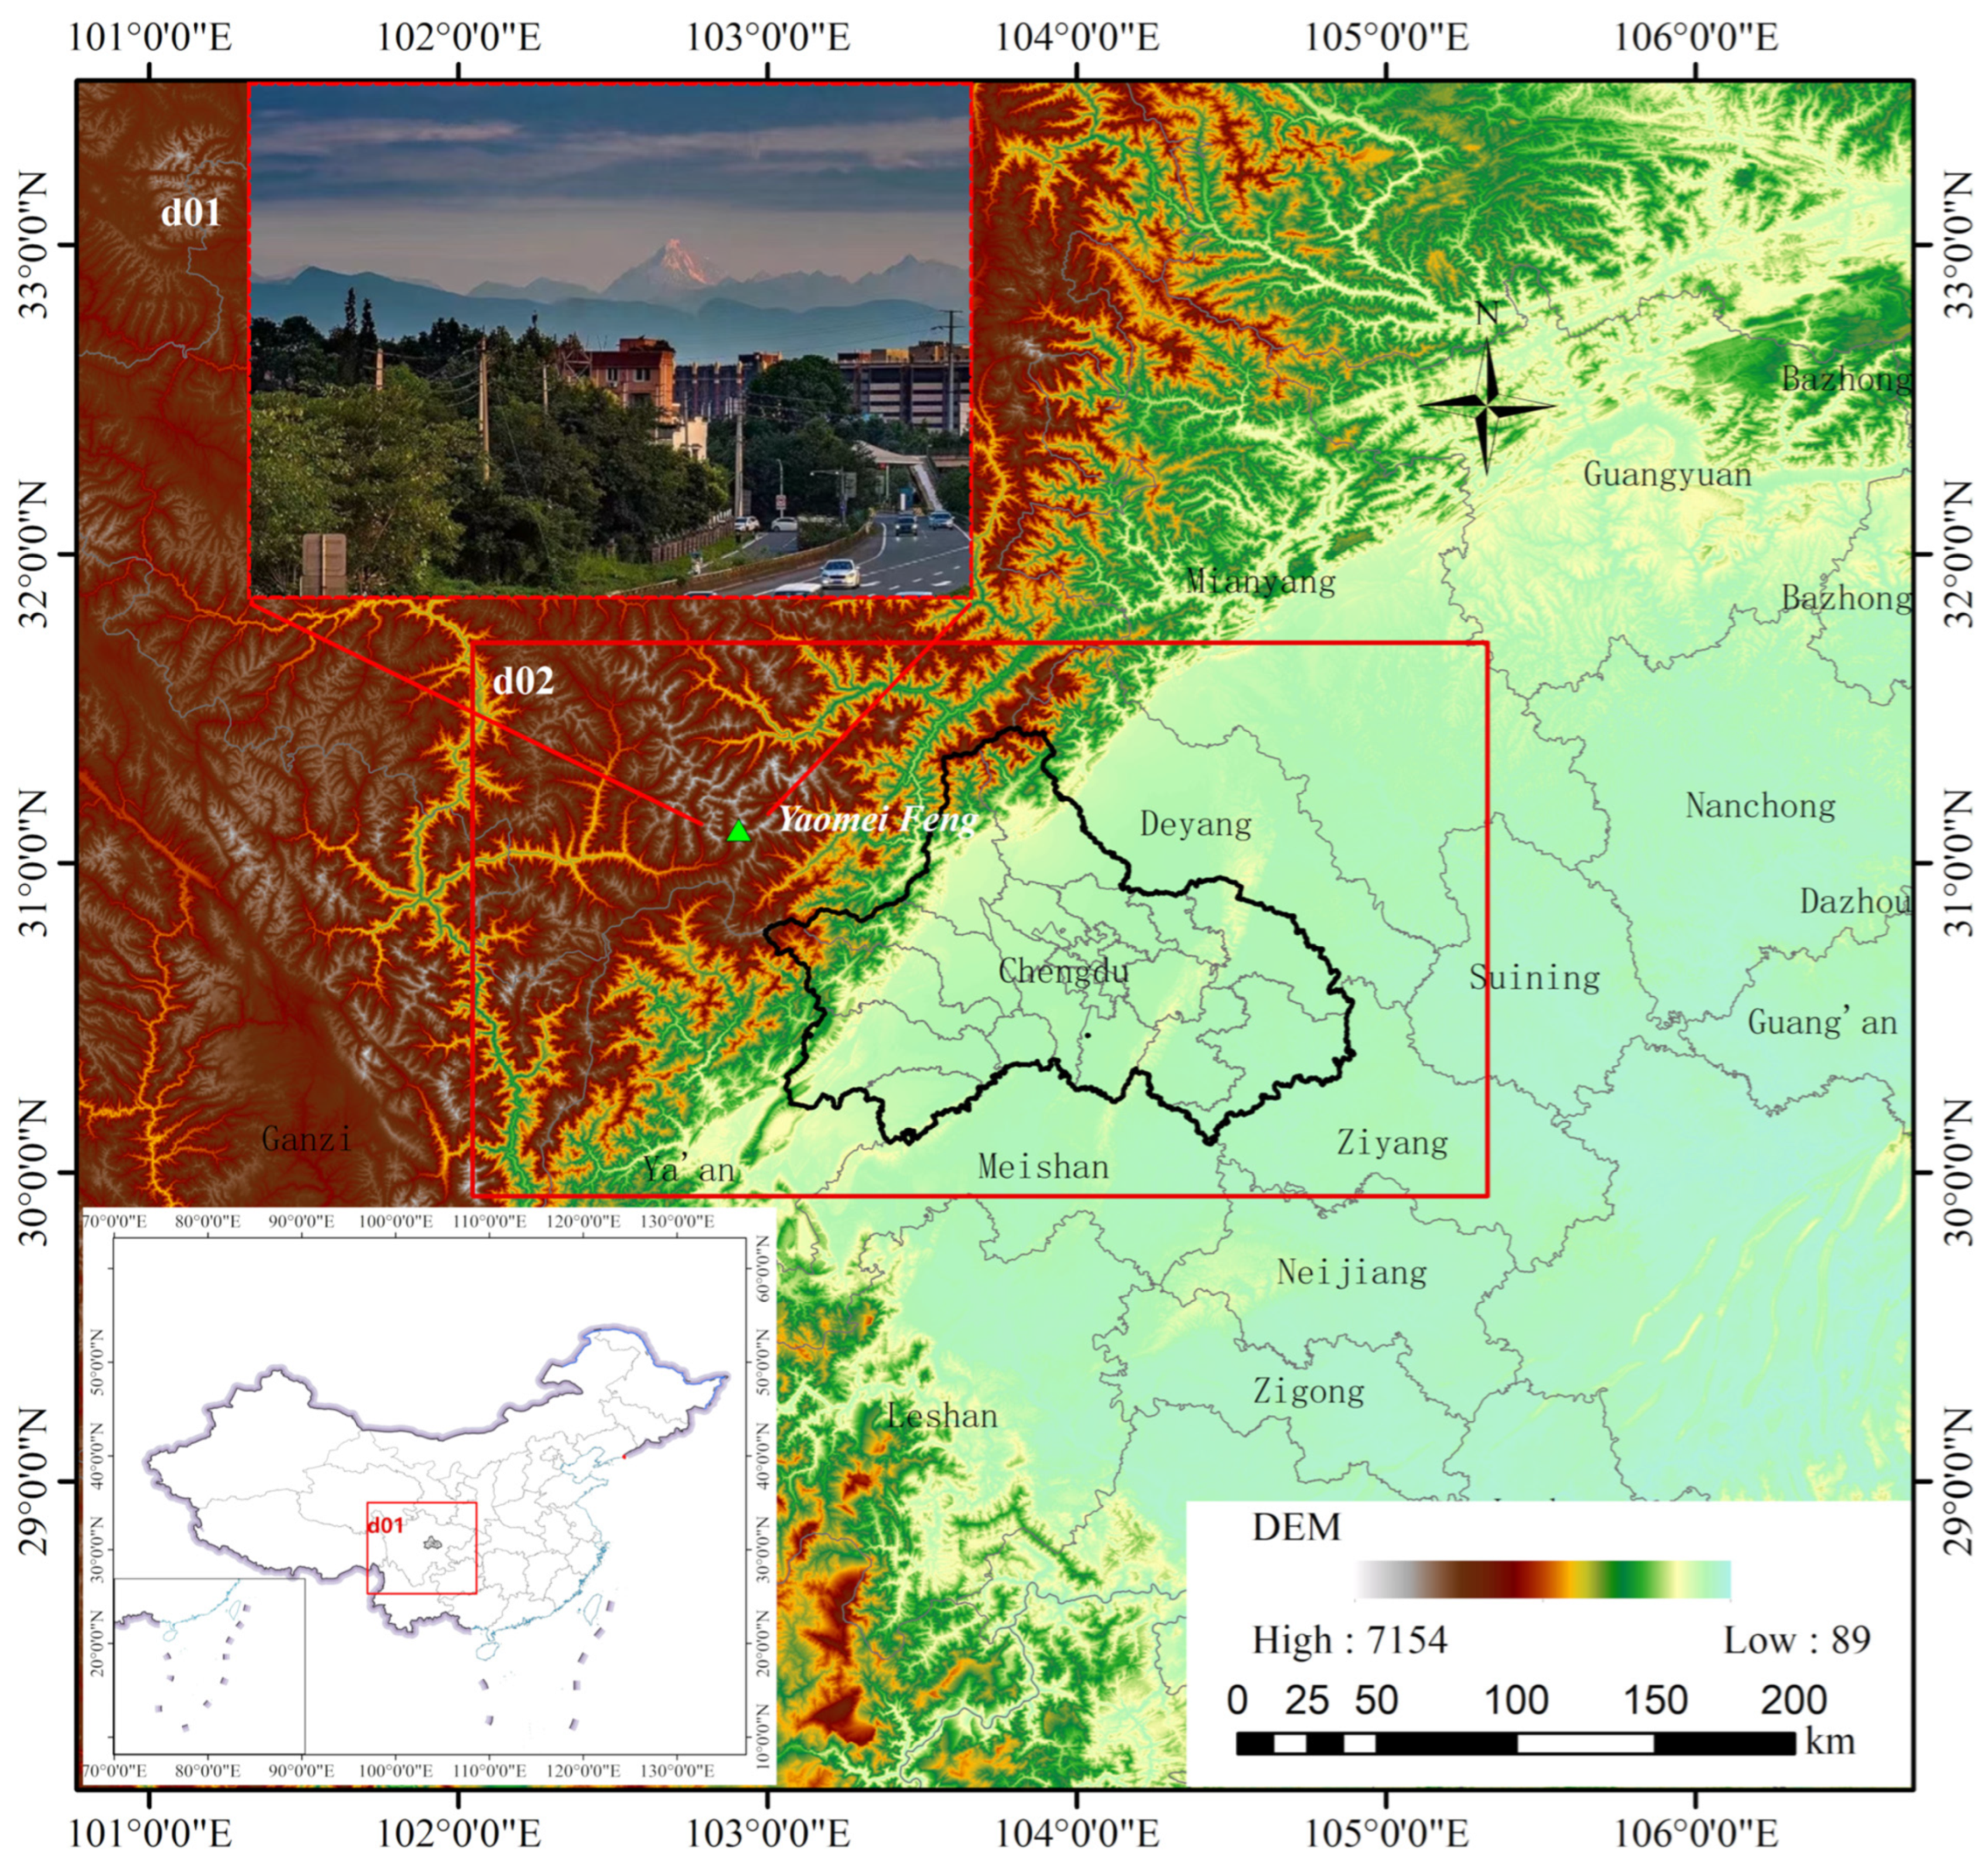
Chengdu is a megacity located on the eastern edge of the Tibetan Plateau, with a population of over 20 million and a vehicle count of over 6 million. Chengdu has been described as a “park city under the snowy peaks” because of the beautiful view of the snowy hills of the Qionglai Mountains on the Tibetan Plateau from the city. Approximately 1200 years ago, Chinese poet Du Fu paid tribute to this place by writing in his famous poem “Jueju, third in a set of four” while he was living in Chengdu in the year 764: “Framed in my window, the thousand autumn snows of the western peaks, tied by my gate, a boat to take me ten thousand miles east to Wu” [1].
Although the anthropogenic emissions in Chengdu from industry, transportation and residents are massive, the city has seen significant improvements in air quality. The number of days with good and moderate air quality increased from 214 days in 2015 to 299 days in 2021, and the annual average PM2.5 concentration dropped from 57.4 μg/m3 in 2015 to 39.8 μg/m3 in 2021. Yaomei Feng of the Qionglai Mountains on the Tibetan Plateau has also been observed in Chengdu on more days because of improved air quality. The sight of snowy peaks is not only a city attraction, but also a testimony to the improvement of air quality. Since 2021, the Chengdu Meteorological Bureau has made empirical forecasts of snow peak observations based on weather forecasts. However, these empirical forecasts are dependent on individual subjective experience and are relatively unstable, so an objective forecasting system for snow peak sighting was developed in this study to meet current needs.
The ability to observe the snow-capped mountains depends on two main factors: the effect of visibility and the effect of terrain obscuration. Visibility is mainly influenced by pollutant concentrations and meteorological conditions [2,3,4]. Under dry or low PM2.5 concentrations, PM2.5 concentrations dominate visibility, and the contribution of humidity becomes increasingly important as PM2.5 concentrations and humidity increase [5]. Zhou et al. [6] constructed a generalized linear model to estimate the site-specific effects of PM2.5 and relative humidity on visibility based on data from 190 monitoring stations in 182 cities in China. The researchers found that both PM2.5 and relative humidity had significant nonlinear negative effects on visibility. Liu et al. [7] also found that organic matter and NH4NO3 in PM2.5 had a great influence on visibility in Chengdu.
Meteorological services on landscapes have been widely carried out in China in recent years, and cloudscapes were forecasted by DING et al. [8] using multiple models, including logistic regression, support vector machine, decision tree analysis, and empirical prediction. The cloudscape on Emei Mountain was also predicted by Tao et al. [9]. Chengdu is in a complex topographic area on the eastern edge of the Tibetan Plateau [10] and is surrounded by Longmen Mountain and Longquan Mountain, making it impossible to observe snow-capped mountains in a part of Chengdu without terrain obstruction; thus, in addition to visibility effects, terrain obstruction is a factor that should be considered when determining whether snow-capped mountains can be observed. The study tested terrain occlusion using high-resolution digital elevation model (DEM) data [11]. In combination with in-grid multi-point sampling detection, each grid was assigned a terrain occlusion rate, which was used to indicate the probability that the grid might be occluded by terrain, and the probability was applied to the forecast system.
Currently, most research related to snow peak observations relies on remote sensing technology. For instance, D. H. Shugar et al. [12] employed satellite imagery, seismic records, numeric model results, and eyewitness videos to analysis a massive rock and ice avalanche disaster in 2021. Another study conducted by Ya-Lun S. Tsai et al. [13] reviewed snow cover remote sensing using spaceborne synthetic aperture radar, emphasizing the importance of snow cover monitoring. In complex landscapes, satellite-based snow cover monitoring has been widely implemented, Kostadinov et al. [14] developed a lidar-based method to detect snow cover under canopy, and introduced a correction factor to improve satellite-derived fractional snow cover area products. Gascoin et al. [15] estimated the snow cover in open terrain based on Sentinel-2 data using a normalized difference snow index. Muhuri et al. [16] assessed the performance of the operational snow detection and fractional snow cover estimation algorithms for high-resolution snow and ice monitoring. However, there is limited research available on predicting whether snow can be observed visually.
Based on numerical air quality forecast technology, a snow peak sighting probability (SPSP) forecast system was developed using R [17,18,19,20,21,22,23,24,25]. Weather and air quality models, including the Weather Research and Forecasting (WRF) model version 3.5 [26] and the Community Multiscale Air Quality (CMAQ) model version 5.0.2 [27], were used to provide meteorological and environmental predictions over the region. A threshold methodology was implemented to determine if snow peaks could be seen from certain locations in Chengdu. Monte-Carlo simulation was used for parameter optimization.

2. Materials and Methods

2.1. Study Area

Yaomei Feng, also known as the Fourth Girl Peak, is the highest peak of Mount Siguniang; it is in Xiaojin County, Aba Tibetan and Qiang Autonomous Prefecture, approximately 120 km west of Central Chengdu. The altitude of Yaomei Feng is 6250 m, and it is the most famous snow peak that has been visible from Chengdu for thousands of years. The study area of this work covered Chengdu and surrounding regions near Yaomei Feng.

2.2. Models and Data

WRFv3.5 was used in this study to provide high-resolution meteorological fields for snow peak sighting forecasts, land-use data was updated based on the Finer Resolution Observation and Monitoring of Global Land Cover provided by Tsinghua University [28]. As shown in Figure 1, two nested domains were configured, and a 15 km resolution coarse domain with 60 × 60 grids was used for boundary conditions, covering most parts of Sichuan province. A 3 km resolution fine domain with 101 × 66 grids was used for snow peak sighting forecast with a parent grid ratio of 1:5. Schemes include WRF single-moment 3-class microphysics scheme, RRTMG longwave and shortwave radiation scheme, 5-layer thermal diffusion surface physics, Mellor–Yamada–Nakanishi–Niino (MYNN) Level 2.5 PBL scheme, and MYNN surface layer scheme were applied, and 35 vertical layers were defined for WRF runs.
A Sparse Matrix Operator Kernel Emissions modeling system was used for anthropogenic emission processing. Localized temporal and speciation profiles were applied in this study [29], along with the emissions inventory of Sichuan Province [30]. A program named SimpleBIO [31,32] was used to generate biogenic volatile organic compounds emissions for each domain. An emission inventory downscaling tool named MEIC2CMAQ [33] was used to prepare emissions outside of Sichuan province based on the Multi-resolution Emission Inventory for China (MEIC).
CMAQ was used for air quality modeling, and Carbon Bond (CB) 05 chemical mechanism [34] and AERO6 aerosol module were configured. Shell scripts were written for operational snow peak sighting forecasting.
An atmospheric hindcast was carried out with 1.0-degree Final Operational Global Analysis data provided by the National Center for Environmental Prediction; anthropogenic emissions of Sichuan province were taken from our previous studies and updated to 2020, and emissions outside of Sichuan were downscaled from the 0.25-degree resolution MEIC version 1.3 at the base year of 2017 [35,36,37,38]. MEIC data were downscaled with 1 km resolution gridded data including land use (10.12078/2018070201), census (10.12078/2017121101) and gross domestic product (10.12078/2017121102) data from the Resource and Environment Data Cloud Platform of Chinese Academy of Sciences, available from www.resdc.cn (accessed on 13 October 2020), and gridded road length data processed using OpenStreetMap, available from www.openstreetmap.org (accessed on 21 January 2021).
In Figure 2, meteorological observations were provided by Chengdu Meteorological Office through a data exchange program involving 13 national stations. Air quality monitoring data of 35 municipal and national environmental monitoring stations were collected from Chengdu Central Environmental Monitoring Station, among them an average of seven national stations was used in model performance estimation. Meteorological and environmental observations were quality controlled by the producer according to the correspondent regulations (GB/T 35221-2017, HJ817-2018, and HJ818-2018). However, no official snow peak sighting observation data are currently available; along with the sighting notes provided by photographers, posts were collected as observations from a Chinese social media site, weibo.com. Snow peak sighting data was cross-checked using photographers’ notes and social media posts, but may still be inaccurate and incomplete.

2.3. Terrain Occlusion Judgment

Terrain occlusion judgment was performed for each model grid to determine whether the snow peak could be seen physically. A 250 m resolution DEM data from NASA’s Shuttle Radar Topography Mission was used in this study. Using the raster package, we extracted DEM data along a line from the observation site to the snow peak. Terrain occlusion was analyzed by comparing the sight line height with the actual altitude, and the snow peak was shielded if any actual elevation was higher than the sight line height unless the elevation of the first shielding position was over 5000 m, as shown in Figure 3.
A program named TOChecker [39] was used for terrain occlusion judgement in this study; 81 evenly distributed sampling points were generated inside each model grid, terrain occlusion judgment was carried out for each sampling point, and the terrain occlusion rate was defined as the ratio of shielded sampling points. Parallel computation was realized with the doParallel package in R [40].

2.4. Threshold Method for Determining Snow Peak Sighting

Owing to a lack of observations, we are unable to establishing a clear relationship between meteorological, environmental parameters, and snow peak sighting, so a threshold method was proposed. It was assumed that whether a snow peak could be seen was influenced by multiple conditions, including water vapor and aerosol light absorption, cloud cover, and solar radiation, so variables including solar radiation of the snow peak, cloud cover, water mixing ratio, and PM2.5 concentrations through the sight line were considered, as listed in Table 1.
All variables were compared with a threshold value, as shown in the following logical formula:
i f P K = i f Q C & i f C L & i f Q V M & i f Q V A & i f Q V S & i f P M & i f P M A & i f P M M & i f R S
Variables needed were extracted from the outputs of the Meteorology–Chemistry Interface Processor and the CMAQ Chemical Transport Model. Vertical layers were determined based on the line of sight height and corresponding sigma level heights of the model. Threshold values of variables were acquired using the Monte Carlo simulation method. Modeling results for each day were defined as true positive, false positive, false negative, and true negative based on a comparison with observations, as listed in Table 2.
The performance of the SPSP model with parameters generated by the Monte Carlo method was measured with recall, precision, and accuracy [41] using the formulas (2) to (4).
R e c a l l = T P T P + F N × 100 %
P r e c i s i o n = T P T P + F P × 100 %
A c c u r a c y = T P + T N T P + F N + F P + T N × 100 %

2.5. Snow Peak Sighting Probability Calculation

We assumed that snow peaks could be observed when all the variables meet the threshold values, Boolean calculations were carried out for each threshold, and results could be visualized as forecast products including time serials and spatial distribution plots. Snow peak sighting probability was defined as the ratio of hours during which snow peaks could be seen (hv) to hours that ground solar radiation of the snow peak was larger than zero (ht) for a certain period (a day, a month, or a year). Only grids with terrain occlusion rate lower than 50% were counted as valid grids. The snow peak visibility would be defined as true for a certain day if the SPSP was larger than 30% for more than 30% valid grids.

3. Results

3.1. Base Model Evaluation

Meteorological and air quality modeling performances were important for snow peak sighting forecasts, and hindcast results for January, April, July, and October 2020 were used to assess the performance of WRF and CMAQ.
Normalized mean bias (NMB), root mean square error (RMSE), and coefficient of correlation (R) were estimated. NMB was used as a normalization to facilitate a range of modeling result magnitudes; the closer to 0 the better. RMSE was used to provide information on the standard deviation of the model prediction error [42]. R was used to measure the degree of linear association between observations and model results, and normally the absolute values of R should be larger than 0.4 [43,44]. These metrics were defined in Equations (5) to (7), where M represents modeled values and O stands for observed ones:
N M B = 1 n i = 1 N M i O i 1 n i = 1 N O i
R M S E = 1 n i = 1 N ( M i O i ) 2
R = i = 1 N M i M ¯ i = 1 N O i O ¯ i = 1 N ( M i M ¯ ) 2 i = 1 N ( O i O ¯ ) 2
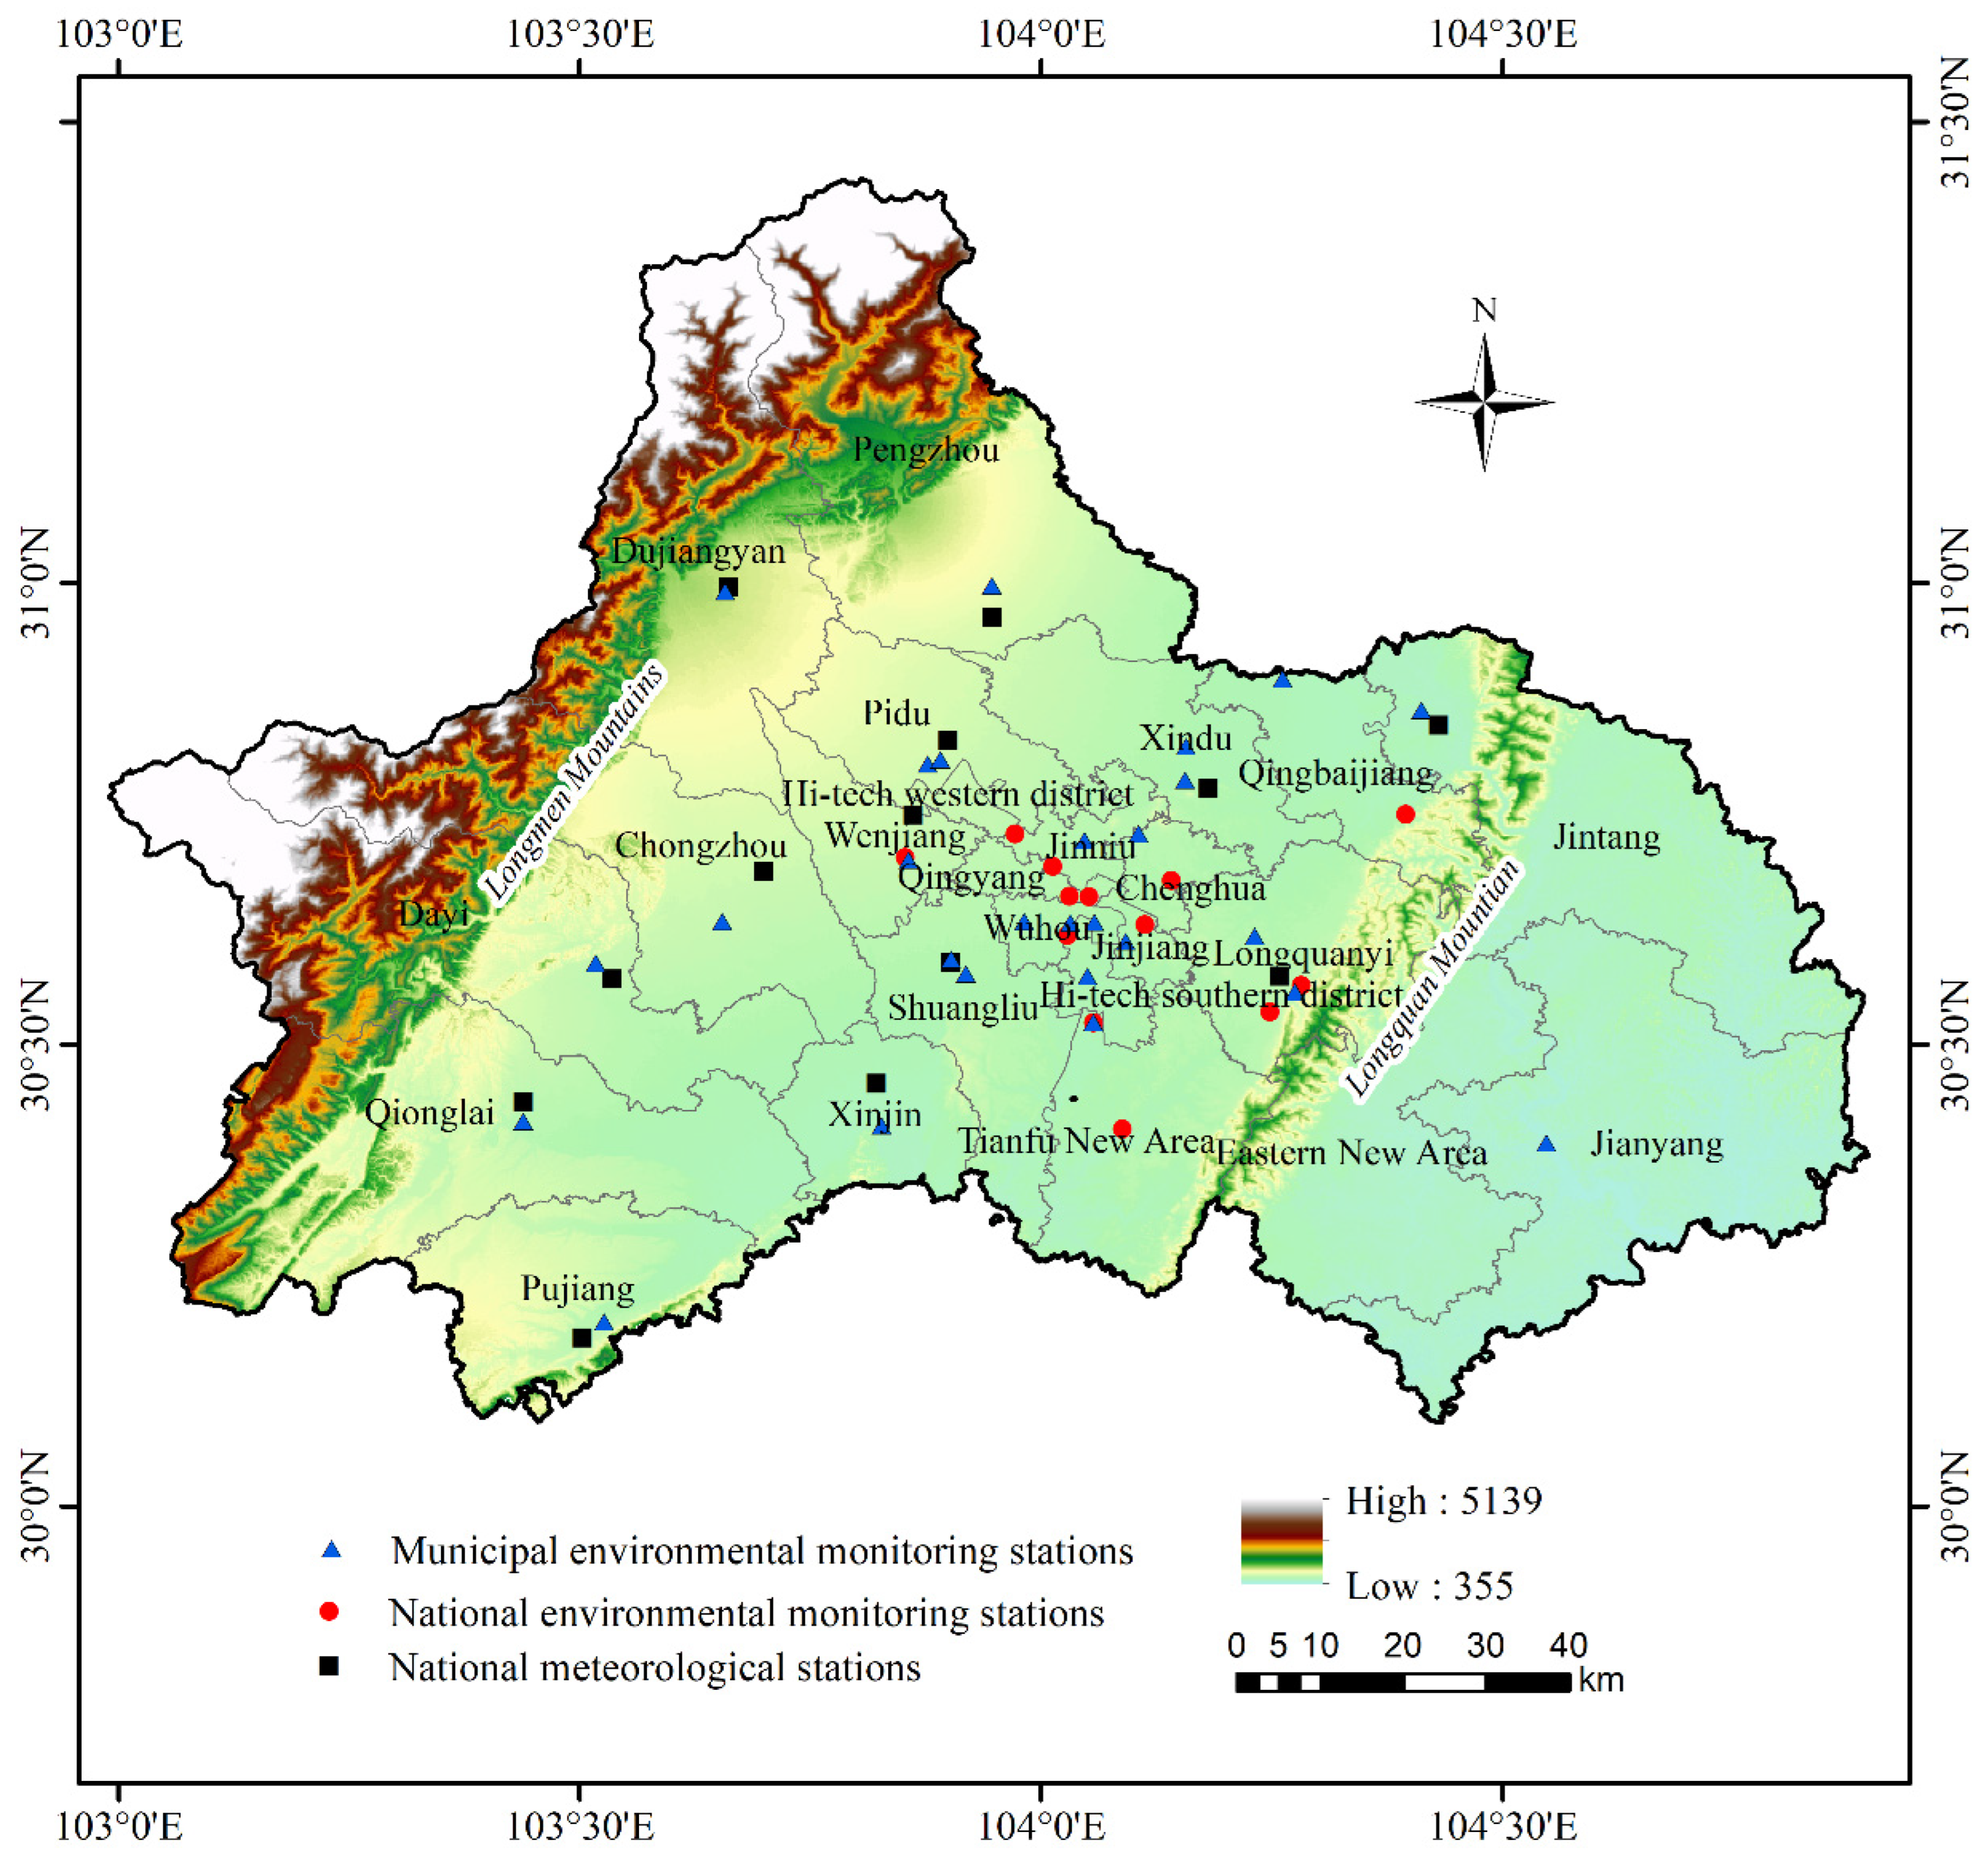
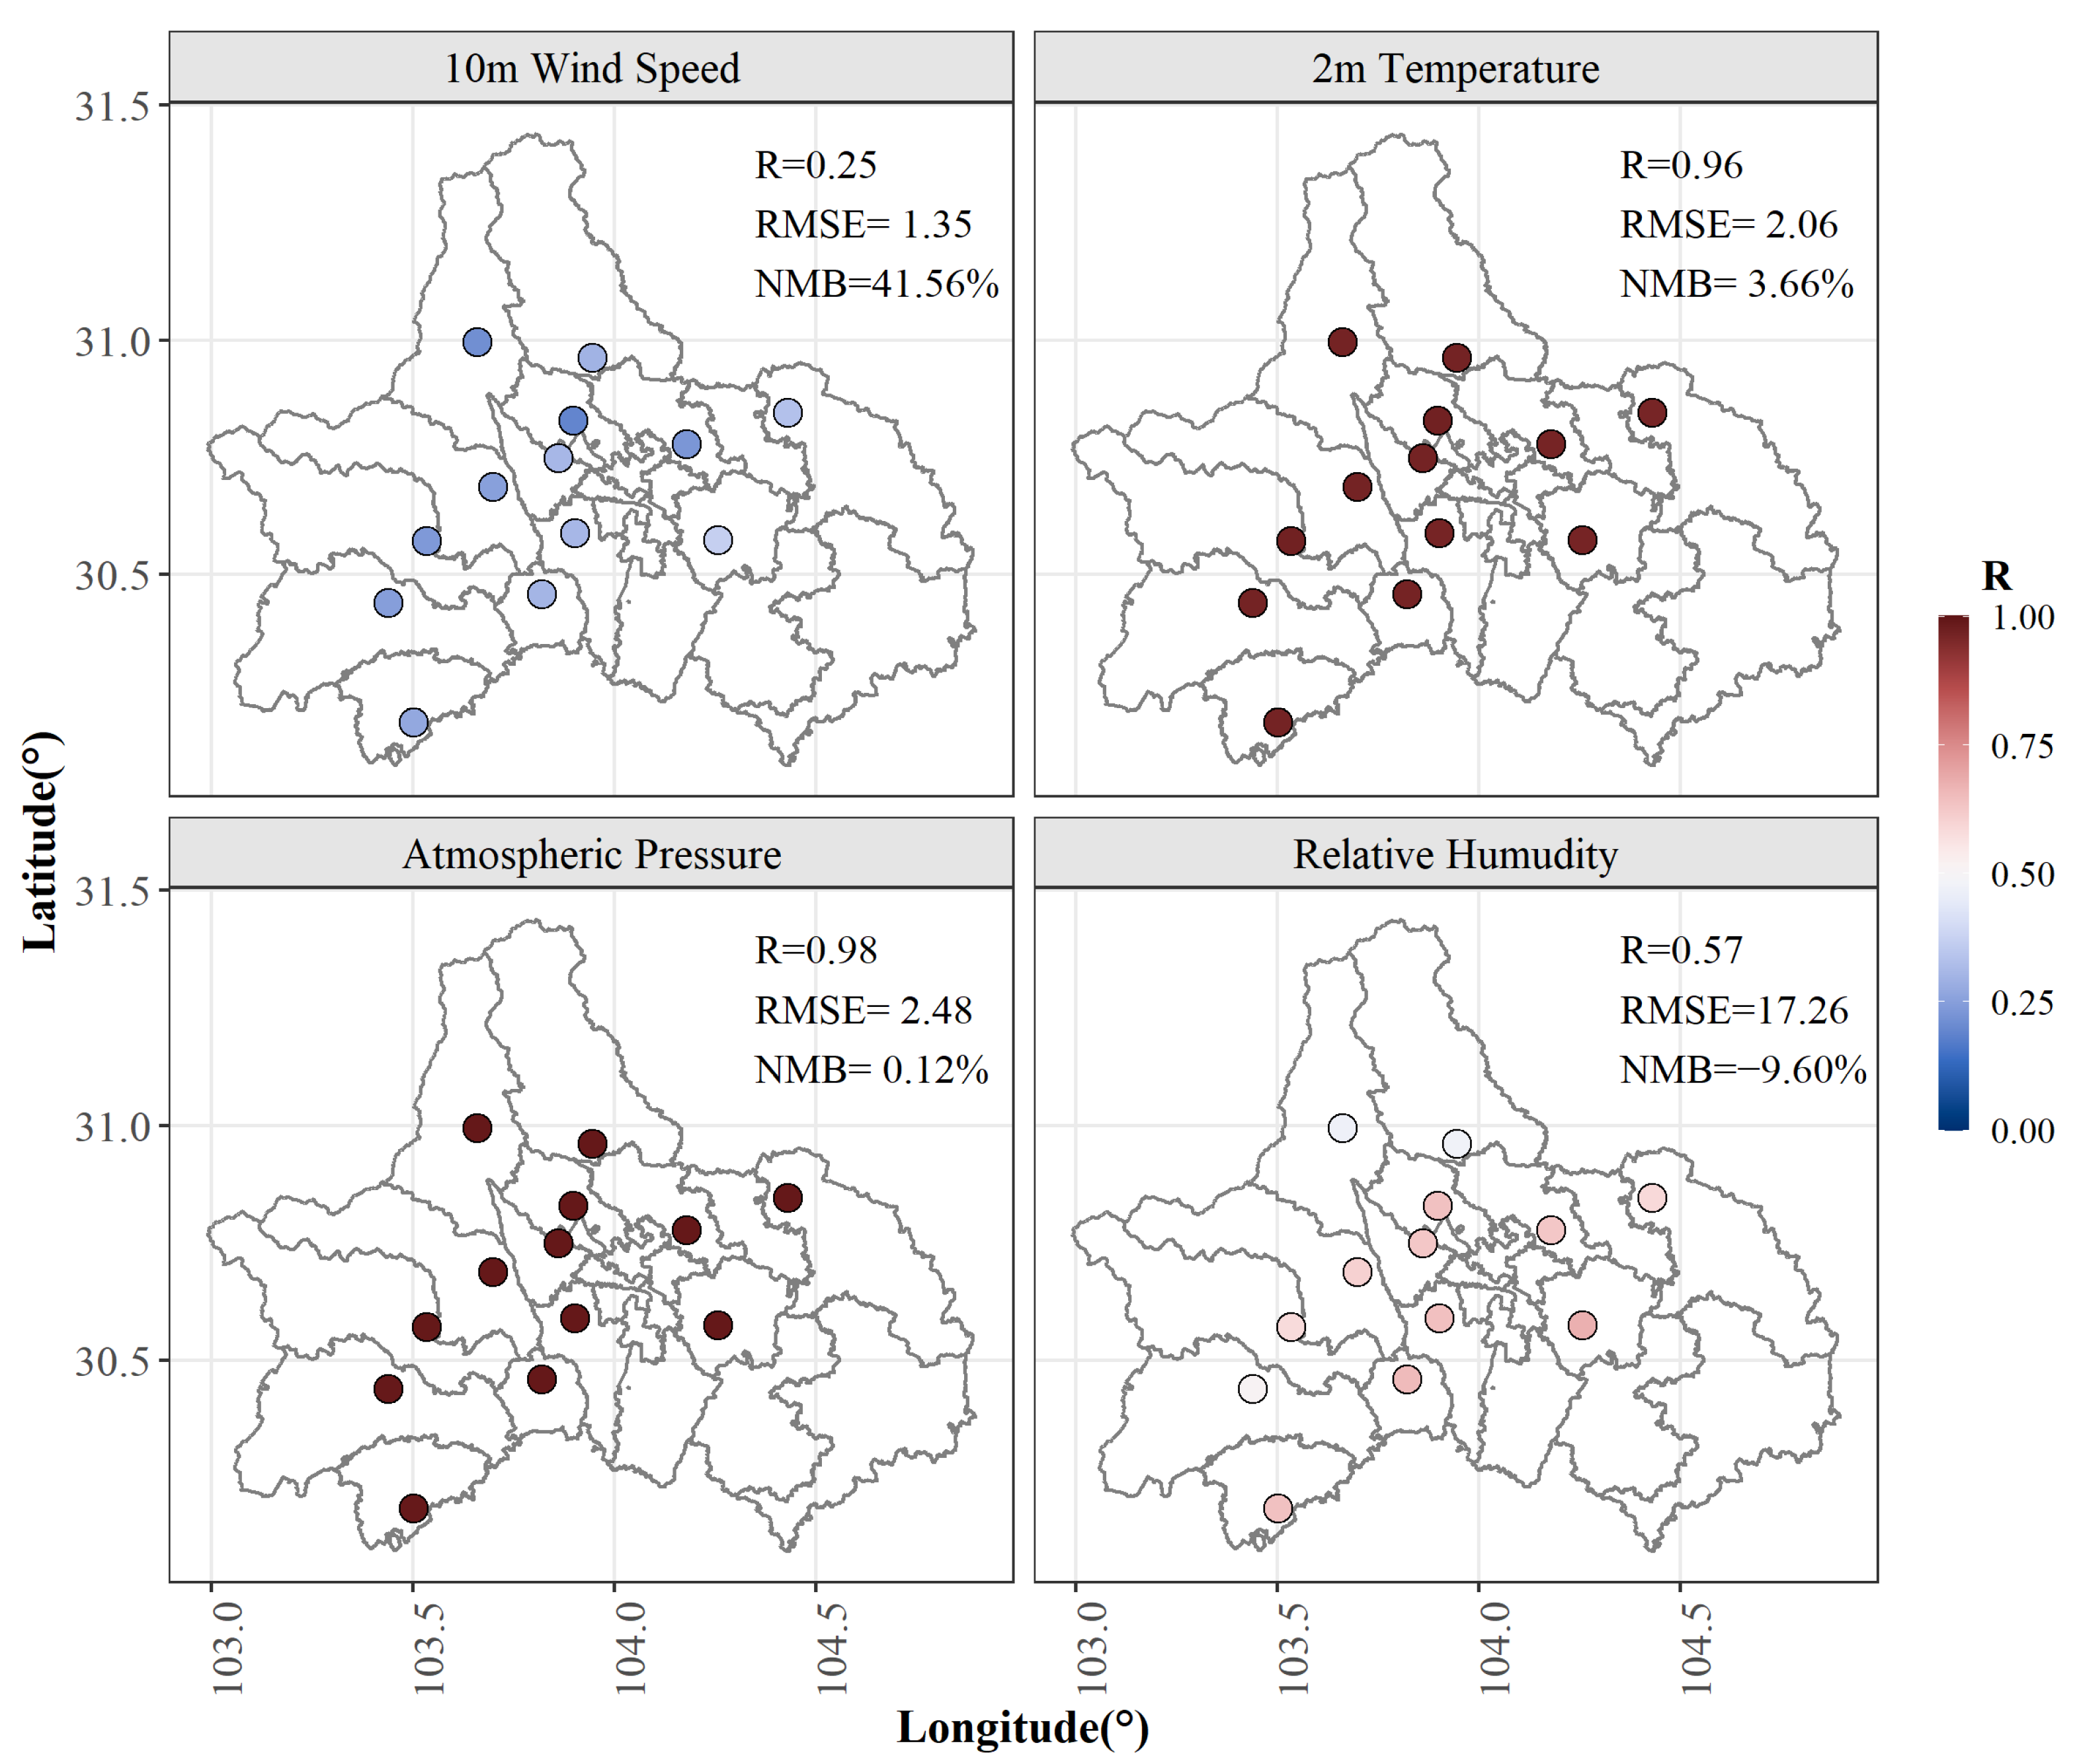
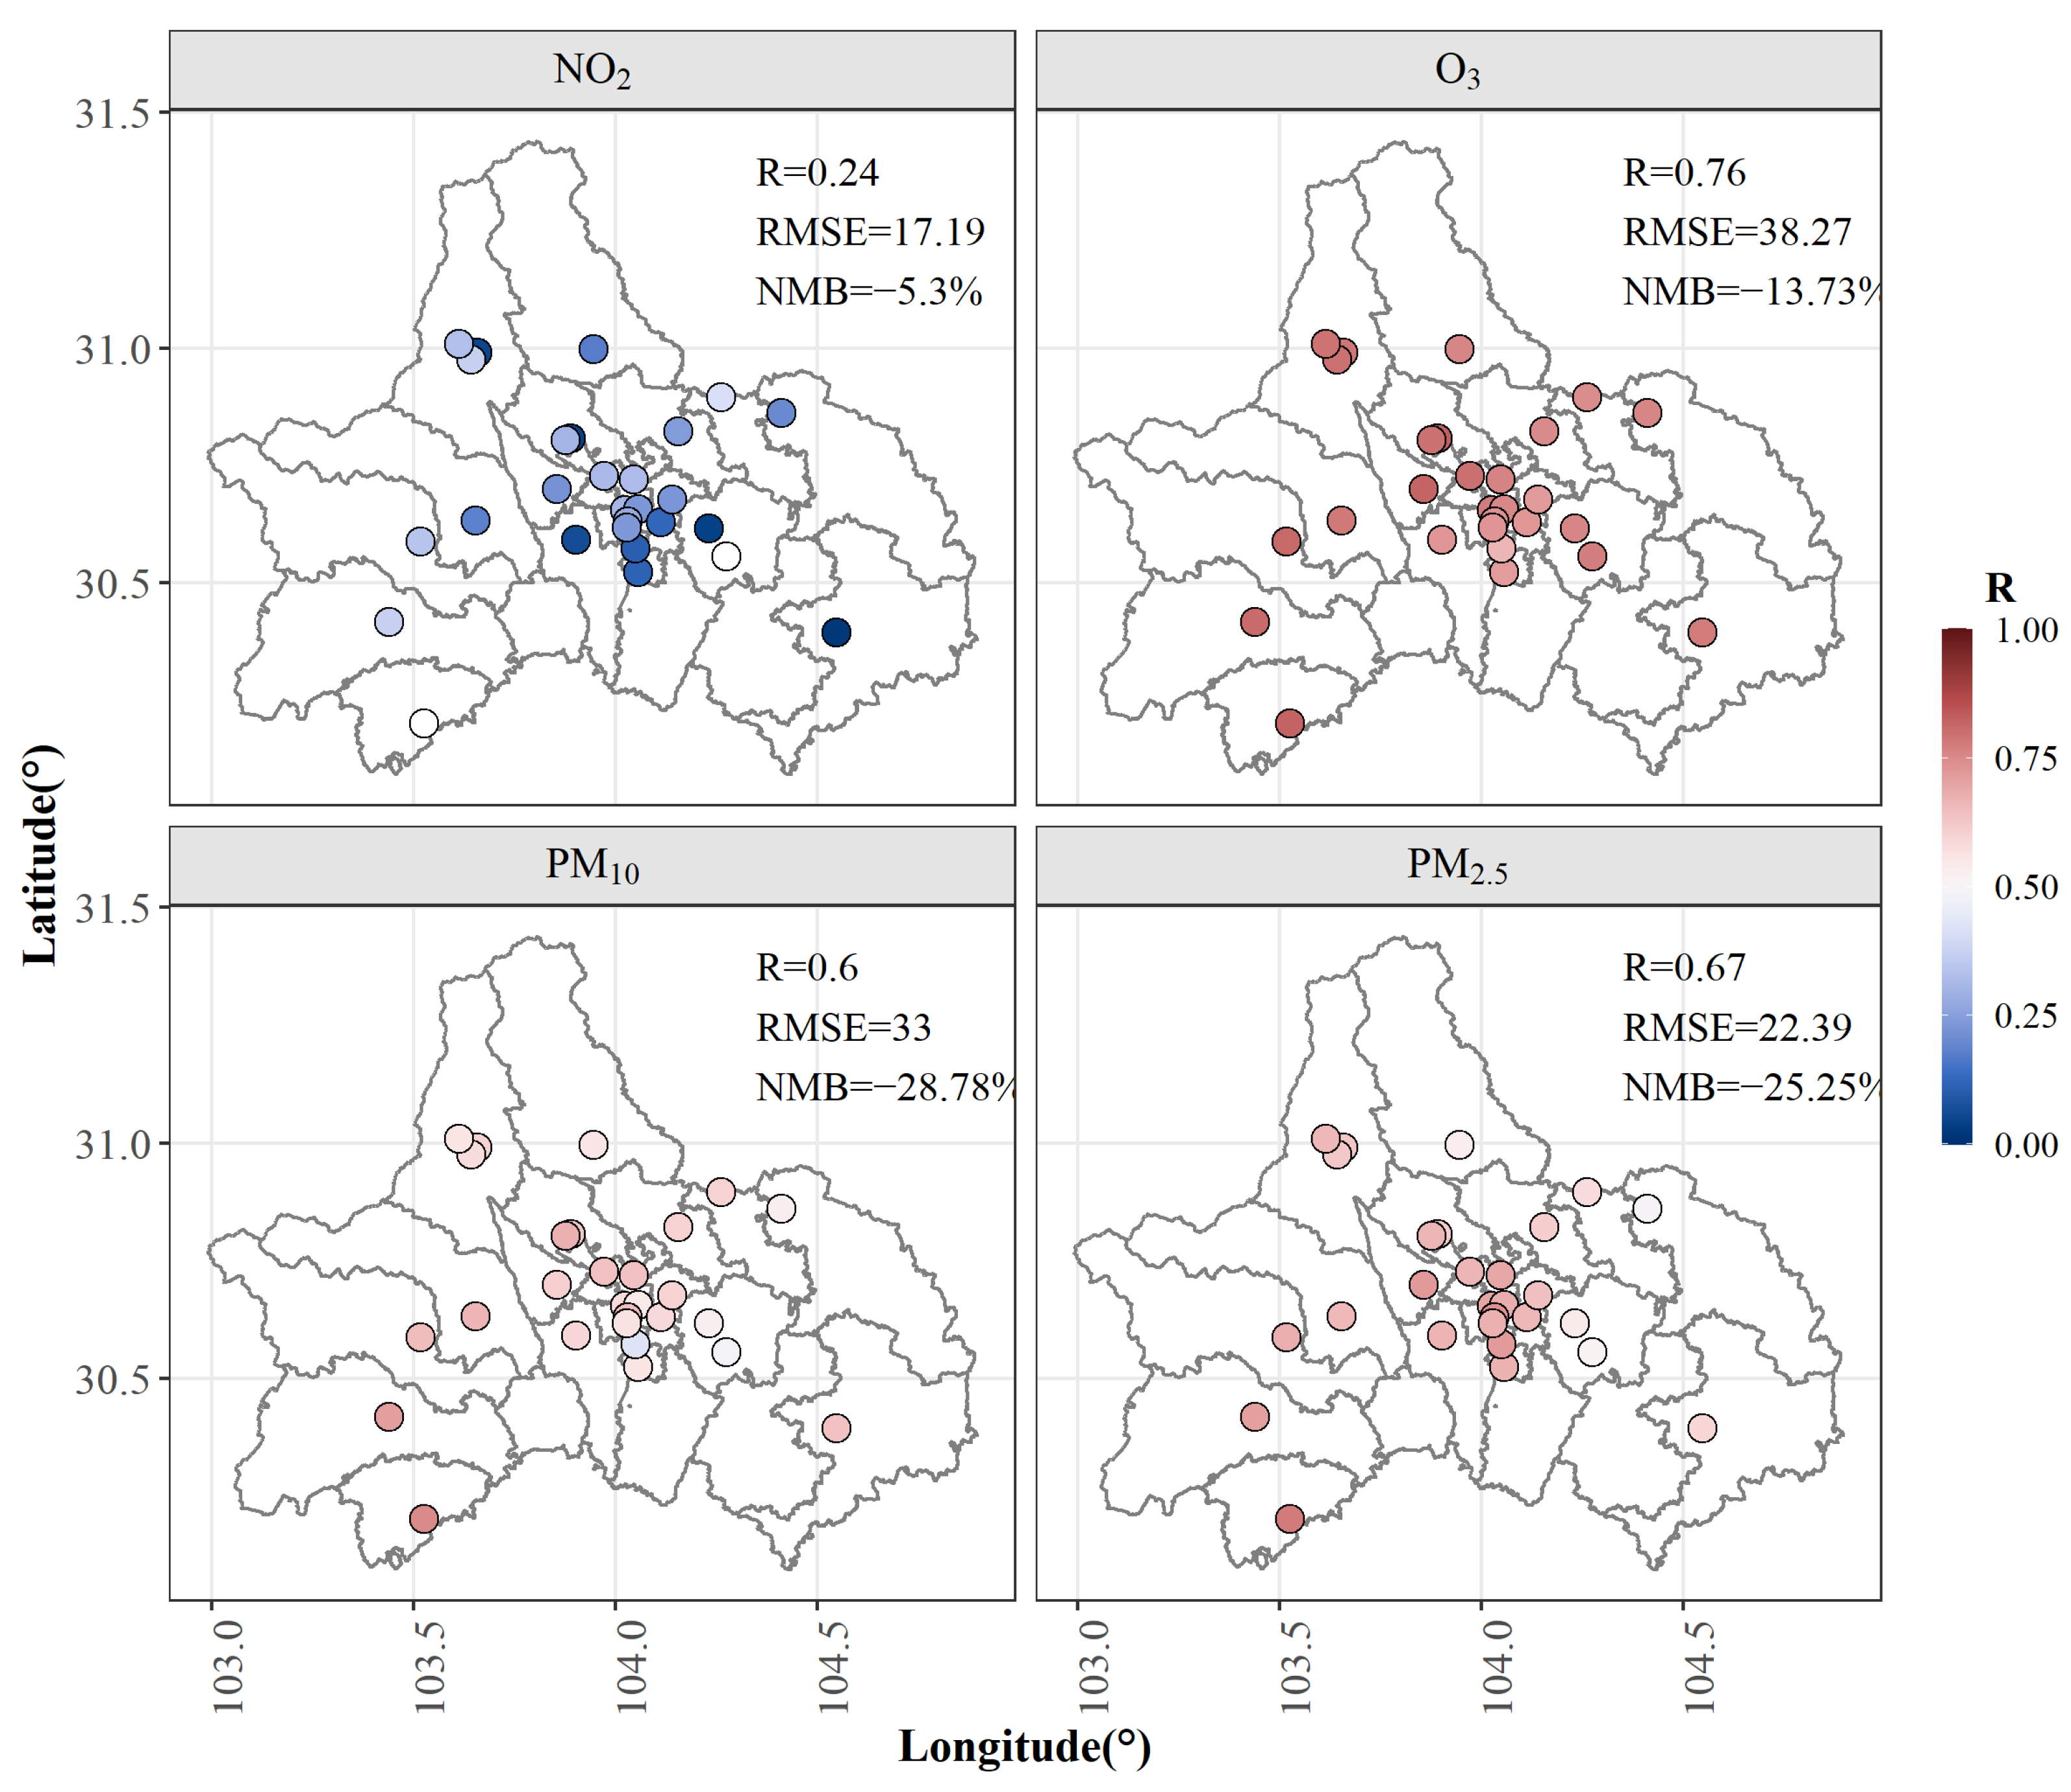
Observations including 10 m wind speed, relative humidity, atmospheric pressure and 2 m temperature from 13 national meteorological stations were used to evaluate the performance of the WRF model, as shown in Figure 4.
In terms of the spatial distribution of correlation coefficients for meteorological items, the performances of the model on 2 m temperature and atmospheric pressure were relatively good for all sites over Chengdu. However, model results of relative humidity were better for southern sites, and owing to the complex terrain over western sites, the performance of 10 m wind speed were worse in those sites.
Table 3 shows the statistical results of meteorological fields of 13 national stations in January, April, July, and October, with approximately 35,000 observations. The NMB value of T2 was 3.66% and that of PRES was 0.12%, the NMB value of WS was over 40%, which indicated that the modeled values were obviously high; and the NMB value of RH was about −10%, which might be due to the overestimation of T2. The RMSE values of T2 and PRES were around 2 hPa. The R values of T2 and PRES were more than 0.95. Owing to the complex terrain over Chengdu, the performance of WRF on winds might be affected, and station observations of WS were more sensitive to terrain and surrounding objectives.
Observations from 35 municipal and national environmental monitoring stations were used to evaluate the performance of CMAQ on PM2.5, PM10, NO2, and O3, and results are shown in Figure 5.
Considering the spatial distribution of R values of pollutants, we can infer that the performance of CMAQ was consistent over most of the monitoring sites.
Statistical results of the spatial average of seven national stations are listed in Table 4. A total of 2426 observed values were used for each variable. The NMB values of PM2.5 and PM10 were over −25%, indicating underestimations on particulate matters, and the NMB value of NO2 and O3 were significantly lower than that of PM. The RMSE values of PM2.5, PM10, NO2, and O3 were 26.75, 40.68, 22.06, and 29.66 μg/m3, respectively. The R value of NO2 was obviously lower than those of PM2.5, PM10, and O3.

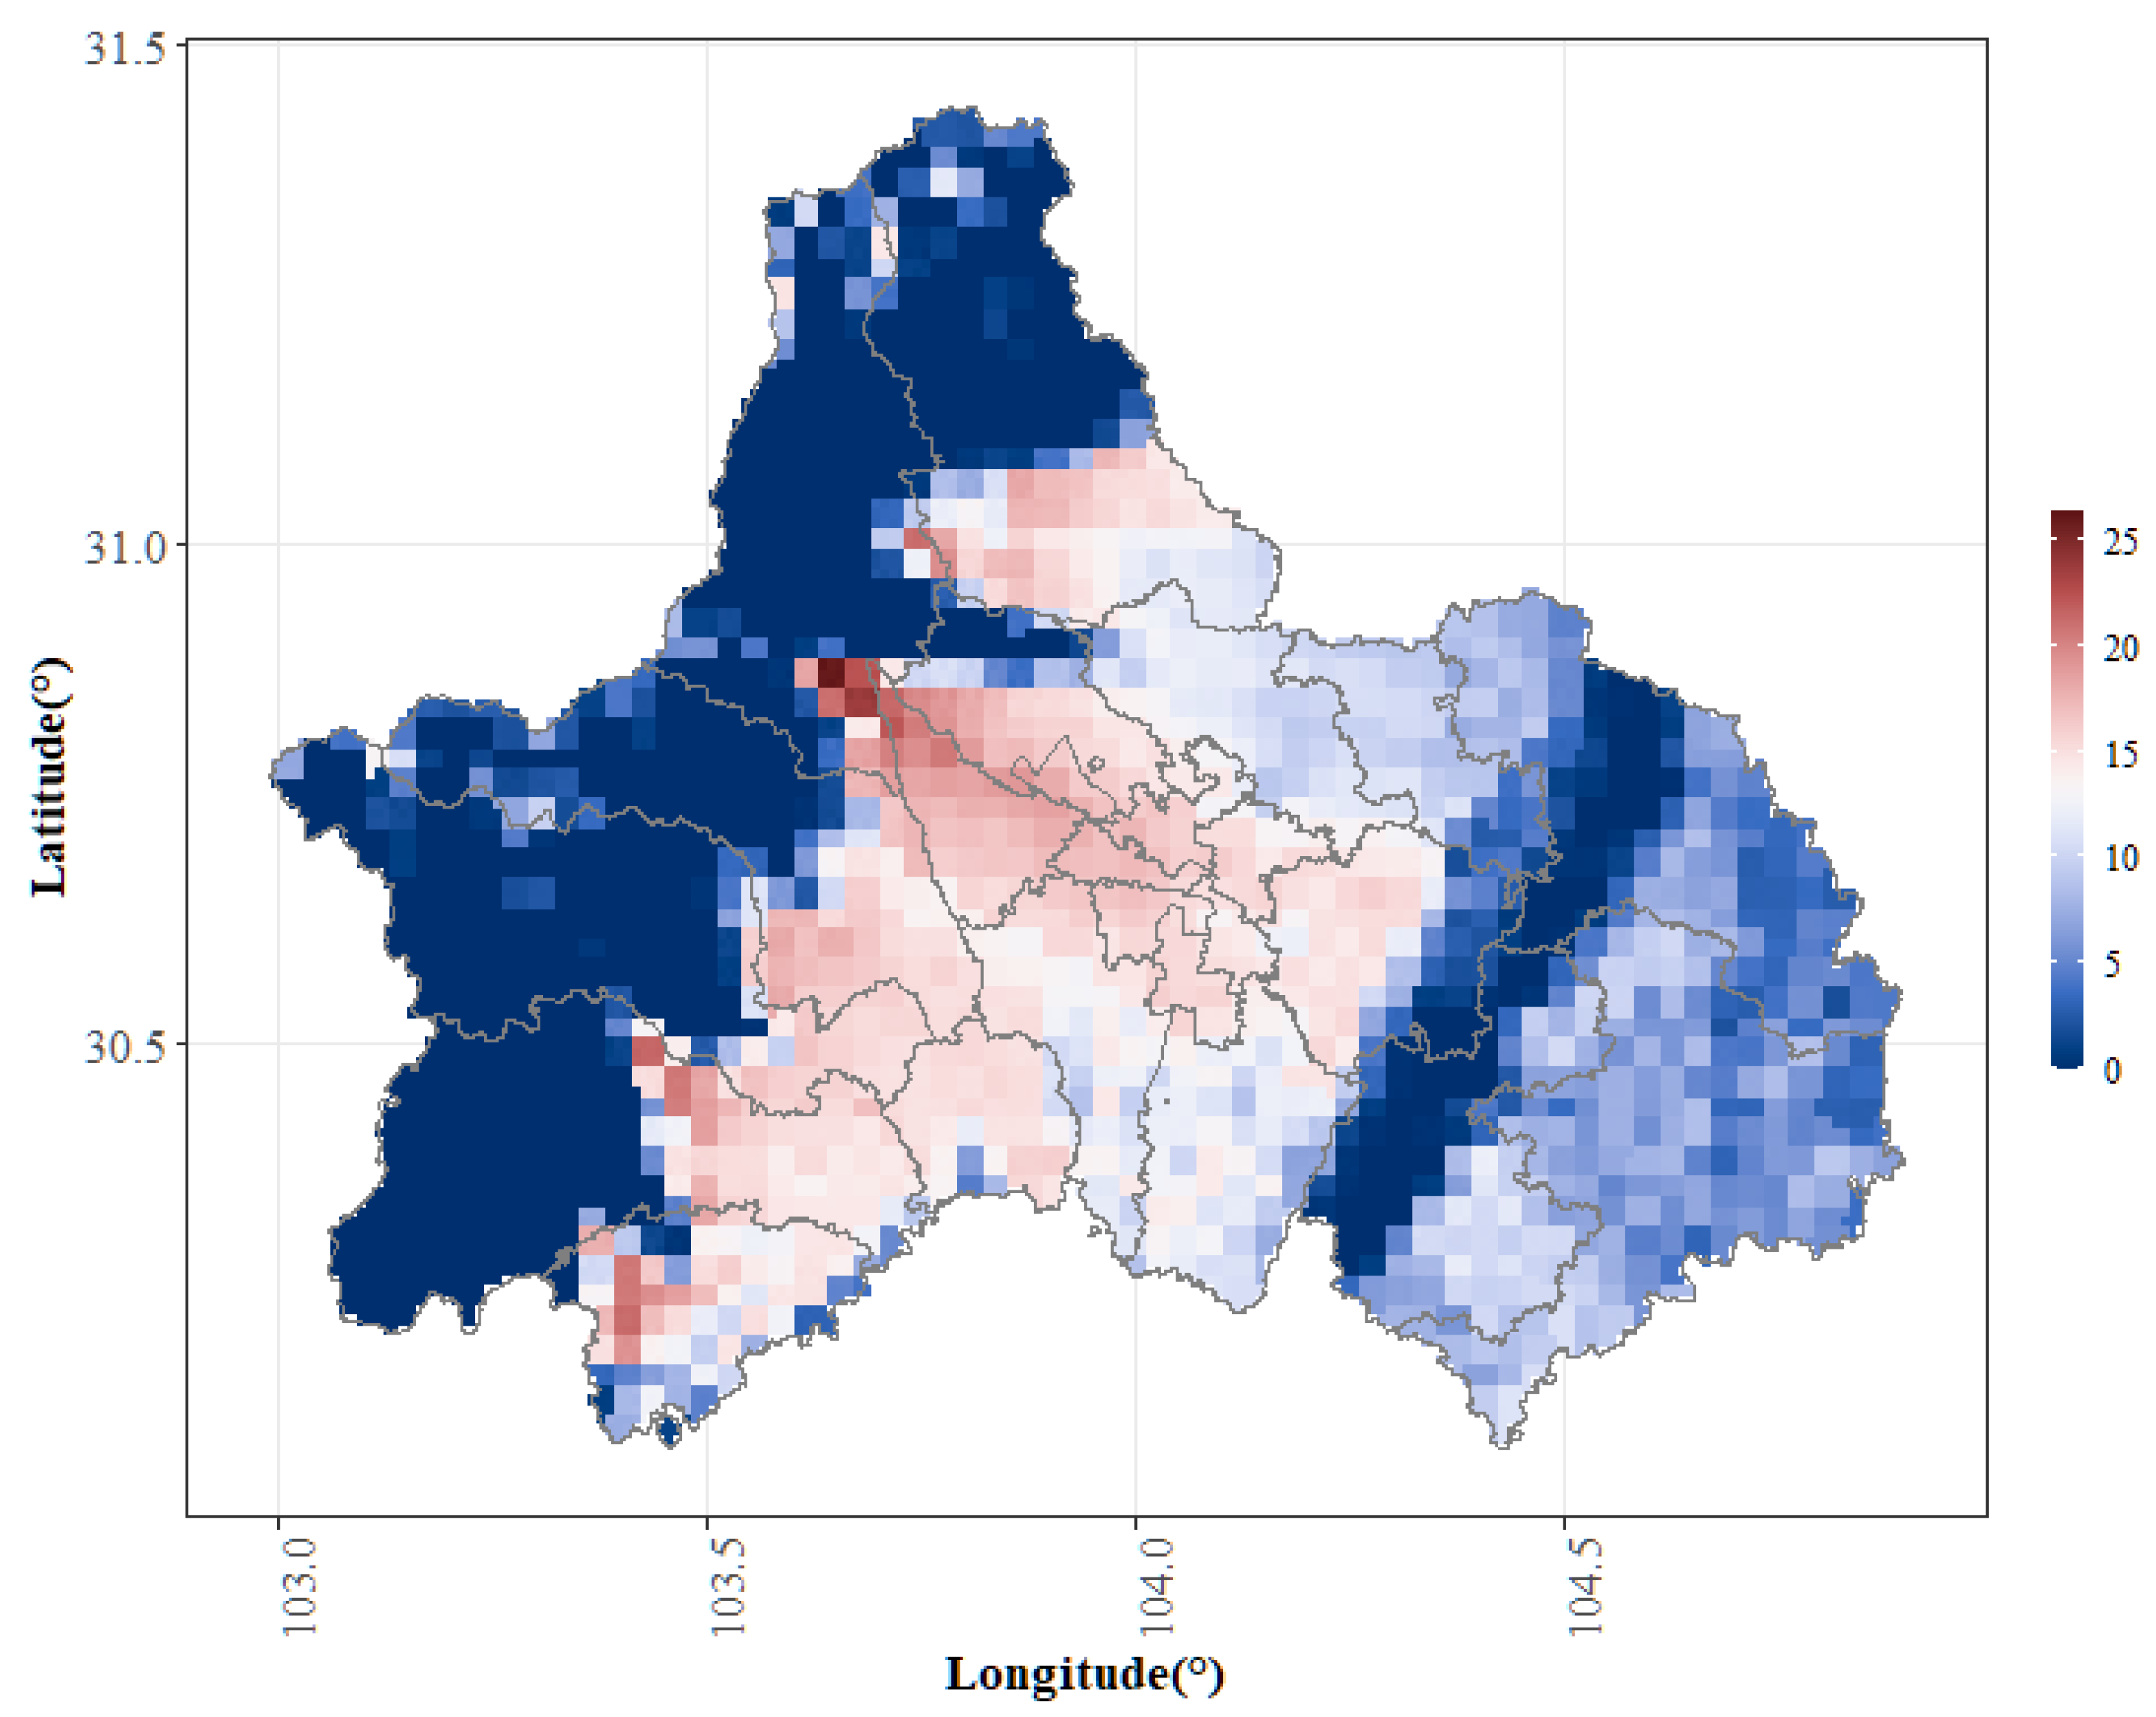
3.2. Terrain Occlusion Results

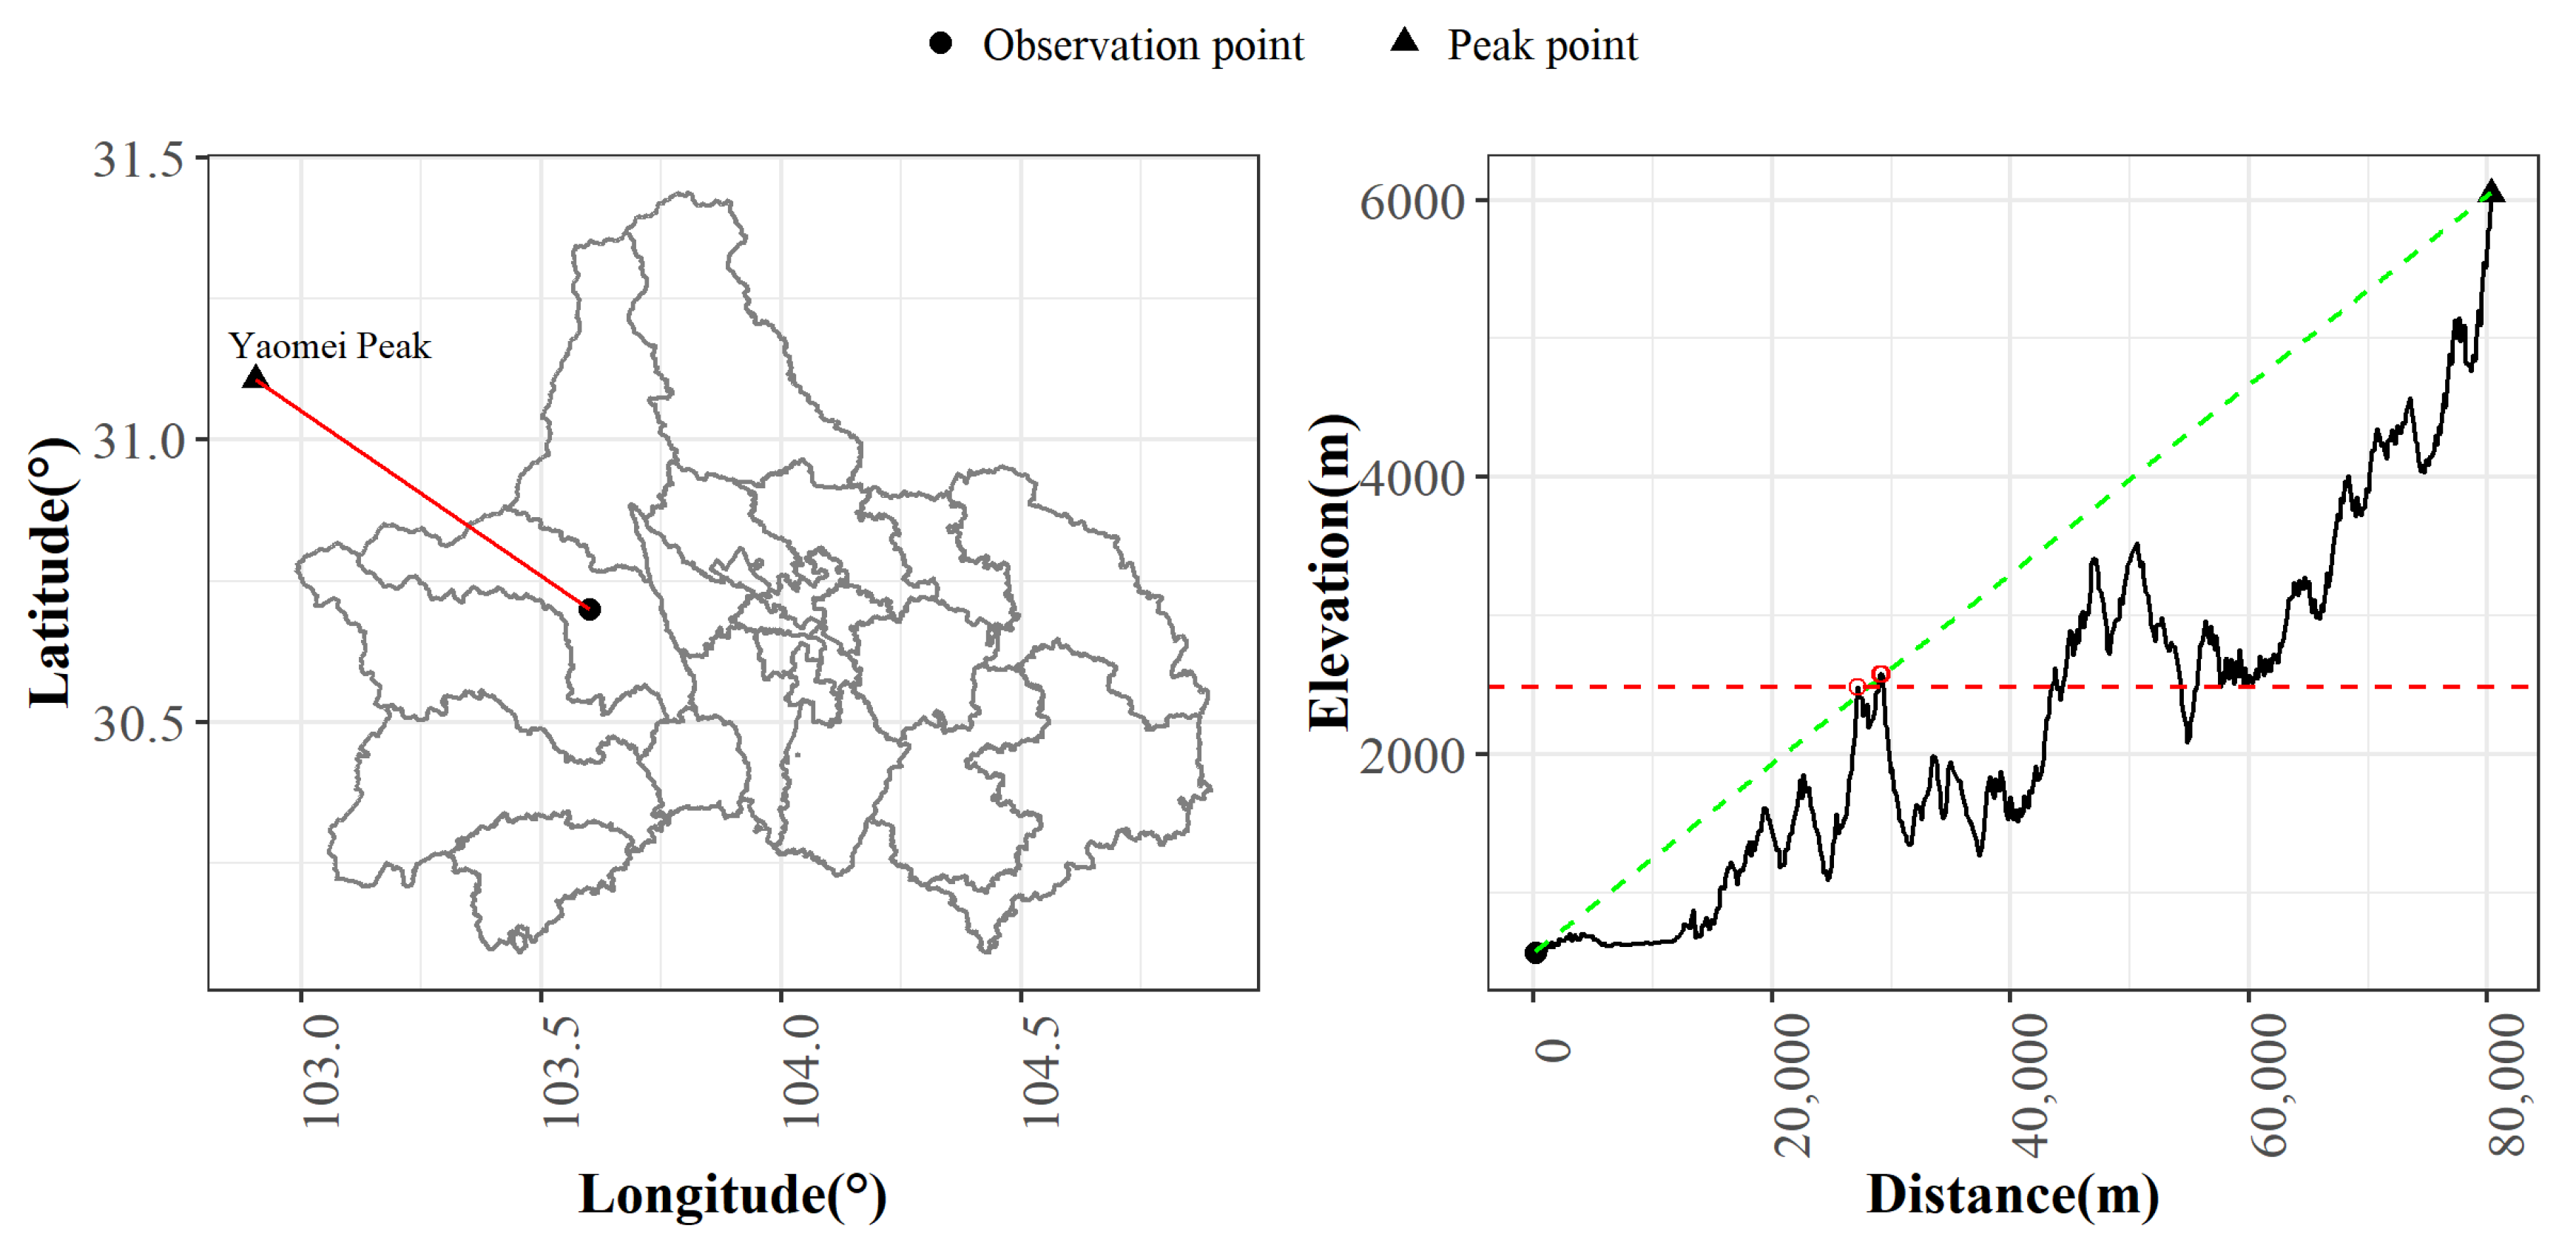
Chengdu is surrounded by two mountains: the Longmen Mountains are partly located in the west of Chengdu, with an average altitude of 1381 m, and stand in front of Yaomei Feng, while Longquan Mountain is located in central eastern Chengdu and has an average altitude of approximately 1000 m. Most of the terrain occlusions for Chengdu are due to the Longmen Mountains.
As shown in Figure 6, owing to the presence of mountains, Yaomei Feng can only be seen from a part of Chengdu. Terrain occlusion rates were lower than 50% for only 49.3% of the model grids, and were mostly distributed in the Chengdu Plain between the Longmen Mountains and Longquan Mountain. Terrain occlusion rates were used to adjust the snow peak sighting forecast results for each model grid.

3.3. Threshold Values Acquired by Monte-Carlo Simulation

Random numbers were generated according to the range of each variable, and each random number was used to determine if a certain snow peak could be seen from each model grid. SPSP values for 2020 were calculated and compared with social media posts to estimate the performance of random numbers, and the best was selected as listed in Table 5.

3.4. Snow Peak Sighting Probability

Annual snow peak sighting probability was calculated and visualized for 2020 as shown in Figure 7, and terrain occlusion rates were applied so the probability in the west regions were relatively low. Significant differences were shown in the spatial distribution of snow peak sighting probability, and higher values appeared in the west near Longmen Mountains, including Dujiangyan, Wenjiang, Qionglai, and Pujiang. High probability is also shown in some regions of highly urbanized areas such as Jinniu, Qingyang, and Wuhou. It was easier to see Yaomei Feng from places on top of Longquan Mountain in Longquanyi.
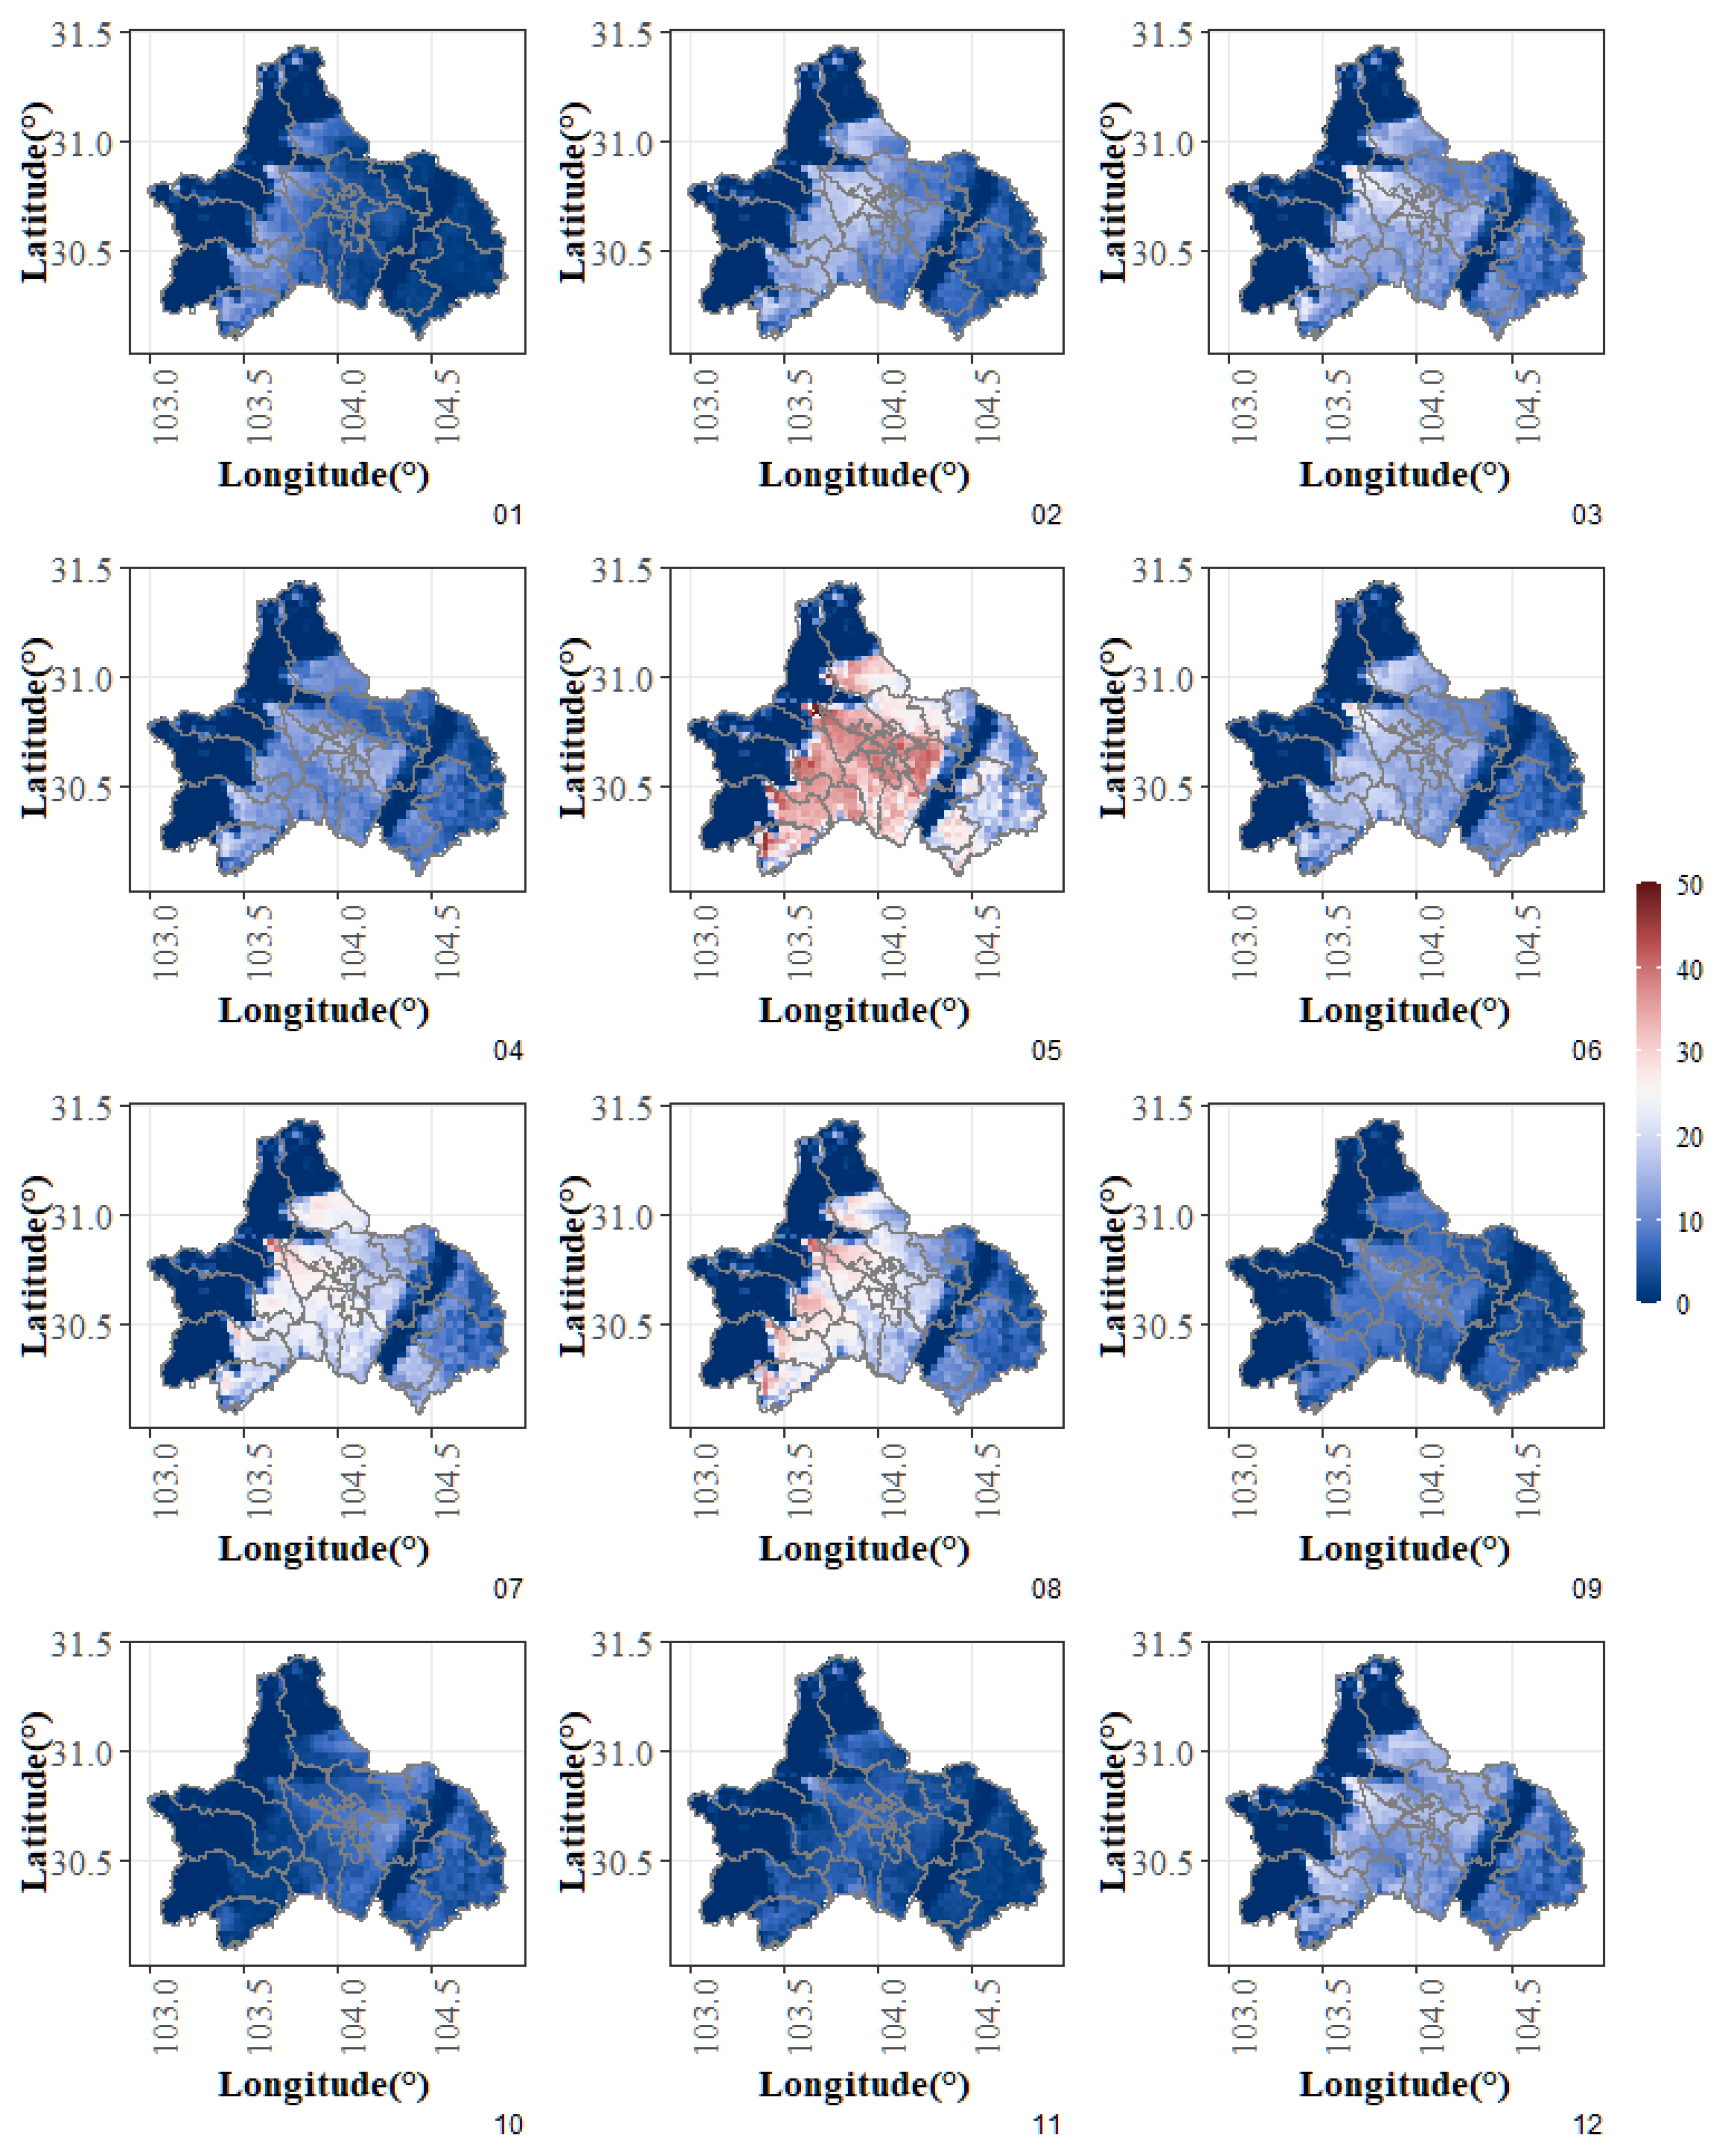
As shown in Figure 8, monthly results indicated that the best time for snow peak sighting was May because it had the highest probability for Yaomei Feng to be visible from Chengdu, followed by August and July. Thus we can conclude that the best snow peak sighting seasons for Chengdu are late spring and summer. Similar spatial distributions were found in different months, and SPSP values were higher for western grids in general.

3.5. Comparison with Social Media Posts

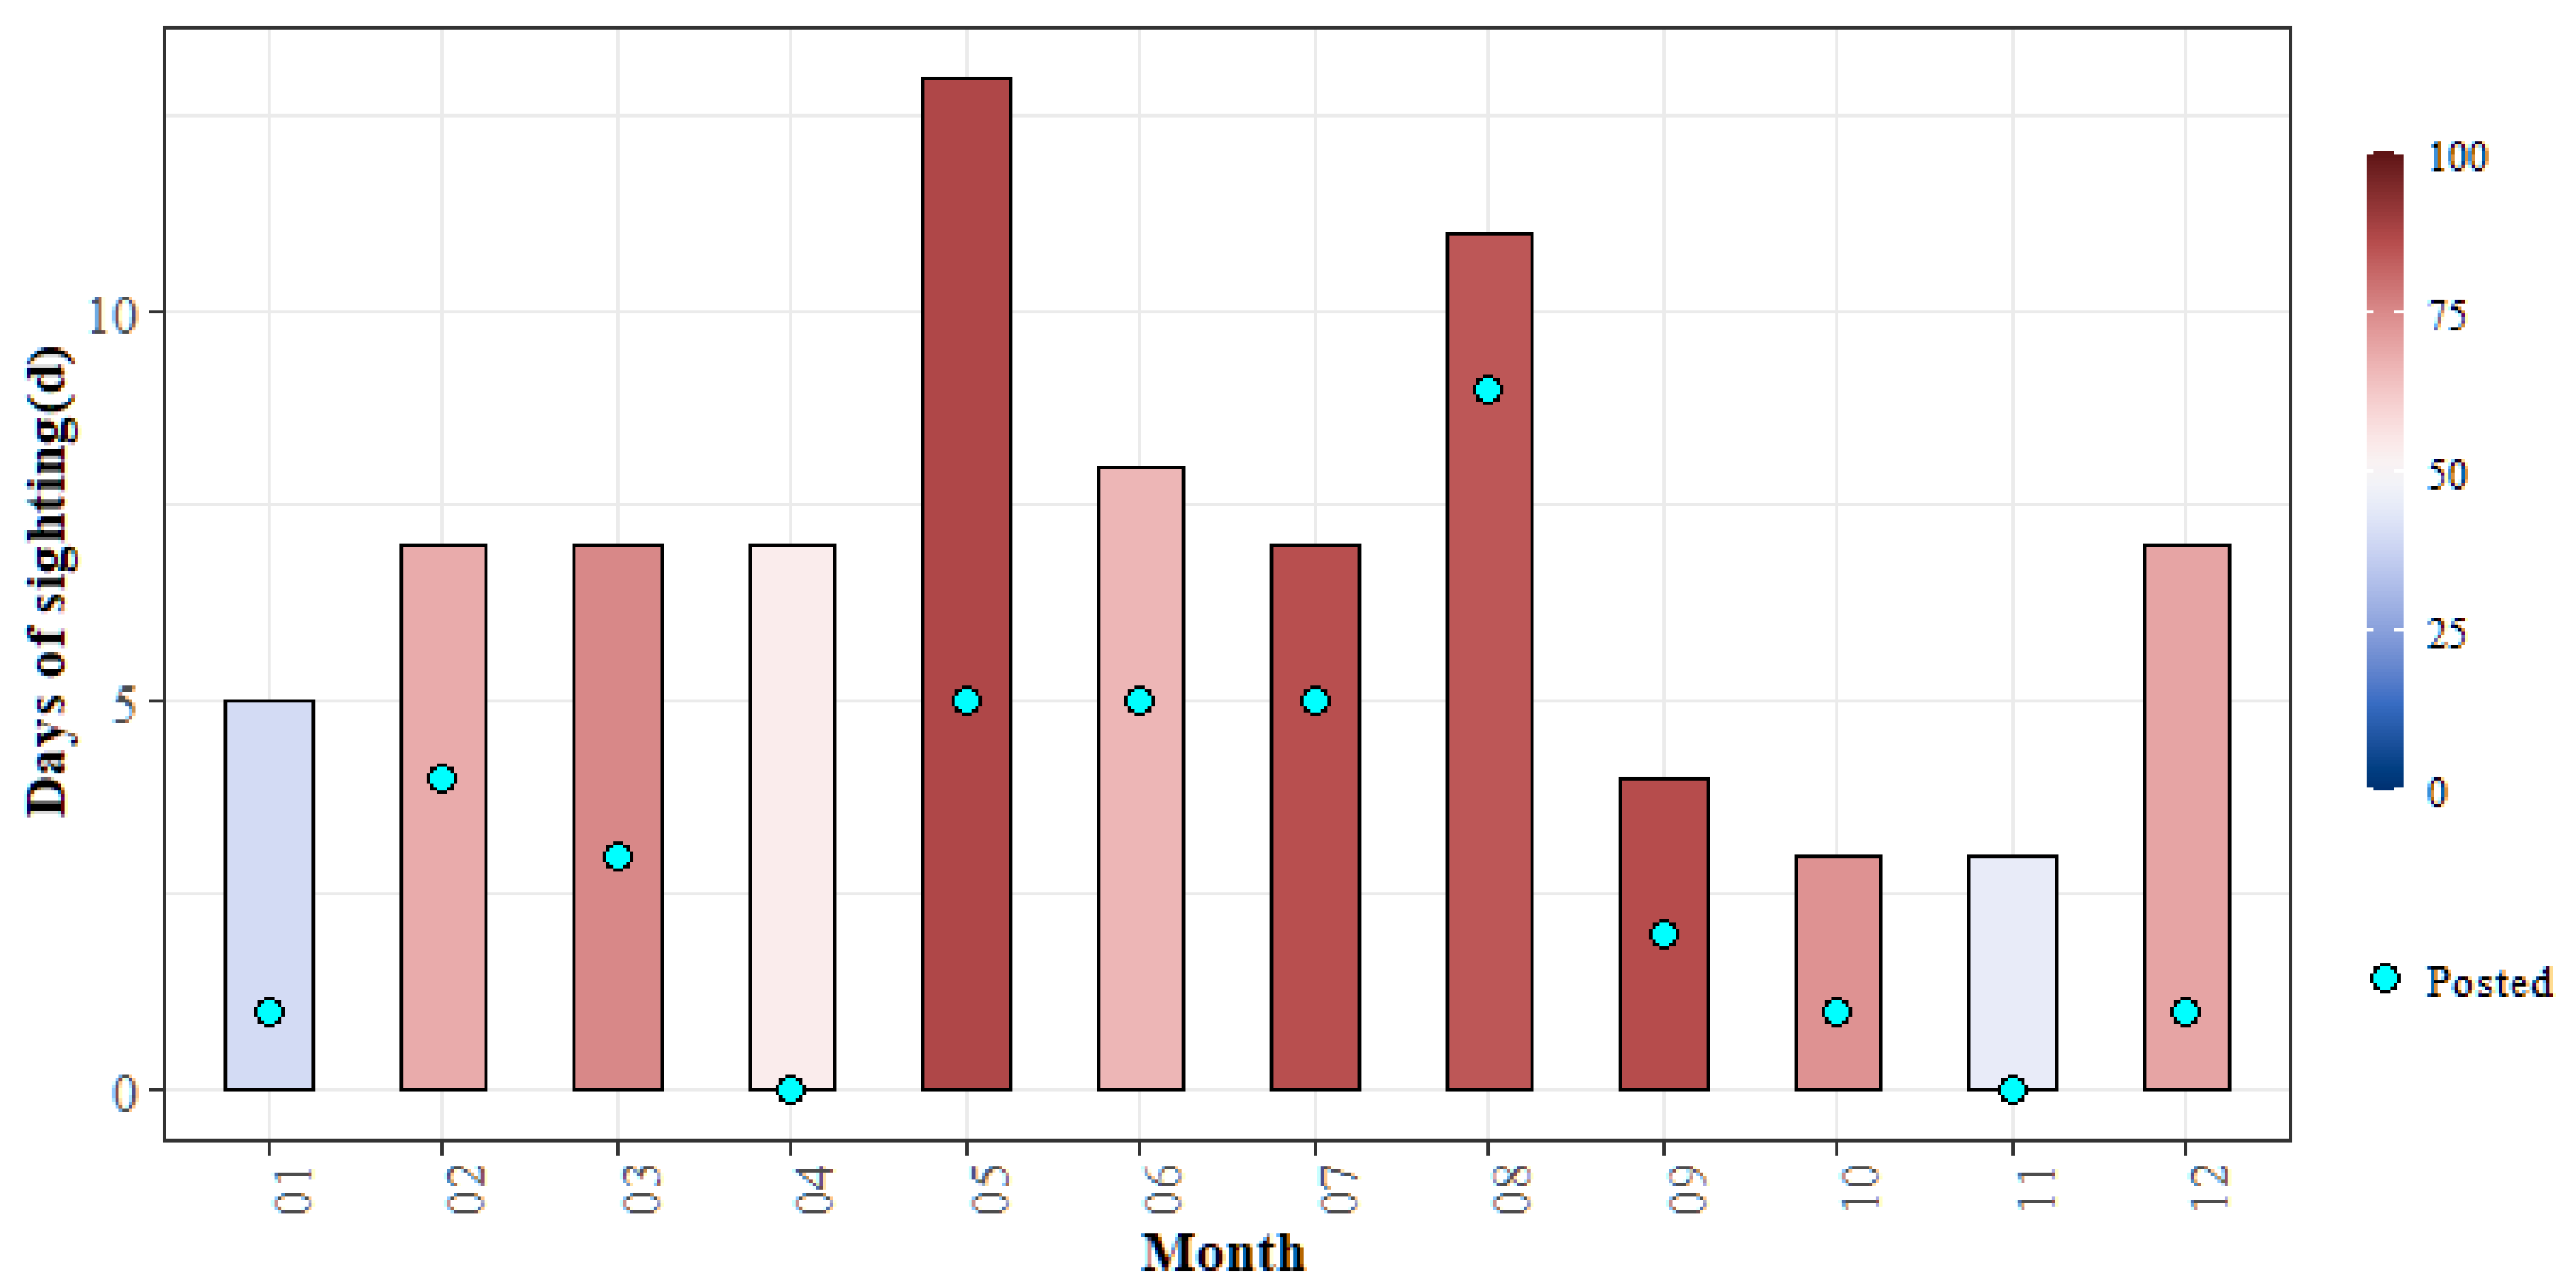
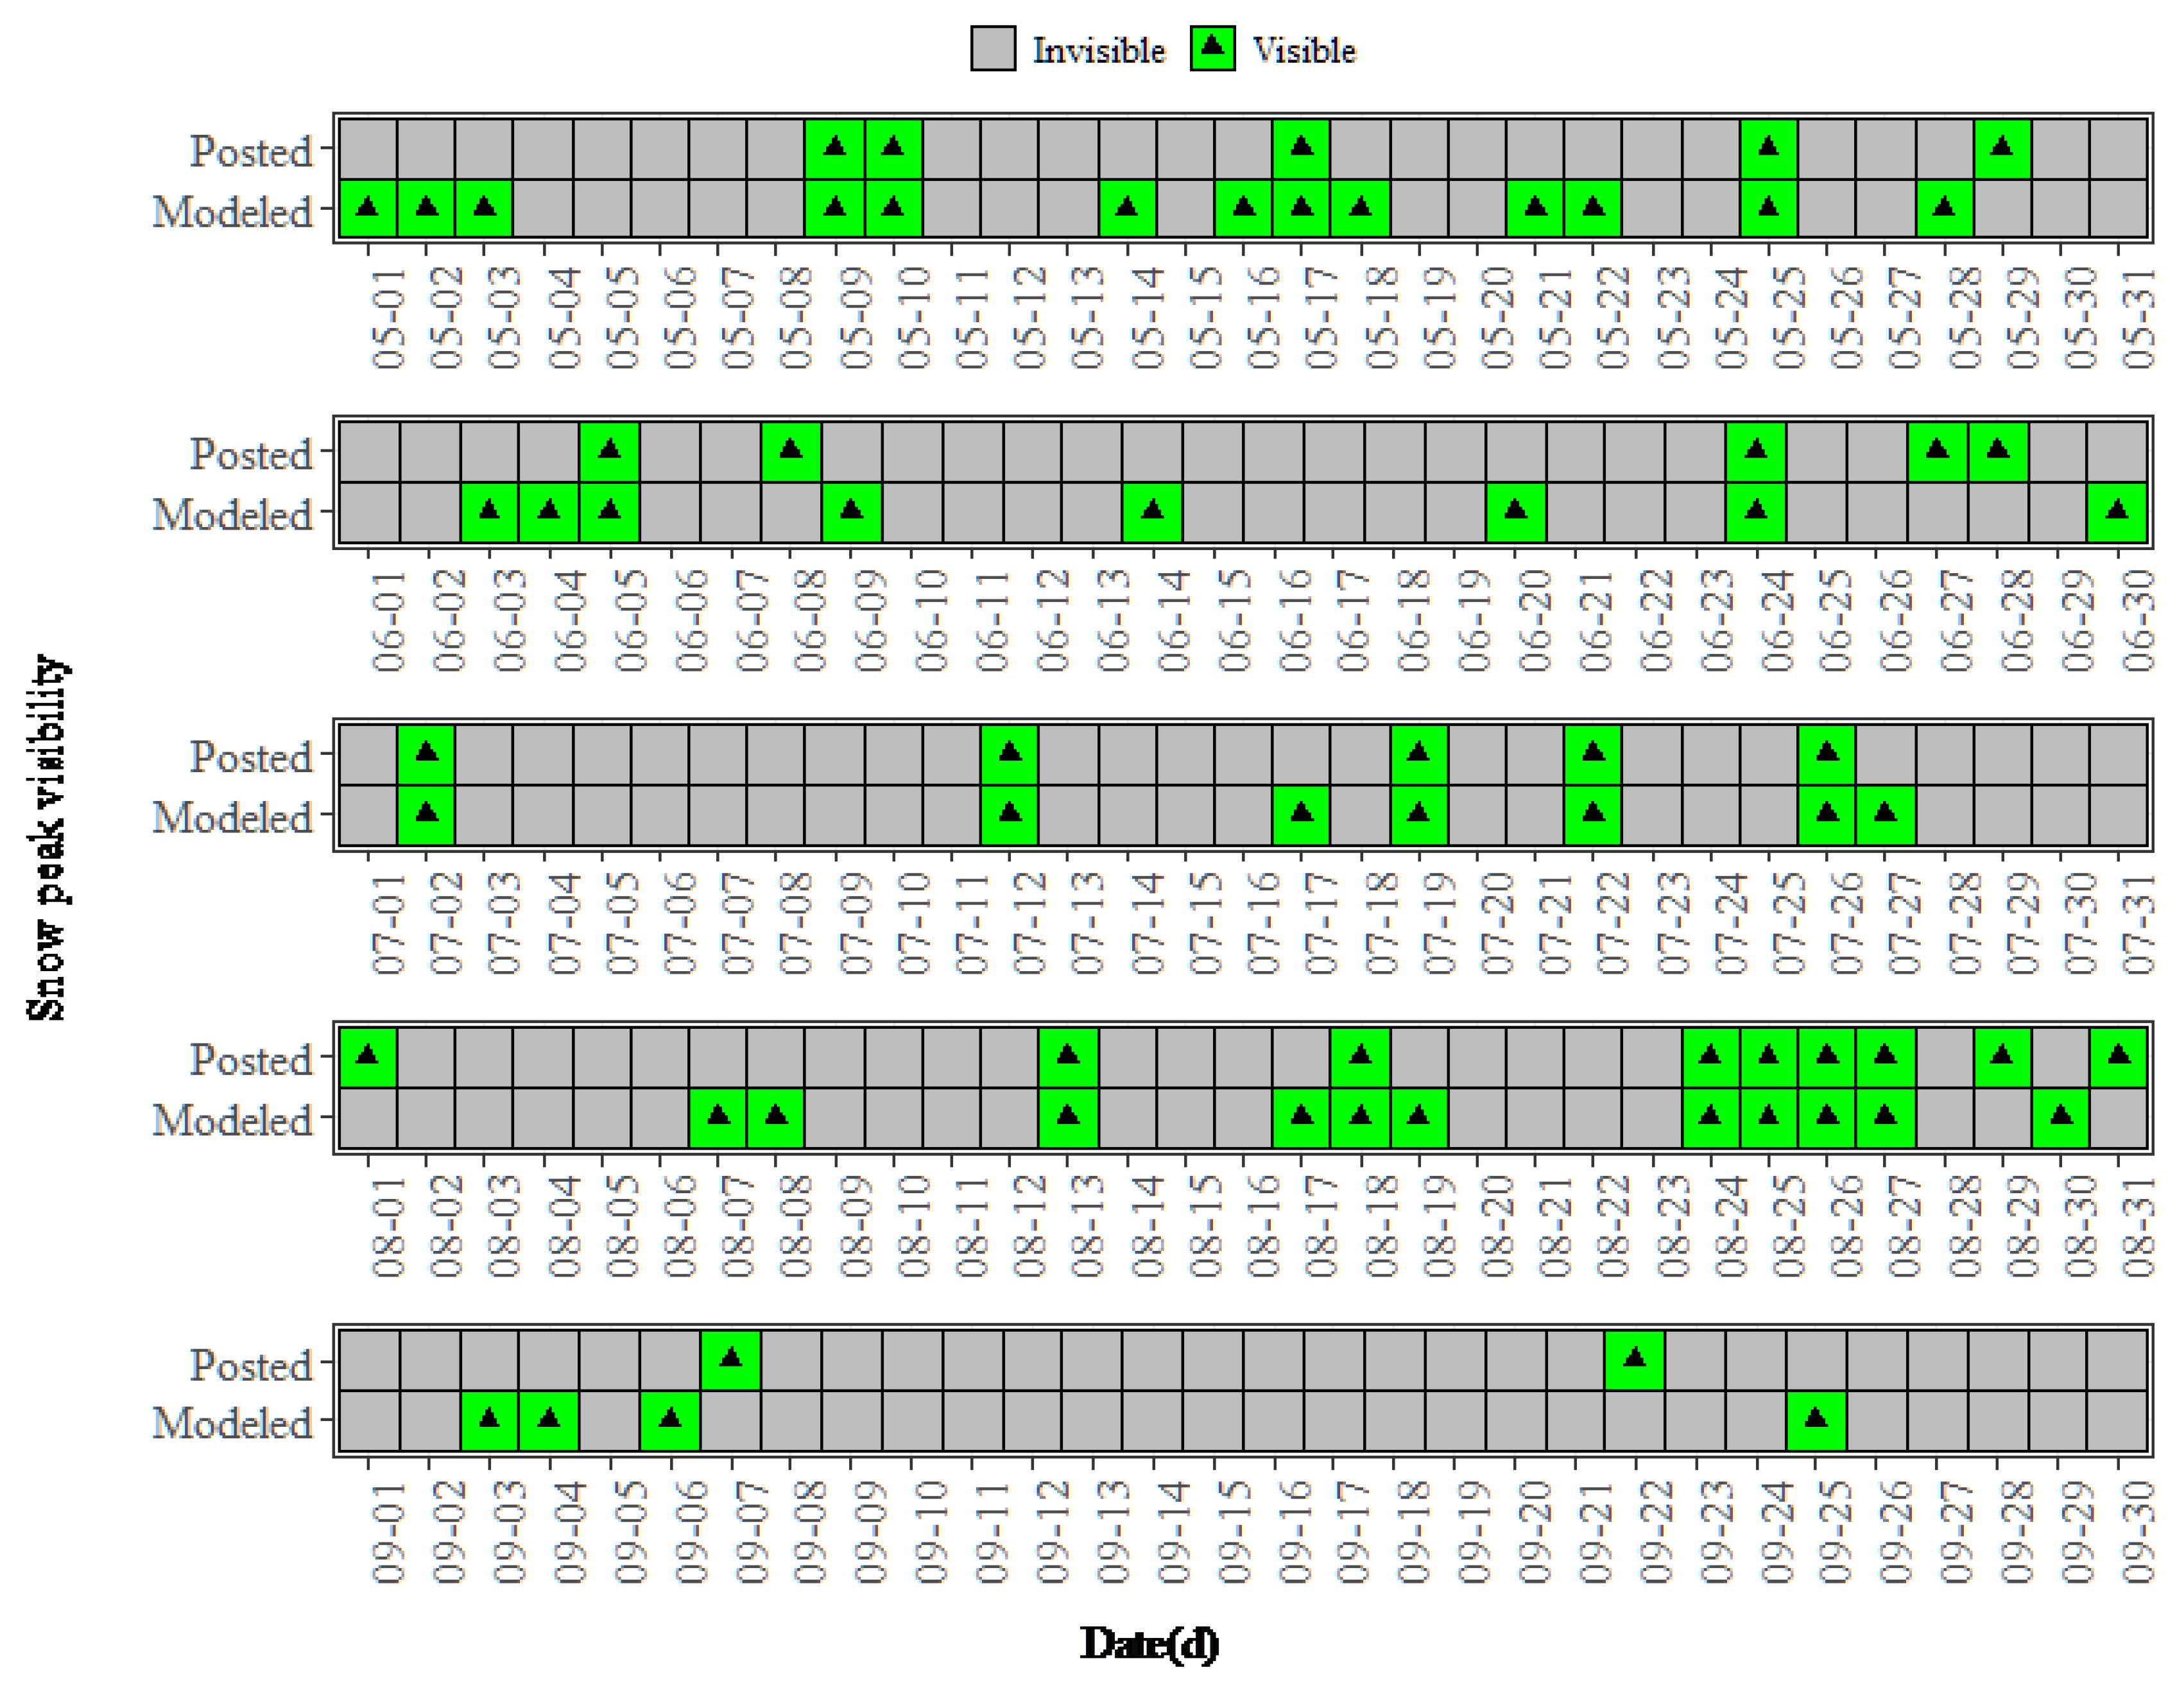
Owning to lack of detailed time and location information, posts collected from social media might not be a good reference for snow peak sighting hindcast evaluation, but no better source of observations are available at present. As shown in Figure 9, the number of days is shown as the height of bars, and averaged SPSP values are shown as fill colors. Compared with social media posts, the model results were higher in every month, especially in January, April, and December. Significant over-estimation was also found in May. SPSP values were higher from May to September, indicating that snow peaks could be seen from more sites in those months.
Figure 10 shows a detailed comparison between modelled and posted days with sighting records on Yaomei Feng from May to September 2020. The variation of total sighting days in each month fitted the observations well, but more false positives were found, especially in April, May, and December.
As listed in Table 6, the accuracy of the model was 78.9%, and the recall value was 57.1%, but the precision was only 24.4% because of a large number of false positives. However, some true positives might be counted as false when using social media posts, so it was important to build snow peak observation stations for further model optimization.

4. Summary and Conclusions

The development of a threshold-method-based snow peak sighting probability forecast system was introduced in this paper. The system was based on a novel threshold method; meteorological and environmental fields provided by numerical models including WRF and CMAQ were used as input to the snow peak sighting forecast system. Threshold values used in the forecast system were determined through Monte Carlo simulations. A WRF-CMAQ hindcast of 2020 was carried out to establish the forecast system. The paper provided an idea to develop a snow peak sighting forecast model based on limited observations.
The following conclusions could be drawn:
  • A logical formula considering meteorological and environmental was proposed as the core of the snow peak sighting forecast system.
  • The spatial and temporal distribution of snow peak sighting probabilities were analyzed in this paper, showing that the best regions for snow peak sighting in Chengdu were in the plain between Longquan and Longmen Mountains, and the best periods for snow peak sighting were between May to September.
  • Estimations showed that the accuracy of the system was 78.9%, while the precision was 24.4%, and a lack of dependable observations caused difficulty in determining the cause of false positives.
The system was still in an early stage when this study was conducted, and a seven-day operational forecast has been carried out in Chengdu since May 2022. An automatic photo system was designed with a telescope equipped with a Raspberry Pie Camera, which was used to provide observations for model optimization before official stations were built. Additionally, an app named “Seeing the Snow Peaks” was developed for citizens to access the forecast products and upload their photos with locations, which could also be used as observations in the future. Although the system was designed to carry out forecasts for multiple snow peaks, Monte Carlo simulations were found necessary for peaks other than Yaomei Feng if observations were available. Utilizing the technique described in this paper to identify optimal observation sites and time periods for glaciers or snow can prove advantageous for cryosphere observations. Additionally, by developing a threshold method that takes into consideration the meteorological and environmental conditions above the snow peaks, this technique may serve as a reference for satellite observations of snow-covered peaks.
Optimizations on the model could be done in the future with technologies including machine learning and accumulated visibility calculation, and hindcasts for different years should be conducted to discuss the differences of spatial and temporal distribution of snow peak sighting probability among years. Even with limited observations, the methodology in this paper could be applied to any snow peak sighting points, and forecasts could be provided for snow peak tourism lines and snow resorts.

5. Patent

A patent called “Method, storage medium and terminal of a target observation index forecast technology based on numerical models” has been granted by the China National Intellectual Property Administration.

Author Contributions

Conceptualization, C.L., T.Z. and X.Y.; methodology, C.L., X.K. and X.Y.; software, C.L. and X.Y.; formal analysis, Q.T. and F.Y.; writing—original draft preparation, C.L.; writing—review and editing, T.C. and F.Y.; Data curation, Z.Z.; visualization, X.Y. and Y.W.; supervision, X.C. and F.Y.; funding acquisition, C.L. and T.C. All authors have read and agreed to the published version of the manuscript.

Funding

This research was supported by the Key Research Support Plan of Chengdu Science and Technology Bureau (2020-YF09-00031-SN), the National Key R&D Program of China (2022YFC3701201), the Chengdu Heavy Rain and Drought-Flood Disasters in Plateau and Basin Key Laboratory of Sichuan Province (SZKT202201), the University of Information Engineering Scientific Research Fund Grant Results (KYTZ202129).

Institutional Review Board Statement

Not applicable.

Informed Consent Statement

Not applicable.

Data Availability Statement

Source codes used in this article were available from https://github.com/Chengwei1017/SnowPeakSighting (accessed on 18 June 2023), other data were not reported.

Acknowledgments

The authors would like to thank Wei Yu from Chengdu Dayi Meteorological Bureau for introducing early experiences on empirical snow peak sighting forecast, and photographers including Xianghe Tian and Yun Shen for providing photos and sighting records on Yaomei Feng or other snow mountains.

Conflicts of Interest

The authors declare no conflict of interest.

References

  1. Watson, B. The Selected Poems of Du Fu; Columbia University Press: New York, NY, USA, 2003; p. 107. [Google Scholar]
  2. Zhang, F.; Wang, Y.; Peng, J.; Chen, L.; Sun, Y.; Duan, L.; Zhang, R. An unexpected catalyst dominates formation and radiative forcing of regional haze. Proc. Natl. Acad. Sci. USA 2020, 117, 3960–3966. [Google Scholar] [CrossRef] [Green Version]
  3. Pope, C.A., 3rd; Dockery, D.W. Health Effects of Fine Particulate Air Pollution: Lines that Connect. J. Air Waste Manag. Assoc. 2006, 56, 709–742. [Google Scholar] [CrossRef] [PubMed]
  4. Liu, F.; Tan, Q.; Jiang, X.; Yang, F.; Jiang, W. Effects of relative humidity and PM2.5 chemical compositions on visibility impairment in Chengdu, China. J. Environ. Sci. 2019, 86, 15–23. [Google Scholar] [CrossRef] [PubMed]
  5. Yu, Z.W. The effects of PM2.5 concentrations and relative humidity on atmospheric visibility in Beijing. J. Geophys. Res.-Atmos. 2019, 124, 2235–2259. [Google Scholar] [CrossRef]
  6. Zhou, Y.A.; Yw, B.; Xhx, A.; Jy, C.; Cqo, A. Quantifying and characterizing the impacts of PM2.5 and humidity on atmospheric visibility in 182 Chinese cities: A nationwide time-series study. J. Clean. Prod. 2022, 368, 133182. [Google Scholar] [CrossRef]
  7. Liu, S.; Luo, Q.; Feng, M.; Zhou, L.; Qiu, Y.; Li, C.; Song, D.; Tan, Q.; Yang, F. Enhanced nitrate contribution to light extinction during haze pollution in Chengdu: Insights based on an improved multiple linear regression model. Environ. Pollut. 2023, 323, 121309. [Google Scholar] [CrossRef]
  8. Ding, S.; Duan, W.; Zhu, Y.; Li, G. Forecasting of Ha’ni cloud sea landscape in Yuanjiang county of Yunnan province based on multiple models. J. Meteorol. Environ. 2022, 36, 106–112. [Google Scholar] [CrossRef]
  9. Tao, L.; Yuan, Y.; Liang, J. Cloud Sea Landscape Forecast Technology and Cloud Characteristics Research. Technol. Innov. Appl. 2019, 30, 124–125. [Google Scholar]
  10. Deng, H.; Pepin, N.C.; Chen, Y. Changes of snow fall under warming in the Tibetan Plateau. J. Geophys. Res. Atmos. 2017, 122, 7232–7341. [Google Scholar] [CrossRef] [Green Version]
  11. National Mapping and Remotely Sensed Data: Digital Elevation Models (DEMs). Available online: http://edcwww.cr.usgs.gov/nsdi/gendem.htm (accessed on 17 March 2020).
  12. Shugar, D.H.; Jacquemart, M.; Shean, D.; Bhushan, S.; Upadhyay, K.; Sattar, A.; Schwanghart, W.; McBride, S.; de Vries, M.V.W.; Mergili, M.; et al. A massive rock and ice avalanche caused the 2021 disaster at Chamoli, Indian Himalaya. Science 2021, 373, 300–306. [Google Scholar] [CrossRef]
  13. Tsai, Y.-L.S.; Dietz, A.; Oppelt, N.; Kuenzer, C. Remote Sensing of Snow Cover Using Spaceborne SAR: A Review. Remote Sens. 2019, 11, 1456. [Google Scholar] [CrossRef] [Green Version]
  14. Kostadinov, T.S.; Schumer, R.; Hausner, M.; Bormann, K.J.; Gaffney, R.; McGwire, K.; Painter, T.H.; Tyler, S.; Harpold, A.A. Watershed-scale mapping of fractional snow cover under conifer forest canopy using lidar. Remote Sens. Environ. 2019, 222, 34–49. [Google Scholar] [CrossRef]
  15. Gascoin, S.; Barrou Dumont, Z.; Deschamps-Berger, C.; Marti, F.; Salgues, G.; López-Moreno, J.I.; Revuelto, J.; Michon, T.; Schattan, P.; Hagolle, O. Estimating Fractional Snow Cover in Open Terrain from Sentinel-2 Using the Normalized Difference Snow Index. Remote Sens. 2020, 12, 2904. [Google Scholar] [CrossRef]
  16. Muhuri, A.; Gascoin, S.; Menzel, L.; Kostadinov, T.S.; Harpold, A.A.; Sanmiguel-Vallelado, A.; Lopez-Moreno, J.I. Performance Assessment of Optical Satellite Based Operational Snow Cover Monitoring Algorithms in Forested Landscapes. IEEE J. Sel. Top. Appl. Earth Obs. Remote Sens. 2021, 14, 7159–7178. [Google Scholar] [CrossRef]
  17. Wickham, H. Reshaping Data with the reshape Package. J. Stat. Softw. 2007, 21, 1–20. [Google Scholar] [CrossRef]
  18. Wickham, H. Ggplot2: Elegant Graphics for Data Analysis, 2nd ed.; Springer International Publishing: New York, NY, USA, 2009. [Google Scholar] [CrossRef]
  19. Bivand, R.S.; Pebesma, E.J.; Gómez-Rubio, V.; Pebesma, E.J. Applied Spatial Data Analysis with R, 2nd ed.; Springer: New York, NY, USA, 2013. [Google Scholar] [CrossRef]
  20. Geosphere: Spherical Trigonometry. R Package Version 1.5-14. Available online: https://CRAN.R-project.org/package=geosphere (accessed on 17 March 2020).
  21. raster: Geographic Data Analysis and Modeling. R Package Version 3.4-10. Available online: https://CRAN.R-project.org/package=raster (accessed on 17 March 2020).
  22. RNetCDF: Interface to ‘NetCDF’ Datasets. R Package Version 2.4-2. Available online: https://CRAN.R-project.org/package=RNetCDF (accessed on 17 March 2020).
  23. Inlmisc—Miscellaneous Functions for the U.S. Geological Survey Idaho National Laboratory Project Office: U.S. Geological Survey Software Release. Available online: https://github.com/USGS-R/inlmisc (accessed on 17 March 2020).
  24. metR: Tools for Easier Analysis of Meteorological Fields. Available online: https://github.com/eliocamp/metR (accessed on 17 March 2020).
  25. R Core Team. R: A Language and Environment for Statistical Computing; R Foundation for Statistical Computing: Vienna, Austria, 2020; Available online: https://www.R-project.org/ (accessed on 3 January 2020).
  26. Skamarock, W.C.; Klemp, J.B.; Dudhia, J.; Gill, D.O.; Barker, D.M.; Wang, W.; Powers, J.G. A description of the Advanced Research WRF Version 3. NCAR Tech. Note 2008, 475, 113. [Google Scholar]
  27. US EPA Office of Research and Development. CMAQv5.0.2 (5.0.2). Zenodo. Available online: https://zenodo.org/record/1079898 (accessed on 13 June 2017).
  28. Gong, P.; Liu, H.; Zhang, M.; Li, C.; Wang, J.; Huang, H.; Clinton, N.; Ji, L.; Li, W.; Bai, Y.; et al. Stable classification with limited sample: Transferring a 30-m resolution sample set collected in 2015 to mapping 10-m resolution global land cover in 2017. Sci. Bull. 2019, 64, 370–373. [Google Scholar] [CrossRef]
  29. Zhou, Z.H.; Tan, Q.W.; Deng, Y.; Song, D.L.; Wu, K.Y.; Zhou, X.L.; Huang, F.X.; Zeng, W.H.; Lu, C.W. Compilation of emission inventory and source profile database for volatile organic compounds: A case study for Sichuan, China. Atmos. Pollut. Res. 2020, 11, 105–116. [Google Scholar] [CrossRef]
  30. Zhou, Z.H.; Tan, Q.W.; Deng, Y.; Wu, K.Y.; Yang, X.Y.; Zhou, X.L. Emission inventory of anthropogenic air pollutant sources and characteristics of VOCs species in Sichuan Province, China. J. Atmos. Chem. 2019, 76, 21–58. [Google Scholar] [CrossRef]
  31. Lu, C.W.; Zhou, Z.H.; Liu, H.F.; Tan, Q.W.; Deng, Y.; Song, D.L.; Kang, X. Emission of biogenic volatile organic compounds in Sichuan Basin using a dynamic model. Environ. Chem. 2018, 37, 836–842. [Google Scholar]
  32. SimpleBIO. Available online: https://github.com/airmonster/SimpleBIO (accessed on 9 May 2017).
  33. MEIC2CMAQ. Available online: https://github.com/airmonster/MEIC2CMAQ (accessed on 28 May 2022).
  34. Sarwar, G.; Simon, H.; Bhave, P.; Yarwood, G. Examining the impact of heterogeneous nitryl chloride production on air quality across the United States. Atmos. Chem. Phys. 2012, 12, 6455–6473. [Google Scholar] [CrossRef] [Green Version]
  35. Li, M.; Liu, H.; Geng, G.; Hong, C.; Liu, F.; Song, Y.; Tong, D.; Zheng, B.; Cui, H.; Man, H.; et al. Anthropogenic emission inventories in China: A review. Natl. Sci. Rev. 2017, 4, 834–866. [Google Scholar] [CrossRef]
  36. Zheng, B.; Tong, D.; Li, M.; Liu, F.; Hong, C.; Geng, G.; Li, H.; Li, X.; Peng, L.; Qi, J.; et al. Trends in China’s anthropogenic emissions since 2010 as the consequence of clean air actions. Atmos. Chem. Phys. 2018, 18, 14095–14111. [Google Scholar] [CrossRef] [Green Version]
  37. Li, M.; Zhang, Q.; Streets, D.G.; He, K.B.; Cheng, Y.F.; Emmons, L.K.; Huo, H.; Kang, S.C.; Lu, Z.; Shao, M.; et al. Mapping Asian anthropogenic emissions of non-methane volatile organic compounds to multiple chemical mechanisms. Atmos. Chem. Phys. 2014, 14, 5617–5638. [Google Scholar] [CrossRef] [Green Version]
  38. Li, M.; Zhang, Q.; Zheng, B.; Tong, D.; Lei, Y.; Liu, F.; Hong, C.; Kang, S.; Yan, L.; Zhang, Y.; et al. Persistent growth of anthropogenic non-methane volatile organic compound (NMVOC) emissions in China during 1990–2017: Drivers, speciation and ozone formation potential. Atmos. Chem. Phys. 2019, 19, 8897–8913. [Google Scholar] [CrossRef] [Green Version]
  39. TOChecker. Available online: https://github.com/Chengwei1017/SnowPeakSighting (accessed on 28 May 2022).
  40. doParallel: Foreach Parallel Adaptor for the ‘parallel’ Package. R Package Version 1.0.17. Available online: https://CRAN.R-project.org/package=doParallel (accessed on 28 May 2022).
  41. AkÇay, H.G.; Aksoy, S. Automatic Detection of Geospatial Objects Using Multiple Hierarchical Segmentations. IEEE Trans. Geosci. Remote Sens. 2008, 46, 2097–2111. [Google Scholar] [CrossRef]
  42. Ozel, G.; Cakmakyapan, S. A new approach to the prediction of PM10 concentrations in Central Anatolia Region, Turkey. Atmos. Pollut. Res. 2015, 6, 735–741. [Google Scholar] [CrossRef]
  43. Gilewski, P. Application of Global Environmental Multiscale (GEM) Numerical Weather Prediction (NWP) Model for Hydrological Modeling in Mountainous Environment. Atmosphere 2022, 13, 1348. [Google Scholar] [CrossRef]
  44. Gupta, H.V.; Kling, H.; Yilmaz, K.K.; Martinez, G.F. Decomposition of the mean squared error and NSE performance criteria: Implications for improving hydrological modelling. J. Hydrol. 2009, 377, 80–91. [Google Scholar] [CrossRef] [Green Version]
Figure 1. Model domain setup, with a photograph of Yaomei Feng taken in Wenjiang District, Chengdu shown in the dashed red box.
Atmosphere 14 01181 g001
Figure 2. Spatial distribution of air quality and meteorological observing stations.
Atmosphere 14 01181 g002
Figure 3. Example of terrain occlusion judgment. In the right plot, elevation of the red solid line was shown as the black solid line, the green dashed line showed the sight line from observation point to the peak, and the red dashed line showed the first terrain occlusion height.
Atmosphere 14 01181 g003
Figure 4. Correlation coefficients distribution of modeled and observed 10 m wind speed, 2 m temperature, atmospheric pressure, and relative humidity for 13 national observation stations.
Atmosphere 14 01181 g004
Figure 5. Correlation coefficient distribution of modeled and observed NO2, O3, PM2.5, and PM10 for 35 municipal and national environmental monitoring stations.
Atmosphere 14 01181 g005
Figure 6. Spatial distribution of terrain occlusion rates.
Atmosphere 14 01181 g006
Figure 7. Annual spatial distribution of snow peak sighting probability.
Atmosphere 14 01181 g007
Figure 8. Monthly spatial distribution of snow peak sighting probability.
Atmosphere 14 01181 g008
Figure 9. Comparisons of modeled and posted snow peak sighting days in months.
Atmosphere 14 01181 g009
Figure 10. Daily comparison of modeled and posted snow peak sighting.
Atmosphere 14 01181 g010
Table 1. Variable description of threshold method.
Thres.Var.Logical OperationDescription
th_qc_sQCifQC = (QC ≤ th_qc_s)Cloud water mixing ratio along sight line
th_cl_pCFRACifCL = (CFRAC ≤ th_cl_p)Cloud cover over snow peak
th_qv_mQVifQVM = (max(QV) ≤ th_qv_m)Maximum water mixing ratio along sight line
th_qv_aQVifQVA = (mean(QV) ≤ th_qv_a)Averaged water mixing ratio along sight line
th_qv_sQVifQVS = (sum(QV) ≤ th_qv_s)Sum of water mixing ratio along sight line
th_pm_lPM25ifPM = (PM25 ≤ th_pm_l)PM2.5 concentration of observation site
th_pm_aPM25ifPMA = (mean(PM25) ≤ th_pm_a)Averaged PM2.5 concentration along sight line
th_pm_mPM25ifPMM = (max(PM25) ≤ th_pm_m)Maximum PM2.5 concentration along sight line
th_rs_pRSifRS = (RS ≥ th_rs_p)Minimum of ground solar radiation
Table 2. Classification of model results.
Forecasted TrueForecasted False
Posted TrueTrue positive (TP)False negative (FN)
Posted FalseFalse positive (FP)True negative (TN)
Table 3. Statistical comparison of simulated and observed 2 m temperature (T2), atmospheric pressure (PRES), 10 m wind speed (WS), and relative humidity (RH) of 13 stations.
VariableModeledObservedNNMBRMSER
T217.116.535,4433.66%2.060.96
PRES953.9952.735,4470.12%2.480.98
WS1.91.434,31441.56%1.350.25
RH72.880.535,442−9.60%17.260.57
Table 4. Statistical comparison of simulated and observed PM2.5, PM10, NO2, and O3 of the average of seven national stations.
VariableModeledObservedNNMBRMSER
PM2.530.040.32426−25.54%26.750.57
PM1042.159.72426−29.49%40.680.50
NO235.037.02426−5.56%22.060.31
O345.245.124260.32%29.660.70
Table 5. Threshold values for different variables for snow peak sighting determination.
Thres.ValueThres.Value
th_qc_s0.36th_pm_l95.85
th_cl_p96.47th_pm_a10.30
th_qv_m17.74th_pm_m72.34
th_qv_a13.80th_rs_p235.68
th_qv_s463.17
Table 6. Model estimation of snow peak sighting forecast.
Forecasted TrueForecasted False
Posted True2015
Posted False62268
Disclaimer/Publisher’s Note: The statements, opinions and data contained in all publications are solely those of the individual author(s) and contributor(s) and not of MDPI and/or the editor(s). MDPI and/or the editor(s) disclaim responsibility for any injury to people or property resulting from any ideas, methods, instructions or products referred to in the content.

