
Design, Modelling, and Experimental Validation of a Glass U-Tube Mass Sensing Cantilever for Particulate Direct-on-Line Emissions Measurement


Abstract
:1. Introduction
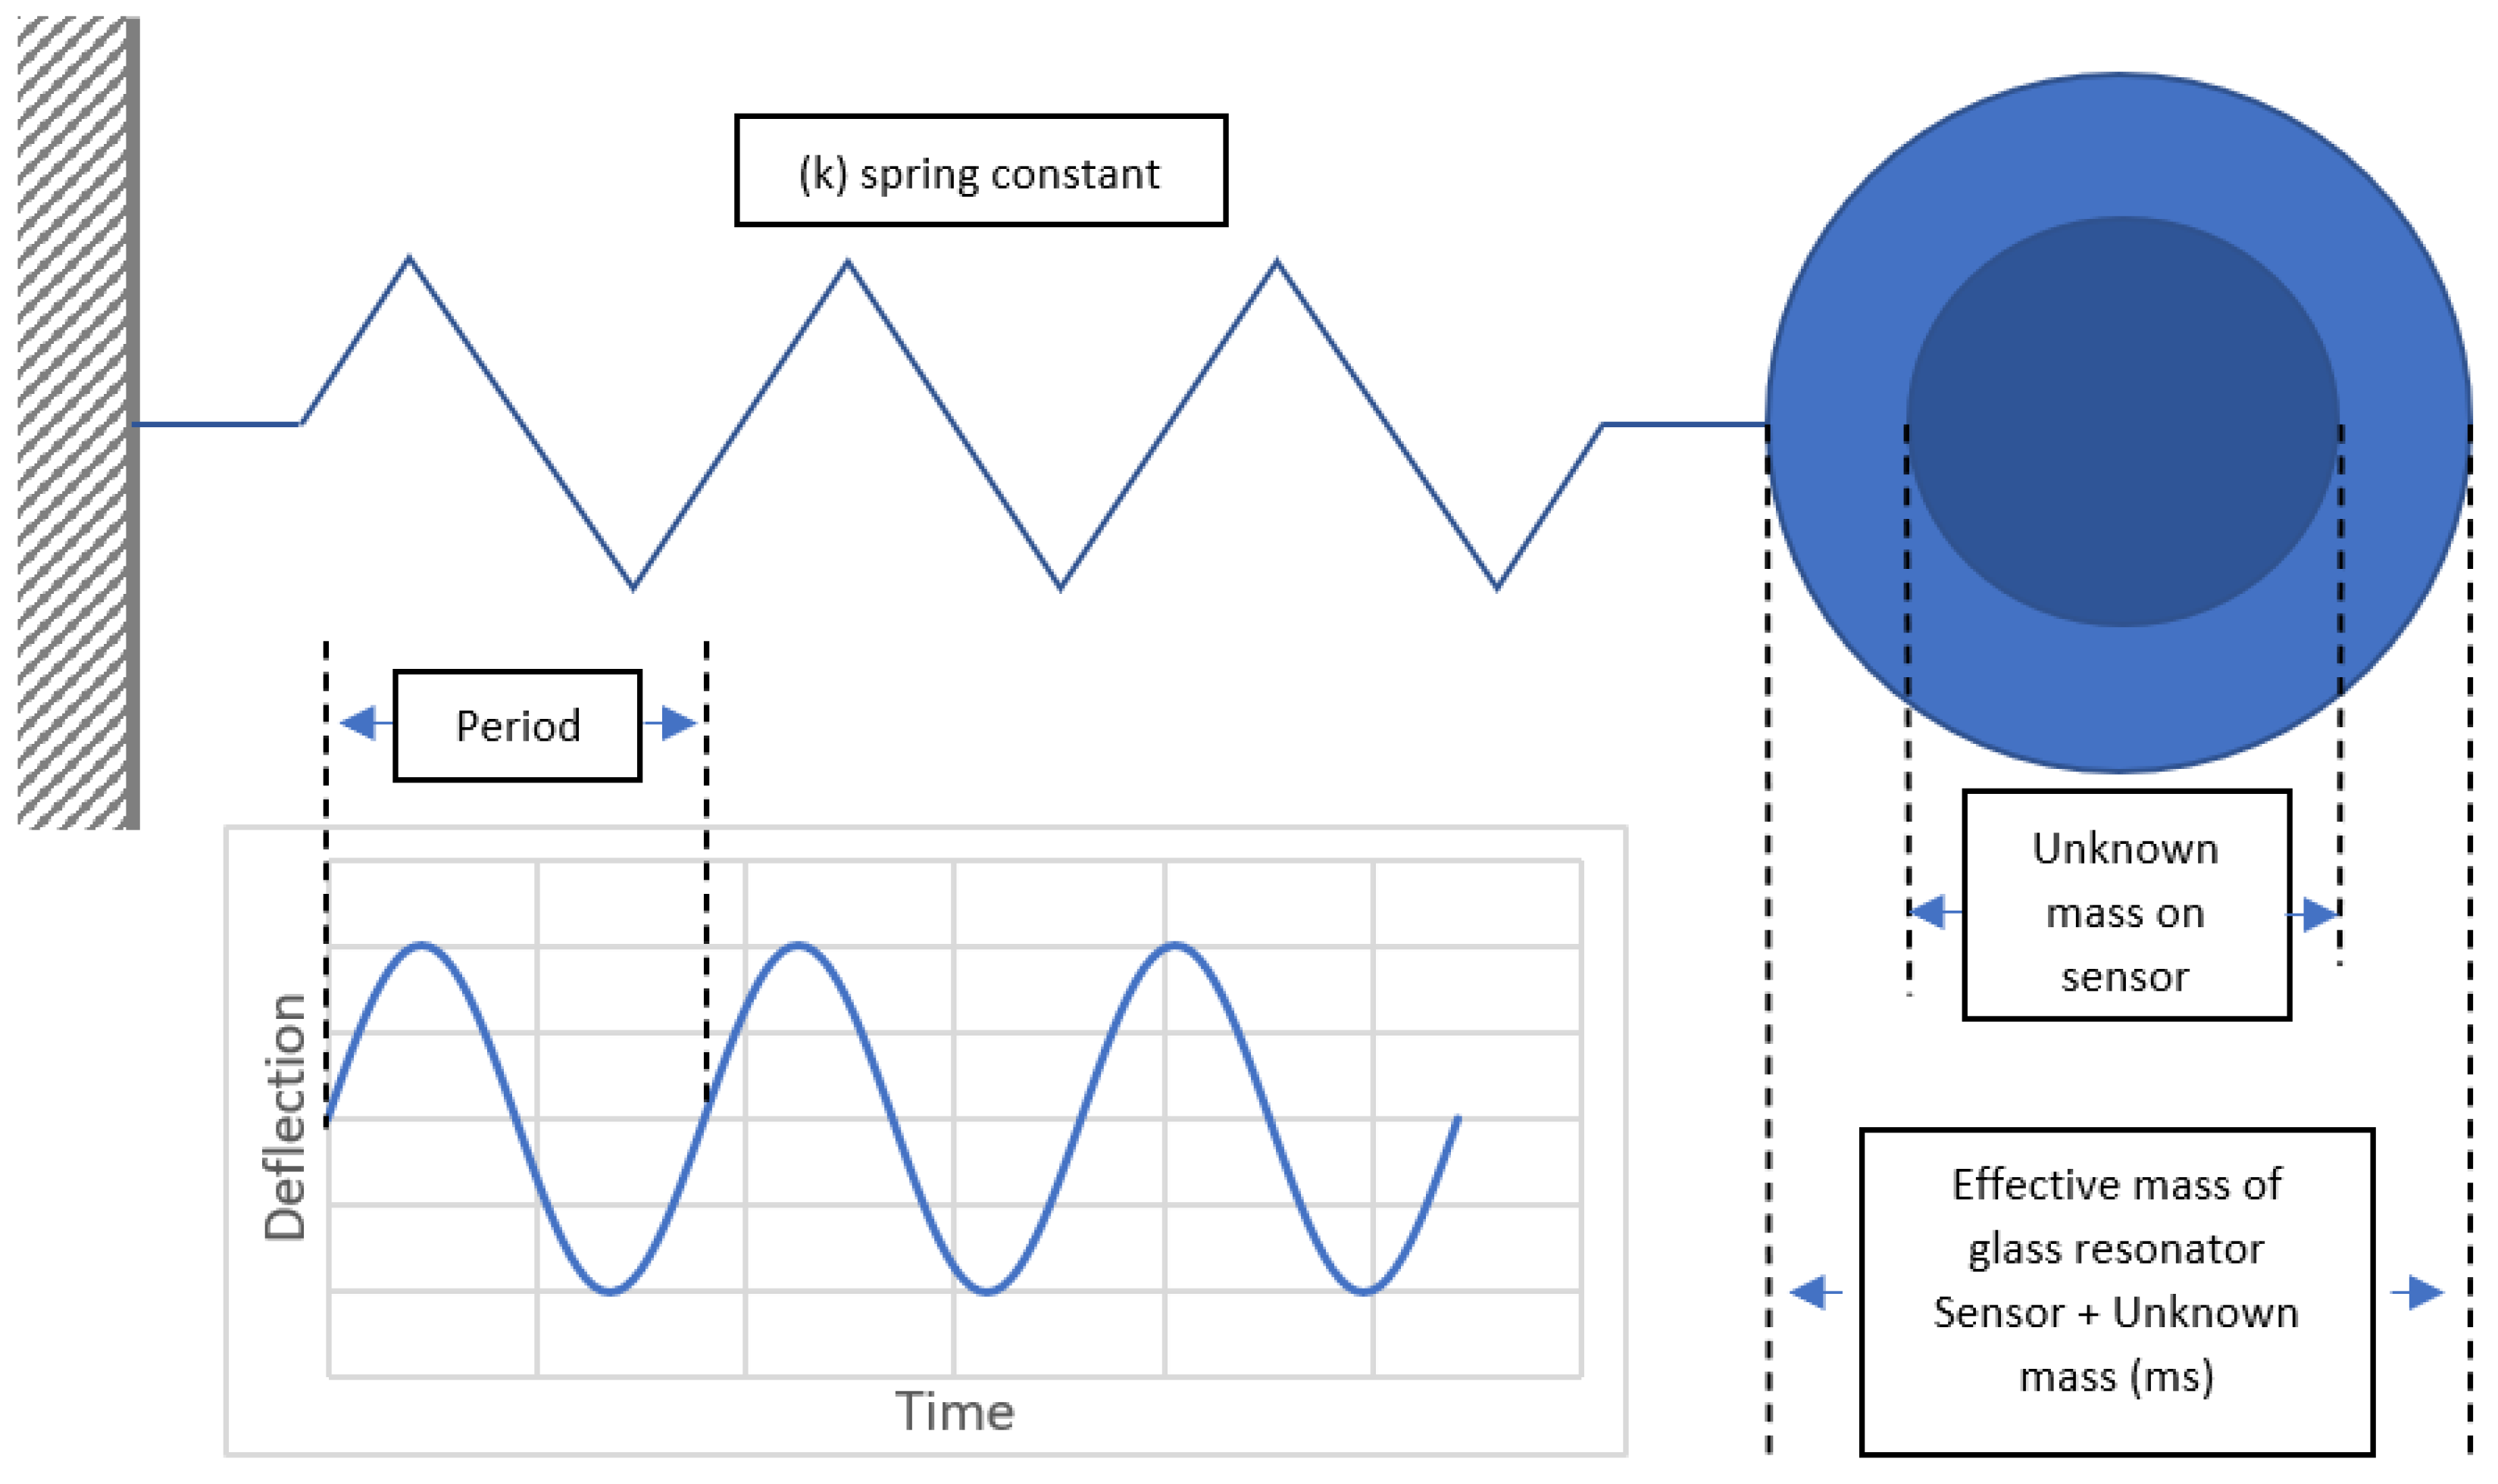
2. Theory
- f = resonant frequency,
- ms = effective mass of the sensor,
- k = spring constant of the sensor.
- = moment of inertia,
- = radius of geometry.
- = bending stiffness,
- = elastic modulus,
- = moment of inertia,
- = length of tube.
- = resonant frequency,
- = elastic modulus,
- = moment of inertia,
- = beam length,
- = uniform load per unit length,
- = gravitational constant.
- = spring constant,
- = Young’s modulus of sensor tube material,
- = total length of sensor tube,
- = external radius of sensor tube,
- = internal radius of sensor tube.
3. Methodology
3.1. Development Methodology
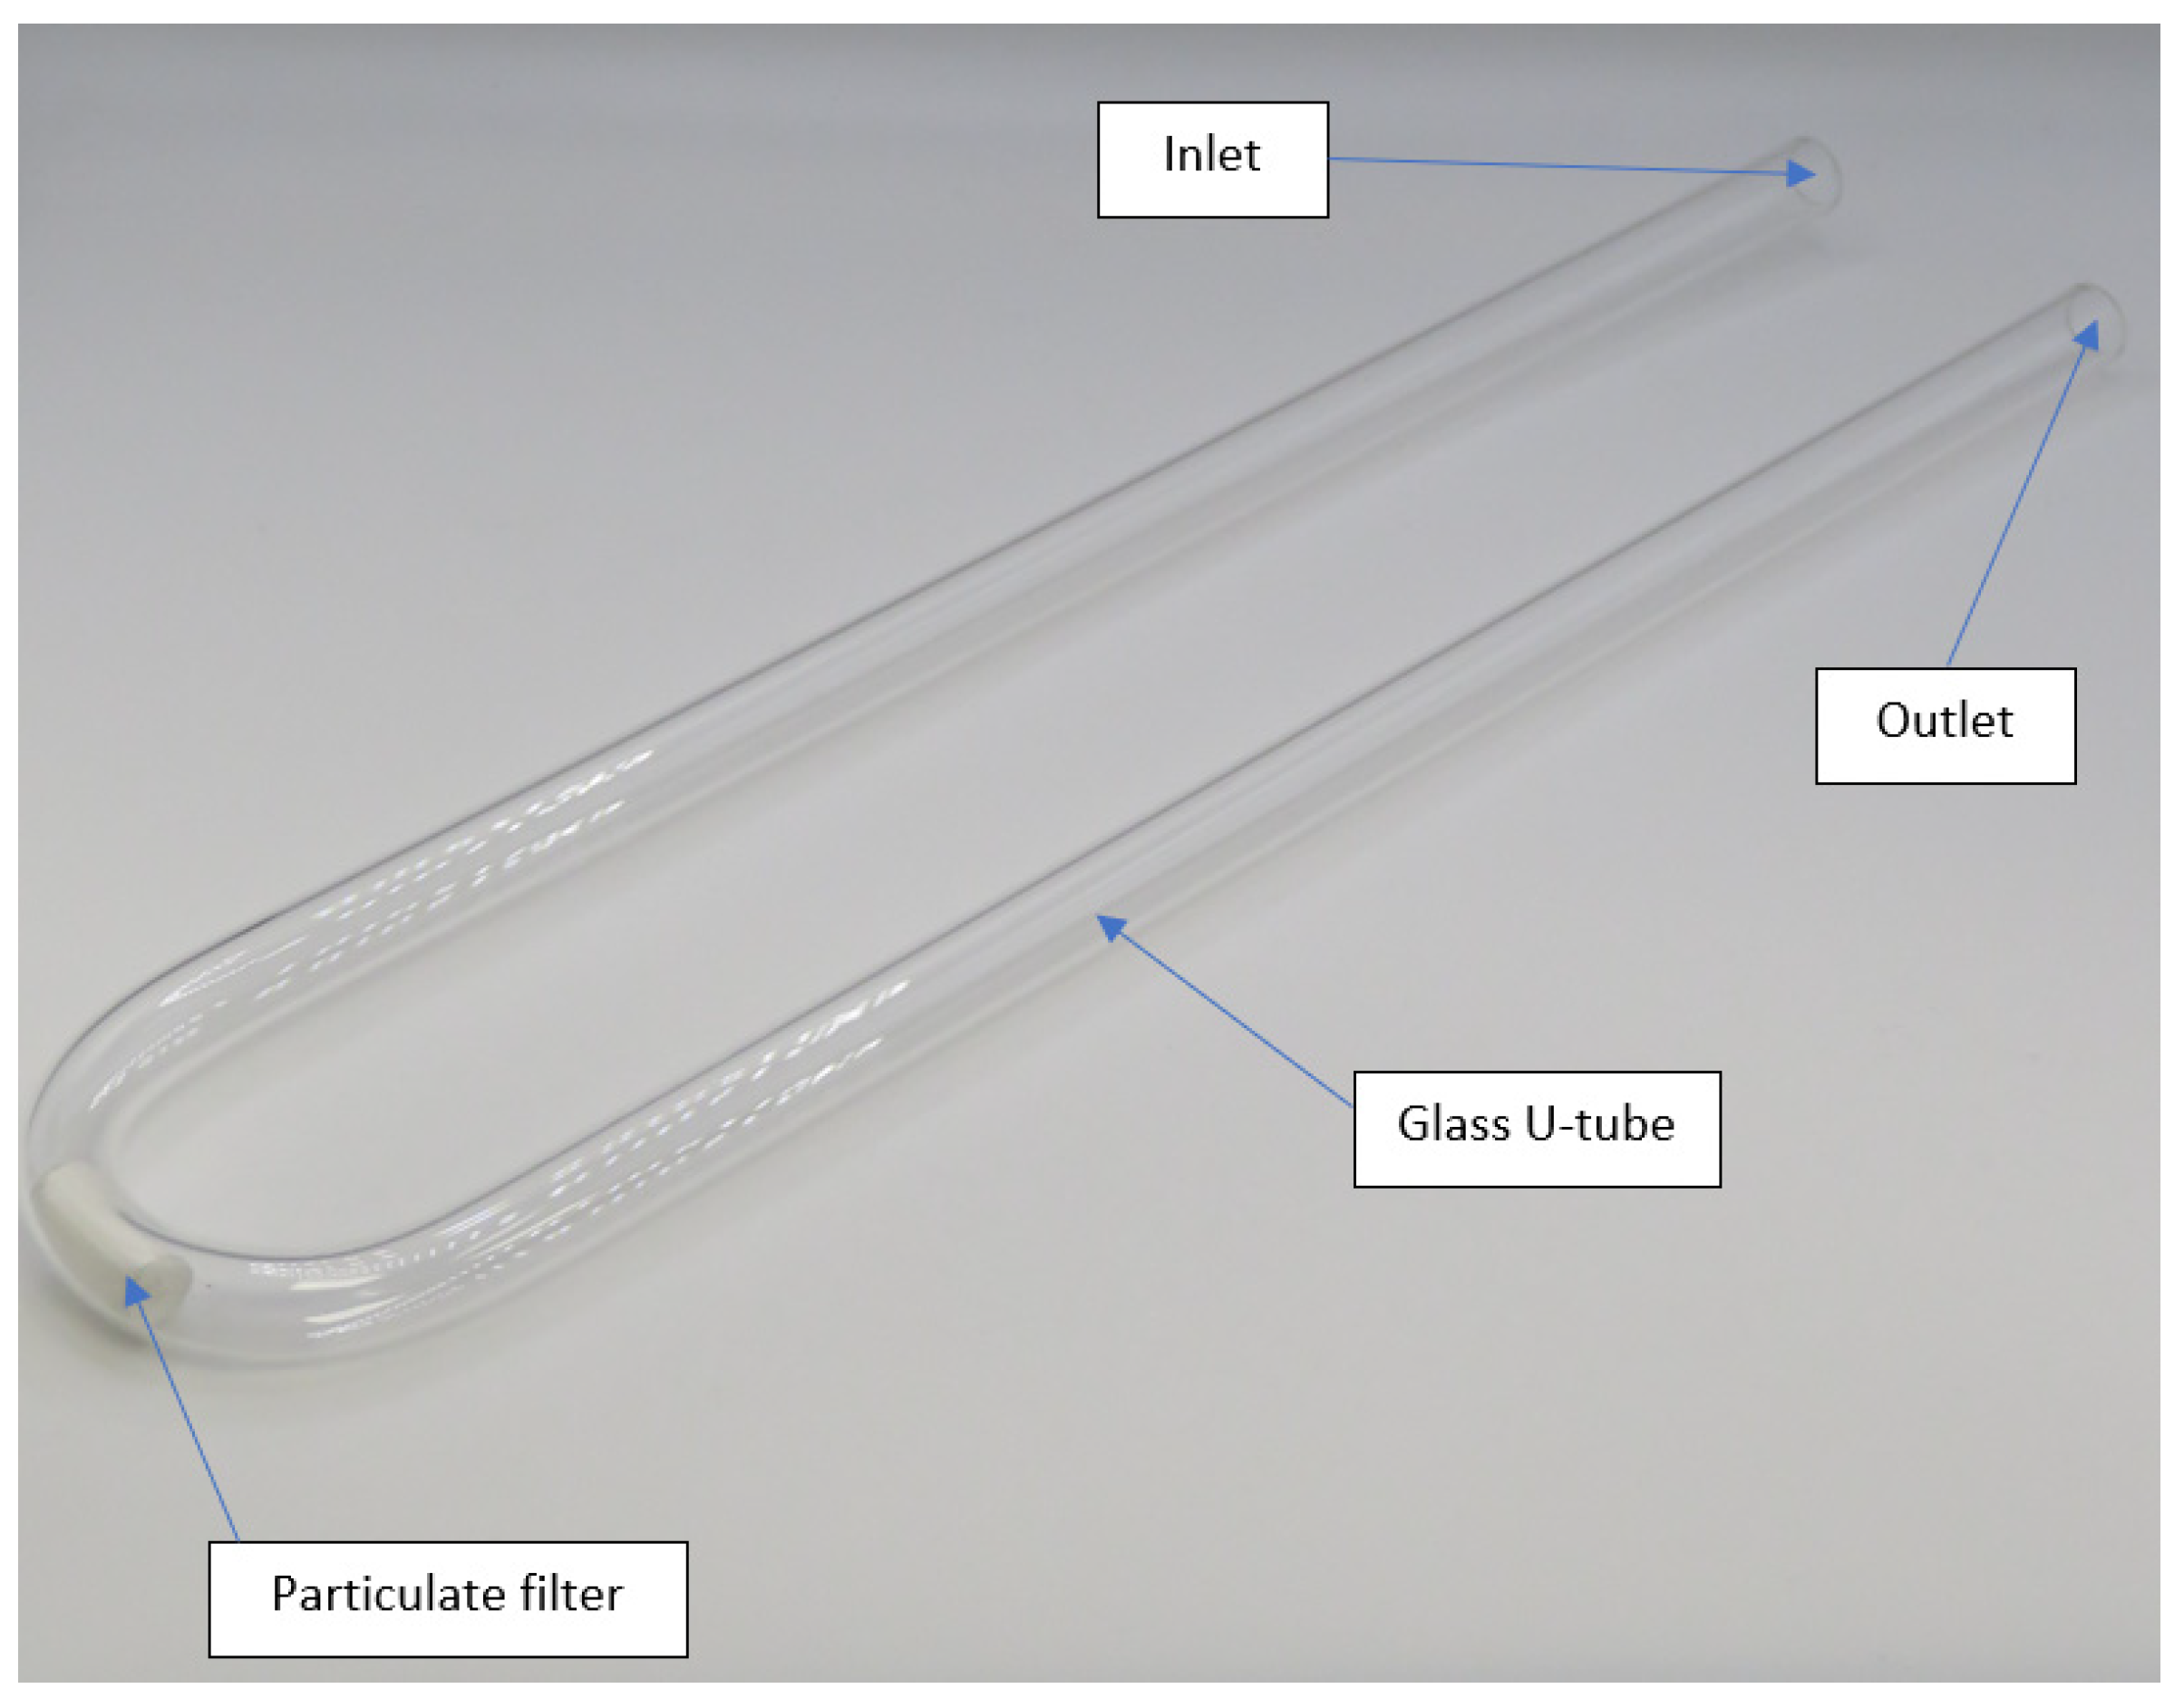
3.2. Experimental Methodology
- The measured internal and external radius of the glass tubes;
- The measured bend radius;
- The climatic chamber temperature;
- The resonant frequency;
- The mass of the tube.
3.3. Application Methodology
3.4. Analysis and Validation Methodology
4. Results and Discussion
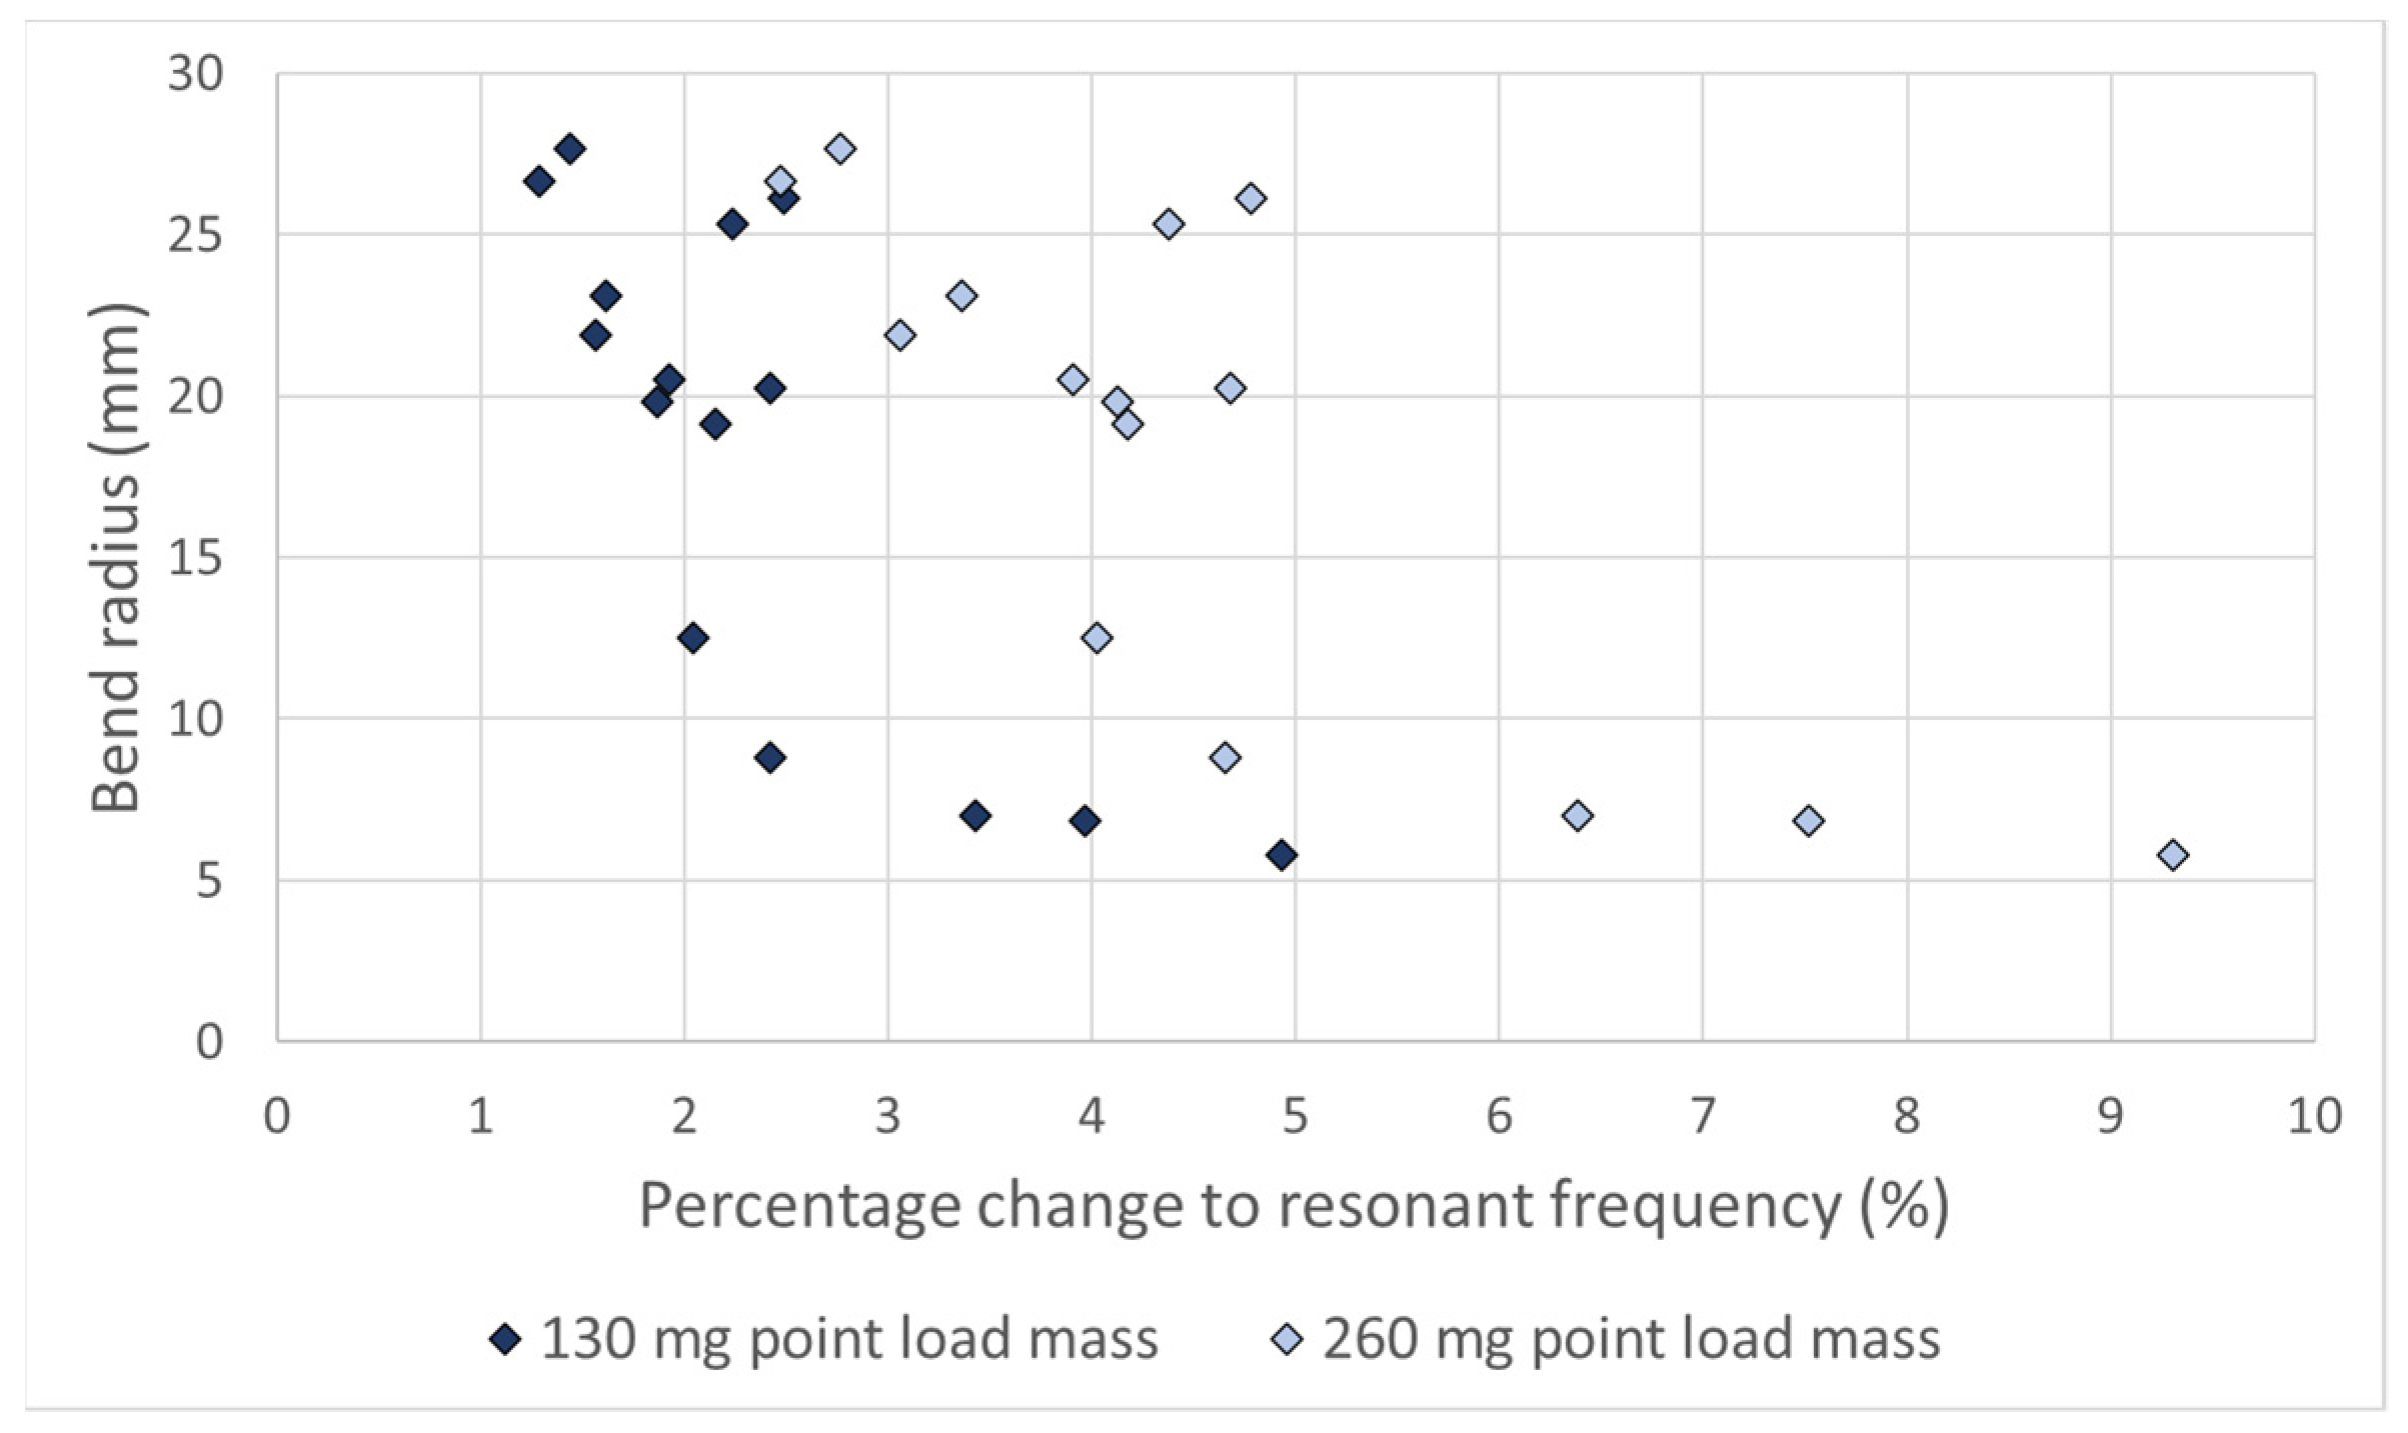
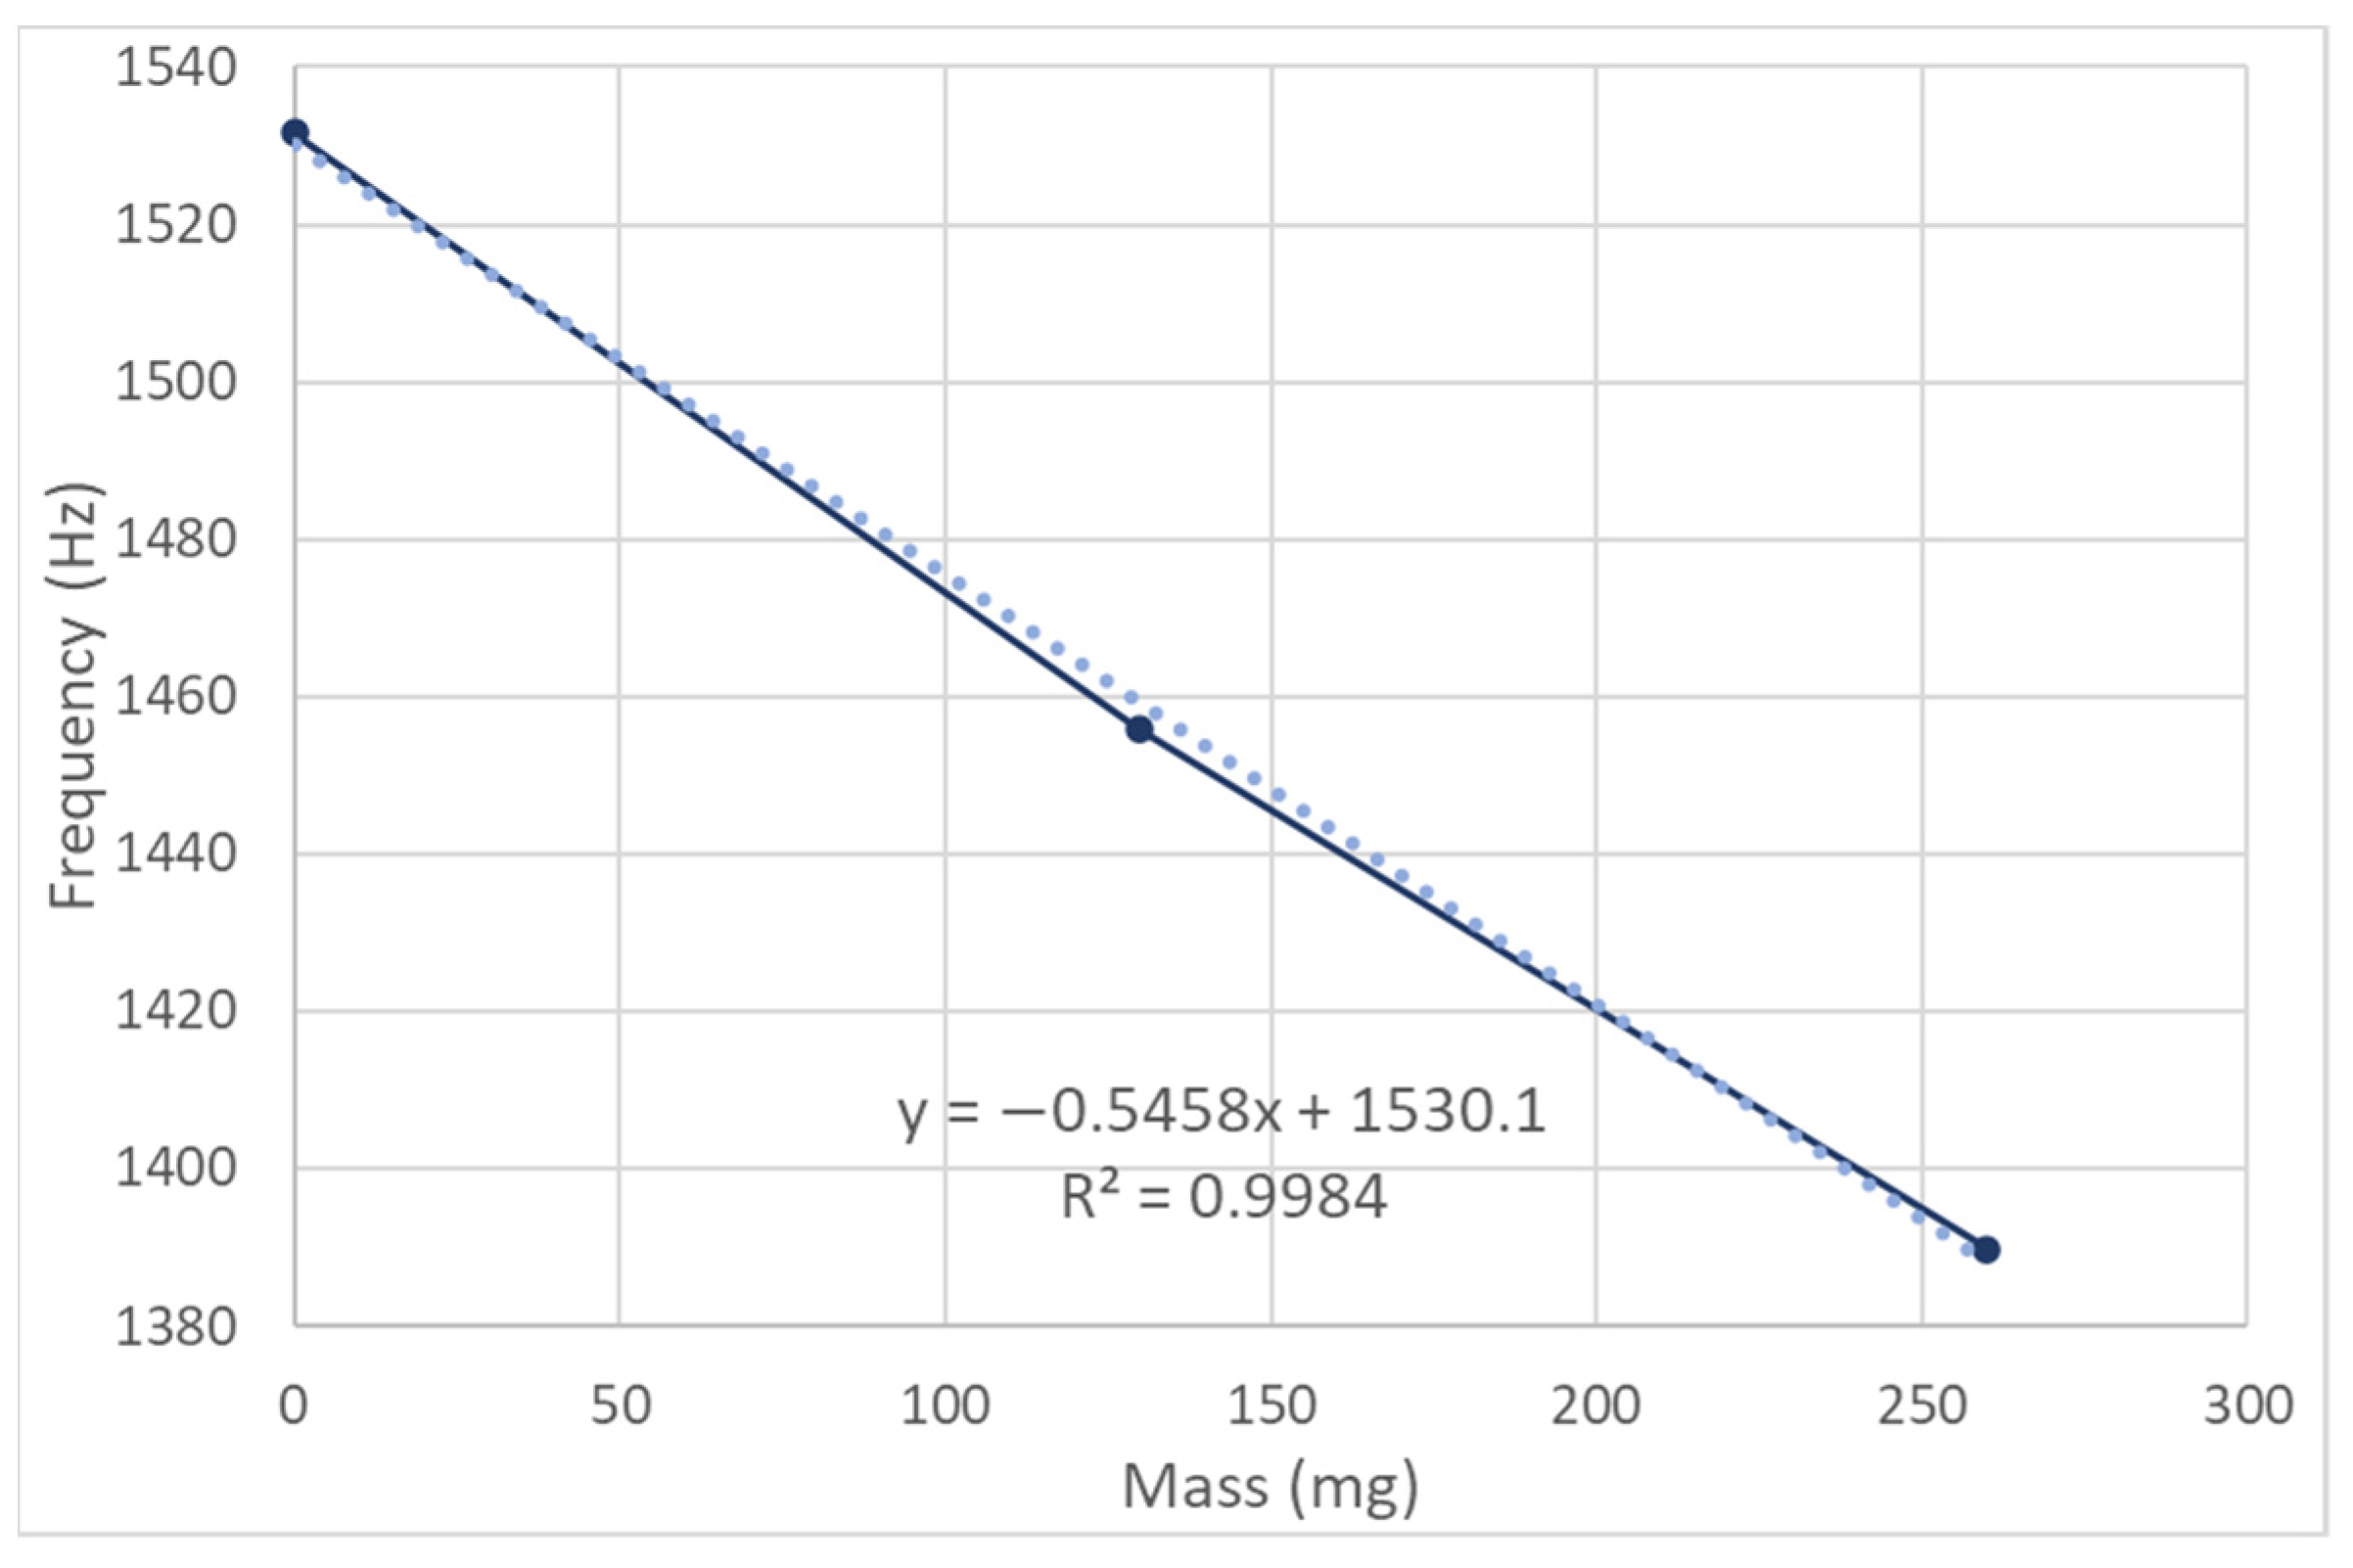
- = change in measured resonant frequency (Hz),
- = change in additional point load mass (mg).
5. Conclusions and Further Works
Author Contributions
Funding
Institutional Review Board Statement
Informed Consent Statement
Data Availability Statement
Acknowledgments
Conflicts of Interest
References
- Webster, J.; Eren, H. Measurement, Instrumentation, and Sensors Handbook; Taylor Francis Group: Abingdon, UK, 2015; ISBN 9781439848890. [Google Scholar]
- Bhakta, H.C.; Lin, J.M.; Grover, W.H. Measuring Dissolution Profiles of Single Controlled-Release Drug Pellets. Sci. Rep. 2020, 10, 19734. [Google Scholar] [CrossRef] [PubMed]
- Lap-Arparat, P.; Tuchinda, K. Computational Study of Excitation Controlling Parameters Effect on Uniform Beam Deformation under Vibration. Int. J. Eng. Trans. C Asp. 2023, 36, 60–70. [Google Scholar] [CrossRef]
- Bryan, A.K.; Goranov, A.; Amon, A.; Manalis, S.R. Measurement of Mass, Density, and Volume during the Cell Cycle of Yeast. Proc. Natl. Acad. Sci. USA 2010, 107, 999–1004. [Google Scholar] [CrossRef]
- Krasser, E.; Senn, H. Simultaneous Measurements at U-Tube Density Sensors in Fundamental and Harmonic Oscillation. In Proceedings of the EUROCON 2007—The International Conference on “Computer as a Tool”, Warsaw, Poland, 9–12 September 2007. [Google Scholar] [CrossRef]
- Outcalt, S.L. Calibration Fluids and Calibration Equations: How Choices May Affect the Results of Density Measurements Made with U-Tube Densimeters. J. Res. Natl. Inst. Stand. Technol. 2018, 123, 1–10. [Google Scholar] [CrossRef] [PubMed]
- BS EN 13284-1: 2017; BSI Standards Publication Stationary Source Emissions–Determination of Low Range Mass Concentration of Dust. BSI Group: London, UK, 2017.
- Pilling, M. Particulate Matter in the United Kingdom; Air Quality Expert Group: Defra, UK, 2018. [Google Scholar]
- Zhang, M.; Song, Y.; Cai, X.; Zhou, J. Economic Assessment of the Health Effects Related to Particulate Matter Pollution in 111 Chinese Cities by Using Economic Burden of Disease Analysis. J. Environ. Manag. 2008, 88, 947–954. [Google Scholar] [CrossRef]
- Nicklin, D.; Gohari Darabkhani, H. Techniques to Measure Particulate Matter Emissions from Stationary Sources: A Critical Technology Review Using Multi Criteria Decision Analysis (MCDA). J. Environ. Manag. 2021, 296, 113167. [Google Scholar] [CrossRef]
- William Averdieck. Envirotech-Online Air Monitoring. Available online: https://www.envirotech-online.com/white-paper/air-monitoring/6/cem/improvements-in-continuous-particulate-emissionmonitoring-as-a-result-of-the-independentnbspverification-schemes-ubatuv-and-mcerts/67 (accessed on 5 December 2022).
- Jahnke, J.A. Continuous Emission Monitoring; Wiley: Hoboken, NJ, USA, 2022; ISBN 9781119433989. [Google Scholar]
- Nathalie, F. Literature Review and Practical Experiences on Continuous Dust Monitoring at Low Concentrations; Laborelec: Linkebeek, Brussels, 2015. [Google Scholar]
- Amaral, S.S.; de Carvalho, J.A.; Costa, M.A.M.; Pinheiro, C. Particulate Matter Emission Factors for Biomass Combustion. Atmosphere 2016, 7, 141. [Google Scholar] [CrossRef]
- Yan, Y. Continuous Measurement of Particulate Emissions. IEEE Instrum. Meas. Mag. 2005, 8, 35–39. [Google Scholar] [CrossRef]
- Fox, H.; Bolton, W. Mathematics for Engineers and Technologists; Butterworth-Heinemann: Oxford, UK, 2002; ISBN 0750655445. [Google Scholar]
- Wilhelm, E.; Letcher, T. Volume Properties: Liquids, Solutions and Vapours; Royal Society of Chemistry: London, UK, 2015; Volume 37, ISBN 9781849738996. [Google Scholar]
- Coĺou, C.M.; Dryden, P.; Harrison, C. A Microfluidic Oscillating Tube Densitometer. Rev. Sci. Instrum. 2009, 80, 105101. [Google Scholar] [CrossRef]
- Oskui, S.M.; Bhakta, H.C.; Diamante, G.; Liu, H.; Schlenk, D.; Grover, W.H. Measuring the Mass, Volume, and Density of Microgram-Sized Objects in Fluid. PLoS ONE 2017, 12, e0174068. [Google Scholar] [CrossRef]
- Lampreia, I.M.S.; De Castro, C.A.N. A New and Reliable Calibration Method for Vibrating Tube Densimeters over Wide Ranges of Temperature and Pressure. J. Chem. Thermodyn. 2011, 43, 537–545. [Google Scholar] [CrossRef]
- Furtado, A.; Batista, E.; Spohr, I.; Filipe, E. Measurement of Density Using Oscillation-Type DENSITY Meters Calibration, Traceability and Uncertainties. In Proceedings of the Conference 14ème Congrès International de Métrologie, Paris, France, 22–25 June 2009; Volume 4. [Google Scholar]
- Paige Presler-Jur, A.; Doraiswamy, P.; Weber, F.X.; Hammond, O.; Greene, L.C.; Jayanty, R.K.M. Performance of a Robotic Weighing System and Quality Practices for Gravimetric Mass Measurements. Aerosol Air Qual. Res. 2016, 16, 2438–2451. [Google Scholar] [CrossRef]
- Rechberger, A.; Amsüss, R.; Rossegger, S.; Breidler, R.; Steiner, G. High Precision Vibration-Type Densitometers Based on Pulsed Excitation Measurements. Sensors 2019, 19, 1627. [Google Scholar] [CrossRef]
- Vielma, T.; Hnedkovsky, L.; Hefter, G. Chemical Speciation Effects on the Volumetric Properties of Aqueous Sulfuric Acid Solutions. J. Chem. Thermodyn. 2021, 158, 106408. [Google Scholar] [CrossRef]
- Ansari, M.Z.; Cho, C. Deflection, Frequency, and Stress Characteristics of Rectangular, Triangular, and Step Profile Microcantilevers for Biosensors. Sensors 2009, 9, 6046–6057. [Google Scholar] [CrossRef]
- Sanmamed, Y.A.; González-Salgado, D.; Troncoso, J.; Romani, L.; Baylaucq, A.; Boned, C. Experimental Methodology for Precise Determination of Density of RTILs as a Function of Temperature and Pressure Using Vibrating Tube Densimeters. J. Chem. Thermodyn. 2010, 42, 553–563. [Google Scholar] [CrossRef]
- ANSYS Inc. ANSYS DesignXplorer User’s Guide; ANSYS Inc.: Canonsburg, PA, USA, 2020; Volume 15317, pp. 1–489. [Google Scholar]
- Tyflopoulos, E.; Steinert, M. Topology and Parametric Optimization-Based Design Processes for Lightweight Structures. Appl. Sci. 2020, 10, 4496. [Google Scholar] [CrossRef]
- Liptak, B.G.; Venczel, K. Instrument Engineers Handbook, 4th ed.; CRC Press: Boca Raton, FL, USA, 2003. [Google Scholar]
- Hermiyanty, D.S.; Wandira, B.A. Process Measurement and Analysis. J. Chem. Inf. Model. 2017, 8, 1–58. [Google Scholar]
- Laznickova, R.; Huemer, H. Investigations on the Limits of Uncertainty of Gas Density Measurements with Vibrating Tube Densimeters. Meas. Sci. Technol. 1998, 9, 719–733. [Google Scholar] [CrossRef]
- Nicklin, D.; Gohari Darabkhani, H. Feasibility of Using Isokinetic Sampling Techniques to Extract a Representative Sample from Processes in the United Kingdom. Atmosphere 2022, 13, 1585. [Google Scholar] [CrossRef]
- Anton Paar Density Meter. Available online: https://www.anton-paar.com/uk-en/products/details/external-measuring-cell-dmatm-hpm (accessed on 14 December 2022).
- Enoksson, P.; Stemme, G.; Stemme, E. Fluid Density Sensor Based on Resonance Vibration. Sens. Actuators A Phys. 1995, 47, 327–331. [Google Scholar] [CrossRef]
- Holcomb, C.D.; Outcalt, S.L. A Theoretically-Based Calibration and Evaluation Procedure for Vibrating-Tube Densimeters. Fluid Phase Equilibria 1998, 150, 815–827. [Google Scholar] [CrossRef]
- ANSYS, Inc. ANSYS Help System ANSYS Mechanical User’s Guide; ANSYS, Inc.: Canonsburg, PA, USA, 2012; Volume 3304, pp. 1–1634. [Google Scholar]
- Kumar, V.; Kumar Singh, K.; Gaurav, S. Analysis of Natural Frequencies for Cantilever Beam with I-and T-Section Using Ansys. Int. Res. J. Eng. Technol. 2015, 2, 1013–1020. [Google Scholar]
- Lengvarský, P.; Bocko, J.; Hagara, M. Modal Analysis of Titan Cantilever Beam Using ANSYS and SolidWorks. Am. J. Mech. Eng. 2013, 1, 271–275. [Google Scholar] [CrossRef]
- Chen, X.; Liu, Y. Finite Element Modeling and Simulation with Ansys Workbench; CRC Press: Boca Raton, FL, USA, 2018; ISBN 9781138486294. [Google Scholar]
- Wong, Y.J.; Hashim, M.S.M.; Shahriman, A.B.; Rahman, A.; Aziz, I.A.; Saad, M.A.M.; Nasirudin, M.A.; Razlan, Z.M.; Kamarrudin, N.S.; Ibrahim, I.; et al. Study on Modal and Harmonic Response Analysis by Modifying Motorcycle Chassis Using Finite Element Method. J. Phys. Conf. Ser. 2021, 2051, 012004. [Google Scholar] [CrossRef]
- Kumar, A.M.U.; Kumar, A. Model Analysis and Harmonic Analysis of Cantilever Beam by ANSYS. Glob. J. Res. Anal. 2014, 1, 51–55. [Google Scholar]
- Kumar, M.; Ifham Uddin, M. Harmonic Analysis of a Cracked Cantilever Beam Using Ansys Workbench. J. Emerg. Technol. Innov. Res. 2018, 5, 633–641. [Google Scholar]
- Mullen, C. A Review of Finite Element Analysis with Respect to Experimental Results. In Proceedings of the 16th LACCEI International Multi-Conference for Engineering, Education, and Technology: “Innovation in Education and Inclusion”, Lima, Peru, 19–21 July 2018. [Google Scholar]
- Mustafazade, A.; Pandit, M.; Zhao, C.; Sobreviela, G.; Du, Z.; Steinmann, P.; Zou, X.; Howe, R.T.; Seshia, A.A. A Vibrating Beam MEMS Accelerometer for Gravity and Seismic Measurements. Sci. Rep. 2020, 10, 10415. [Google Scholar] [CrossRef]
- Ferrand, P. GPScan.VI: A General-Purpose LabVIEW Program for Scanning Imaging or Any Application Requiring Synchronous Analog Voltage Generation and Data Acquisition. Comput. Phys. Commun. 2015, 192, 342–347. [Google Scholar] [CrossRef]
- Ruff, G.S.; Wang, A.Z.; Hunt, W.D. Design and Development of Resonance Frequency Tracking Software Using LabVIEW. J. Young Investig. 2008. Available online: https://www.jyi.org/2008-march/2017/11/12/design-and-development-of-resonance-frequency-tracking-software-using-labview (accessed on 14 December 2022).
- Younes, T.M.; AlKhedher, M.A.; Shgier, K.A.; Taweel, F. Al U-Shape Acoustic Liquid Densitometer. Instrum. Mes. Métrologie 2019, 18, 123–128. [Google Scholar] [CrossRef]
- National Instruments NI X Series. Available online: https://www.ni.com/en-gb/support/documentation/supplemental/09/what-is-ni-x-series-.html (accessed on 2 December 2022).
- Elasy, T.A.; Gaddy, G. Measuring Subjective Outcomes: Rethinking Reliability and Validity. J. Gen. Intern. Med. 1998, 13, 757–761. [Google Scholar] [CrossRef] [PubMed]
- Wang, Y.; Li, J.; Jing, H.; Zhang, Q.; Jiang, J.; Biswas, P. Laboratory Evaluation and Calibration of Three Low-Cost Particle Sensors for Particulate Matter Measurement. Aerosol Sci. Technol. 2015, 49, 1063–1077. [Google Scholar] [CrossRef]
- Sakkampang, K.; Sakkampang, C.; Sakkampang, D. An Experimental Study and Finite Element Analysis of the Parametric of Circular Honeycomb Core. J. Mech. Behav. Mater. 2022, 31, 98–111. [Google Scholar] [CrossRef]
- Webo, W.; Masu, L.M.; Nziu, P.K. Finite Element Analysis and Experimental Approaches of Mono and Hybrid Nanocellulosic Composites under Tensile Test. Mater. Res. Express 2022, 9, 020001. [Google Scholar] [CrossRef]
- del Barrio, E.; Inouzhe, H.; Matrán, C. On Approximate Validation of Models: A Kolmogorov–Smirnov-Based Approach. Test 2020, 29, 938–965. [Google Scholar] [CrossRef]
- Dar, F.H.; Meakin, J.R.; Aspden, R.M. Statistical Methods in Finite Element Analysis. J. Biomech. 2002, 35, 1155–1161. [Google Scholar] [CrossRef]
- Fu, T.; Tang, X.; Cai, Z.; Zuo, Y.; Tang, Y.; Zhao, X. Correlation Research of Phase Angle Variation and Coating Performance by Means of Pearson’s Correlation Coefficient. Prog. Org. Coat. 2020, 139, 105459. [Google Scholar] [CrossRef]
- Doreswamy, H. Linear regression model for knowledge discovery in engineering materials. In Proceedings of the First International Conference on Artificial Intelligence, Soft Computing and Applications, Long Beach, CA, USA, 27–29 September 2011; pp. 147–156. [Google Scholar]
- US Food and Drug Administration, Regulatory Information, ICH Guidance for Industry Q2B Validation of Analytical Procedures: Methodology. Available online: https://www.fda.gov/regulatory-information/search-fda-guidance-documents/q2b-validation-analytical-procedures-methodology (accessed on 5 January 2023).


| Tube Size, External Diameter (mm) | P1—Length (mm) | P2—Radius (mm) | Resonant Frequency (Hz) |
|---|---|---|---|
| 10 | 50.01 | 13.00 | 1921.62 |
| 61.35 | 22.88 | 993.42 | |
| 78.48 | 22.40 | 740.35 | |
| 9 | 50.01 | 9.00 | 2037.13 |
| 61.38 | 18.85 | 1004.87 | |
| 78.46 | 18.72 | 732.52 | |
| 8 | 50.01 | 7.00 | 1972.42 |
| 61.38 | 16.88 | 945.45 | |
| 78.64 | 16.21 | 687.52 | |
| 7 | 50.01 | 7.00 | 1710.11 |
| 61.31 | 17.00 | 816.05 | |
| 78.57 | 16.41 | 591.96 | |
| 6 | 50.01 | 6.00 | 1513.31 |
| 61.38 | 15.88 | 725.27 | |
| 78.31 | 15.16 | 543.85 |
Disclaimer/Publisher’s Note: The statements, opinions and data contained in all publications are solely those of the individual author(s) and contributor(s) and not of MDPI and/or the editor(s). MDPI and/or the editor(s) disclaim responsibility for any injury to people or property resulting from any ideas, methods, instructions or products referred to in the content. |
© 2023 by the authors. Licensee MDPI, Basel, Switzerland. This article is an open access article distributed under the terms and conditions of the Creative Commons Attribution (CC BY) license (https://creativecommons.org/licenses/by/4.0/).
Share and Cite
Nicklin, D.; Gohari Darabkhani, H. Design, Modelling, and Experimental Validation of a Glass U-Tube Mass Sensing Cantilever for Particulate Direct-on-Line Emissions Measurement. Atmosphere 2023, 14, 915. https://doi.org/10.3390/atmos14060915
Nicklin D, Gohari Darabkhani H. Design, Modelling, and Experimental Validation of a Glass U-Tube Mass Sensing Cantilever for Particulate Direct-on-Line Emissions Measurement. Atmosphere. 2023; 14(6):915. https://doi.org/10.3390/atmos14060915
Chicago/Turabian StyleNicklin, Daniel, and Hamidreza Gohari Darabkhani. 2023. "Design, Modelling, and Experimental Validation of a Glass U-Tube Mass Sensing Cantilever for Particulate Direct-on-Line Emissions Measurement" Atmosphere 14, no. 6: 915. https://doi.org/10.3390/atmos14060915